Article

Low-Temperature Rheology and Thermoanalytical Investigation of Lubricating Oils: Comparison of Phase Transition, Viscosity, and Pour Point

1
Nuremberg Institute of Technology, Applied Chemistry, 90489 Nuremberg, Germany
2
Karlsruhe Institute of Technology, Institute of Mechanical Process Engineering and Applied Mechanics, 76131 Karlsruhe, Germany
*
Author to whom correspondence should be addressed.
Lubricants 2021, 9(10), 99; https://doi.org/10.3390/lubricants9100099
Submission received: 30 August 2021 / Revised: 17 September 2021 / Accepted: 2 October 2021 / Published: 6 October 2021
(This article belongs to the Special Issue Green Tribology: New Insights toward a Sustainable World)

Abstract

:
According to the ASTM D97, the pour point is the temperature below which petroleum products cease to flow. To evaluate the relevance of pour point measurements for synthetic lubricating oils, we investigated the crystallization, melting temperature and low-temperature flow behavior of one mineral and five synthetic lubricating oils. The classification of three groups emerged from this process. The formation of paraffin crystals in mineral oils (I) below the crystallization temperature causes shear-thinning behavior and a yield point. The crystallization temperature determined in the thermal analysis and rheology correlates well with the pour point. Synthetic lubricating oils, which solidify glass-like (II), exhibit a steady viscosity increase with falling temperature. The temperature at which viscosity reaches 1000 Pas corresponds well to the pour point. Synthetic oils, especially esters, with complex crystallization behavior (III), exhibit supercooling depending on the shear rate and cooling conditions. For these lubricating oils, the pour point provides no information for low-temperature applicability.

1. Introduction

The pour point [1] is commonly used to predict lubricating oils’ applicability at low temperatures. The pour point is defined as the lowest temperature at which a base oil still flows. It is determined by examining the meniscus of the base oil in 3 K temperature intervals while tilting the sample vessel. According to the ASTM D97, the pour point is reached if the naked eye sees no motion of the oil. The pour point has been designed for petroleum products that form paraffinic crystals when dropping below the pour point [1]. Webber [2] stated that the formation of wax crystals at low temperatures in mineral oils causes a substantial increase in viscosity and leads to highly non-Newtonian flow behavior. At temperatures below the onset temperature for wax crystallization Tc, mineral oils undergo a transition from a homogenous Newtonian fluid to a suspension of crystals exhibiting predominantly elastic behavior with G′ >> G″ and a yield point [3]. The substantial change in the rheological properties result in the pour point.
The solidification of synthetic base oils differs from mineral oils due to their chemical composition. Polyalphaolefins (PAOs) are branched alkanes with a narrow molecular weight distribution compared to mineral oils. Shubkin [4] introduced PAOs for high-performance lubrication and determined the pour point of several PAOs differing in molecular weight and viscosity. With increasing molecular weight and viscosity, the pour point increases from −70 to −20 °C. Tsvetkov [5] stated that PAOs with molecular weights ranging from 453 to 1056 g mol−1 and kinematic viscosities at 100 °C ranging from 5 to 20 mm2 s−1 are Newtonian fluids down to −40 °C and exhibit glass transition at temperatures between −70 and −81 °C. Despite that, they exhibit pour points above −40 °C. Another lubricating oil type for high-performance lubrication are alkylated naphthalenes, introduced by Hourani et al. [6] as well as Hessel and Abramshe [7]. They state that the pour point of naphthalenes rises with increasing substitution and branching [6,7].
Recent environmental concerns encouraged a biodegradable lubricants’ market launch, such as vegetable oils and their derivatives [8]. Special attention was paid on esters with complex crystallization behavior, depending on their alkyl chains’ length and branching. While branched alkyl chains cause amorphous solidification at lower temperatures, long linear alkyl chains cause crystallization at higher temperatures. Since low-temperature viscosity has a decisive influence on nucleation and crystal growth, the crystallization behavior is complex [9,10,11].
From the thermodynamic point of view, nucleation is spontaneous when the size of a nucleus corresponds to a critical size, which decreases with increasing supercooling (ΔT = TcTm). From the kinetic point of view, the rate of nucleus formation depends on viscosity, i.e., the lower the temperature, the slower the nucleation rate. Approaching the glass-transition temperature TG, the nucleation rate then becomes infinitely small. Thus, nucleation is thermodynamically favored at lower temperatures and kinetically favored at higher temperatures. Since the temperatures for a maximum nucleation rate and maximum crystal growth rate are not identical, the lubricating oil composition and cooling rate significantly influence supercooling. If the maximum crystal growth rate temperature is below the glass temperature TG, nuclei are absent and glass-like solidification takes place upon cooling [12,13]. Using the pour point as a single criterion to decide on low-temperature applicability disregards the fact that the pour point provides no information on whether base oils crystallize, solidify amorphously, or just exhibit such a high viscosity that no flow is detectable during the three seconds of pour point determination. This study presents the investigations of crystallization, melting, and glass transition of one mineral oil and five synthetic lubricating oils. On that basis, we discuss the physical meaning of the pour point and its significance for the low-temperature flow of lubricating oils.

2. Materials and Methods

Table 1 lists the investigated lubricating oils, their chemical nature and physical properties, including kinematic viscosity ν at 40 and 100 °C, pour point, and viscosity index (VI). The oils are classified into three groups (I–III). Group I contains one mineral oil with a broad molecular weight distribution, group II includes four amorphously solidifying synthetic lubricating oils, and group III comprises one crystallizing synthetic lubricating oil with a narrow molecular weight distribution. The base oils were stored at room temperature (25 °C) and had not been preheated before the experiments.

2.1. Polarization Microscopy

The polarization microscope Nikon Eclipse LV100ND (Shinagawa, Tokyo, Japan) with a Linkam LTS420 cooling cell for liquid nitrogen was used to visualize the crystallization of the base oils. The oil samples were cooled at a rate of −1 K min−1 from room temperature to −50 °C.

2.2. Differential Scanning Calorimetry (DSC)

Heat flow measurements during the cooling and heating cycles were performed with a Netzsch DSC 204 F1 Phoenix® (Selb, Germany) in a pierced aluminum pan with a sample weight of approx. 10 mg to detect the glass transition, crystallization, and melting points of the base oils. The measurements were carried out in the temperature range from 25 to −60 °C with heating and cooling rates of 0.5 to 5 K min−1. For the extended temperature range down to −180 °C, a Netzsch DSC 204 cell with a CC 200L controller for liquid nitrogen was used. The oil samples were cooled with −20 K min−1 from 25 °C to −180 °C, held for 5 min, and then heated with a rate of +10 K min−1.

2.3. Rheological Measurements

Steady shear measurements were done using both a cone-plate (CP50/1) and a concentric cylinder geometry (Z20DIN), and four rheometer devices, the Anton Paar MCR 301, 501, and 702 (Ostfildern-Scharnhausen, Germany) and the Haake RS 150 (Karlsruhe, Germany). The temperature control of the MCR rheometers above −40 °C was realized with a Peltier cooling and heating system (P-PTD 200 and H-PTD-200). Below −40 °C, a CTD 450 cell with an EVU10 controller for liquid nitrogen was used. The Haake RS 150 was tempered with a convection cooling system, including a suitable cryostat. All measuring systems were rinsed with dry air (dew point: −80 °C) to prevent condensation and freezing of humidity. The different measuring geometries and rheometer devices yielded similar viscosity values of the investigated base oils as long as the operating parameters were identical. All rheological and thermoanalytical experiments were performed in triplicate with fresh samples for each measurement.

3. Results and Discussion

3.1. Flow Behavior of Mineral Oil (Group I) at Low Temperatures

Figure 1 covers the viscosity curves of the mineral oil (MO) as a function of shear stress (a) and shear rate (b), respectively, at temperatures between −5 and −15 °C. The base oil samples were brought to the selected measuring temperatures quickly and equilibrated for 10 to 15 min to ensure a constant temperature throughout the sample. MO showed Newtonian behavior down to −5 °C, but at a temperature of −10 °C and below, it showed shear-thinning behavior and exhibited an apparent yield stress. The non-Newtonian flow behavior was attributed to the appearance of paraffin crystals [2].
Figure 2a shows the temperature dependence of the amount of the complex viscosity for the mineral oil as obtained at a fixed frequency of ω = 10 rad s−1 and an amplitude of γ = 0.05 %, selected in order to apply the lowest possible load to the paraffin crystal network while maintaining the measuring range of the rheometer and a reasonable measuring time. The selected parameters for ω and γ were in the LVE range at −20 °C. The change from a Newtonian fluid to a shear-thinning suspension during cooling caused a complex viscosity increase of 5 orders of magnitude within a temperature range of 10 K below the crystallization temperature Tc,rheo = −12 ± 0.5 °C. Melting of the mineral oil (Tm,rheo = −2.5 ± 0.5 °C) appeared at a higher temperature compared to crystallization. Tc,rheo and Tm,rheo in Figure 3 were obtained by intersecting two tangents above and below the significant slope change. During the heating cycle the complex viscosity of the mineral oil decreased substantially between −20 °C and −2.5 °C. Above the melting temperature and below −30 °C, the viscosity data obtained in the cooling and heating cycle match exactly. Considering the change of flow behavior from Newtonian to shear-thinning in Figure 1, Tc,rheo is expected to be in the range between −5 and −10 °C, and not at −12 °C. This discrepancy results from different experimental conditions. The viscosity curves in Figure 1 result from isothermal measurements, while the complex viscosity curves in Figure 2 result from measurements with a constant cooling rate of −2 K min−1. Regardless of the experimental conditions, the melting temperature Tm,rheo was at −2.5 °C. Below the melting temperature, a supercooled liquid was present, which could precipitate paraffin crystals.
The mineral oil’s DSC cooling plot (Figure 2b) shows a sharp exothermic increase of the heat flow signal at −12 °C, corresponding to the crystallization temperature Tc. Towards −50 °C, the DSC signal steadily approached the baseline during the growth of paraffin crystals. The enthalpy of crystallization is −12.4 J g−1. This value is much lower than for pure linear alkanes (−180 to −250 J g−1, depending on carbon number) [15]. This indicates that just a small percentage of the oil crystallized, which is consistent with the microscopy data (Figure 2a) and confirms earlier findings by Webber [2]. The shallow and broad endothermic peak in the DSC’s heating cycle between −30 °C and −2.5 °C in Figure 2b corresponds to the melting of the paraffin crystals. The temperature difference between the onset of the exothermic signal (−12 °C) and the offset of the endothermic peak (−2.5 °C) corresponds to a supercooling of −9.5 K (ΔT = TcTm) at a cooling rate of −2 K min−1.
The temperature at which the substantial increase of the complex viscosity Tc,rheo and the onset of the sharp exothermic signal Tc are observed correlate well. Furthermore, the pour point of −12 °C for this type of oil corresponds to the crystallization temperature (Figure 2, dashed line and Table 1). The mineral oil builds a network of paraffin crystals below the crystallization temperature (Figure 2a inset). The yield stress appearing below the crystallization temperature Tc inhibits the flow at low shear stresses, predominant when tilting the test jar according to the ASTM D97, thus causing the pour point’s detection.
Figure 3 displays steady shear viscosity data as a function of temperature obtained at different cooling rates between −0.167 K min−1 and −1 Kmin−1 with a shear rate of 6 s−1 (a) as well as at different shear rates between 1 s−1 and 100 s−1 at −0.5 K min−1 (b). The crystallization temperature Tc,rheo at which strong viscosity increase set in was slightly shifted to lower values when the cooling rate was increased, here ΔT = 2 K. Tc,rheo, determined at a cooling rate of −1 K min−1, correlated well with the pour point, which was determined with a cooling rate of −1.5 K min−1. The greater the deviation between an applied cooling rate and the cooling rate according to the ASTM D7346, the greater the deviation between Tc,rheo (Figure 3), and the pour point. Higher deviating cooling rates thus provide a poorer match with the pour point.
In agreement with earlier findings, the mineral oil’s crystallization temperature (Tc,rheo = −12 °C) was essentially independent of the shear rate (Figure 3b) [16]. However, the slope of the η(T) curves below Tc,rheo strongly decrease with an increasing shear rate. At a shear rate of 100 s−1 the Tc,rheo can hardly be evaluated, suggesting to employ low shear rates around 1 s−1 for a robust and reliable determination of Tc,rheo.

3.2. Flow Behavior of Non-Crystallizing Synthetic Lubricating Oils (Group II) at Low Temperatures

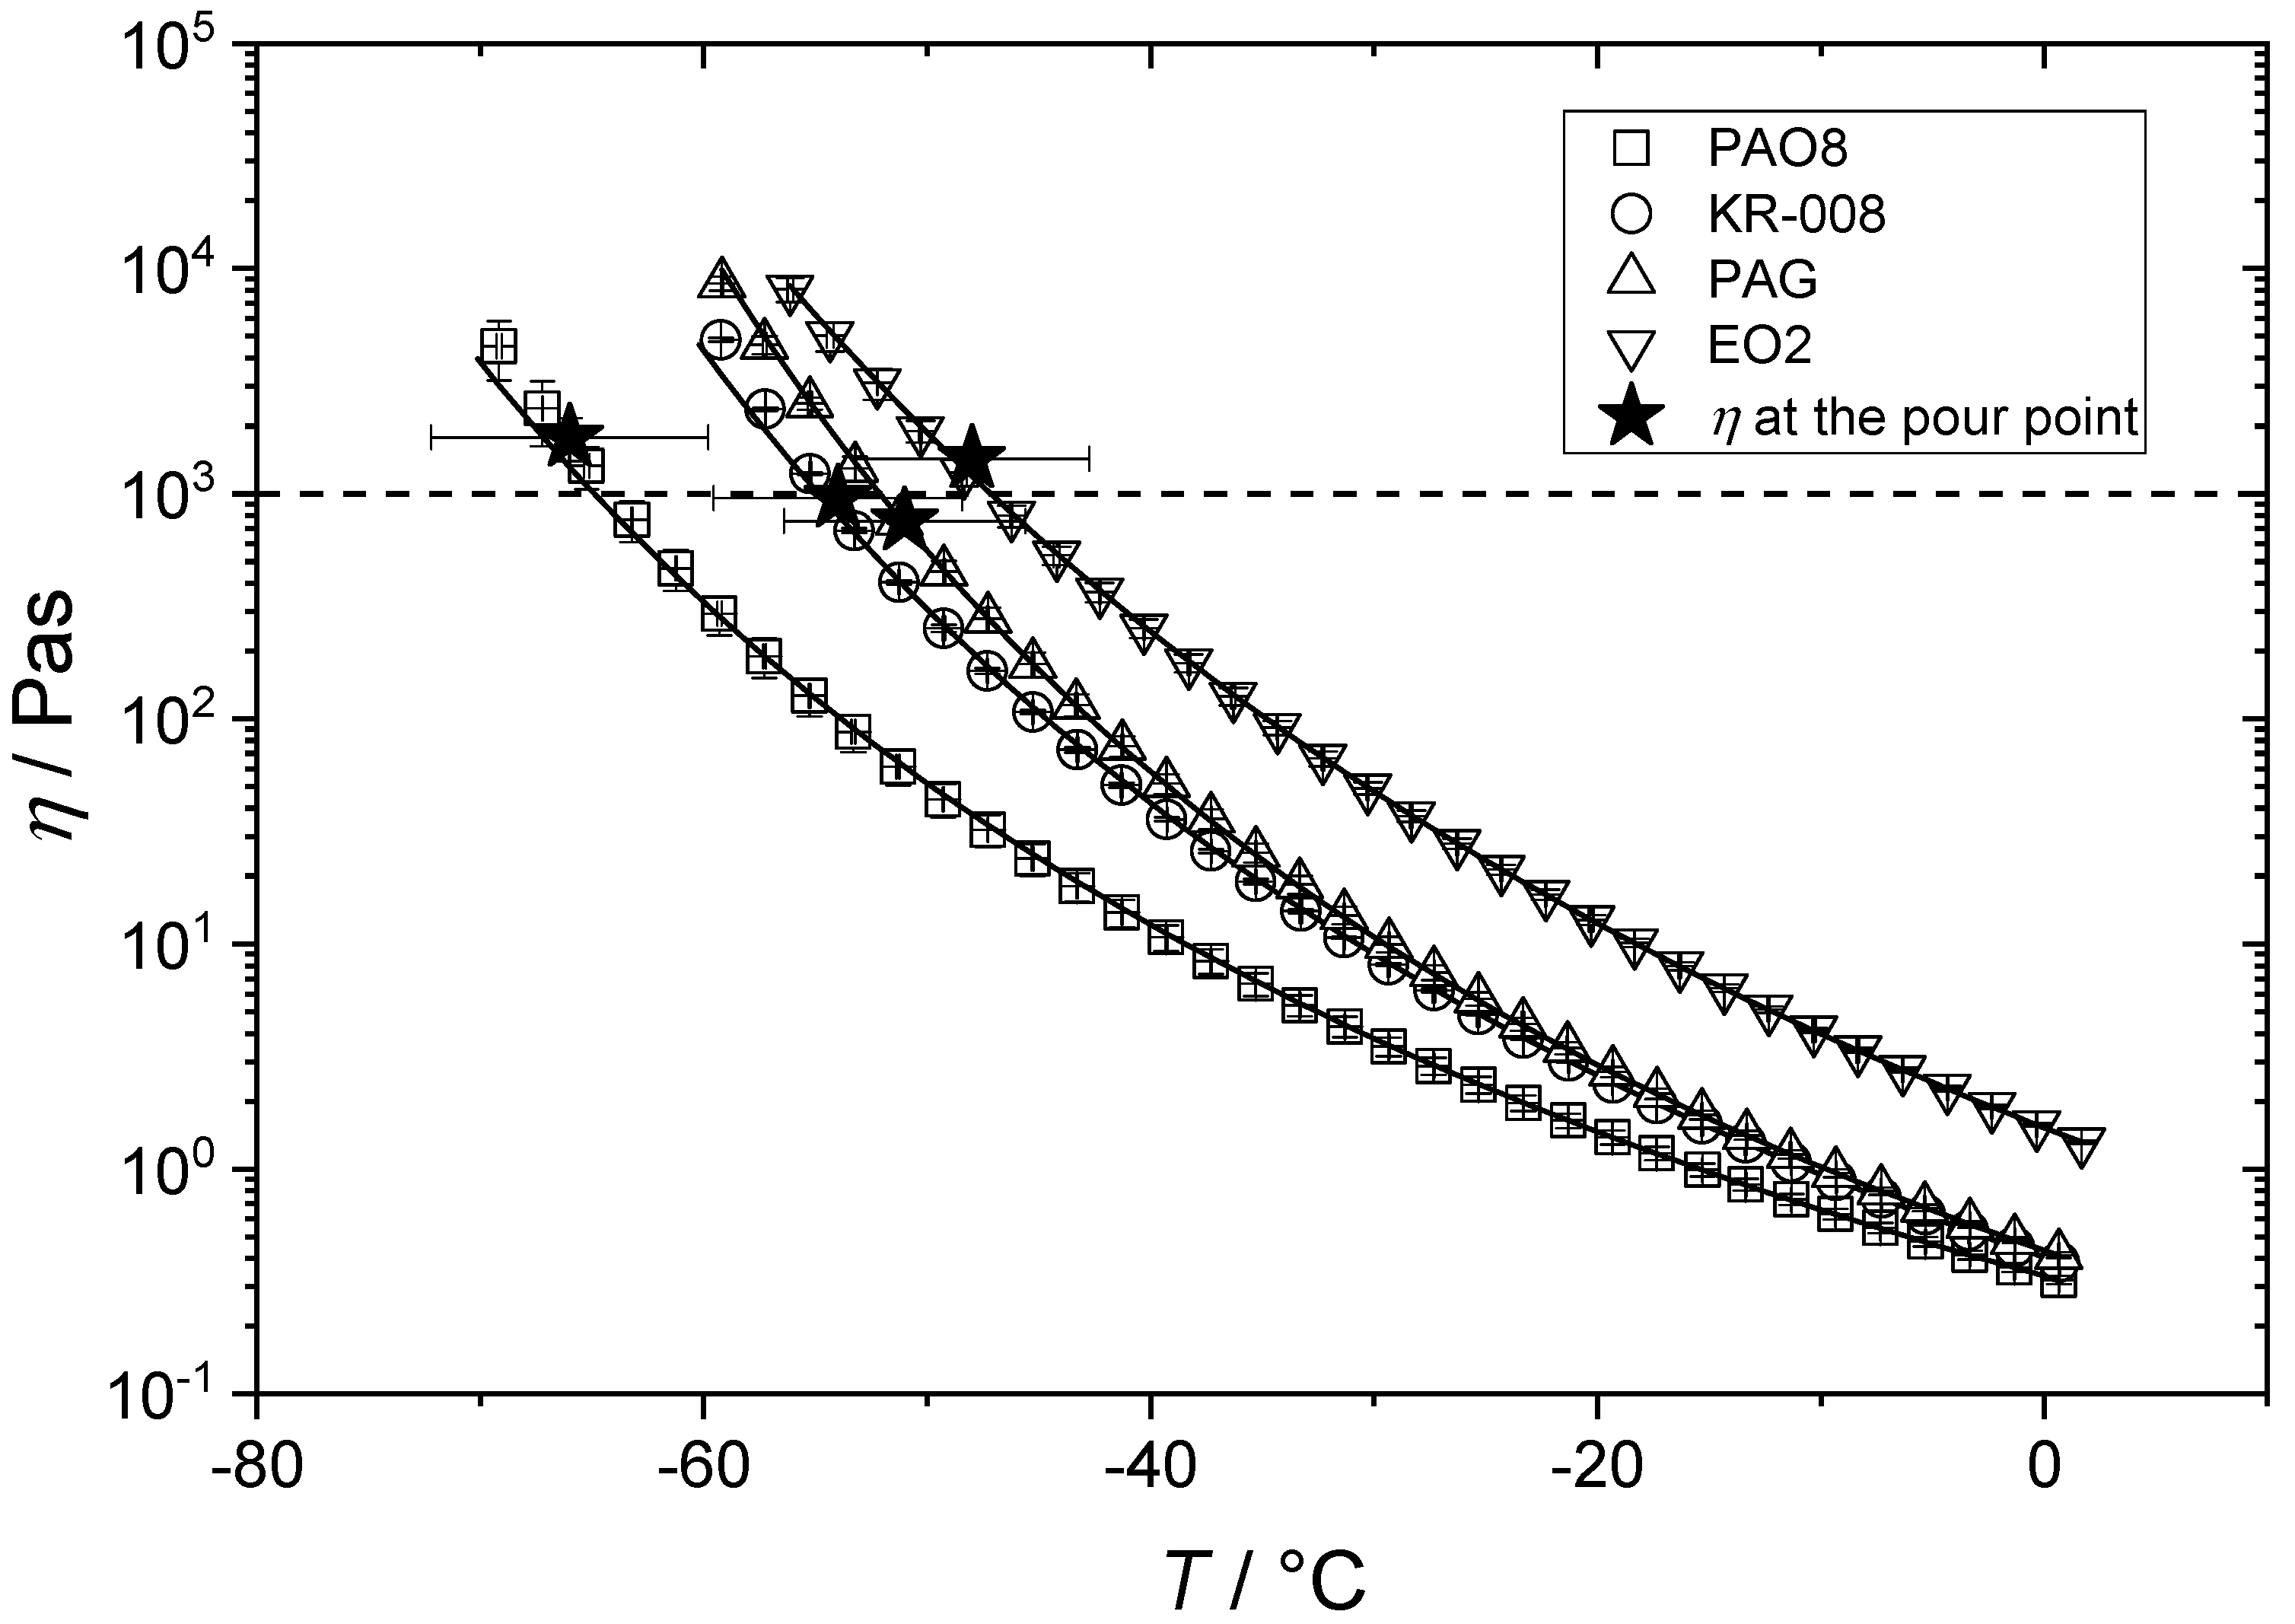
The synthetic lubricating oils PAO8, KR-008, PAG, and EO2 exhibited Newtonian flow behavior in the investigated temperature range. These oils did not exhibit crystallization detectable in DSC or viscosity measurements during cooling. However, they showed a glass transition at temperatures around −75 °C to −85 °C, i.e., 20–30 K below the pour point. The viscosity increased non-linearly with decreasing temperature. The Williams–Landel–Ferry (WLF)-relation [17]:
a T = η T η T 0 = exp [ c 1 ( T T 0 ) c 2 + ( T T 0 ) ]
describes this behavior down to approx. 20 K above the glass transition (see Figure 4). Table 2 presents the c-parameters obtained for the non-crystallizing oils from fitting Equation (1) to the respective experimental data using T0 = 273.15 K. Data for the glass transition temperatures, pour point, and temperature at which a viscosity of 1000 Pas is reached are also included. The viscosity of the cooling and heating curves overlay precisely.
The pour points of the non-crystallizing oils fairly well correspond to the temperature at which a viscosity of 103 Pas is achieved (Table 2 and Figure 4, stars). The difference between the pour point according to ASTM D7346 and the temperature at which a viscosity of 103 Pas is reached is about 1 K (see Table 2). Boyde [18] previously suggested a viscosity value as a theoretical pour point, several magnitudes higher than presented here.
According to ASTM D 7346 [14], the pour points’ reproducibility is approximately 6 K. In a temperature range of 12 K the viscosities vary by more than an order of magnitude. Within the reproducibility range of the pour point, PAOs’ viscosity varies between 360 Pas and 6400 Pas, and the viscosity of PAG varies between 175 and 3600 Pas. Accordingly, the characteristic temperature at which a defined viscosity level of, e.g., 1000 Pas is reached is a more accurate and reliable measure to characterize the low-temperature flow behavior of non-crystallizing oils than the pour point determination, due to the superior experimental accuracy of viscosity measurements.

3.3. Flow Behavior of Crystallizing Synthetic Lubricating Oils (Group III) at Low Temperatures

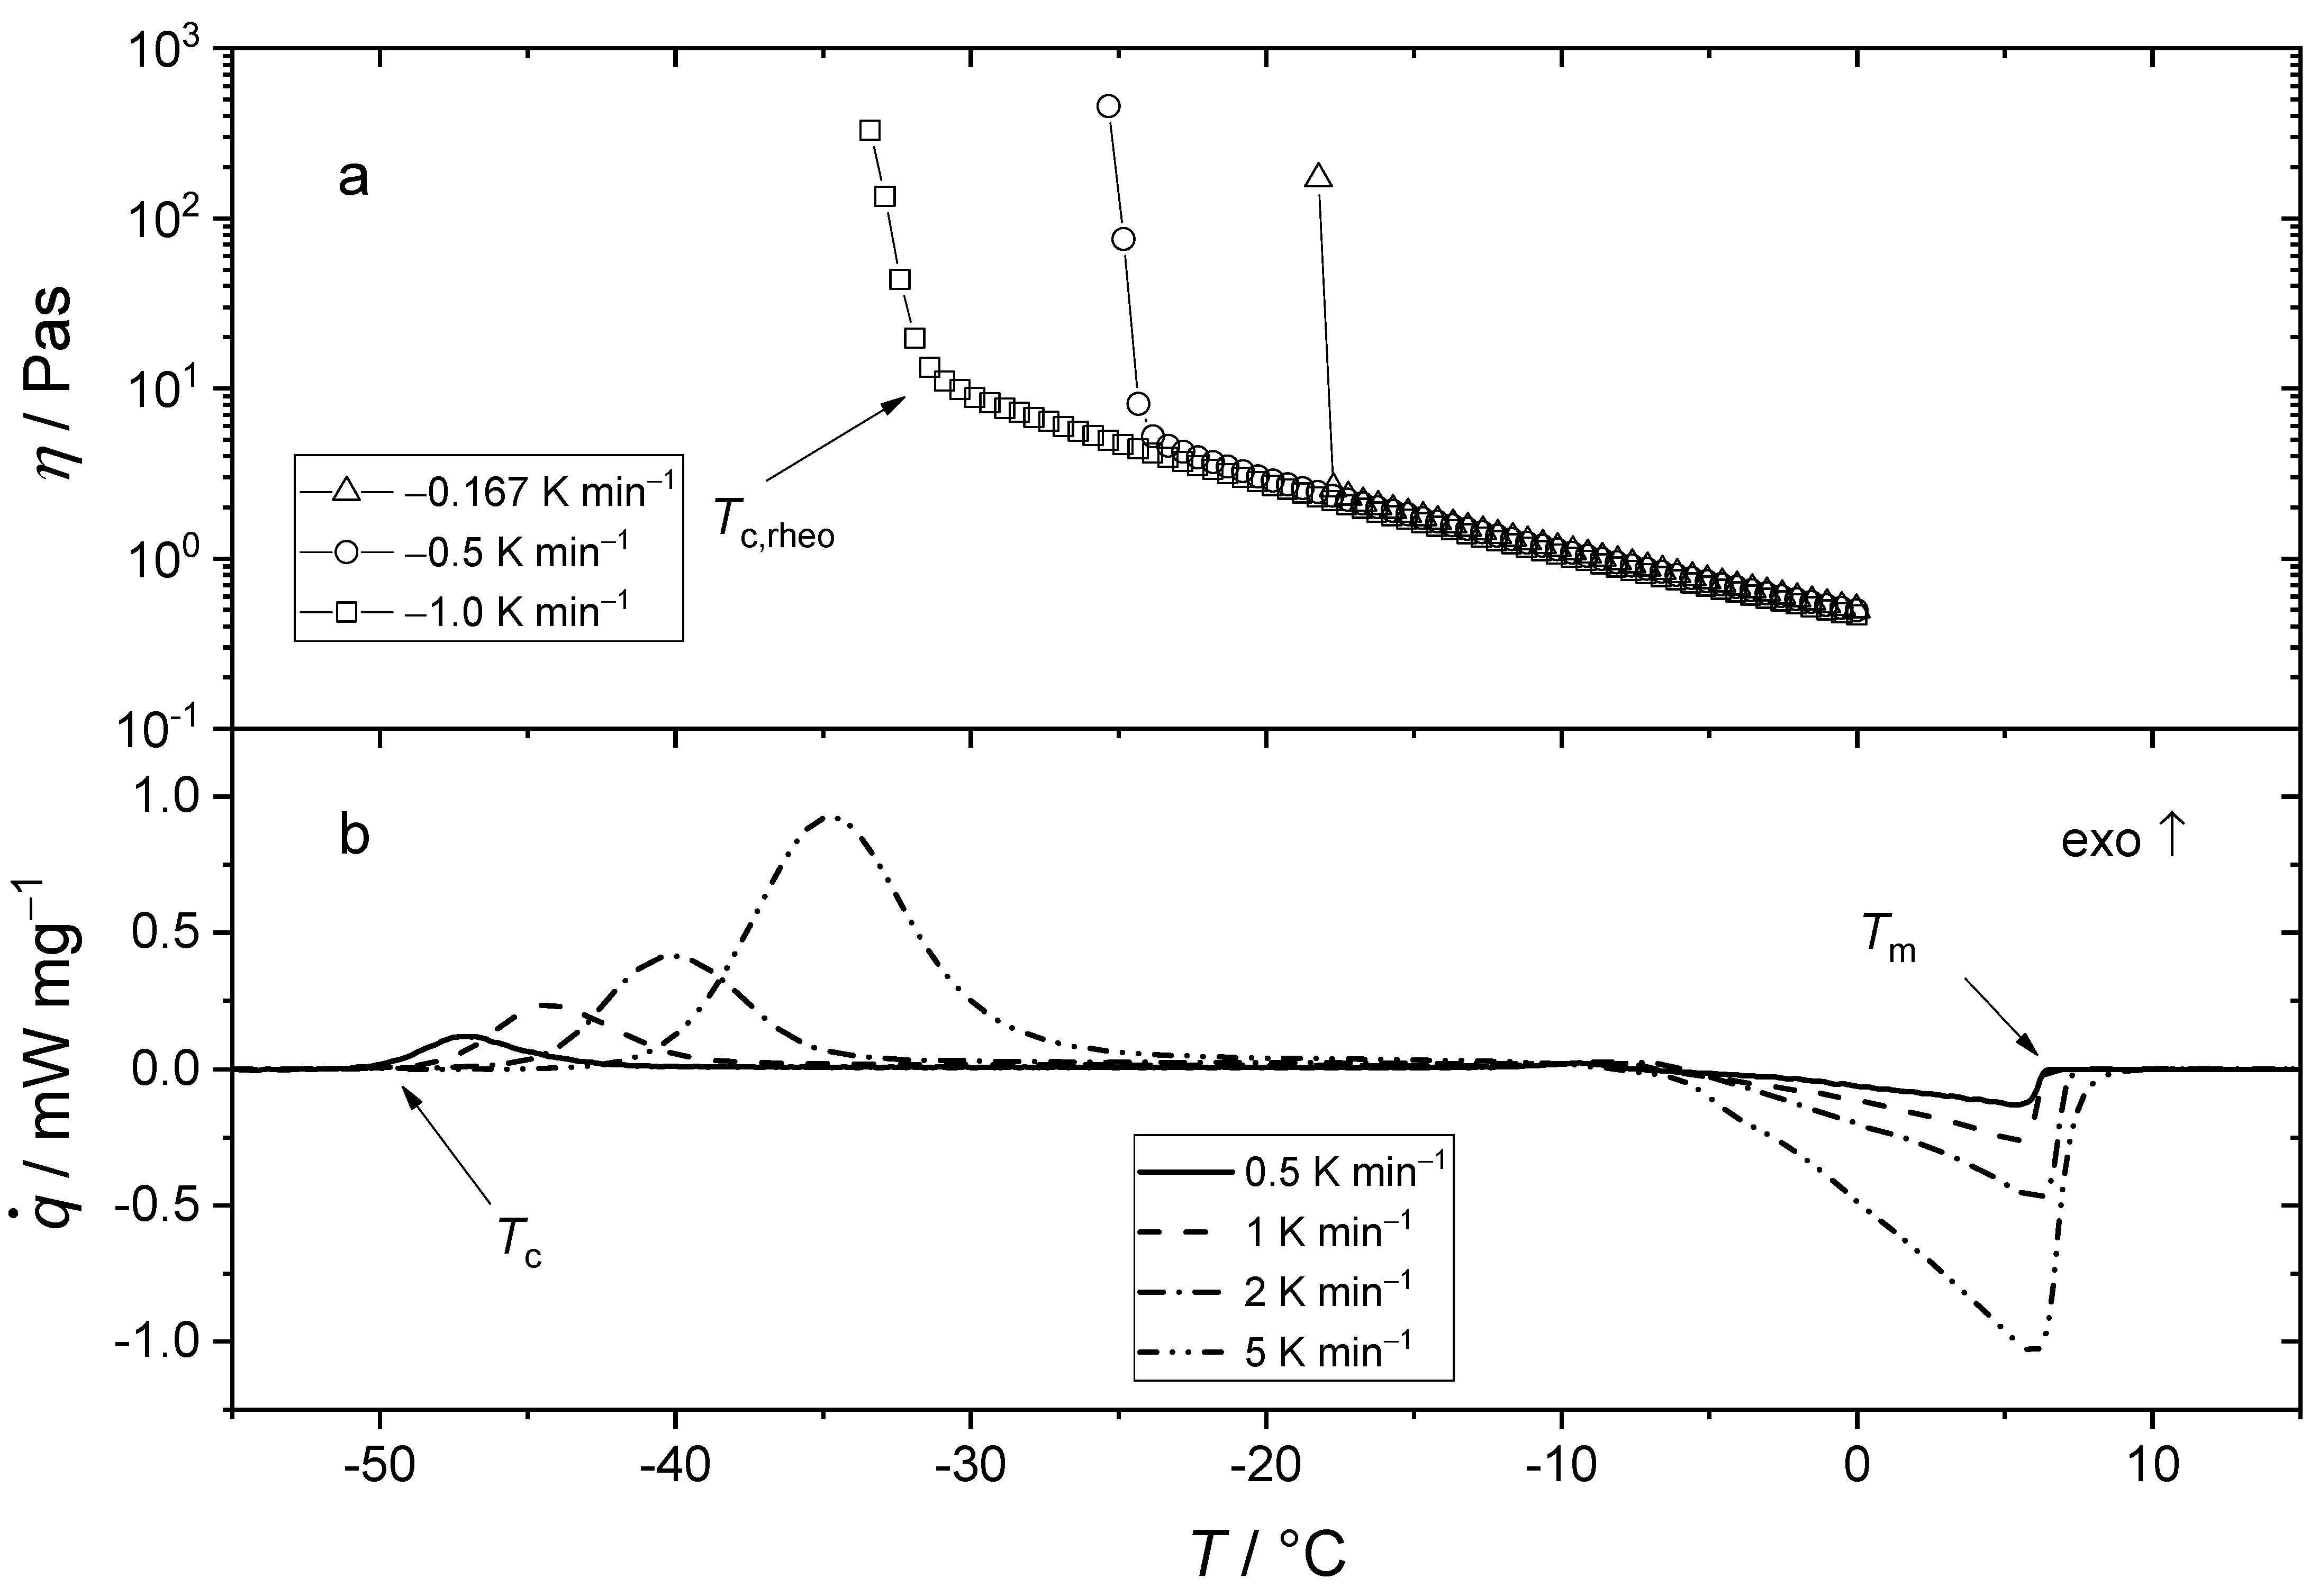
Figure 5 covers viscosity data from steady shear rheometry as well as heat flow data from DSC experiments obtained at various cooling and heating rates, respectively. EO1 exhibited a similar increase in viscosity with decreasing temperature as the non-crystallizing oils discussed above until the crystallization temperature Tc,rheo was reached (Figure 5a). This crystallization temperature strongly decreased with an increasing cooling rate. Below Tc,rheo, the viscosity drastically increased in a narrow temperature range of about 5 K. This was due to the onset of crystallization. EO1 crystallized to the extent that the rheometer was blocked. This is different from the rheological characterization of mineral oil, which formed a shear-thinning network of paraffin crystals and where the flow curves converged again at temperatures well below Tc,rheo (Figure 3a). Thus, no further viscosity measurement was possible, and the determination of a melting temperature based on steady shear measurements was not feasible.
Under quiescent conditions in the DSC experiments, EO1 did not crystallize during cooling but during the heating process (Figure 5b). During cooling, EO1 formed nuclei far below its melting temperature, where the nuclei grew slowly because of the high viscosity. The crystal growth rate increased during re-heating due to lower viscosity at higher temperatures, resulting in an exothermic crystallization peak. This phenomenon is well known as cold-crystallization [12,18,19]. EO1 crystallized in the DSC experiments between −50 and −30 °C and melted at +7 °C depending on the heating rate (Figure 5b). This corresponds to a supercooling ΔT of about −50 K.
The enthalpy of crystallization was −67.5 J g−1, and the enthalpy of fusion was 90.2 J g−1. The enthalpy of fusion of the EO1 was consistent with the values reported for aromatic esters (−97.7–−158.4 J g−1, depending on chemical composition) [20]. The enthalpy of crystallization was smaller than the enthalpy of fusion. Thus, it appears that similar to the PET [19], the supercooled amorphous phase already included a small but not negligible amount of crystallinity. At the crystallization temperature Tc, the crystallization process set in and full crystallinity was reached within a temperature interval of ΔT ≈ 10 K. The resulting crystalline solid completely melted when heated above the melting temperature Tm.
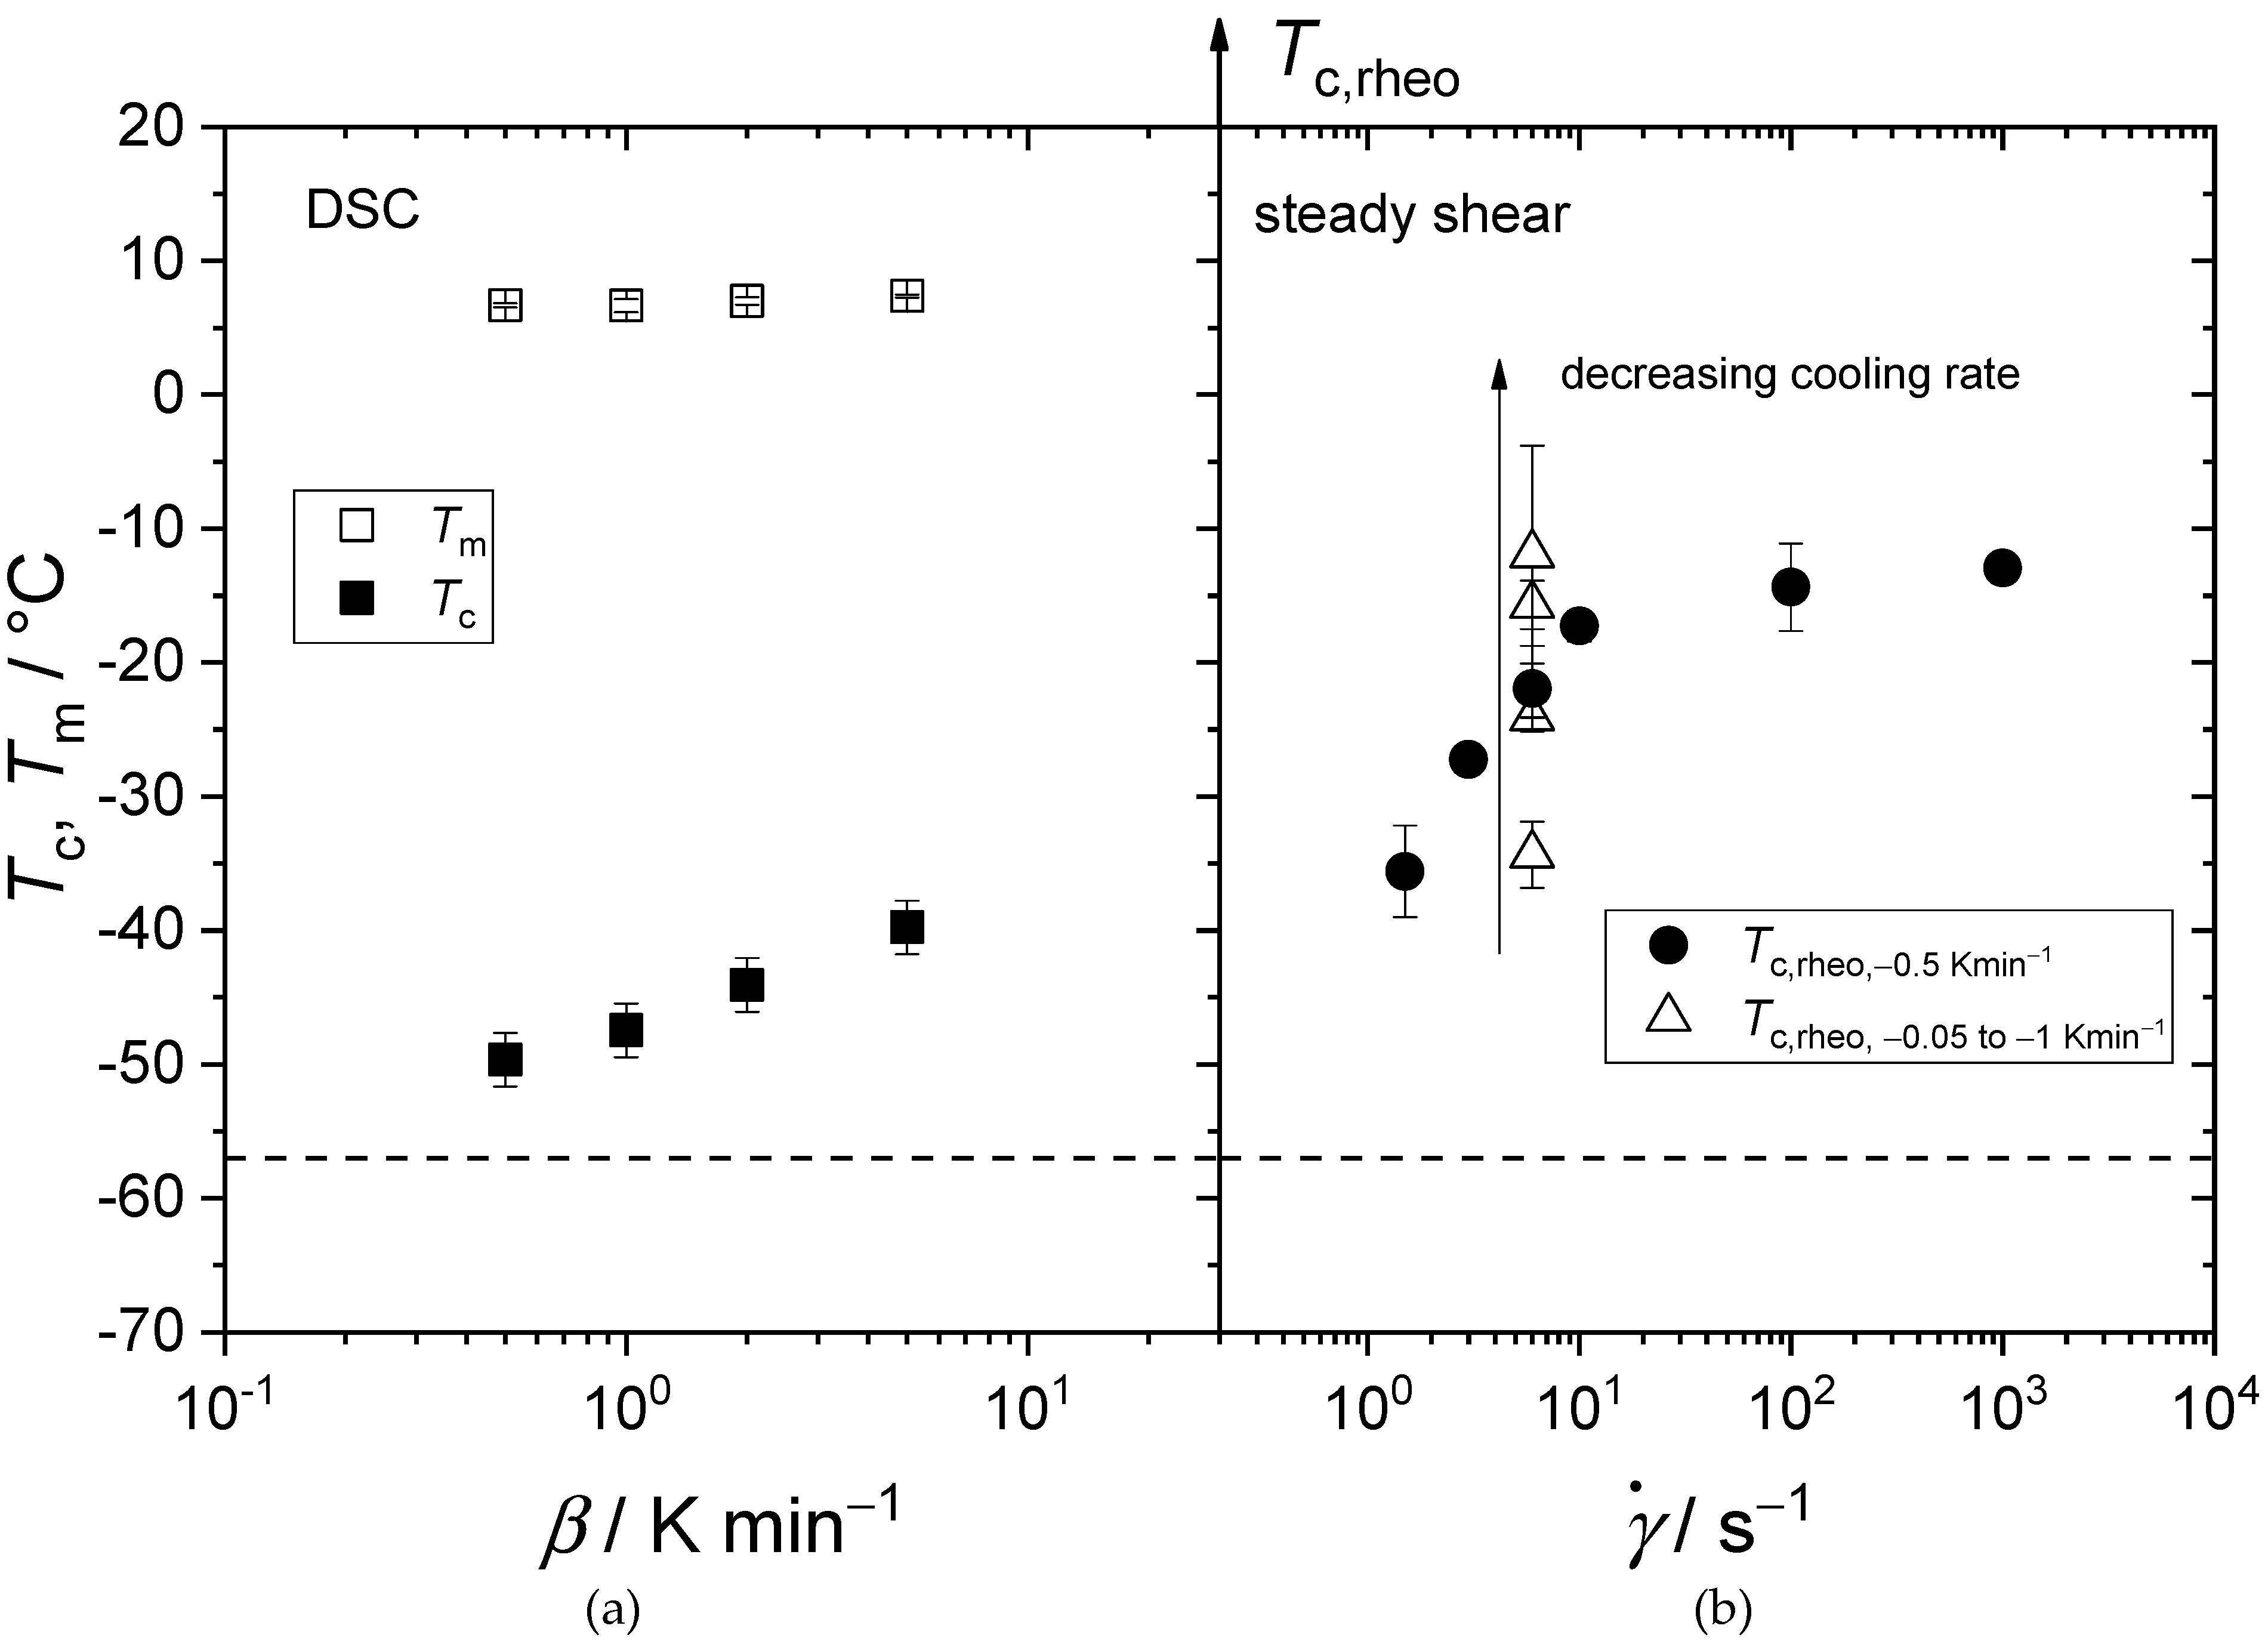
The temperature gap between crystallization Tc and melting temperature Tm observed in the DSC experiments decreased with an increasing heating rate. A strong supercooling was typical for the kinetically hindered crystallization of esters [20,21]. Figure 6a displays Tm and Tc values obtained from DSC measurements as a function of the heating rate. The melting temperature of EO1 was Tm = 7 °C independent of the heating rate because the melting temperature was thermodynamically controlled. In contrast, the crystallization temperature Tc was kinetically controlled and exhibited a substantial increase with an increasing heating rate.
Figure 6b shows crystallization temperature data obtained from steady shear experiments. The EO1′s crystallization temperature Tc,rheo occurred during cooling and drastically increased with an increasing shear rate but seemed to level off at Tc,rheo ≈ −15 °C for shear rates larger than 10 s−1. Furthermore, Tc,rheo increased substantially with a decreasing cooling rate (Figure 6b, triangles). Obviously, the shear flow promoted the crystallization of EO1, but this seems to have been counteracted by the flow-induced breakup of crystals at higher shear rates. At a vanishing shear rate, the crystallization temperature seemed to approach the pour point. Shear-induced crystallization explains the deviation between Tc, rheo and Tc in Figure 5a and Figure 5b, respectively, and in Figure 6. Shear induced crystallization is known for polymer melts. For example, investigations on polyethylene and polybutene-1 revealed that applying shear stress to a supercooled melt increases the crystallization rate and leads to crystallization close to the melting temperature [22,23]. For polymers, the molecular origin of shear-induced crystallization and the experimentally found dependence of the induction time for crystallization tc on the shear rate γ ˙ is explained by the partial orientation and extension of the polymer chains in the strained melt. The orientation of the polymer chains results in a lower melt entropy Sm concerning the relaxed unstrained melt. Thus, the free enthalpy of the sheared melt Gm ( γ ˙ , T) exceeds the corresponding value for the relaxed melt Gm ( γ ˙ = 0, T) and thus reduces the activation barrier to form nuclei of critical size. Considering that EO1 is a relatively small molecule compared to polymer molecules, it is more probable that the orientation of the ester molecules is solely responsible for reducing melt entropy Sm [24].
EO1 crystallizes under isothermal conditions below the melting temperature Tm = 7 °C, and the onset of crystallization depends on shear rate and temperature. Figure 7 shows the induction time tc necessary to start crystallization under isothermal conditions at various temperatures and shear rates. The higher the shear rate and the lower the temperature, the faster EO1 crystallizes. At the lowest tested shear rate of 0.6 s−1 and the highest temperature of −7.5 °C, EO1 crystallized after approx. 320 min. At a shear rate of 60 s−1 and −20 °C, crystallization began after 3 min. Below the melting temperature of 7 °C, EO1 is no longer thermodynamically stable but a supercooled liquid. EO1 can crystallize anytime in the supercooled state, depending on environmental conditions. Sufficiently high shear stress can reduce the time necessary to start crystallization by several orders of magnitude compared to quiescent conditions [22,23].
Crystallization phenomena may deteriorate the utilization of EO1 at temperatures below 7 °C, but this is not indicated by the pour point determined according to the ASTM D97. The pour point is thus not a suitable indicator to judge the low-temperature applicability of oils such as EO1 showing kinetically hindered crystallization.

4. Conclusions

We have investigated the low temperature viscosity, as well as crystallization and melting behavior of one mineral and five synthetic lubrication oils using steady and oscillatory shear rheometry, thermal analysis and polarization microscopy. The pour point determined according to the ASTM D7346 and widely used in industry to judge the low-temperature application behavior of lubrication oils is discussed in the light of the presented results. The classification of three groups (I–III) of base oils emerged from this process.

4.1. Crystallizing Mineral Oil

In mineral oils, a small fraction (≈10 %) of dissolved wax (longer n-paraffinic components) forms needle-like crystals upon cooling. This results in a steep increase of viscosity at the onset of crystallization. Below the crystallization temperature Tc,rheo the oil shows shear-thinning behavior as expected for a suspension of solid anisotropic particles in a Newtonian fluid. The onset of crystallization obtained by thermal analysis and rheometry agree very well. Tc,rheo is independent of shear rate, but slightly decreases with an increasing cooling rate. For the oil investigated here, supercooling is weak, TcTm ≈ −5 K, and the pour point agrees very well with the temperature Tc,rheo and Tc, respectively obtained at a cooling rate of about −1 K min−1.

4.2. Amorphously Solidifying Synthetic Lubrication Oils

Synthetic lubricating oils such as PAO8, KR-008, PAG, and EO2 solidify in a glass-like way with no evidence of crystallization. They exhibit a moderate but steady increase in viscosity with decreasing temperature, which can be described by the WLF-equation. In these cases, the pour point corresponds to the temperature at which a viscosity of 103 Pas is reached, typically at about 20–30 K above TG. Viscosity measurements, however, turned out to be more accurate and reliable to characterize the oils’ flow behavior at low temperatures than the pour point determination.

4.3. Crystallizing Synthetic Lubricating Oils

A more complex scenario is encountered for ester-type oils with linear alkyl chains. Such lubricating oils show pronounced supercooling (∆T ~ −50 K for the system investigated here). Accordingly, the crystallization temperature in dynamic measurements drastically varies with cooling/heating rate and shear rate, while the melting temperature remains unaffected. The induction time tc for crystallization during isothermal experiments also varies substantially with supercooling.
Crystallization occurs suddenly and is completed within a few minutes. Prior to crystallization these oils exhibit Newtonian flow behavior and the increase in viscosity with decreasing temperature is similar to the amorphously solidifying synthetic oils discussed above. When crystallization sets in, however, viscosity sharply increases within a short time period. The oil crystallizes to the extent that the rheometer is blocked. For such oils, the pour point is insufficient to judge their low-temperature applicability. For the EO1 investigated here, crystallization occurred at temperatures up to 50 K above the pour point, depending on the shear rate and cooling conditions. This suggests that the lubrication properties may be severely deteriorated even far above the pour point. In such cases, a thorough rheological and thermal analysis considering the respective environmental conditions is required to judge the oils application behavior at low temperatures.

Author Contributions

Conceptualization, A.C. and K.-H.J.; methodology, A.C., A.H., B.H., K.-H.J. and N.W.; validation, A.C., A.H. and B.H.; formal analysis, A.C. and A.H.; investigation, A.C. and A.H.; resources, K.-H.J. and N.W.; data curation, A.C.; writing—original draft preparation, A.C.; writing—review and editing, A.C., A.H., B.H., K.-H.J. and N.W.; visualization, A.C.; supervision, K.-H.J. and N.W.; project administration, B.H., K.-H.J. and N.W.; funding acquisition, K.-H.J. and N.W. All authors have read and agreed to the published version of the manuscript.

Funding

This research was funded by Arbeitsgemeinschaft industrieller Forschungsvereinigungen (AiF), grant number 20001N and Forschungsvereinigung Antriebstechnik (FVA), grant number 829I.

Acknowledgments

The authors give thanks to the members of the FVA, especially to Fuchs Schmierstoffe GmbH, Castrol Germany GmbH, and King Industries, for providing additional information and the base oils.

Conflicts of Interest

The authors declare no conflict of interest.

References

  1. ASTM D97. Standard Test Method for Pour Point of Petroleum Products; ASTM International: West Conshohocken, PA, USA, 2017. [Google Scholar]
  2. Webber, R.M. Low temperature rheology of lubricating mineral oils: Effects of cooling rate and wax crystallization on flow properties of base oils. J. Rheol. 1999, 43, 911–923. [Google Scholar] [CrossRef]
  3. Webber, R.M. Yield Properties of Wax Crystal Structures Formed in Lubricant Mineral Oils. Ind. Eng. Chem. Res. 2001, 40, 195–203. [Google Scholar] [CrossRef]
  4. Shubkin, R.L. Polyalphaolefins Meeting the Challenge for High-Performance Lubrication. Lubr. Eng. 1994, 50, 196–202. [Google Scholar]
  5. Tsvetkov, O.N.; Kolesova, G.E.; Bogdanov, S.K.; Toporishcheva, R.I. Rheological properties and lubricity of poly-alpha-olefin oils. Chem. Technol. Fuels Oils 1987, 23, 228–231. [Google Scholar] [CrossRef]
  6. Hourani, M.J.; Hessell, T.; Abramshe, R.A.; Liang, J. Alkylated Naphthalenes as High-Performance Synthetic Lubricating Fluids. Tribol. Trans. 2007, 50, 82–87. [Google Scholar] [CrossRef]
  7. Hessel, E.T.; Abramshe, R.A. Alkylated Naphthalenes as High-Performance Synthetic Fluids. J. Synth. Lubr. 2003, 20, 109–122. [Google Scholar] [CrossRef]
  8. Gul, M.; Masjuki, H.H.; Kalam, M.A.; Zulkifli, N.W.M.; Mujtaba, M.A. A Review: Role of Fatty Acids Composition in Characterizing Potential Feedstock for Sustainable Green Lubricants by Advance Transesterification Process and its Global as Well as Pakistani Prospective. Bioenerg. Res. 2020, 13, 1–22. [Google Scholar] [CrossRef]
  9. Bouzidi, L.; Li, S.; Di Biase, S.; Rizvi, S.Q.; Dawson, P.; Narine, S.S. Lubricating and Waxy Esters II: Synthesis, Crystallization, and Melt Behavior of Branched Monoesters. Ind. Eng. Chem. Res. 2012, 51, 14892–14902. [Google Scholar] [CrossRef]
  10. Raghunanan, L.; Narine, S.S. Engineering Green Lubricants I: Optimizing Thermal and Flow Properties of Linear Diesters Derived from Vegetable Oils. ACS Sustain. Chem. Eng. 2016, 4, 686–692. [Google Scholar] [CrossRef]
  11. Raghunanan, L.; Narine, S.S. Branched Biobased Diesters with Exceptional Low Temperature and Flow Properties for Use in Lubricant Formulations. ACS Sustain. Chem. Eng. 2016, 4, 2542–2549. [Google Scholar] [CrossRef]
  12. Moura Ramos, J.J.; Diogo, H.P. Are Crystallization and Melting the Reverse Transformation of Each Other? J. Chem. Educ. 2006, 83, 1389–1392. [Google Scholar] [CrossRef]
  13. March, N.H.; Street, R.A.; Tosi, M.P. Amorphous Solids and the Liquid State, 1st ed.; Springer: Boston, MA, USA, 1985; pp. 401–406. [Google Scholar] [CrossRef]
  14. ASTMD7346. Standard Test Method for No Flow Point and Pour Point of Petroleum Products and Liquid Fuels; ASTM International: West Conshohocken, PA, USA, 2015. [Google Scholar] [CrossRef]
  15. Oliver, M.J.; Calvert, P.D. Homogenous Nucleation of n-Alkanes measured by Differential scanning calorimetry. J. Cryst. Growth 1975, 30, 343–351. [Google Scholar] [CrossRef]
  16. Webber, R.M.; George, H.F.; Covitch, M.J. The Relation between Low-Temperature Rheology of Lubricating Mineral Oils and Gelatin Index. In Oil Flow Studies at Low Temperatures in Modern Engines; ASTM International: West Conshohocken, PA, USA, 2000; pp. 113–151. [Google Scholar]
  17. Williams, M.L.; Landel, R.F.; Ferry, J.D. The Temperature Dependence of Relaxation Mechanisms in Amorphous Polymers and Other Glass-forming Liquids. J. Am. Chem. Soc. 1955, 77, 3701–3707. [Google Scholar] [CrossRef]
  18. Boyde, S. Low-temperature characteristics of synthetic fluids. J. Synth. Lubr. 2001, 18, 99–114. [Google Scholar] [CrossRef]
  19. Wellen, R.M.R.; Canedo, E.; Rabello, M.S. Nonisothermal cold crystallization of poly(ethylene terephthalate). J. Mater. Res. 2011, 26, 1107–1115. [Google Scholar] [CrossRef]
  20. Ravotti, R.; Fellmann, O.; Fischer, L.J.; Worlitschek, J.; Stamatiou, A. Assessment of the Thermal Properties of Aromatic Esters as Novel Phase Change Materials. Crystals 2020, 10, 919. [Google Scholar] [CrossRef]
  21. Ravotti, R.; Fellmann, O.; Fischer, L.J.; Worlitschek, J.; Stamatiou, A. Investigation of the Thermal Properties of Diesters from Methanol, 1-Pentanol, and 1-Decanol as Sustainable Phase Change Materials. Materials 2020, 13, 810. [Google Scholar] [CrossRef] [PubMed] [Green Version]
  22. Haas, T.W.; Maxwell, B. Effects of shear stress on the crystallization of linear polyethylene and polybutene-1. Polym. Eng. Sci. 1969, 9, 225–241. [Google Scholar] [CrossRef]
  23. Vleeshouwers, S.; Meijer, H.E. A rheological study of shear induced crystallization. Rheol. Acta 1996, 35, 391–399. [Google Scholar] [CrossRef] [Green Version]
  24. Lellinger, D.; Floudas, G.; Alig, I. Shear induced crystallization in poly(e-caprolactone): Effect of shear rate. Polymer 2003, 44, 5759–5769. [Google Scholar] [CrossRef]
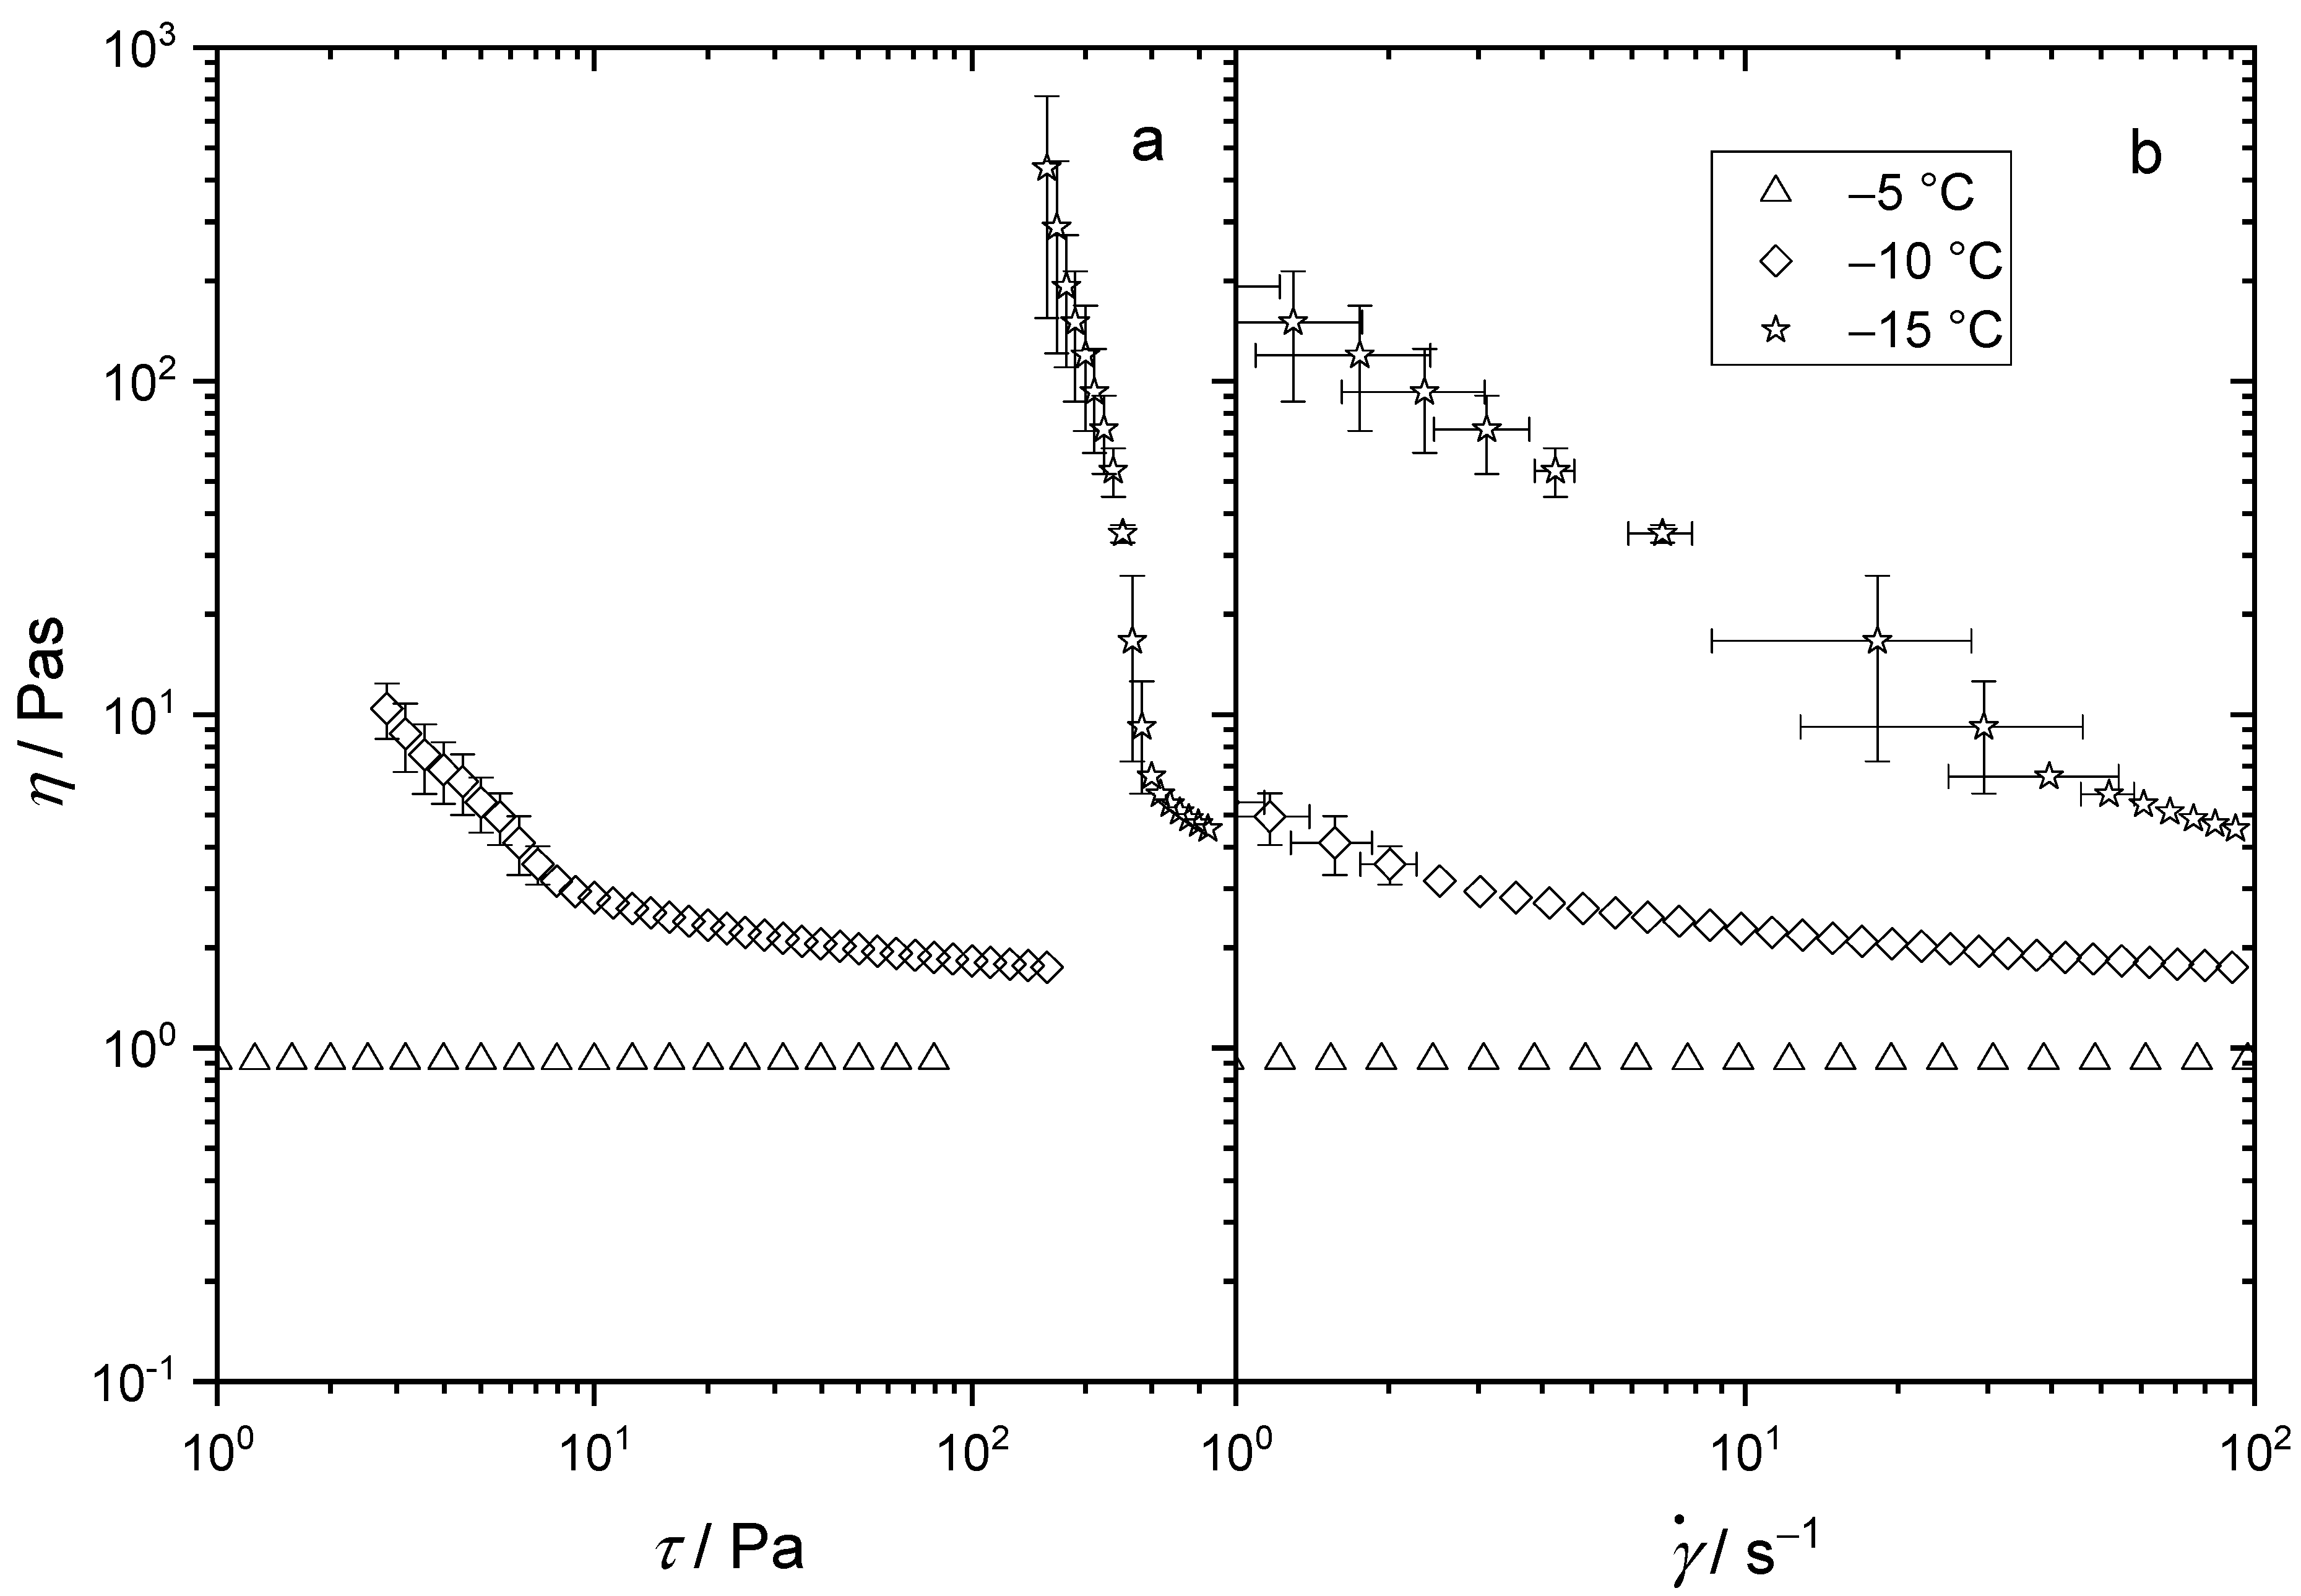
Figure 1. Viscosity of the mineral oil (MO) as a function of shear stress (a) and as a function of shear rate (b) determined in the shear stress controlled measuring mode at the temperatures −5, −10 and −15 °C.
Lubricants 09 00099 g001
Figure 2. Amount of complex viscosity |η*| (a) as obtained from small amplitude oscillatory shear rheometry (ω = 10 rad s−1 and γ = 0.05 %), and heat flow q ˙ (b) as obtained from DSC experiments during cooling and heating cycles (marked by arrows) at 2 K min−1 for the mineral oil (MO). A polarization micrograph taken at −50 °C is shown as an inset in (a), demonstrating that just a small percentage of the oil crystallized. A dashed line marks the pour point.
Lubricants 09 00099 g002
Figure 3. Steady shear viscosity as a function of temperature for the mineral oil (MO), (a) obtained at a constant shear rate of 6 s−1 and cooling rates β between −0.167 and −1 Kmin−1, and (b) obtained at constant cooling rate of −0.5 Kmin−1 and different shear rates between 1 and 100 s−1. Lines are to guide the eye.
Lubricants 09 00099 g003
Figure 4. Viscosity vs. temperature for the synthetic oils PAO8, KR-008, PAG and EO2 during cooling cycles. Measurements were performed at a constant shear rate of 6 s−1 and a cooling rate of −1 K min−1. The lines describe the fit of the WLF equation to the respective experimental data. The error bars of the viscosity at the pour point (stars) indicate the reproducibility of the pour point according to ASTM D7346.
Lubricants 09 00099 g004
Figure 5. (a) Steady shear viscosity vs. temperature measured at a shear rate of 6 s−1 for EO1 during cooling cycles performed at cooling rates, ranging from −0.167 to −1 K min−1. Lines are to guide the eye. Since EO1 crystallizes to the extent that the rheometer is blocked, no further measurements at heating cycles are possible. (b) Heat flow q ˙ for EO1 during heating cycles of DSC experiments performed at different heating rates between 0.5 and 5 K min−1. No exothermic heat flow signals during cooling cycles were detected.
Lubricants 09 00099 g005
Figure 6. (a) crystallization Tc and melting temperature Tm for EO1 obtained from heat flow data of DSC measurements as a function of heating rate during heating cycles (see Figure 5b). (b) crystallization temperature Tc,rheo obtained from steady shear experiments (see Figure 5a) during cooling cycles for EO1 as a function of shear rate. Closed circles correspond to data obtained at a constant cooling rate of −0.5 K min−1. Open triangles represent data measured at various cooling rates, −0.05, −0.167, −0.5 and −1 K min−1, respectively. The dashed line marks the pour point.
Lubricants 09 00099 g006
Figure 7. Induction time tc for isothermal crystallization of EO1 as a function of shear rate at the temperatures −7.5, −10, −20 °C. Insert: viscosity versus time at −7.5 °C and a shear rate of 6 s−1 for EO1, illustrating the determination of the induction time tc for isothermal crystallization.
Lubricants 09 00099 g007
Table 1. Classification (group I–III), kinematic viscosity ν, viscosity index (VI), pour point (ASTM D7346 [14]), and chemical nature of the base oils.
Lubricating OilChemical NatureGroupν@40 °C/cSt.ν@100 °C/cSt.VIPour Point/°C
MOmineral oil (SN100/SN500)I485.3105−12
PAO8polyalphaolefinII478139−66
KR-008alkylated naphthaleneII36768−54
PAGpolypropylenglycoleII5710.4188−51
EO2tris(2-ethylhexyl)trimellitateII879.680−48
EO1Trimellitate *III528.1128−57
* with linear C8-C10 alkyl groups.
Table 2. Glass transition temperatures, parameters c1 and c2 of the WLF-relation [17], pour point (PP) according to ASTM D7346, temperature at which a viscosity of 1000 Pas is reached and viscosity at the pour point. Corresponding DSC curves are provided in the additional information.
PAO8KR-008EO2PAG
TG,DSC/°C−84.5 ± 0.4−75.7 ± 0.4−78.5 ± 0.5−79.3 ± 0.9
c18.39.411.78.4
c2/K133.9121.5135.1109.1
PPASTM D7347/°C *−66 ± 6−54 ± 6−48 ± 6−51 ± 6
T1000Pas/°C−64 ± 1−55 ± 0.6−47 ± 0.6−52 ± 0.6
ηat the PP/Pas1780 ± 380910 ± 151240 ± 170754 ± 90
* According to ASTM D7346 [14] the reproducibility of the pour point is ± 6 K.
Publisher’s Note: MDPI stays neutral with regard to jurisdictional claims in published maps and institutional affiliations.