Article

The Impact of Hydromorphological Alterations on Mayfly Assemblages of a Mid-Sized Lowland River in South-Eastern Europe

by
Marina Vilenica
1,*,
Iva Vidaković Maoduš
2 and
Zlatko Mihaljević
3
1
Faculty of Teacher Education, University of Zagreb, 44250 Petrinja, Croatia
2
Elektroprojekt d.d., Civil and Architectural Engineering Department, Water Resources, Nature and Environmental Protection Section, Alexandera von Humboldta 4, 10000 Zagreb, Croatia
3
Division of Zoology, Department of Biology, Faculty of Science, University of Zagreb, Rooseveltov trg 6, 10000 Zagreb, Croatia
*
Author to whom correspondence should be addressed.
Insects 2022, 13(5), 436; https://doi.org/10.3390/insects13050436
Submission received: 14 April 2022 / Revised: 28 April 2022 / Accepted: 1 May 2022 / Published: 6 May 2022
(This article belongs to the Section Insect Ecology, Diversity and Conservation)

Abstract

:

Simple Summary

The majority of European lowland rivers are under the impact of multiple stressors (water quality, hydromorphological alterations, land-use), however, the consequences of these influences on mayflies have not been sufficiently studied. Therefore, we studied mayfly assemblages and their relationship to environmental factors along a mid-sized lowland river in Croatia. No significant differences in mayfly species richness and their functional traits were observed among the three habitat groups with different levels of hydromorphological alterations (near-natural, moderately altered, and severely altered habitats). This could be related to the river’s connection to the numerous tributaries, and the variety of available microhabitats along the studied system, despite the existing hydromorphological pressures. A stronger relationship was found between mayflies and the water physico-chemical characteristics (water temperature, water velocity, oxygen content, and nutrient (e.g., nitrogen, phosphorous) concentrations) and agricultural and urban land-use. These results can contribute to the planning of management and conservation activities for lowland rivers and their biota according to the requirements of the European Water Framework Directive.

Abstract

Historically, rivers have been anthropogenically modified for different purposes worldwide (e.g., flood control, drinking water abstraction, and land drainage). Although the majority of European lowland rivers are under the impact of multiple stressors (water quality, hydromorphological alterations, land-use), the consequences of these influences on aquatic macroinvertebrates, including mayflies, have not been sufficiently studied. Therefore, with the aim of providing additional data on the response of mayflies to anthropogenic disturbances in riverine habitats, we studied mayfly assemblages and their relationship to environmental factors along a mid-sized lowland river in Croatia. No significant differences in mayfly species richness and their functional traits were observed among the three habitat groups with different levels of hydromorphological alterations (near-natural, moderately altered, and severely altered habitats). This could be related to the river’s connection to the numerous tributaries, and the variety of available microhabitats along the studied system, despite the existing hydromorphological pressures. A stronger relationship was found between mayflies and the physico-chemical water characteristics and land-use. Water temperature, water velocity, oxygen content, and nutrient (e.g., nitrogen, phosphorous) concentrations related to agricultural and urban land-use were found to be the most important factors shaping mayfly assemblages in the studied lotic lowland system. These results can contribute to the planning of management and conservation activities for lowland rivers and their biota according to the requirements of the European Water Framework Directive.

1. Introduction

Rivers have a long history of being anthropogenically modified for a variety of purposes (e.g., flood control, drinking water abstraction, and land drainage) using a variety of engineering methods, all of which have affected the physical, biological, and downstream river conditions [1]. Recognition that these physical alterations are closely related to aquatic communities has led to the development of several methods for assessing the level of hydromorphological habitat alteration [2,3,4], and confirmation that hydromorphological condition influences benthic macroinvertebrate community structure [5,6,7]. This is particularly important considering the majority of European lowland rivers are under the impact of multiple stressors (water quality, hydromorphological alterations, land-use) [7,8] and that channelization negatively affects the benthic macroinvertebrate diversity of a lowland river, even under low pollution conditions [9].
Mayflies are a small order of amphibious insects with a cosmopolitan distribution [10]. They spend most of their lives as nymphs in almost all types of freshwater habitats, where they are highly dependent on physico-chemical water parameters, such as temperature, water velocity, oxygen content, available nutrients, and substrate type [11,12,13,14,15,16]. Many studies have shown that mayfly assemblages are most diverse in rhithral (upper reaches) sections of fast-flowing streams and rivers, and in pristine large potamal rivers [11,17]. A smaller number of species is adapted to high mountains streams, crenal (spring) sections of streams, and metapotamal river sections (lower reaches) [11]. Mayflies constitute a very large proportion of biomass in freshwater ecosystems [11,18] and are an important food source for a variety of aquatic and terrestrial predators [10]. Depending on the available food resources, different ratios of grazers/scrapers, collectors and filter feeders [10,11] are found in particular habitats. Grazers/scrapers feed mainly on periphyton and fine particulate organic matter (FPOM), while detritivores (collectors, active and passive filter feeders) consume decomposing particulate organic matter (CPOM and FPOM) [11,19,20,21,22,23]. Due to their widespread occurrence, importance in aquatic food webs, and sensitivity to alterations of their habitat e.g., [12,15,16], they are used as indicators of freshwater health in bio-monitoring programs worldwide [10,24].
While it has already been established that hydromorphological degradation leads to several aspects of habitat alteration [25], the extent of these effects on mayflies is not well understood, particularly due to their high drift character [10,26] and the fact that some degradation–such as riprap on banks and channel beds for erosion control–can have both local and downstream geomorphic implications [27]. Many studies have already demonstrated the negative impacts of anthropogenic activities on lotic mayfly assemblages [12,15,16,28,29]. Several mayfly species are already extinct (locally or throughout their range), and many are considered endangered and are therefore listed in national Red Lists [30,31,32]. Ecological assessments of habitats and their biota are essential worldwide to effectively implement conservation and management activities [33,34]. Therefore, with the aim to provide additional data on mayfly response to anthropogenic disturbance in riverine habitats, we studied mayfly assemblages and their relationship to environmental factors along a mid-sized lowland river in south-eastern Europe. The main objectives of this study were: (a) to compare mayfly assemblages at three habitat groups based on the degree of their hydromorphological alteration, (b) to analyze differences in mayfly functional traits among these habitats, (c) to identify the main environmental drivers shaping mayfly assemblages, (d) to analyze the influence of selected environmental variables on mayflies, and (e) to identify the microhabitat preferential choice of recorded species in a studied Pannonian lowland river.

2. Materials and Methods

2.1. Study Area

The Bednja River is located in the northern part of Croatia and belongs to the Pannonian lowland ecoregion (ER11). It is the largest tributary of the Drava River in Croatia, with a catchment area of about 600 km2. According to Water Framework Directive, Bednja River is categorized as a mid-sized river, with its upper reaches belonging to the small stream type. The river has a relatively small altitude drop from the source to the mouth, which is about 175 m along the entire river length of 105 km. The basin has a temperate humid climate, corresponding to type Cfb by Köppen climate classification, where the average temperature in the warmest month does not exceed 22 °C and the average temperature in the coldest month does not fall below −3 °C [35]. The average monthly air temperature in the study area in the year of the study (2015) was 11.6 °C (±7.6 °C) and the average total annual precipitation was 897 mm (±114.6 mm) (source: personal calculation from raw data obtained upon request from the Croatian Meteorological and Hydrological Service). The discharge regime of the river is classified as peripannonian pluvial-nival [36].
Extensive agriculture in the form of pasture, and intensive agriculture in the form of complex cropping, are the most common types of agriculture practiced in the catchment. At the time of this study, the villages and towns along the river did not have wastewater treatment. The 20 suitable study sites (Figure 1) were selected for their representativeness of different conditions and stressors, including areas upstream and downstream of wastewater outlets, and different level of morphological alteration.

2.2. Environmental Variables

Water quality parameters were measured at each study site on three occasions: spring (20–24 March), summer (28 June–7 July), and autumn (4 October) 2015. The following parameters were measured in situ: water temperature and oxygen saturation (using the oximeter WTW Oxi 330/SET), pH value (using the pH meter WTW pH 330), and conductivity (using the conductometer WTW LF 330). The other parameters and nutrients were analyzed in the laboratory according to standard methods [37]: biological oxygen demand, chemical oxygen demand, concentrations of total nitrogen, nitrites, nitrates, organic nitrogen, Kjeldahl nitrogen, ammonium, total phosphorous, and orthophosphates.
For each study site, geographical attributes (distance from source) and land-use percentage (using CORINE Land Cover as a layer [38]) were calculated using GIS tools Arc Map version 10 [39]. Land use variables were defined from the share of land use categories at the catchment scale, and the categories were combined into four land use variables: near-natural, urban, intensive agricultural, and extensive agricultural land-use.
The extent of hydromorphological alteration was assessed based on the European Standard EN 15843:2010 [40]. The assessment was performed for a reach length of 500 m, which includes the sampling site and extends upstream. Although the EN 15843:2010 methodology assesses hydromorphological alteration that includes morphological features, flow regime, and longitudinal continuity, for this study we used only the score for morphological modification as a variable.
The final score for morphological modification represents the average score of assessed features: channel planform and section, extent of artificial material and alteration of natural substrate character, bank structure and modifications, vegetation type/structure on banks and adjacent land, adjacent land-use, degree of lateral connectivity of river and floodplain, and degree of lateral movement of river channel. Based on these scores, three main habitat groups were identified: group A (score < 2.5; near-natural to slightly altered sites), group B (score between 2.5 and 3.5; slightly to moderately altered sites), and group C (score ˃ 3.5; extensively to highly altered sites) (Table 1, Figure 2).

2.3. Mayfly Sampling

Mayflies were sampled in summer 2015 (30 June, 1, 3, 4, 5, and 7 July) with a hand net (0.5 mm mesh size)–together with other benthic macroinvertebrates–using the “multihabitat method”, as presented in the AQEM manual [41]. At each site, a total of 20 longitudinally distributed subsamples (dominant microhabitats, covering > 5% of each site) were collected, covering approximately 1.25 m2 of the stream bottom area. During sampling, individual subsamples were grouped by microhabitat in separate containers and then preserved in 96% ethanol. Substrates at the sampling sites were categorized according to AQEM consortium [41] (Supplementary Table S1). Samples were consequently sorted in the laboratory. Mayflies were identified to the lowest possible taxonomic level (very juvenile and/or damaged individuals were identified only to genus or family level) using relevant identification keys [42,43,44]. The voucher specimens are deposited in the first author’s collection, at the Department of Biology, Faculty of Science, University of Zagreb, Croatia.

2.4. Data Analyses

The Kruskal-Wallis H test and Multiple comparisons post hoc test were applied to determine differences in water velocity and water depth among different microhabitats. The same testing was used to determine species associations with substrate types in the microhabitats studied, treating subsamples as replicates. This analysis was performed in Statistica, version 10.0 [45].
Spearman’s rank correlation coefficient (R) was used to analyze the relationship between mayfly assemblages (abundance (number of individuals per m2), taxa richness) and each of the recorded species with physico-chemical water properties, land-use, and the score for morphological modification. The same test was used to determine correlations between mayfly species and water velocity and depth in studied microhabitats. Subsamples were treated as replicates. This analysis was performed in Statistica, version 10.0 [45].
Non-metric multidimensional scaling analysis (NMDS) was applied to reveal similarities in the composition of mayfly assemblages among the three habitat type groups (with study sites as replicates) using the Bray–Curtis similarity index. The results of the hierarchical cluster analysis are superimposed on NMDS ordination. These analyses were performed using Primer 6 software package [46].
The composition of mayfly assemblages in terms of the functional feeding guilds and longitudinal distribution associations of species at three habitat groups was categorized using data from Buffagni et al. [22]. The functional feeding guild and longitudinal zonal association of each species are presented as a proportion within the assemblage. Most mayfly species do not feed exclusively on a single food resource and do not occur exclusively in one biocenotic region; therefore, assignment of species to a particular category is based on the 10-point assignment scale (see [23]). Therefore, we calculated the functional feeding-guild composition and the longitudinal zonation associations of mayfly assemblages in each of the habitat groups (treating the study sites as replicates), using the given points and percentage of each species within the assemblage.
To ordinate mayfly occurrence in relation to environmental variables, Canonical Correspondence Analysis (CCA) was used. The analysis was performed using subsample data for 26 taxa (taxa data were log-transformed, rare species were downweighed) and 11 environmental variables (significant variables were selected using Interactive-forward-selection (distance from source, water temperature, oxygen saturation, water velocity, water depth, concentration of orthophosphates, ammonium, nitrites, total nitrogen, intensive land use, urban land use)). The Monte Carlo permutation test with 499 permutations was used to test the statistical significance of the relationship between all taxa and selected variables. The CCA was performed using CANOCO 5.00 [47].

3. Results

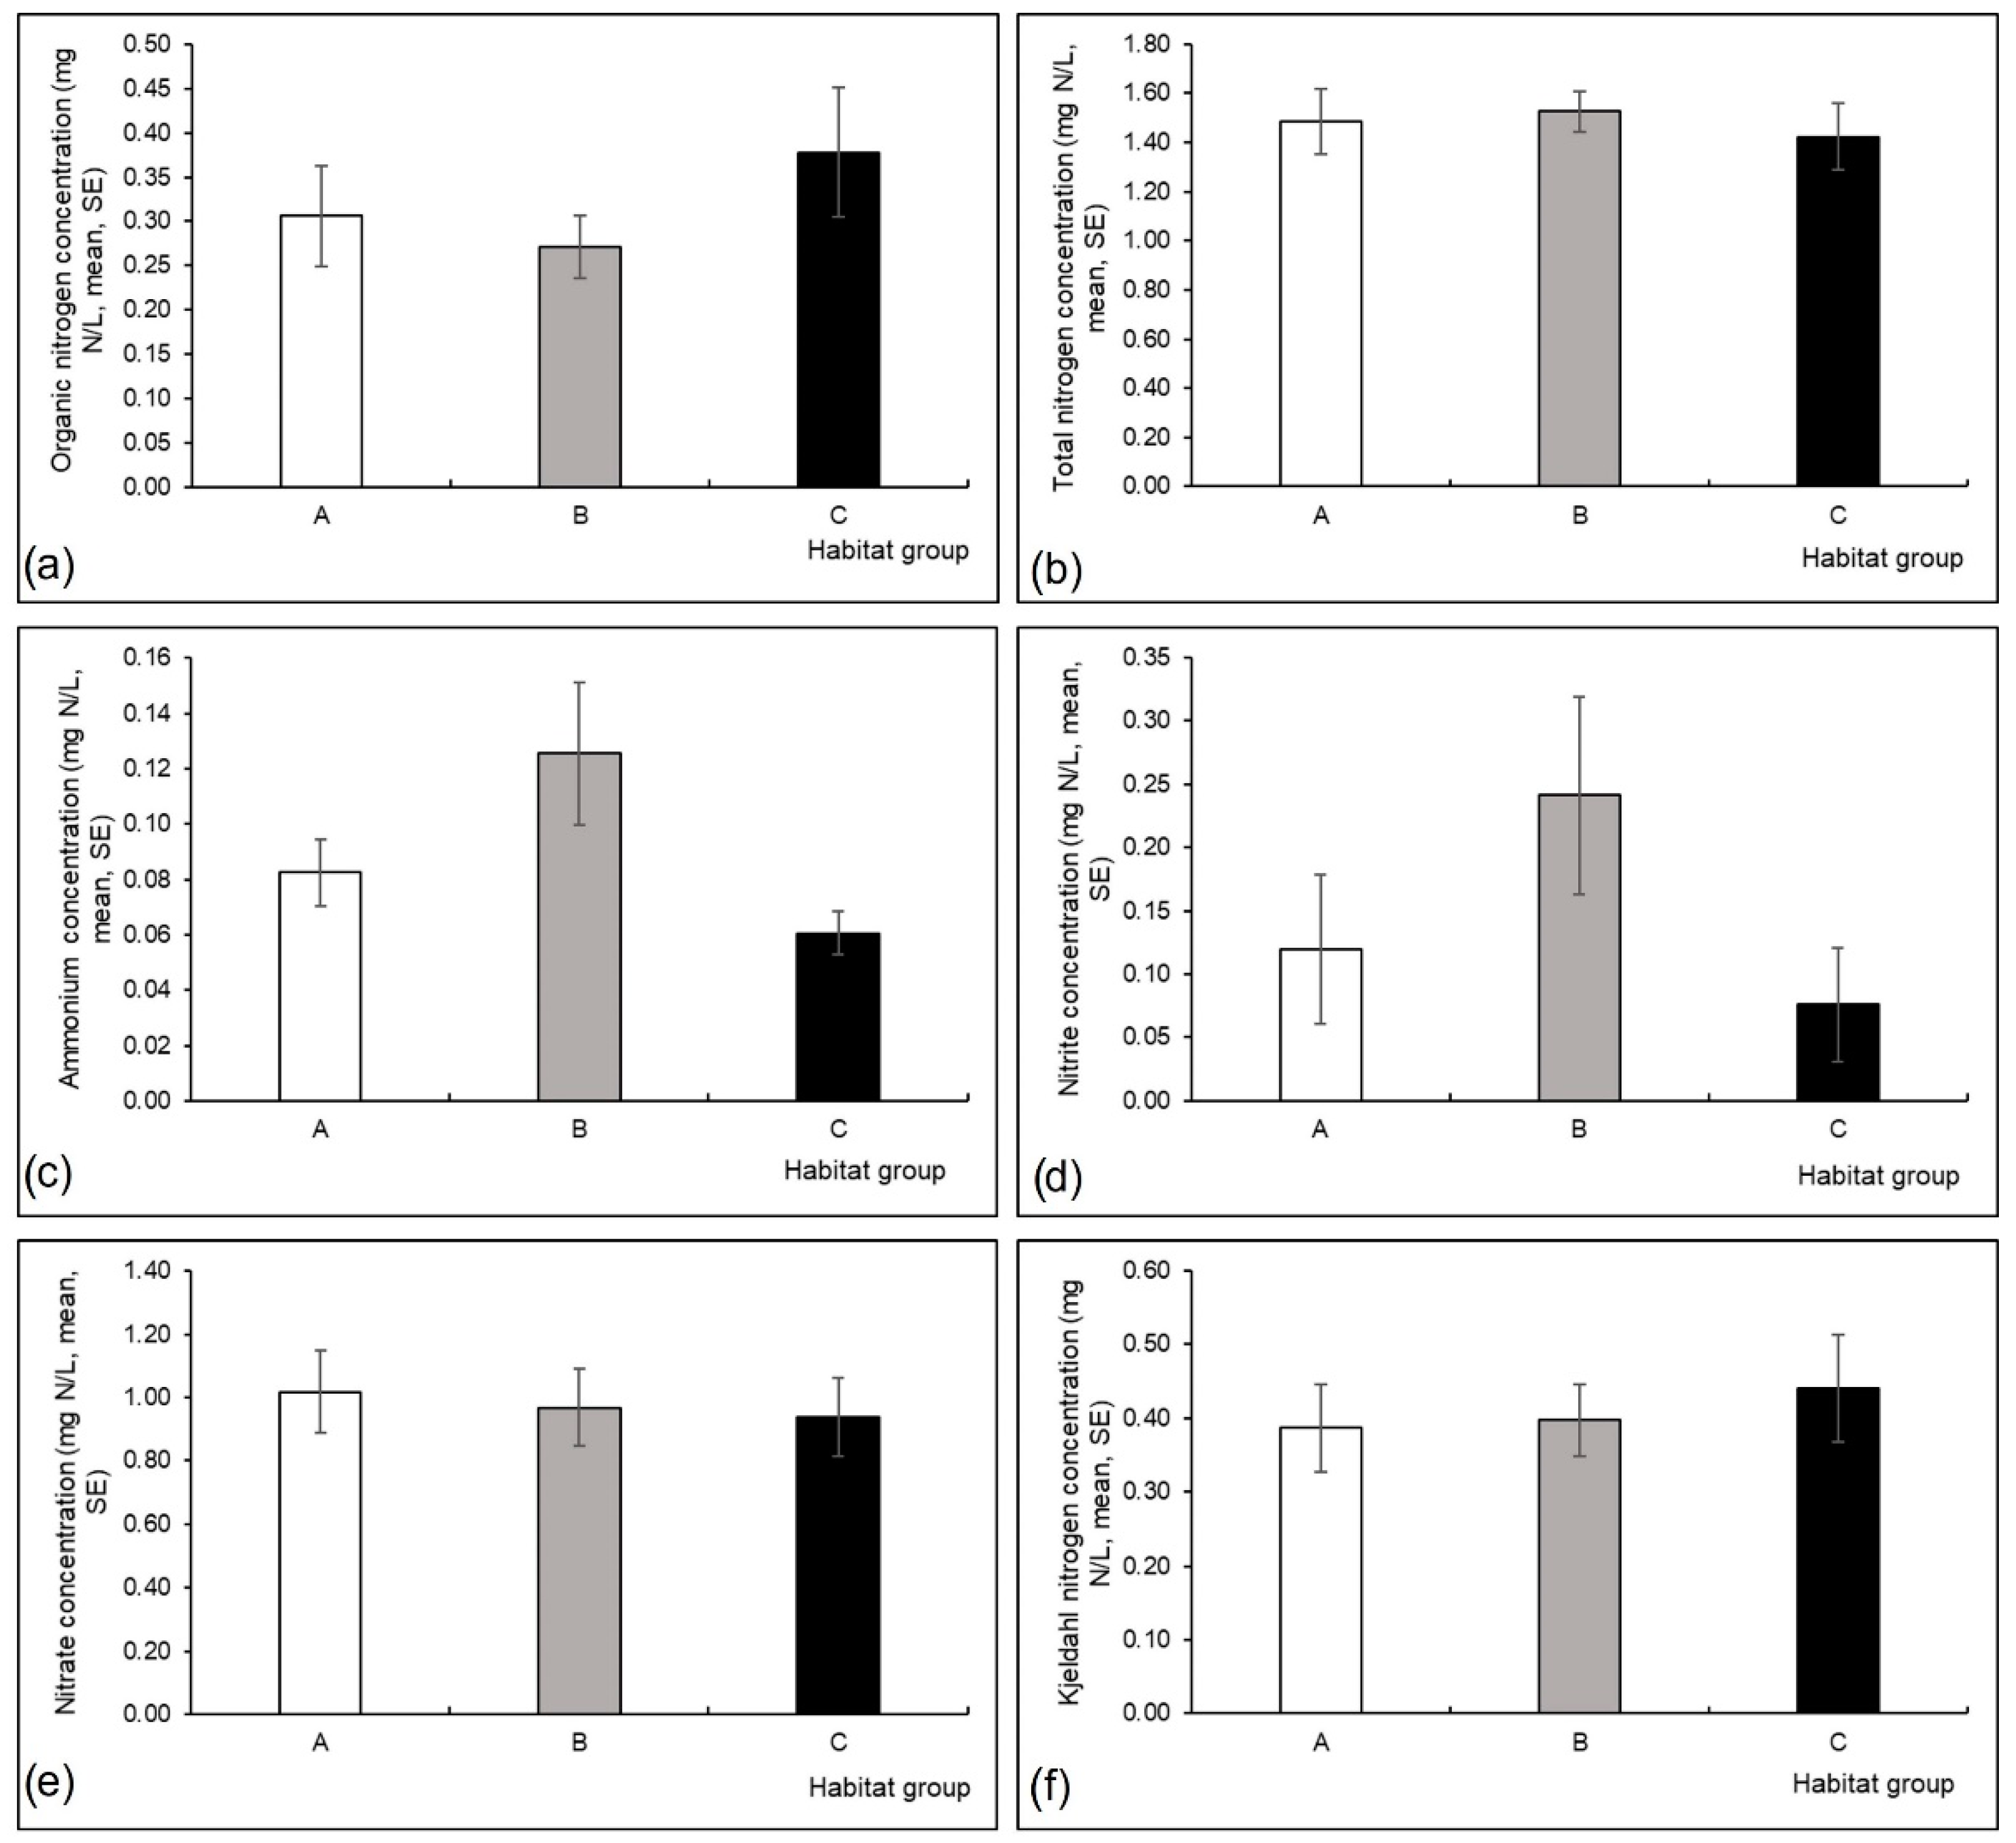
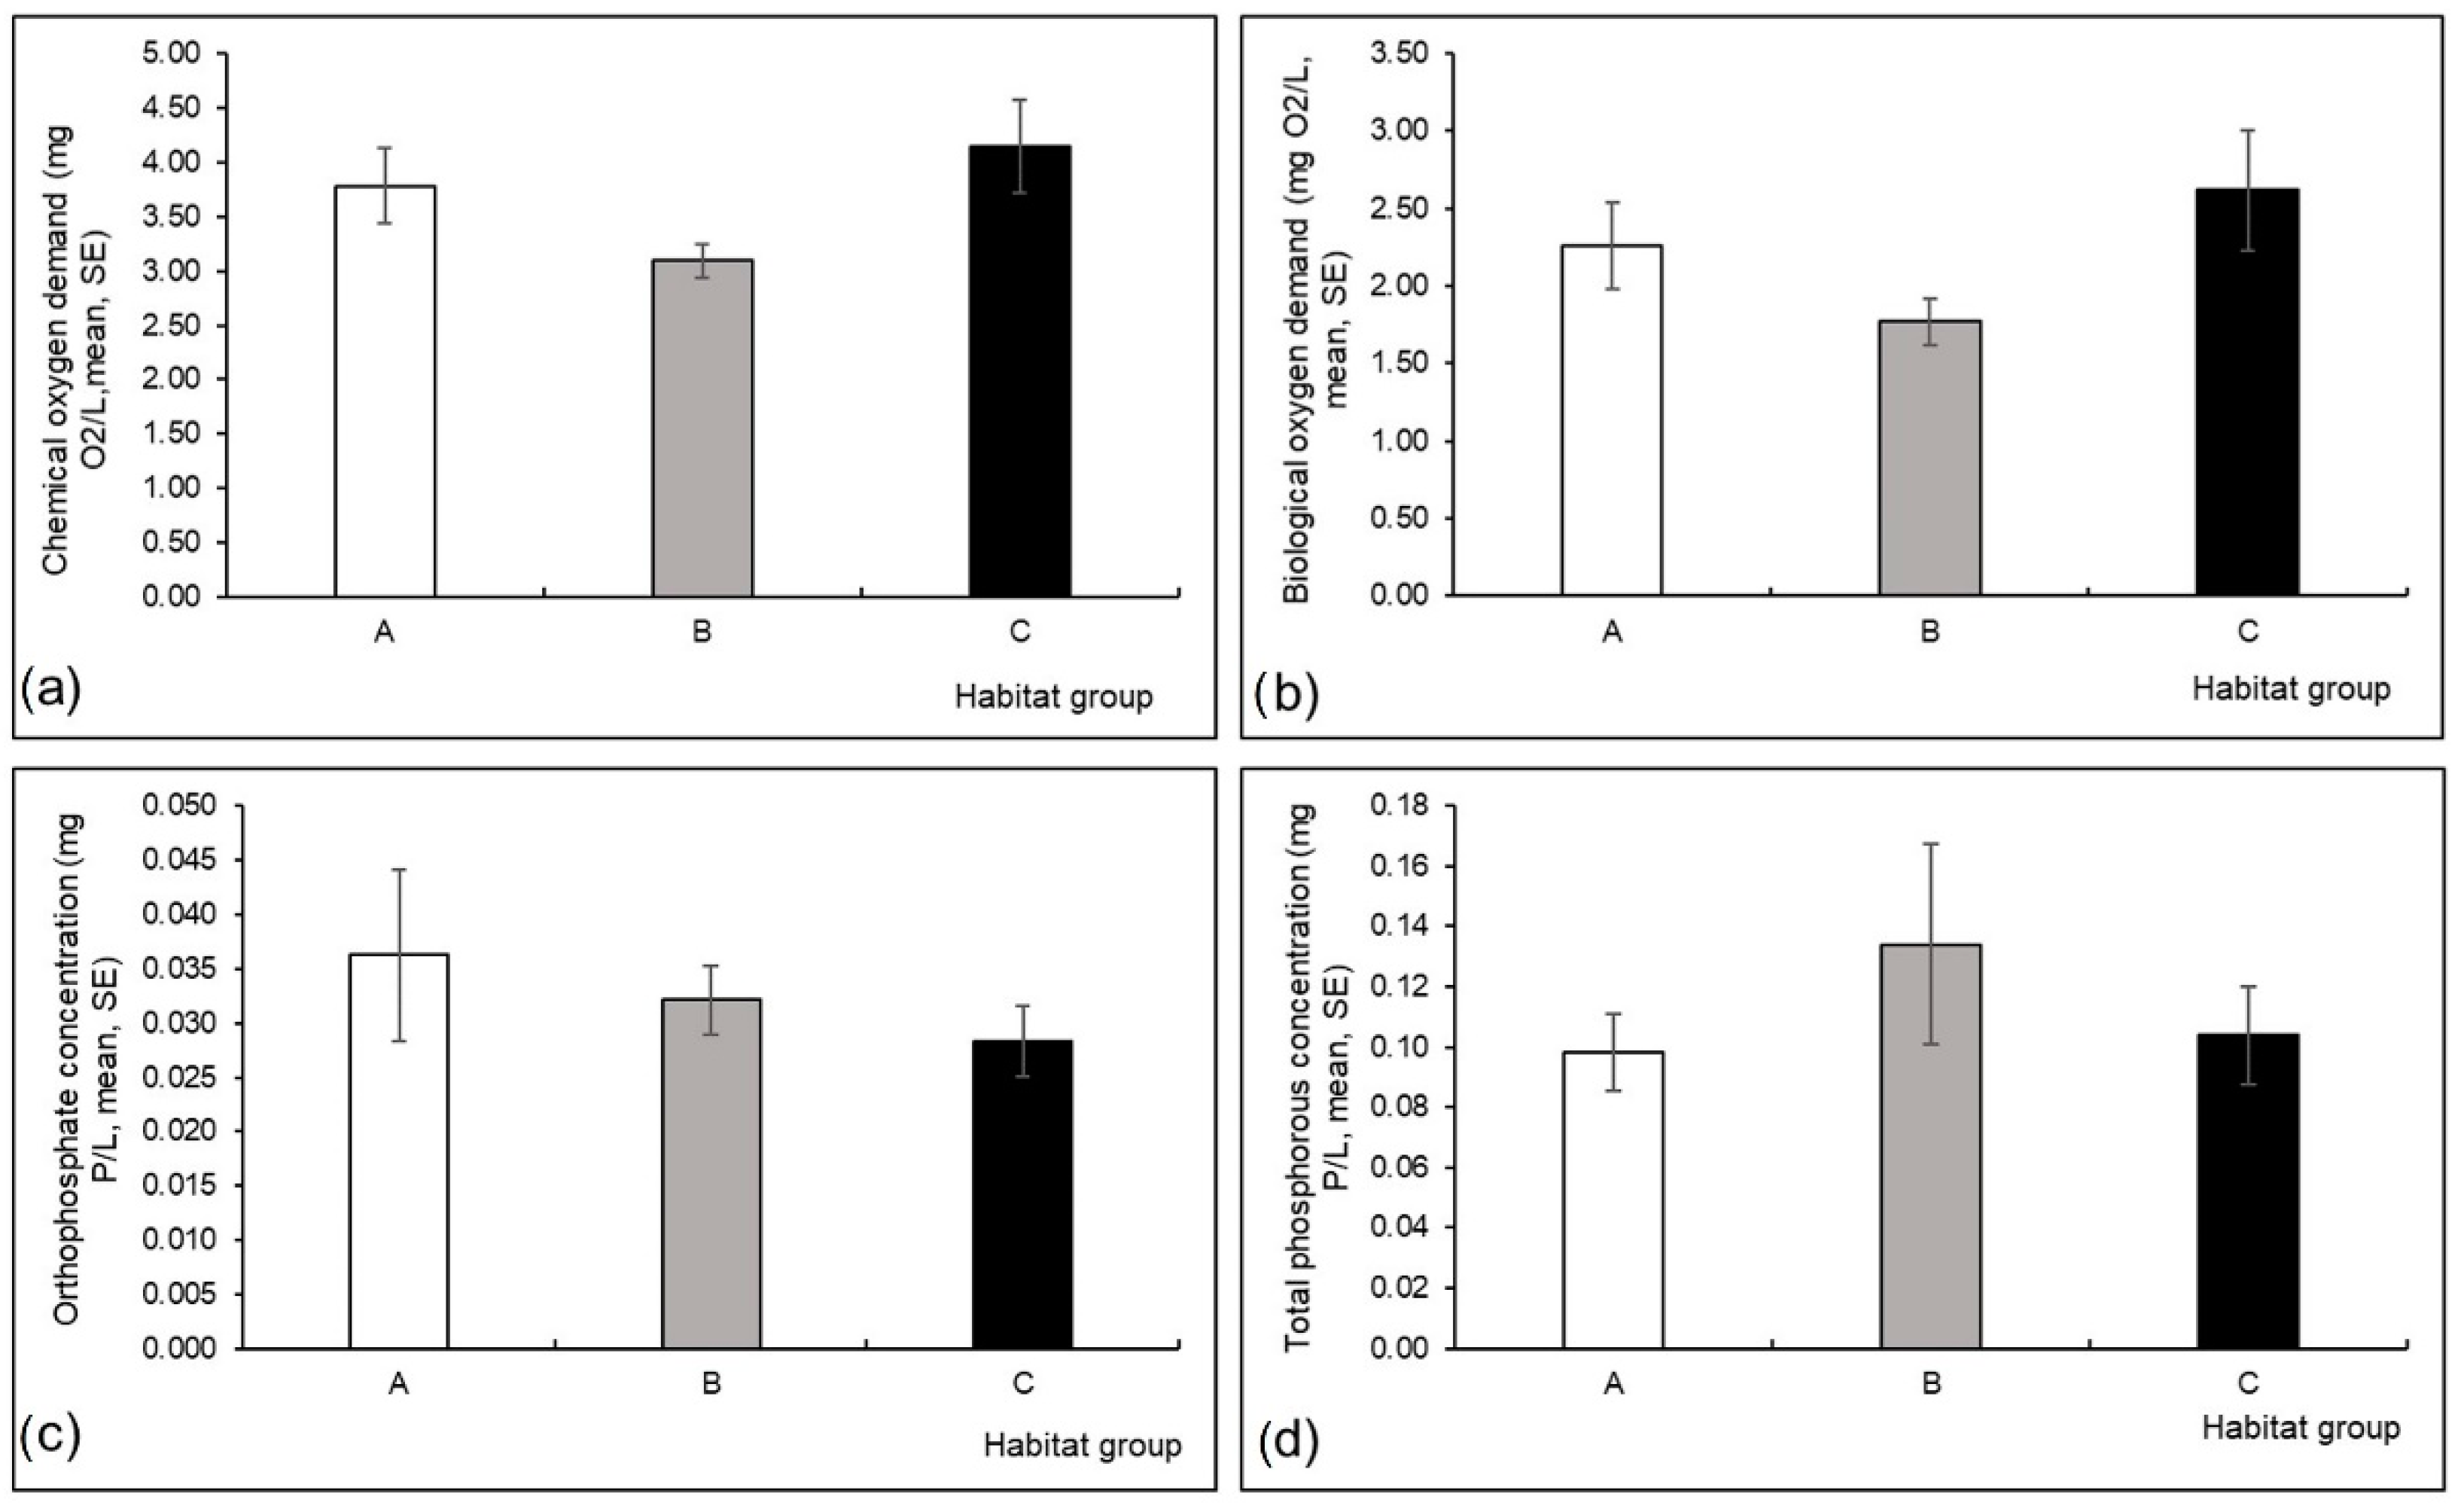
3.1. Environmental Variables

Conductivity (Kruskal-Wallis H test, H (2, N = 60) = 7.40, p = 0.03) and water depth (H (2, N = 60) = 6.68, p = 0.04) differed significantly among the three habitat groups; conductivity was higher in group A, and water depth was higher in group B compared to the other habitat groups (Figure 3a,b). Differences in other measured environmental variables were not significant among the three habitat groups (Figure 3, Figure 4 and Figure 5).

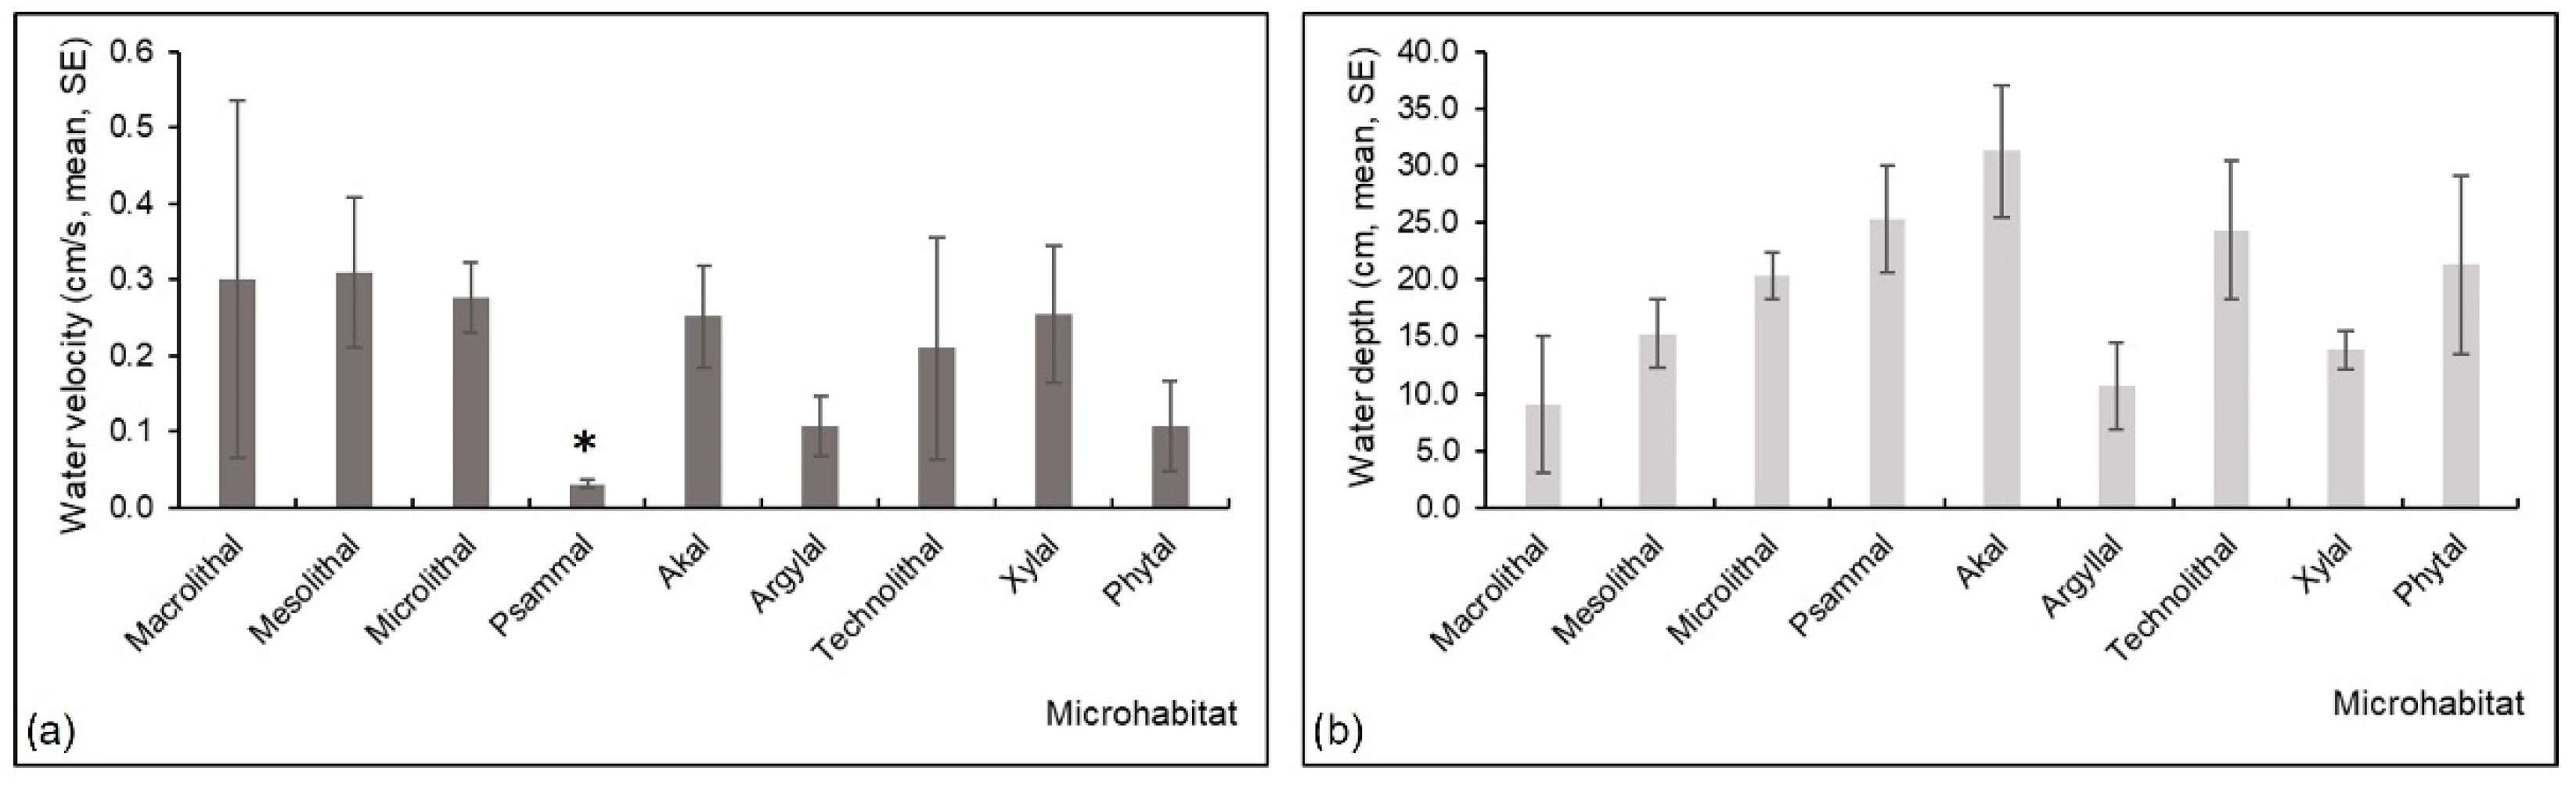
3.2. Water Velocity and Water Depth in Studied Microhabitats

The Kruskal-Wallis H test showed there were differences in water velocity among different substrate types in the studied lotic system (H (8, N = 71) = 28.03, p = 0.0005). According to the Multiple Comparisons post hoc test, psammal substrate had significantly lower water velocity compared to mesolithal (p = 0.02), microlithal (p = 0.02), akal (p = 0.006), and xylal (p = 0.03) (Figure 6a). No significant differences were found in water depth among substrates, but higher depth was recorded on psammal and akal compared to the other substrates (Figure 6b).

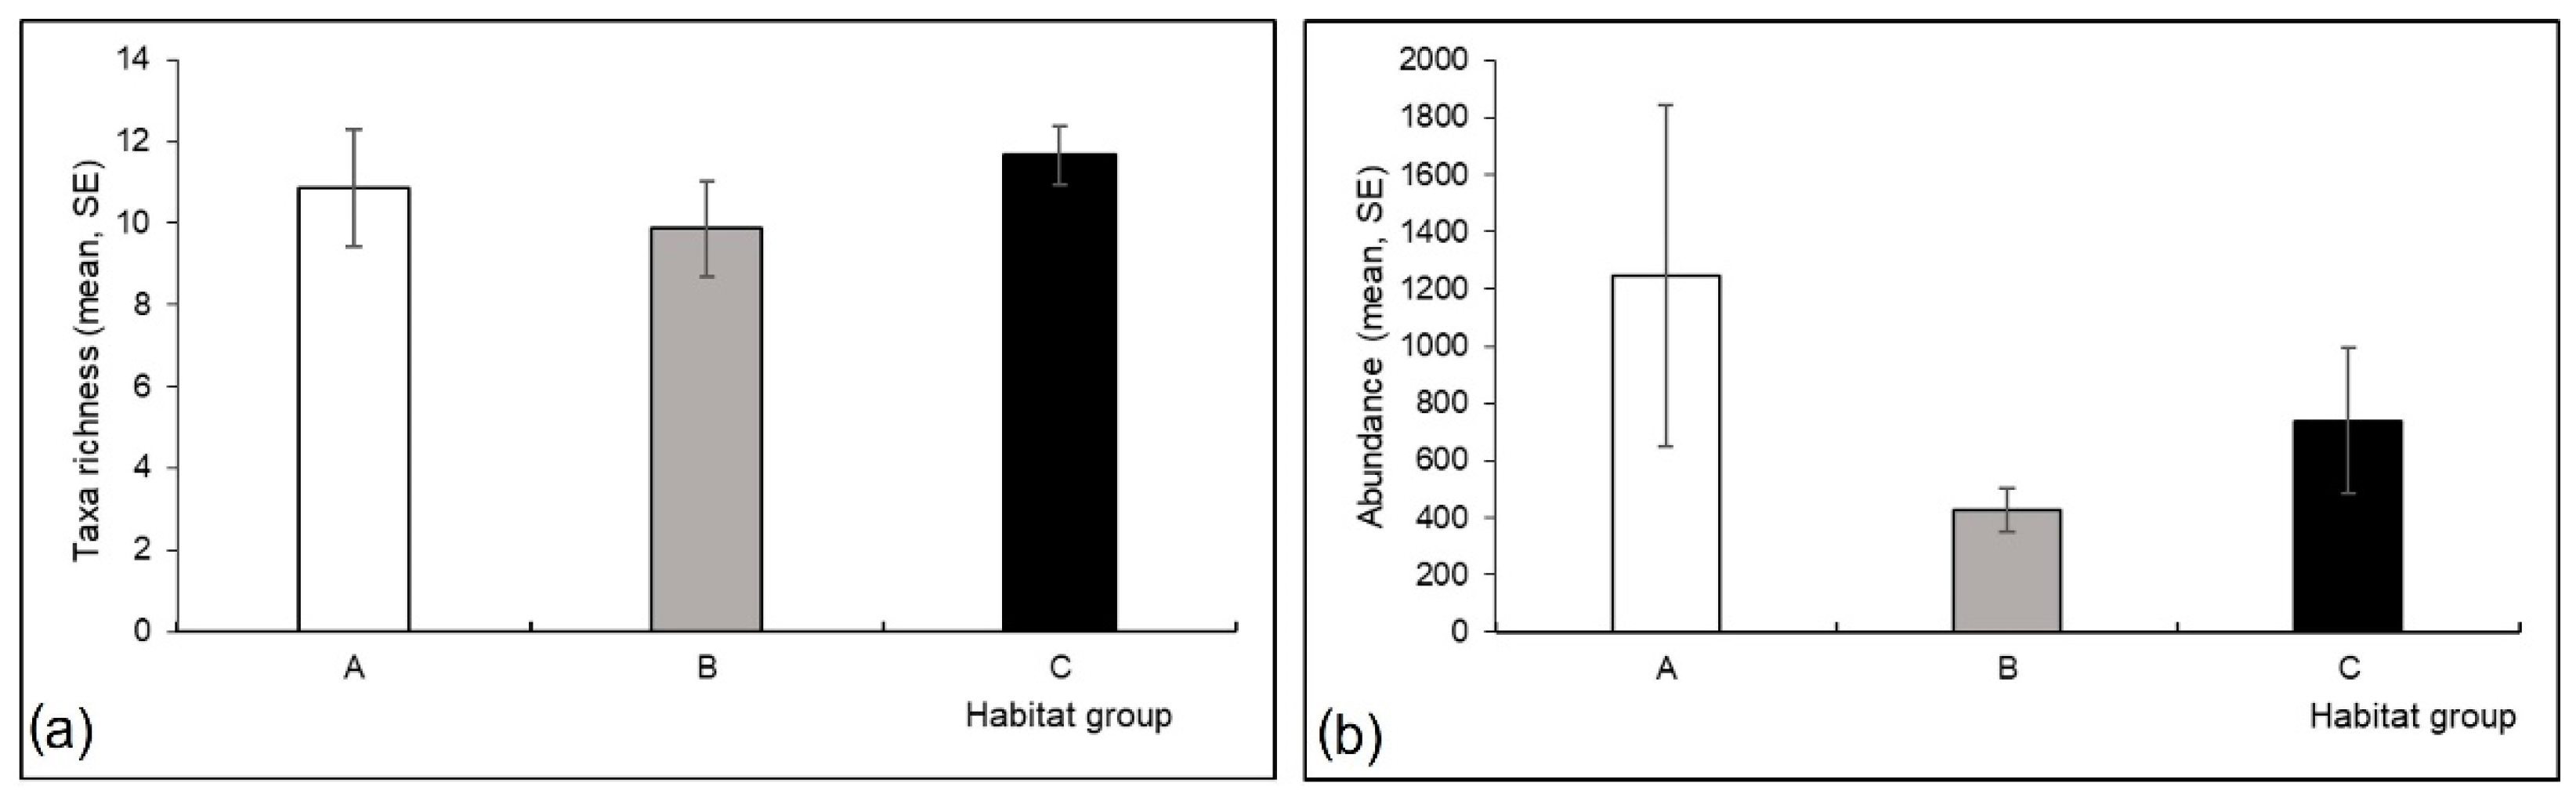
3.3. Mayfly Assemblages

A total of 22 species was identified (Table 2). Baetis fuscatus, Baetis buceratus, Baetis rhodani, Baetis vernus, Procloeon bifidum, Heptagenia flava, Habrophlebia lauta, Serratella ignita, Caenis luctuosa, and Caenis cf. pseudorivulorum were present at all three habitat groups, with Baetis fuscatus being the most abundant (Table 2). Cloeon dipterum was the rarest species, occurring in low abundance only in habitat group C (Table 2).
No significant differences were found among the three habitat groups in terms of taxa richness (Kruskal-Wallis H test; H (2, N = 19) = 0.36, p = 0.84) and abundance (H (2, N = 19) = 0.84, p = 0.66). Nevertheless, taxa richness and abundance were lower in group B compared to the other two groups (Figure 7).
In NMDS analysis, mayfly assemblages mostly did not group based on the habitat group they belong to (Figure 8).
The structure of mayfly assemblages was similar in all three habitat groups (Figure 9). Compared to the other habitat groups, there was a slightly higher proportion of grazers in group B, gatherers in group C, and active filter feeders in group A (Figure 9a). At all three sites, a domination of species characteristic for hyporhithral and epipotamal river sections were recorded (Figure 9b,c). Group A had a slightly higher proportion of species associated with rhithral river sections (Figure 9b), while groups B and C had a slightly higher proportion of species associated with potamal river sections (Figure 9c).

3.4. Mayflies and Environmental Variables

Positive correlations of mayfly taxa richness were found with water temperature (R = 0.38, p = 0.001), oxygen saturation (R = 0.33, p = 0.004), pH (R = 0.24, p = 0.04), biological oxygen demand (R = 0.25, p = 0.03), chemical oxygen demand (R = 0.25, p = 0.03), nitrate concentration (R = 0.29, p = 0.01), and total nitrogen (R = 0.24, p = 0.04). Negative correlations were found between mayfly taxa richness and near natural land-use (R = −0.34, p = 0.004), while positive correlations were found with morphological modification score (R = 0.36, p = 0.002), distance from source (R = 0.29, p = 0.01), and extensive agriculture (R = 0.29, p = 0.01).
Positive correlations of mayfly abundance were recorded with oxygen saturation (R = 0.39, p = 0.001), water temperature (R = 0.36, p = 0.002), water velocity (R = 0.32, p = 0.01), pH (R = 0.33, p = 0.01), nitrate concentration (R = 0.27, p = 0.02), and total nitrogen (R = 0.26, p = 0.03). Mayfly abundance negatively correlated with near natural land-use (R = −0.26, p = 0.03), while positive correlations were found for extensive agriculture (R = 0.31, p = 0.01) and distance from source (R = 0.31, p = 0.01).
Abundance of majority of recorded mayfly species showed significant correlations with measured water quality parameters (Table 3 and Table 4) and natural and anthropogenic variables (Table 5).
The results of the ordination of species and environmental data of the CCA are presented on the F1 × F2 ordination plot (Figure 10). The eigenvalues for the first two CCA axes were 0.49 and 0.31, explaining 27.4% of the species–environment relations. The Monte Carlo permutation test showed that the species–environment ordination was significant (first axis: F-ratio = 10.64, p = 0.002; overall: trace = 1.44, F = 3.52, p = 0.002), indicating that mayfly assemblages were significantly related to the tested set of environmental variables. Axis 1 was related to urban land use (R = −0.80) and water temperature (R = −0.78), and axis 2 to water depth (R = −0.80) and nitrite concentration (R = −0.32), indicating that these were the most important parameters in explaining patterns of mayfly assemblages (Figure 10).

3.5. Mayfly Species and Microhabitats

Baetis fuscatus was significantly more abundant in microlithal compared to psammal (Kruskal-Wallis H test and Multiple comparisons post hoc test; H (8, N = 62) = 21.25, p = 0.007), while Heptagenia flava was significantly more abundant in xylal compared to akal (H (8, N = 35) = 23.86, p = 0.002).
Baetis fuscatus was more abundant in microhabitats with higher water velocity (R = 0.62, p = 0.000) and water depth (R = 0.23, p = 0.05), Baetis rhodani was more abundant in microhabitats with higher water velocity (R = 0.31, p = 0.008) and lower water depth (R = −0.28, p = 0.02), and Procloeon bifidum was more abundant in microhabitats with lower water velocity (R = −31, p = 0.007) and higher water depth (R = 0.32, p = 0.006).
Microhabitats with lower water depth were associated with Baetis vernus (R = −0.35, p = 0.003) and Electrogena ujhelyii (R = −0.40, p = 0.0005), and microhabitats with higher water depth were associated with Caenis luctuosa (R = 0.35, p = 0.002), Caenis cf. pseudorivulorum (R = 0.33, p = 0.004), Ephemera lineata (R = 0.36, p = 0.002), and Potamanthus luteus (R = 0.44, p = 0.0001).
Centroptilum luteolum (R = −0.23, p = 0.049) and Cloeon dipterum were recorded at microhabitats with lower water velocity (R = −0.32, p = 0.008), while Serratella ignita was associated with microhabitats with higher water velocity (R = 0.38, p = 0.001).

4. Discussion

Despite the present hydromorphological alterations, with approximately a quarter (26%) of the Croatian mayfly fauna [48], mayfly assemblages in the studied lotic system can be considered species-rich when compared to some other anthropogenically impacted lowland lotic habitats [16,49]. However, this could be a result of the sampling effort, which included a large number of study sites along the Bednja River system. The most abundant and widespread species was Baetis fuscatus, a lotic species commonly found in the main river channel of lowland running waters [16,22]. Cloeon dipterum–a eurytopic species with lentic preference, characterized by high ecological tolerance to habitat disturbance [22,50]–was the rarest in our study, occurring only in habitats with the highest degree of hydromorphological degradation, where it was associated with microhabitats with lower water velocity. Interestingly, no representatives of the genera Rhithrogena and Epeorus were found in our study. This could be due to the late sampling period, but also to the range of water velocity and substrate composition which are not optimal for representatives of these taxa as they are mostly litho-rheobiontic, i.e., they usually prefer riffle zones of fast-flowing streams with stony bottoms [11,21,22]. In addition, most Rhithrogena species have a rather low tolerance to organic pollution [11], which could have also influenced their absence in the studied river system.
No relevant differences were found among the three hydromorphological habitat groups in abiotic parameters, mayfly assemblage composition, or functional traits, although mayfly abundance was slightly higher in the non-altered habitat group. Previous studies have shown that anthropogenic disturbances such as river channelization, impoundment, eutrophication, pollution, and microhabitat homogeneity have negative effects on assemblages of aquatic insects, including mayflies [12,15,16,51,52]. No significant differences in taxa richness among hydromorphological habitat groups could be partially explained by high drifting potential of mayfly nymphs [26]. For mayflies, drift may represent a means by which nymphs move to more optimal habitats, e.g., by colonization of new downstream sites, especially following floods or pollution events [53]. The lotic system studied includes a mosaic of near-natural sites, and those with moderate or severe hydromorphological alterations. Therefore, some of the mayfly species collected in low numbers in highly altered habitat group (e.g., Baetis liebenauae, Ecdyonurus macani, Paraleptophlebia submarginata) may have been collected during their downstream drift to more suitable habitats, or might have drifted into the main river channel from some of the numerous tributaries connected to the Bednja River. However, this should be further investigated in future studies with more frequent (i.e., monthly) sampling efforts. The Bednja River system still has a relatively diverse microhabitat composition at most study sites, which may have provided adequate conditions for the mayflies recorded despite the challenges of habitat hydromorphological alterations they face, similar to the study by Vilenica et al. [12].
However, some differences among habitat groups were observed at the species level: several species with moderate (e.g., Baetis fuscatus, Serratella ignita, Electrogena ujhelyii) to strong rhithral affinity (Baetis vernus, Habrophlebia lauta) [22,54] were predominantly associated with near-natural sites (with little or no hydromorphological degradation), while some eurytopic (e.g., Baetis rhodani) and species characteristic for potamal river regions and lentic habitats (e.g., Cloeon dipterum, Procloeon bifidum, Centroptilum luteolum, Caenis luctuosa) were more abundant at sites with moderate or severe hydromorphological alteration [22,55,56].
Our results suggest that mayflies are more strongly related to physico-chemical water parameters along the longitudinal gradient and microhabitat heterogeneity than with hydromorphological alterations in the studied lotic system. The study by Vidaković Maoduš et al. [57] showed that there is an increasing longitudinal gradient in some of the measured water parameters (water temperature, oxygen saturation, water velocity, pH, nutrients) along the Bednja River system. Therefore, we observed a link between higher mayfly species richness and abundance in the studied lotic system and higher water temperature and oxygen saturation, higher water velocity and lower depth, and higher nutrient concentration (e.g., various nitrogen forms). For this reason, mayfly assemblages were also significantly related to distance from the river source and extensive agricultural and urban land-use. Mayflies can be found at both lotic and lentic habitats, although a higher number of species are restricted to running waters [11,15,50]. In lotic habitats, the mayfly species richness is lowest in sources of streams and rivers–habitats characterized by low water temperatures. Their assemblages tend to be more diverse with the longitudinal increase in water temperature [12,13,17,58]. In addition, most mayfly species require well-oxygenated water [11,12,13], which is often associated with higher water velocity in lotic habitats. Associations with abiotic parameters were also observed at the species level, e.g., several species that prefer moderate and warm water (>10 °C), such as Baetis buceratus and Procloeon bifidum, were associated with habitats with warmer water [21,22]. Some eurytherm species (such as Baetis fuscatus, Baetis liebenauae, Baetis lutheri, Cloeon dipterum, Heptagenia longicauda, Potamanthus luteus, Serratella ignita, Caenis cf. pseudorivulorum, and Caenis luctuosa) correlated positively with water temperature, while some of them (e.g., Baetis vernus, Habrophlebia lauta) [21,22] were associated with habitats with lower water temperature. The rheo to limnophil Baetis fuscatus, Baetis buceratus, Baetis liebenauae, and Serratella ignita were associated with sites with higher water velocity, while the limnophil Centroptilum luteolum, Cloeon dipterum, Electrogena ujhelyii, the limno to rheophile Habrophlebia lauta, and the rheo to limnophil Procloeon bifidum were associated with sites with lower water velocity [21,22,59].
Higher nutrient concentrations derived from agricultural fields and urban areas in the Bednja River catchment may have enhanced primary production (e.g., higher macrophyte and algae development) in the studied system [60], providing more food for grazers [11,14], which, along with collectors, were the dominant feeding guild at all three habitat groups. Nevertheless, increasing nutrient inputs to the aquatic habitats may have long-term negative consequences, leading to severe eutrophication that could negatively influence inhabiting biota [61]. Baetis buceratus, Baetis fuscatus, Heptagenia longicauda, Potamanthus luteus, Serratella ignita, Caenis cf. pseudorivulorum, and Caenis luctuosa showed positive correlations with nutrient concentrations in water, indicating their tolerance to water pollution. On the other hand, the negative associations of Baetis rhodani, Baetis vernus, Procloeon pennulatum, Electrogena ujhelyii, and Habrophlebia lauta with nutrients in their habitats could indicate their sensitivity to water pollution and eutrophication.
In the studied system, most species that showed a significant association with specific microhabitat components (substrate type, water velocity and/or depth) are known to be generalists, i.e., they are found on different substrates [21,22]. This was confirmed in our study, as most of these species were not associated with a specific substrate type, but with the water depth and/or velocity at the available microhabitats. However, some of them were associated with specific substrates, such as Heptagenia flava, which was most abundant at microhabitats with xylal, and Baetis fuscatus, which was most abundant in microhabitats with microlithal, higher water velocity and water depth. We also recorded several microhabitat specialists, such as Ephemera lineata–a specialist for microhabitats with psammal [21,22]–which was most abundant at microhabitats with higher water depth, associated with fine substrate in the studied system. Centroptilum luteolum, a specialist for microhabitats with macrophytes [21,22], was most abundant in microhabitats with lower water velocity, but mostly associated with different inorganic substrates. Microhabitat heterogeneity, in addition to physical and chemical water properties, is another key factor that shapes mayfly assemblages [14,62,63], as it allows their nymphs to seek refuge from predators and find sufficient food resources [14,64,65]. Organic substrates (especially macrophytes) and coarse inorganic sediment are important habitat segments for nymphs of various mayfly species [11,14,17], as they trap organic matter and provide a habitat for periphyton [65,66,67], which is an important food resource for mayfly nymphs.

5. Conclusions

Hydromorphological habitat modifications are known to have negative consequences on mayflies in lotic habitats, however, in our study, more relevant differences in species composition resulted from the interplay of water abiotic factors and catchment land-use. Moreover, despite the hydromorphological alterations, the high number of tributaries and the microhabitat heterogeneity observed along the studied river may have influenced the relatively high mayfly species richness, not only in near-natural sites, but also in those belonging to moderately and highly modified habitat groups. To successfully assess the environmental quality of riverine habitats, it is essential to obtain detailed knowledge of their assemblages, and the relationship between the biota and environmental variables. Mayflies are among the most commonly used taxa in biomonitoring programs worldwide due to their bioindicative properties. Therefore, our results can contribute to the planning of management and conservation activities for lowland rivers and their biota according to the requirements of the European Water Framework Directive.

Supplementary Materials

The following supporting information can be downloaded at: https://www.mdpi.com/article/10.3390/insects13050436/s1, Table S1: Dominant microhabitats (covering > 5% of sampling area) sampled at each study site. Legend: MACRO = Macrolithal (coarse blocks), MESO = Mesolithal (hand-sized cobbles), MICRO = Microlithal (coarse gravel), AKAL = Akal (fine to medium-sized gravel), PSA = Psammal (sand), ARG = Argyllal (clay), PHY = phytal (macrophytes; submerged and emergent), XYL = Xylal (woody debris), CPOM = deposits of coarse particulate organic matter, TECHNO = Technolithal (artificial blocks). The sampled phytal (macrophytes) is as follows: Study site 2-emergent reeds and emergent broad-leaved angiosperms. Study site 7-algae and fine-leaved submerged angiosperms. Study site 11-submerged fine-leaved angiosperms. Study site 17-emergent reeds and amphibious angiosperms. * Technolithal covered with moss.

Author Contributions

Conceptualization, M.V., I.V.M. and Z.M.; methodology, M.V., I.V.M. and Z.M.; formal analysis, M.V., investigation, I.V.M., M.V. and Z.M. resources, Z.M.; data curation, M.V., I.V.M. and Z.M., writing—original draft preparation, M.V. and I.V.M., writing—review and editing, M.V., I.V.M. and Z.M., visualization, M.V. and I.V.M. supervision, M.V. and Z.M.; project administration, M.V., I.V.M. and Z.M.; funding acquisition, I.V.M. and Z.M. All authors have read and agreed to the published version of the manuscript.

Funding

This research received no external funding.

Institutional Review Board Statement

Not applicable.

Data Availability Statement

The data presented in this study are available on request from the authors.

Acknowledgments

We thank the two anonymous reviewers and the academic editor whose suggestions improved this paper.

Conflicts of Interest

The authors declare no conflict of interest.

References

  1. Brookes, A. Channelized Rivers: Perspectives for Environmental Management; Wiley: Chichester, UK; New York, NY, USA, 1988; pp. 1–326. [Google Scholar]
  2. Raven, P.J.; Fox, P.; Everard, M.; Holmes, N.T.H.; Dawson, F.H. River Habitat Survey: A New System for Classifying Rivers According to Their Habitat Quality. In Freshwater Quality: Defining the Indefinable; Boon, P.J., Howell, D.L., Eds.; HMSO: Edinburgh, UK, 1997; pp. 215–234. [Google Scholar]
  3. Lorenz, A.; Hering, D.; Feld, C.K.; Rolauffs, P. A New Method for Assessing the Impact of Hydromorphological Degradation on the Macroinvertebrate Fauna of Five German Stream Types. Hydrobiologia 2004, 516, 107–127. [Google Scholar] [CrossRef]
  4. Urbanič, G. Hydromorphological Degradation Impact on Benthic Invertebrates in Large Rivers in Slovenia. Hydrobiologia 2014, 729, 191–207. [Google Scholar] [CrossRef]
  5. Erba, S.; Buffagni, A.; Holmes, N.; O’Hare, M.; Scarlett, P.; Stenico, A. Preliminary Testing of River Habitat Survey Features for the Aims of the WFD Hydro-Morphological Assessment: An Overview from the STAR Project. Hydrobiologia 2006, 566, 281–296. [Google Scholar] [CrossRef]
  6. Feld, C.K.; Hering, D. Community Structure or Function: Effects of Environmental Stress on Benthic Macroinverte-Brates at Different Spatial Scales. Freshw. Biol. 2007, 52, 1380–1399. [Google Scholar] [CrossRef]
  7. Urbanič, G.; Mihaljević, Z.; Petkovska, V.; Pavlin Urbanič, M. Disentangling the Effects of Multiple Stressors on Large Rivers Using Benthic Invertebrates—A Study of Southeastern European Large Rivers with Implications for Management. Water 2020, 12, 621. [Google Scholar] [CrossRef] [Green Version]
  8. Schinegger, R.; Trautwein, C.; Melcher, A.; Schmutz, S. Multiple Human Pressures and Their Spatial Patterns in European Running Waters. Water Environ. J. 2012, 26, 261–273. [Google Scholar] [CrossRef] [Green Version]
  9. Horsák, M.; Bojková, J.; Zahrádková, S.; Omesová, M.; Helešic, J. Impact of Reservoirs and Channelization on Lowland River Macroinvertebrates: A Case Study from Central Europe. Limnologica 2009, 39, 140–151. [Google Scholar] [CrossRef] [Green Version]
  10. Sartori, M.; Brittain, J.E. Order Ephemeroptera. In Thorp and Covich’s Freshwater Invertebrates: Ecology and General Biology, 4th ed.; Thorp, J., Rodgers, D.C., Eds.; Academic Press: New York, NY, USA, 2015; pp. 873–891. [Google Scholar]
  11. Bauernfeind, E.; Soldán, T. The Mayflies of Europe (Ephemeroptera); Apollo Books: Ollerup, Denmark, 2012; pp. 1–781. [Google Scholar]
  12. Vilenica, M.; Previšić, A.; Ivković, M.; Popijač, A.; Vučković, I.; Kučinić, M.; Kerovec, M.; Gattolliat, J.-L.; Sartori, M.; Mihaljević, Z. Mayfly (Insecta: Ephemeroptera) Assemblages of a Regulated Perennial Mediterranean River System in the Western Balkans. Biologia 2016, 71, 1038–1048. [Google Scholar] [CrossRef]
  13. Vilenica, M.; Mičetić Stanković, V.; Sartori, M.; Kučinić, M.; Mihaljević, Z. Environmental Factors Affecting Mayfly Assemblages in Tufa-Depositing Habitats of the Dinaric Karst. Knowl. Manag. Aquat. Ecosyst. 2017, 418, 14. [Google Scholar] [CrossRef] [Green Version]
  14. Vilenica, M.; Brigić, A.; Sartori, M.; Mihaljević, Z. Microhabitat Selection and Distribution of Functional Feeding Groups of Mayfly Larvae (Ephemeroptera) In Lotic Karst Habitats. Knowl. Manag. Aquat. Ecosyst. 2018, 419, 17. [Google Scholar] [CrossRef] [Green Version]
  15. Vilenica, M.; Vučković, N.; Mihaljević, Z. Littoral Mayfly Assemblages in South-East European Man-Made Lakes. J. Limnol. 2019, 78, 49–59. [Google Scholar] [CrossRef]
  16. Vilenica, M.; Kerovec, M.; Pozojević, I.; Mihaljević, Z. Mayfly Response to Different Stress Types in Small and Mid-Sized Lowland Rivers. ZooKeys 2020, 980, 57–77. [Google Scholar] [CrossRef] [PubMed]
  17. Bauernfeind, E.; Moog, O. Mayflies (Insecta: Ephemeroptera) and the Assessment of Ecological Integrity: A Methodological Approach. Hydrobiologia 2000, 422, 71–83. [Google Scholar] [CrossRef]
  18. Brittain, J.E.; Sartori, M. Ephemeroptera (Mayflies). In Encylopedia of Insects; Resh, V.H., Cardé, R.T., Eds.; Academic Press: Amsterdam, The Netherlands, 2003; pp. 373–380. [Google Scholar]
  19. Lamp, W.O.; Britt, N.W. Resource Partitioning by Two Species of Stream Mayflies (Ephemeroptera: Heptageniidae). Great Lakes Entomol. 1981, 14, 151–157. [Google Scholar]
  20. Buffagni, A.; Crosa, G.; Marchetti, R. Size-Related Shift in the Physical Habitat in Two Mayfly Species (Ephemeroptera). Freshw. Biol. 1995, 34, 297–302. [Google Scholar] [CrossRef]
  21. Buffagni, A.; Cazzola, M.; López-Rodríguez, M.J.; Alba-Tercedor, J.; Armanini, D.G. Volume 3—Ephemeroptera. In Distribution and Ecological Preferences of European Freshwater Organisms; Schmidt-Kloiber, A., Hering, D., Eds.; Pensoft Publishers: Sofia, Bulgaria; Moscow, Russia, 2009; pp. 1–254. [Google Scholar]
  22. Buffagni, A.; Armanini, D.G.; Cazzola, M.; Alba-Tercedor, J.; López-Rodríguez, M.J.; Murphy, J.; Sandin, L.; Schmidt-Kloiber, A. Dataset “Ephemeroptera”. The Taxa and Autecology Database for Freshwater Organisms. Version 8.0. Available online: https://www.freshwaterecology.info/ (accessed on 25 March 2022).
  23. Schmidt-Kloiber, A.; Hering, D. www.freshwaterecology.info—An Online Tool That Unifies, Standardises and Codifies More than 20,000 European Freshwater Organisms and Their Ecological Preferences. Ecol. Indic. 2015, 53, 271–282. [Google Scholar] [CrossRef]
  24. Elliott, J.M.; Humpesch, U.H.; Macan, T. Larvae of the British Ephemeroptera: A Key with Ecological Notes; Scientific Publication No. 49; Freshwater Biological Association: Cumbria, UK, 1988; pp. 1–145. [Google Scholar]
  25. Elosegi, A.; Díez, J.; Mutz, M. Effects of Hydromorphological Integrity on Biodiversity and Functioning of River Ecosystems. Hydrobiologia 2019, 657, 199–215. [Google Scholar] [CrossRef]
  26. Sertić Perić, M.; Matoničkin Kepčija, R.; Miliša, M.; Gottstein, S.; Lajtner, J.; Dragun, Z.; Filipović Marijić, V.; Krasnići, N.; Ivanković, D.; Erk, M. Benthos-Drift Relationships as Proxies for the Detection of the Most Suitable Bioindicator Taxa in Flowing Waters—A Pilot-Study within a Mediterranean Karst River. Ecotoxicol. Environ. Saf. 2018, 163, 125–135. [Google Scholar] [CrossRef]
  27. Reid, D.; Church, M. Geomorphic and Ecological Consequences of Riprap Placement in River Systems. J. Am. Water Resour. Assoc. 2015, 51, 1043–1059. [Google Scholar] [CrossRef]
  28. Landa, V.; Soldán, T. Mayflies as Bioindicators of Water Quality and Environmental Change on a Regional and Global Scale. In Current Directions in Research on Ephemeroptera; Corkum, L.D., Ciborowski, J.J.H., Eds.; Canadian Scholars’ Press Inc.: Toronto, ON, Canada, 1995; pp. 21–29. [Google Scholar]
  29. Alexander, L.C.; Lamp, W.O. Mayfly Population Density, Persistence and Genetic Structure in Fragmented Headwaters Habitats. In International Advances in the Ccology, Zoogeography and Systematics of Mayflies and Stoneflies; Hauer, F.R., Stanford, J.A., Newell, R.L., Eds.; University of California Press: Berkeley, CA, USA, 2008; pp. 39–50. [Google Scholar]
  30. Sowa, R. Jetki Ephemeroptera. In A Checklist of Rare and Endangered Animals in Poland; Glowacinski, Z., Ed.; Nature Protection Research Centre, PAS: Krakow, Poland, 1992; pp. 97–101. [Google Scholar]
  31. Sartori, M.; Landolt, P.; Zurwerra, A. Liste rouge des éphémères de Suisse (Ephemeroptera). In Liste Rouge des Espèces Animales Menacées de Suisse; Duelli, P., Ed.; OFEFP: Berne, Switzerland, 1994; pp. 72–74. [Google Scholar]
  32. Haybach, A.; Malzacher, P. Eintagsfliegen (Ephemeroptera). In Entomofauna Germanica. Band 6; Entomologische Nachrichten und Berichte, Beiheft 7: Dresden, Germany, 2006; pp. 33–46. [Google Scholar]
  33. Hughes, R.M.; Larsen, D.P.; Omemik, J.M. Regional Reference Sites: A Method for Assessing Stream Pollution. Environ. Manag. 1986, 10, 629–635. [Google Scholar] [CrossRef]
  34. Stoddard, J.L.; Herlihy, A.T.; Peck, D.V.; Hughes, R.M.; Whittier, T.R.; Tarquinio, E. A Process for Creating Multimetric Indices for Large-Scale Aquatic Surveys. J. N. Am. Benthol. Soc. 2008, 27, 878–891. [Google Scholar] [CrossRef]
  35. Šegota, T.; Filipčić, A. Köppenova Podjela Klima i Hrvatsko Nazivlje. Geoadria 2003, 8, 17–37. [Google Scholar] [CrossRef] [Green Version]
  36. Čanjevac, I. Typology of Discharge Regimes of Rivers in Croatia. Hrvat. Geogr. Glas. 2013, 75, 23–42. [Google Scholar] [CrossRef]
  37. APHA. Standard Methods for the Examination of Water and Wastewater, 18th ed.; American Public Health Association: Washington, DC, USA, 1992. [Google Scholar]
  38. HAOP, Hrvatska Agencija za Okoliš u Prirodu. Pokrov i Namjena Korištenja Zemljišta; Corine Land Cover: Zagreb, Croatia, 2012. [Google Scholar]
  39. ESRI. ArcMap Version 10.0; ArcInfo License: Redlands, CA, USA, 2010. [Google Scholar]
  40. EN 15843 Water Quality. Guidance Standard on Determining the Degree of Modification of River Hydromorphology; CEN: Brussels, Belgium, 2010. [Google Scholar]
  41. AQEM Consortium. Manual for the Application of the AQEM Method. A Comprehensive Method to Assess European Streams Using Benthic Macroinvertebrates, Developed for the Purpose of the Water Framework Directive; Version 1.0; The AQEM Consortium: Duisburg-Essen, Germany, 2002. [Google Scholar]
  42. Müller-Liebenau, I. Revision der Europäischen Arten der Gattung Baetis Leach, 1815. (Insecta, Ephemeroptera). Gewässer Abwässer 1969, 49, 1–214. [Google Scholar]
  43. Malzacher, P. Die Europäischen Arten der Gattung Caenis Stephens (Insecta: Ephemeroptera). The European Species of the Genus Caenis Stephens (Insecta: Ephemeroptera). Stuttg. Beitr. Naturkd. 1984, 373, 1–48. [Google Scholar]
  44. Bauernfeind, E.; Humpesch, U.H. Die Eintagsfliegen Zentraleuropas–Bestimmung und Ökologie; NMW: Vienna, Austria, 2010; pp. 1–250. [Google Scholar]
  45. StatSoft. Statistica 10.0 for Windows; StatSoft Inc.: Tulsa, OK, USA, 2010. [Google Scholar]
  46. Clarke, K.R.; Gorley, R.N. Primer V6: User Manual/Tutorial; Plymouth: New Zealand, Auckland, 2006. [Google Scholar]
  47. ter Braak, C.J.F.; Smilauer, P. CANOCO Reference Manual and User’s Guide: Software for Ordination, Version 5.0; Microcomputer Power: Ithaca, NY, USA, 2012. [Google Scholar]
  48. Vilenica, M.; Ternjej, I.; Mihaljević, Z. What is New in Croatian Mayfly Fauna? Nat. Croat. 2021, 30, 73–83. [Google Scholar] [CrossRef]
  49. Zedková, B.; Rádková, V.; Bojková, J.; Soldán, T.; Zahrádková, S. Mayflies (Ephemeroptera) as Indicators of Environmental Changes in the past Five Decades: A Case Study from the Morava and Odra River Basins (Czech Republic). Aquat. Conserv. 2015, 25, 622–638. [Google Scholar] [CrossRef]
  50. Vilenica, M.; Brigić, A.; Kerovec, M.; Gottstein, S.; Ternjej, I. Spatial Distribution and Seasonal Changes of Mayflies (Insecta, Ephemeroptera) In a Western Balkan Peat Bog. ZooKeys 2016, 637, 135–149. [Google Scholar] [CrossRef]
  51. Axelsson, E.P.; Hajalten, J.; Leroy, C.J.; Whitham, T.G.; Julkunen-Tiitto, R.; Wennstrom, A. Leaf Litter from Insect-Resistant Transgenic Trees Causes Changes in Aquatic Insect Community Composition. J. Appl. Ecol. 2011, 48, 1472–1479. [Google Scholar] [CrossRef]
  52. Ligeiro, R.; Hughes, R.M.; Kaufmann, P.R.; Macedo, D.R.; Firmiano, K.R.; Ferreira, W.R.; Oliveira, D.; Melo, A.S.; Callisto, M. Defining Quantitative Stream Disturbance Gradients and the Additive Role of Habitat Variation to Explain Macroinvertebrate Taxa Richness. Ecol. Indic. 2013, 25, 45–57. [Google Scholar] [CrossRef] [Green Version]
  53. Gayraud, S.; Philippe, M.; Maridet, L. The Response of Benthic Macroinvertebrates to Artificial Disturbance: Drift or Vertical Move-Ment in the Gravel Bed of Two Sub-Alpine Streams? Arch. Hydrobiol. 2000, 147, 431–446. [Google Scholar] [CrossRef]
  54. Biss, R.; Kübler, P.; Pinter, I.; Braukmann, U. Leitbildbezogenes Biozönotisches Bewertungsverfahren für Fließgewässer (aquatischer Bereich) in der Bundesrepublik Deutschland. Ein erster Beitrag zur integrierten ökologischen Fließgewässerbewertung. Umweltbundesamt Texte 62/02; Umweltbundesamt: Berlin, Germany, 2002; pp. 1–175. [Google Scholar]
  55. Schöll, F.; Haybach, A.; König, B. Das Erweiterte Potamontypieverfahren zur Ökologischen Bewertung von Bundeswasserstraßen (Fließgewässertypen 10 und 20: Kies-und Sandgeprägte Ströme, Qualitätskomponente Makrozoobenthos) nach Maßgabe der EU-Wasserrahmenrichtlinie. Hydrol. Wasserwirtsch. 2005, 49, 234–247. [Google Scholar]
  56. Leitner, P.; Lorenz, A. (Ephemeroptera): Additional Ecological Preferences and Biological Traits Classification for freshwaterecology.info. Version 8.0. Available online: https://www.freshwaterecology.info/fwe_referenceall.php?p=b2c9bXpiI3BhcmFtPTEzNg==#15 (accessed on 13 April 2022).
  57. Vidaković Maoduš, I.; Pozojević, I.; Vilenica, M.; Mihaljević, Z. Longitudinal Dynamics of Odonata Assemblages in an Anthropogenically Impacted Lotic System. Ann. Limnol. Int. J. Lim. 2022; in press. [Google Scholar] [CrossRef]
  58. Vilenica, M.; Bilić, M.; Mičetić Stanković, V.; Kučinić, M. Mayfly Ecological Traits in a European Karst Spring: Species, Microhabitats and Life Histories. Community Ecol. 2018, 19, 248–258. [Google Scholar] [CrossRef]
  59. Schmedtje, U.; Colling, M. Ökologische Typisierung der Aquatischen Makrofauna. Informationsberichte des Bayerischen Landesamtes für Wasserwirtschaft 4/96; Bayerisches Landesamt für Wasserwirtschaft (Herausgeber und Verlag): München, Germany, 1996; pp. 1–543. [Google Scholar]
  60. Boeykens, S.P.; Piol, M.N.; Samudio Legal, L.; Saralegui, A.B.; Vázquez, C. Eutrophication Decrease: Phosphate Adsorption Processes in Presence of Nitrates. J. Environ. Manag. 2017, 203, 888–895. [Google Scholar] [CrossRef]
  61. Cook, S.C.; Housley, L.; Back, J.A.; King, R.S. Freshwater Eutrophication Drives Sharp Reductions in Temporal Beta Diversity. Ecology 2018, 99, 47–56. [Google Scholar] [CrossRef]
  62. Leitner, P.; Hauer, C.; Ofenböck, T.; Pletterbauer, F.; Schmidt-Kloiber, A.; Graf, W. Fine Sediment Deposition Affects Biodiversity and Density of Benthic Macroinvertebrates: A Case Study in the Freshwater Pearl Mussel River Waldaist (Upper Austria). Limnologica 2015, 50, 54–57. [Google Scholar] [CrossRef]
  63. Sroka, P.; Klecka, J.; Boukal, D.S. Spatial Heterogeneity and Habitat Permanence Affect Community Assembly but Not Phenology of Mayflies (Ephemeroptera) In Sandpit Pools. Zoosymposia 2016, 11, 205–218. [Google Scholar] [CrossRef]
  64. Hawkins, C.P. Substrate Associations and Longitudinal Distributions in Species of Ephemerellidae (Ephem-Eroptera: Insecta) from Western Oregon. Freshw. Invertebr. Biol. 1985, 4, 181–188. [Google Scholar]
  65. Dedieu, N.; Rhone, M.; Vigouroux, R.; Céréghino, R. Assessing the Impact of Gold Mining in Headwater Streams of Eastern Amazonia Using Ephemeroptera Assemblages and Biological Traits. Ecol. Indic. 2015, 52, 332–340. [Google Scholar] [CrossRef]
  66. Miliša, M.; Habdija, I.; Primc-Habdija, B.; Radanović, I.; Matoničkin Kepčija, R. The Role of Flow Velocity in the Vertical Distribution of Particulate Organic Matter on Moss-Covered Travertine Barriers of the Plitvice Lakes (Croatia). Hydrobiologia 2006, 553, 231–243. [Google Scholar] [CrossRef]
  67. Čerba, D.; Koh, M.; Vlaičević, B.; Turković Čakalić, I.; Milošević, D.; Stojković Piperac, M. Diversity of Periphytic Chironomidae on Different Substrate Types in a Floodplain Aquatic Ecosystem. Diversity 2022, 14, 264. [Google Scholar] [CrossRef]
Figure 1. Spatial distribution of the study sites and associated sub-catchments along the Bednja River and position of the catchment in northern Croatia (Pannonian lowland ecoregion, ER11).
Insects 13 00436 g001
Figure 2. Examples of the three morphological habitat types in a Pannonian lowland river: (A)—study sites 16 (top) and 20 (bottom), with natural riparian vegetation and little or no physical alteration to the banks, no artificial substrate, and predominantly semi-natural surrounding land-use. (B)—study sites 10 (top) and 15 (bottom), with resectioned and realigned channel, steep banks with predominantly grass vegetation and individual trees, and agricultural land-use in surrounding areas. (C)—study sites 7 (top) and 19 (bottom), with modified channel with riprap reinforcement, and predominantly surrounding urban land-use.
Insects 13 00436 g002
Figure 3. Mean (and standard error, SE) values of environmental variables measured at three habitat groups in a Pannonian lowland river: (a) water depth (cm), (b) conductivity (µS/cm), (c) water velocity (m/s), (d) water temperature (°C), (e) oxygen saturation (%), (f) pH. Asterisk is for significant results. Habitat groups (A, B, C) are defined in Table 1.
Insects 13 00436 g003
Figure 4. Mean (and standard error, SE) values of environmental variables measured at three habitat groups in a Pannonian lowland river: (a) organic nitrogen concentration (mg N/L), (b) total nitrogen concentration (mg N/L), (c) ammonium concentration (mg N/L), (d) nitrite concentration (mg N/L), (e) nitrate concentration (mg N/L), (f) Kjedahl nitrogen concentration (mg N/L). Habitat groups (A, B, C) are defined in Table 1.
Insects 13 00436 g004
Figure 5. Mean (and standard error, SE) values of environmental variables measured at three habitat groups in a Pannonian lowland river: (a) chemical oxygen demand (mg O2/L), (b) biological oxygen demand (mg O2/L), (c) orthophosphate concentration (mg P/L), (d) total phosphorous concentration (mg P/L). Habitat groups (A, B, C) are defined in Table 1.
Insects 13 00436 g005
Figure 6. Mean (and standard error, SE) values of (a) water velocity and (b) water depth in various microhabitats in a Pannonian lowland river. Asterisk is for significant results.
Insects 13 00436 g006
Figure 7. Mayfly assemblages at three studied habitat groups in a Pannonian lowland river: (a) taxa richness and (b) abundance (number of individuals per m2) (shown as mean with standard error, SE). Habitat groups (A, B, C) are defined in Table 1.
Insects 13 00436 g007
Figure 8. NMDS analysis of the study sites belonging to three habitat type groups in a Pannonian lowland river, based on the composition of mayfly fauna. Habitat groups (A, B, C) are defined in Table 1.
Insects 13 00436 g008
Figure 9. Mayfly assemblage structure at three habitat groups in a Pannonian lowland river (shown as mean with standard error, SE): (a) functional feeding guilds, and (b,c) longitudinal distribution associations. Habitat groups (A, B, C) are defined in Table 1.
Insects 13 00436 g009
Figure 10. F1 × F2 plane of Canonical correspondence analysis (CCA) based on 26 mayfly taxa and 11 environmental variables in a Pannonian lowland river. For taxa code abbreviations (triangle symbols) see Table 2.
Insects 13 00436 g010
Table 1. Investigated sites along a Pannonian lowland river, morphological modification scores, corresponding habitat group: Group A (score < 2.5; near-natural to slightly altered sites), group B (score between 2.5 and 3.5; slightly to moderately altered sites), and group C (score ˃ 3.5; highly to very highly altered sites), number of dominant microhabitats present at each site (covering > 5% of the site; see also Supplementary Table S1) and number of recorded mayfly taxa.
Study SiteMorphological Modification ScoreHabitat GroupNumber of MicrohabitatsNumber of Mayfly Taxa
11.78A64
23.00B37
32.22A610
41.44A35
53.89C37
64.56C411
74.22C48
82.78B37
92.78B35
103.22B28
114.11C312
122.89B413
132.89B48
142.11A310
152.89B311
161.67A512
175.00C211
182.44A410
193.67C210
201.22A410
Table 2. Mayfly taxa and their abundance (number of individuals per m2) recorded at three habitat groups in a studied Pannonian lowland river. Taxa codes are those used in the CCA analysis. Habitat groups (A, B, C) are defined in Table 1.
Mayfly Taxa/Habitat Group Taxa CodesABC
Baetis sp.B sp.200100159
Baetis fuscatus (Linnaeus, 1761)B fus610105266
Baetis buceratus Eaton, 1870B buc14828114
Baetis rhodani (Pictet, 1843)B rho423771
Baetis vernus Curtis, 1834B ver341619
Baetis liebenauae Keffermüller, 1974B lie4 5
Baetis lutheri Müller-Liebenau, 1967B lut 19
Centroptilum luteolum Müller, 1776C lut24
Cloeon dipterum (Linnaeus, 1761)C dip 1
Procloeon bifidum (Bengtsson, 1912)P bif125
Procloeon pennulatum Bengtsson, 1915P penn1 1
Heptageniidae Hept542
Ecdyonurus macani Thomas & Sowa, 1970E mac 3
Electrogena ujhelyii (Sowa, 1981)E ujh22 1
Heptagenia flava Rostock, 1878H fla214
Heptagenia longicauda (Stephens, 1836)H lon11
Leptophlebiidae Lept8 1
Habrophlebia lauta McLachlan, 1884H lau2922
Paraleptophlebia submarginata (Stephens, 1836)P sub 2
Ephemera danica Müller, 1764E dan2
Ephemera lineata Eaton, 1870E lin11
Potamanthus luteus (Linnaeus, 1767)P lut112
Serratella ignita (Poda, 1761)S ign1217169
Caenis sp. C sp.2 1
Caenis luctuosa (Burmeister, 1839)C luc9396
Caenis cf. pseudorivulorum Keffermüller, 1960C pse332
Abundance (individuals/m2) 1247415739
Taxa richness 221722
Table 3. Correlations of mayfly species abundance and environmental parameters measured in situ in a Pannonian lowland river. Positive correlations are shaded. Only significant results are shown.
Mayfly Taxa/Abiotic ParameterWater Temperature (°C) O2 %Conductivity (µS/cm)pHWater Depth (cm)Water Velocity (m/s)
Baetis fuscatusR = 0.57, R = 0.54, R = −0.25, R = 0.58, R = 0.67,
p = 0.000p = 0.000p = 0.03p = 0.000p = 0.000
Baetis buceratusR = 0.33, R = 0.25,
p = 0.004p = 0.04
Baetis rhodani R = −0.56,
p = 0.01
Baetis vernusR = −0.28, R = −0.26,
p = 0.02p = 0.03
Baetis liebenauaeR = 0.31, R = 0.25,
p = 0.01p = 0.04
Baetis lutheriR = 0.28, R = 0.38, R = −0.31,R = 0.31,
p = 0.02p = 0.001p = 0.01p = 0.01
Centroptilum luteolum R = −0.24, R = −0.25, R = −0.25,
p = 0.04p = 0.03p = 0.03
Cloeon dipterumR = 0.33, R = 0.29,R = −0.34,
p = 0.004p = 0.01p = 0.004
Procloeon bifidumR = 0.25, R = 0.39,R = −0.33,
p = 0.04p = 0.001p = 0.01
Electrogena ujhelyiiR = −0.53, R = 0.48,R = −0.37,R = −0.63, R = −0.26,
p = 0.000p = 0.000p = 0.002p = 0.000p = 0.03
Heptagenia longicaudaR = 0.32,
p = 0.01
Habrophlebia lautaR = −0.27, R = −0.28,R = −0.24,R = −0.29,
p = 0.03p = 0.02p = 0.04p = 0.02
Ephemera lineata R = 0.34,
p = 0.003
Potamanthus luteusR = 0.48, R = 0.33, R = 0.29, R = 0.29,
p = 0.000p = 0.01p = 0.01p = 0.02
Serratella ignitaR = 0.60, R = 0.51, R = 0.43,R = 0.31,R = 0.28,
p = 0.000p = 0.000p = 0.0001p = 0.01p = 0.02
Caenis luctuosaR = 0.44, R = 0.25, R = 0.27, R = 0.26,
p = 0.0001p = 0.03p = 0.02p = 0.03
Caenis cf. pseudorivulorumR = 0.25, R = 0.43,
p = 0.03p = 0.0002
Table 4. Correlations of mayfly species abundance and environmental parameters analysed in the laboratory. Positive correlations are shaded. Abbreviations: BOD = biological oxygen demand (mg O₂/L), COD = chemical oxygen demand (mg O₂/L), NH₄⁺ = ammonium concentration (mg N/L), NO2− = nitrites (mg N/L), NO3− = nitrates (mg N/L), Kjeldahl N = Kjeldahl nitrogen (mg N/L), Org N = organic nitrogen (mg N/L), Total N = total nitrogen (mg N/L), PO43− = orthophosphates (mg P/L), Total P = total phosphorous (mg P/L). Only significant results are shown.
Mayfly Taxa/Abiotic ParameterBODCODNH4+NO2−NO3−Kjeldahl NOrg NTotal NPO43−Total P
Baetis fuscatus R = 0.24, R = 0.41, R = 0.39, R = 0.46,
p = 0.05p = 0.0003p = 0.001p = 0.0001
Baetis buceratusR = 0.29,R = 0.27, R = 0.40, R = 0.51, R = 0.38,R = 0.45,
p = 0.02p = 0.03p = 0.001p = 0.000p = 0.001p = 0.000
Baetis rhodani R = −0.46,R = −0.28, R = −0.48,R = −0.30, R = −0.32,
p = 0.0001p = 0.02p = 0.0002p = 0.01p = 0.01
Baetis vernus R = −0.26, R = −0.24, R = −0.33,
p = 0.03p = 0.04p = 0.01
Baetis liebenauae R = 0.25,
p = 0.03
Baetis lutheri R = −0.25,
p = 0.04
Cloeon dipterum R = 0.25,
p = 0.03
Procloeon bifidum R = 0.23,
p = 0.05
Procloeon pennulatum R = −0.30, R = −0.27,
p = 0.01p = 0.02
Electrogena ujhelyii R = −0.50, R = −0.37, R = −0.52, R = −0.54, R = −0.61,
p = 0.000p = 0.001p = 0.000p = 0.000p = 0.000
Heptagenia longicauda R = 0.30, R = 0.28, R = 0.28,R = 0.24,
p = 0.01p = 0.02p = 0.02p = 0.04
Habrophlebia lauta R = −0.32, R = −0.29, R = −0.30, R = −0.25, R = −0.36,
p = 0.01p = 0.01p = 0.01p = 0.03p = 0.002
Ephemera lineata R = 0.25,
p = 0.03
Potamanthus luteus R = 0.25, R = 0.40, R = 0.32, R = 0.26,
p = 0.04p = 0.001p = 0.01p = 0.03
Serratella ignita R = 0.38, R = 0.40,R = 0.29,
p = 0.001p = 0.001p = 0.02
Caenis luctuosa R = 0.25, R = 0.25, R = 0.33, R = 0.34, R = 0.33,
p = 0.04p = 0.04p = 0.01p = 0.004p = 0.01
Caenis cf. pseudorivulorum R = 0.24, R = 0.38, R = 0.45,R = 0.31,
p = 0.04p = 0.001p = 0.0001p = 0.01
Table 5. Relationship of mayfly species abundance and distance from source, land-use category, and morphological modification in a Pannonian lowland river. Positive correlations are shaded. Only significant results are shown.
Mayfly Taxa/Environmental VariablesDistance from SourceLand-Use Category Share (%)Morphological Modification
Near NaturalIntensive AgricultureExtensive AgricultureUrban
Baetis fuscatusR = 0.65, R = −0.37,R = 0.59,R = 0.44,
p = 0.000p = 0.001p = 0.000p = 0.0001
Baetis buceratusR = 0.27,R = −0.31,
p = 0.001
R = 0.30,
p = 0.01p = 0.01
Baetis rhodaniR = −0.41,R = 0.27, R = −0.36,R = 0.27,
p = 0.0004p = 0.02p = 0.002p = 0.02
Baetis vernus R = −0.23,
p = 0.05
Centroptilum luteolum R = −0.27,
p = 0.02
Cloeon dipterum R = 0.29,
p = 0.01
Procloeon pennulatum R = −0.25,
p = 0.04
Electrogena ujhelyiiR = −0.66, R = 0.52,R = −0.51,R = −0.70,
p = 0.000p = 0.000p = 0.000p = 0.000
Heptagenia longicaudaR = 0.36,
p = 0.002
Habrophlebia lautaR = −0.34, R = −0.32,
p = 0.003p = 0.01
Ephemera danica R = −0.24,
p = 0.04
Ephemera lineataR = 0.26,
p = 0.03
Potamanthus luteusR = 0.37,
p = 0.001
Serratella ignitaR = 0.54, R = −0.24,R = 0.52,
p = 0.000p = 0.04p = 0.000
Caenis luctuosaR = 0.44, R = 0.24,R = 0.37,
p = 0.0001p = 0.05p = 0.001
Caenis cf. pseudorivulorumR = 0.50,R = −0.39, R = 0.37,
p = 0.000p = 0.001p = 0.002
Publisher’s Note: MDPI stays neutral with regard to jurisdictional claims in published maps and institutional affiliations.

