Article

Mitochondrial Genomes Provide New Phylogenetic and Evolutionary Insights into Psilidae (Diptera: Brachycera)

Department of Entomology, College of Plant Protection, China Agricultural University, Yuanmingyuan West Road, Beijing 100193, China
*
Author to whom correspondence should be addressed.
Insects 2022, 13(6), 518; https://doi.org/10.3390/insects13060518
Submission received: 23 April 2022 / Revised: 29 May 2022 / Accepted: 30 May 2022 / Published: 1 June 2022
(This article belongs to the Section Insect Molecular Biology and Genomics)

Abstract

:

Simple Summary

Members of Psilidae are commonly known as rust flies. They constitute the largest family of Diopsoidea, with about 340 species being known worldwide. Several species of Psilidae show agricultural significance due to their severe damage of root crops. However, the systematic relationships and intrafamilial classification of Psilidae remained controversial. To provide further information on the phylogeny and evolution of Psilidae, mitogenomes of 6 psilid species are sequenced. Comparative analyses of the 6 newly obtained mitogenomes are conducted. Phylogenetic analyses based on the 6 psilid mitogenomes and public data are carried out, resulting in a monophyletic Psilidae and a non-monophyletic Diopsoidea. The sister relationship between Psilinae and Chylizinae is highly supported. This study provides several new insights into the phylogeny and evolution of Psilidae.

Abstract

Psilidae (Diptera: Brachycera) is a moderate-sized family currently placed in the superfamily Diopsoidea and contains some destructive agricultural and forestry pests. The systematic position and intrafamilial classification of rust flies are in need of further study, and the available molecular data of Psilidae are still limited. In this study, we present the mitochondrial genomes of 6 Psilidae species (Chamaepsila testudinaria Wang and Yang, Chyliza bambusae Wang and Yang, Chy. chikuni Wang, Loxocera lunata Wang and Yang, L. planivena Wang and Yang and L. sinica Wang and Yang). Comparative analyses show a conserved genome structure, in terms of gene composition and arrangement, and a highly Adenine plus Thymine biased nucleotide composition of the 6 psilid mitogenomes. Mitochondrial evolutionary rates vary among the 6 species, with species of Chylizinae exhibiting a slower average rate than species of Psilinae. The length, the nucleotide composition, and the copy number of repeat units of the control region are variable among the 6 species, which may offer useful information for phylogenetic and evolutionary studies of Psilidae. Phylogenetic analyses based on 4 mitogenomic datasets (AA, PCG, PCG12RNA, and PCGRNA) support the monophyly of Psilidae, and the sister relationship between Chylizinae and Psilinae, while Diopsoidea is suggested to be non-monophyletic. Our study enlightens the future application of mitogenomic data in the phylogenetic and evolutionary studies of Psilidae, based on denser taxon sampling.

1. Introduction

Mitochondria are organelles which play a central role in eukaryotic cell metabolism [1] and bear their own genome (known as mitogenome) [2,3,4]. The mitogenome has become a powerful molecular marker for taxonomic [5,6], phylogenomic [7,8,9,10], phylogeography [11,12], and molecular evolutionary [13,14] studies due to its small size, high copy numbers, relatively simple structure, and rapid evolutionary rate [2,15]. Recent advances in high-throughput sequencing technologies have made it possible to sequence the mitogenome efficiently and cost-effectively [16,17]. Insect mitogenome is a 15 to 18 kb duplex circular DNA, generally encompassing 37 genes (13 protein-coding genes (PCGs), 22 transfer RNA genes (tRNAs), and 2 ribosomal RNA genes (rRNAs)), a control region (CR, or A + T rich region) and several shorter non-coding regions (NCRs) [18]. At present, the mitogenomic data have been extensively used in comparative genomics, phylogenetic and evolutionary analyses of different insect groups, including Diptera [19,20,21,22,23]. Acalyptratae is one of the most diverse lineages of Diptera comprising many species with economic and scientific importance [24,25]. The public mitogenomic data of Acalyptratae, however, mainly focus on Drosophilidae and Tephritidae, while the information about other acalyptrate families is still very limited, which largely impeded our understanding of the phylogeny and evolution of acalyptrate flies.
Psilidae, commonly known as rust flies, is a group of small to medium-sized, yellow or black acalyptrate flies with reduced body setation [26]. Psilids are of economic importance because their phytophagous larvae burrow in the roots, stems, and tubers of plants [26,27,28] and sometimes cause considerable damage on bamboos [29,30], carrots, [31,32] and other root crops [33,34]. Some species have also been reported to induce galls [35,36]. With about 340 species being described so far, Psilidae is distributed in all zoogeographic realms with the highest diversity in the Old World and the Nearctic region, and a few species also occur in the Neotropical region [28,37]. Members of Psilidae are currently assigned into 3 subfamilies (Belobackenbardiinae, Chylizinae, and Psilinae), whereas the genus-level classification within Psilidae has been debated for a long time, especially the status of some generic taxa of Psilinae needs to be reconsidered [27,28,38,39]. In addition, the taxonomic, phylogenetic, and evolutionary studies of Psilidae have largely relied on morphological characters from adults, larvae, and eggs [38,39,40,41], and the comparative and phylogenetic analyses of this family based on molecular data remain unconducted.
The present study offers the mitogenomic data of 6 species of Psilidae, including the first 2 mitogenomes for the subfamily Chylizinae (Chyliza bambusae Wang and Yang and Chy. chikuni Wang), the mitogenomes of 3 species of the genus Loxocera (L. lunata Wang and Yang, L. planivena Wang and Yang and L. sinica Wang and Yang), and that of a species of the genus Chamaepsila (Cha. testudinaria Wang and Yang). Some of these 6 sampled species, such as Chy. bambusae, have been recorded as destructive pests of bamboos [30]. Comparative analysis of the genomic structure, nucleotide composition, substitutional and evolutionary rates among the 6 psilid mitogenomes as well as a molecular phylogenetic study of Psilidae are conducted. This study aims to contribute to our knowledge of the diversity of mitogenome and the phylogeny of Psilidae.

2. Materials and Methods

2.1. Taxon Sampling and DNA Extraction

Adult flies were collected using swept net in the field and preserved in 100% ethanol at –20 °C before DNA extraction. Detailed collection data were provided in Table S1. Specimens were identified mainly based on the keys, descriptions, and illustrations in Wang [42] and Wang and Yang [43]. Genomic DNA was extracted from thoracic muscle tissues using DNeasy Blood and Tissue kit (Qiagen, Hilden, Germany). The remaining body parts of the sampled specimens were saved as vouchers and deposited in the Entomological Museum of China Agricultural University, Beijing, China. Specimen voucher numbers are included in Table S1.

2.2. Mitochondrial Genome Sequencing and Assembly

An Illumina TruSeq library was prepared with 350 bp average insert size and sequenced on the Illumina NovaSeq 6000 platform with 150 bp paired-end reads. The raw reads were trimmed of adapters using Trimmomatic [44], and low-quality and short reads were removed using Prinseq [45]. De novo assemblies of high-quality reads were conducted using IDBA-UD [46], with similarity threshold 98%, and minimum and maximum k values of 41 and 141 bp, respectively. Fragments of COI near the 5’-terminus (~610 bp) were amplified for each species by polymerase chain reaction (PCR) with primers LCO1490 (5′-GGTCAACAAATCATAAAGATATTGG-3′ forward) and HCO2198 (5′-TAAACTTCAGGGTGACCAAAAAATCA-3′ reverse) [47], and obtained by Sanger sequencing. The COI fragments served as bait references to identify the best-fit mitochondrial contigs under BLAST searches [48] with minimum similarity 98%. For checking the assembly accuracy, clean reads were mapped onto the obtained mitochondrial contigs using Geneious 10.1.3 [49].

2.3. Mitochondrial Genome Annotation and Analysis

Gene sequences were initially annotated with MitoZ [50], and further corrected in Geneious 10.1.3 [49]. PCGs and rRNA genes were annotated by aligning their sequences with those of homologous genes of other reported Acalyptratae species. The locations and secondary structures of tRNA genes were identified using tRNAscan-SE Search Server (http://lowelab.ucsc.edu/tRNAscan-SE/, accessed on 14 March 2022) [51,52] and ARWEN version 1.2 (http://130.235.244.92/ARWEN/, accessed on 14 March 2022) [53]. Nucleotide composition of mitogenomes and codon usage of PCGs were analyzed with MEGA 7.0 [54]. AT-skew [(A − T)/(A + T)] and GC-skew [(G − C)/(G + C)] were used to measure the nucleotide compositional differences between genes [55]. DnaSP 5.0 [56] was used to calculate the synonymous (Ks) and non-synonymous (Ka) substitution rates of PCGs. Evolutionary rate of PCGs (Ka/Ks, ω) [57,58] was calculated manually.

2.4. Phylogenetic Analysis

Including the 6 newly sequenced mitogenomes of Psilidae, a total of 19 acalyptrate mitogenomes were used for phylogenetic analysis (Table 1). Mitogenomes of 2 Calyptratae species were used as outgroups.
The 13 PCGs of each species were aligned separately under the MAFFT algorithm [66] on TranslatorX online platform [67] with the L-INS-I strategy and default setting. Sequence of the 2 rRNA genes was aligned using the MAFFT version 7 online server [68] with G-INS-I strategy. All alignments were verified and checked manually in MEGA 7.0 [54]. Four datasets were prepared for phylogenetic analyses: (1) AA matrix, including amino acid sequences of 13 PCGs (3676 amino acids); (2) PCG matrix, including all 3 codon positions of 13 PCGs (11,028 bp); (3) PCGRNA matrix, including nucleotides in all 3 codon positions of 13 PCGs, and 2 rRNA genes (13,082 bp); and (4) PCG12RNA matrix, including nucleotides in the first and second codon positions of 13 PCGs, and 2 rRNA genes (9406 bp). Heterogeneity of sequence divergence within the 4 datasets was analyzed using AliGROOVE [69] with the default sliding window size.
Phylogenetic trees inferred from the 4 datasets were constructed under Bayesian inference (BI) and maximum likelihood (ML) methods. The site-heterogeneous mixture CAT + GTR model was used for all datasets. BI analyses were performed using PhyloBayes MPI v.1.5a [70]; 2 independent Markov Chain Monte Carlo (MCMC) chains were run after the removal of constant sites from the alignment and were stopped after the 2 runs had satisfactorily converged (maxdiff < 0.3); a consensus tree was computed from the remaining trees combined from 2 runs after the initial 25% trees of each run were discarded as burn-in. ML analyses were performed using IQ-TREE web server (http://iqtree.cibiv.univie.ac.at/ accessed on 14 March 2022) [71] with 1000 bootstrap replicates and automatic model prediction.

3. Results and Discussion

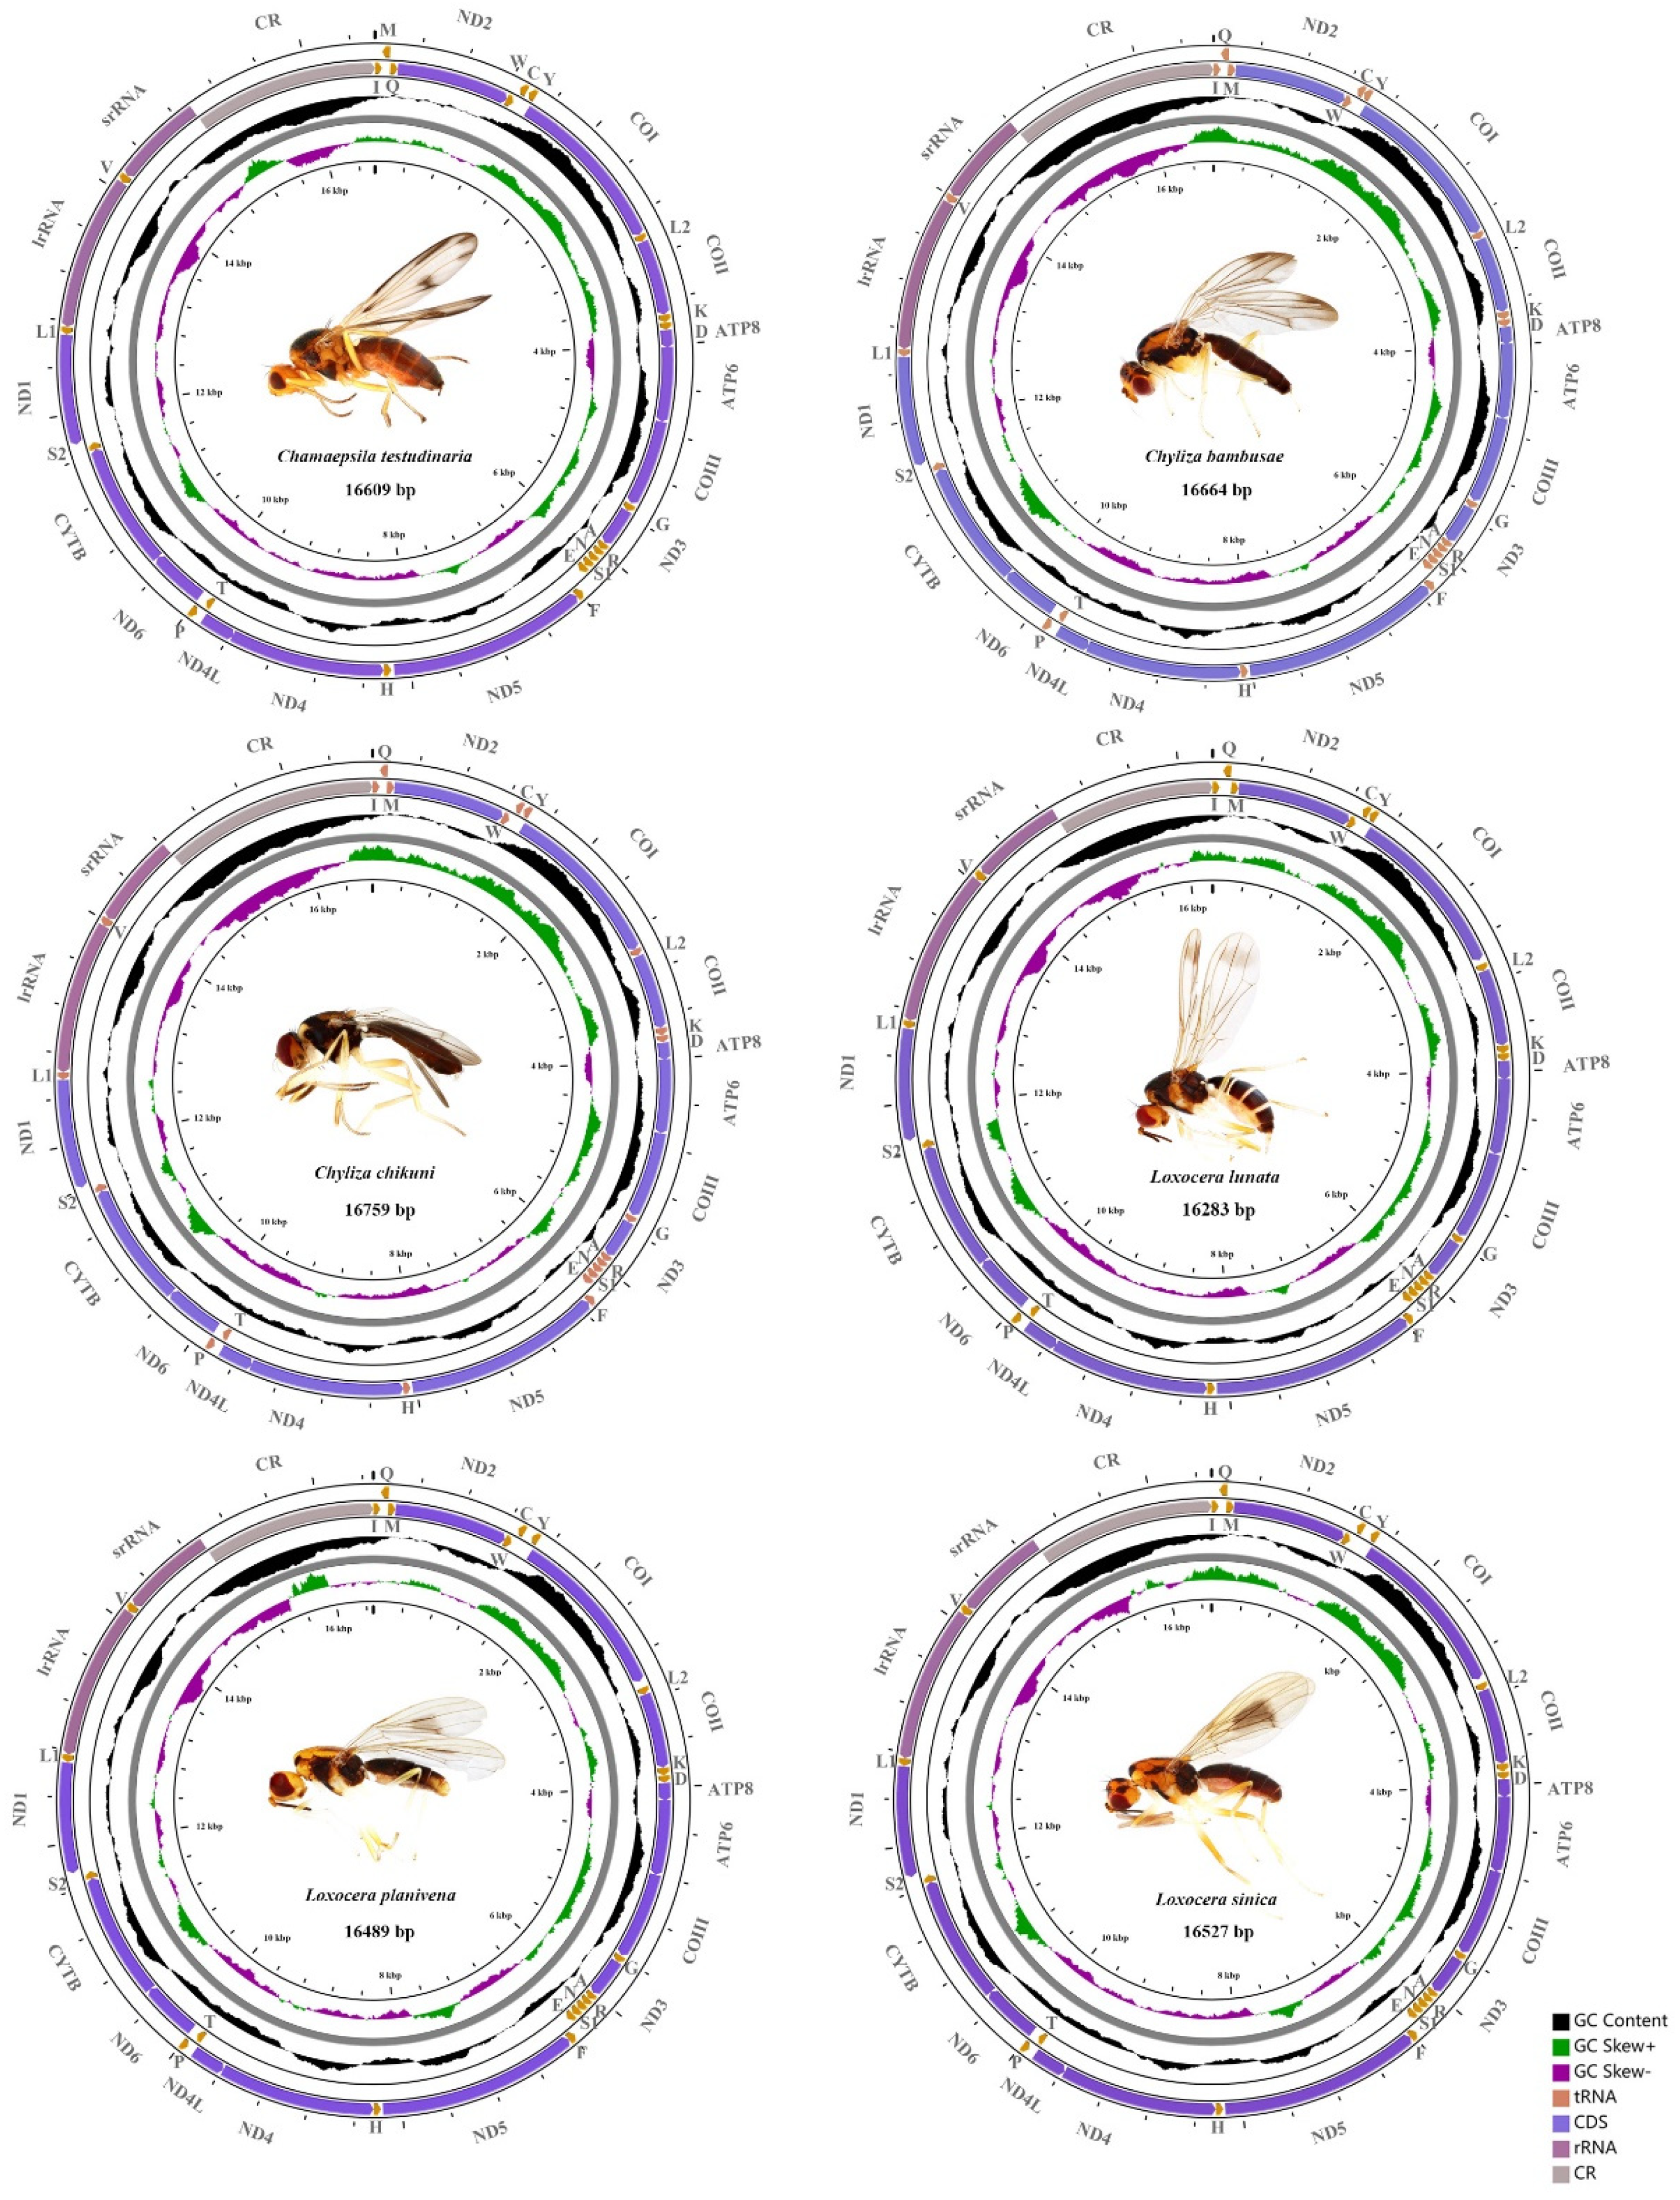
3.1. General Structure and Nucleotide Composition of Psilidae Mitogenomes

The complete mitogenomes of Cha. testudinaria, Chy. bambusae, Chy. chikuni, L. lunata, L. planivena, and L. sinica are 16,609, 16,664, 16,759, 16,283, 16,489, and 16,527 bp in length, respectively (Figure 1; Table S2). Length differences of the 6 mitogenomes are mainly due to the variable size of the control region. They are compact circular molecules, each containing 37 typical mitochondrial genes (13 PCGs, 22 tRNAs, and 2 rRNAs) and 1 control region. Among these genes, 4 PCGs (ND1, ND4, ND4L, and ND5), 8 tRNAs (trnC, trnF, trnH, trnL1, trnP, trnQ, trnV, and trnY) and 2 rRNAs (lrRNA and srRNA) are encoded on the minority strand (N strand), while the other 23 genes are located on the majority strand (J strand). The gene order and orientation of the 6 mitogenomes are identical to the typical insect mitogenomes [2,18]. Although mitochondrial gene rearrangements have been reported in several orders of Insecta [18,72,73,74], these events are rather rarely documented in Diptera, which have only been discovered in the mosquitos (Culicidae) [75] and the gall midges (Cecidomyiidae) [76]. Therefore, the mitogenomes of rust flies appear to be conserved and to retain the putative ancestral arrangements [18,21].
The nucleotide composition of the 6 Psilidae mitogenomes (Table 2) is similar, with a high Adenine plus Thymine (A + T) bias (77–80%), which is a common feature of insect mitogenomes [18,77]. The control region has the highest A + T content, while the first and second codon positions of PCGs have the lowest A + T content. Several hypotheses have been proposed to explain the A + T-biased composition heterogeneity [78,79,80], among them the energy efficiency trade-offs [79] is the one tested experimentally. This hypothesis suggests that the synthesis of A and T consumes lesser energy and nitrogen than that of Cytosine (C) and Guanine (G) [80]. All the 6 Psilidae mitogenomes exhibit positive AT-skew and negative GC-skew; the AT-skew ranges from 0.023 (L. lunata) to 0.062 (Chy. bambusae); the GC-skew ranges from −0.222 (Chy. chikuni) to −0.147 (Cha. testudinaria). The skewed strand composition is caused by multiple factors, including mutations and selection pressures [21], and the GC-skew value in insect mitogenomes appears to correlate with replication direction [80].

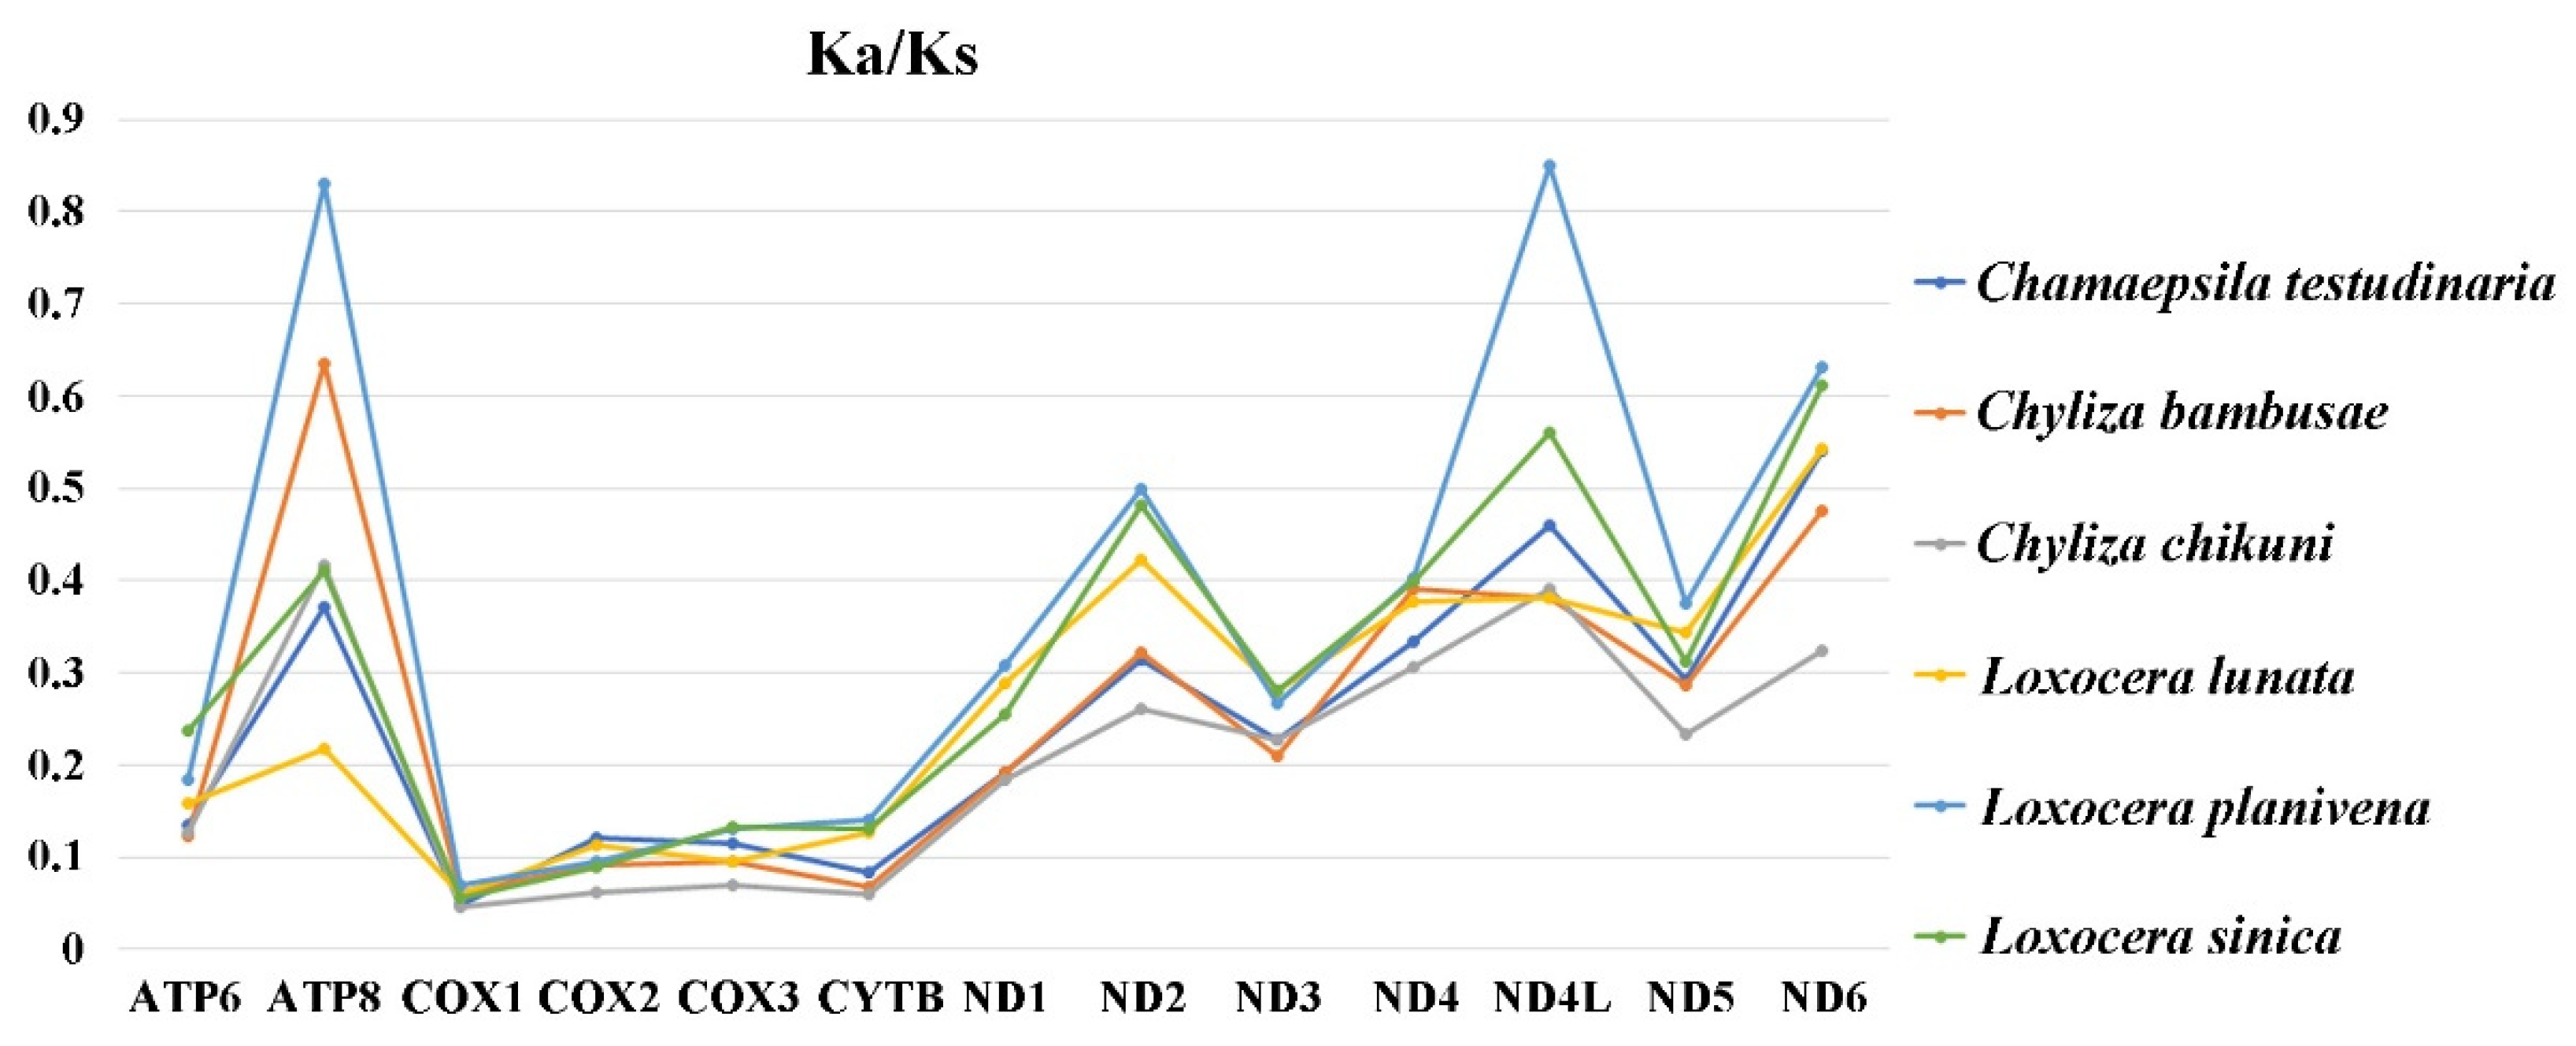
3.2. Protein-Coding Genes, Codon Usage, and Evolutionary Rates

Total sizes of the 13 PCGs of Cha. testudinaria, Chy. bambusae, Chy. chikuni, L. lunata, L. planivena, and L. sinica are 11,184 bp, 11,182 bp, 11,182 bp, 11,196 bp, 11,183 bp, and 11,183 bp long, respectively. Each of the 6 mitogenomes exhibit a negative AT-skew of PCGs, ranging from −0.172 (Chy. bambusae) to −0.132 (L. lunata), and a positive GC-skew of PCGs, ranging from 0.009 (L. planivena) to 0.041 (Chy. bambusae) (Table 2).
All 13 PCGs have the standard start codon ATN (ATT and ATG are the most frequently used), except that COI and ND1 start with TCG and TTG in all the sampled rust flies, respectively. Start codons for COI are usually unregular in holometabolous insects [19], and TCG is one of the common start codons for dipteran COI [19,21,81]. The non-standard start codon TTG for ND1 has also been found in several other mitogenomes of Diptera [82,83]. Each PCG is terminated with TAA or TAG as stop codons, or with a single T residue as an incomplete stop codon, which has been noticed in many other insect mitogenomes [19,21,72]. The incomplete stop codon is presumed to be filled by polyadenylation during the maturation of mRNA [84]. The most frequently used codon family is trnL2 (>490), while the least is trnC (<50) in all the 6 mitogenomes (Figure 2). The relative synonymous codon usage (RSCU) patterns of the 6 mitogenomes are roughly the same, and the RSCU values are shown in Figure 3 with all possible synonymous codons of the 22 amino acids are presented. The most prevalently used codons are NNA and NNU for each amino acid (Figure 3).
The synonymous substitution rate (Ks) varies significantly among the 6 sampled species, while the non-synonymous substitution rates (Ka) is similar among them (Figure S1, Table S3). The ratio of Ka/Ks (ω) is a diagnostic statistic to detect molecular adaption [57,58] and is used to investigate the evolutionary rate of the PCGs. The ω values of the 13 PCGs of each species are shown in Figure 4. Species in Chylizinae exhibit a slower average evolutionary rate than species of Psilinae; the ω values of all 13 PCGs are lower than 1.0, indicating that they are under purifying selection [57,58]; ATP8 (0.48), ND4L (0.504), and ND6 (0.521) have very high evolutionary rates, while the ω value of COI (0.057) is the lowest (Figure 4, Table S3).

3.3. Transfer and Ribosomal RNA Genes

The typical set of 22 tRNAs were identified in all 6 psilid mitogenomes, ranging from 62 to 72 bp in length. The tRNAs exhibit high A + T content (77.3–80.1%), positive AT-skew and negative GC-skew (Table 2). All of tRNAs can be folded into the typical clover-leaf secondary structure except trnS1, which lacks the dihydrouridine (DHU) arm (Figure S2) as in many other insects [18,72,85]. Most arms of the tRNAs were formed by classical Watson-Crick base pairing, with 3 kinds of non-classical base pairing (G-T match, T-T match and A-A match) were found (Figure S2).
The lrRNA is located between trnL1 and trnV, ranging from 1324 bp (Chy. bambusae and Chy. chikuni) to 1334 bp (Cha. testudinaria and L. sinica) in length. The srRNA is located between trnV and the control region, ranging from 790 bp (Chy. chikuni and L. lunata) to 797 bp (Cha. testudinaria). The rRNAs show high A + T bias with A + T content ranges from 81% to 83% (Table 2).

3.4. Control Region

The control region (CR) is the longest non-coding region of the 6 Psilidae mitogenomes. The control regions are considerably variable in length, ranging from 1389 bp to 1941 bp, and appear much higher A + T content (88–91.9%) than the whole mitogenomes (Table 2). Several repeat sequences have been detected in 3 of the 6 Psilidae mitogenomes (Figure 5): 2 types of repeat units are found in the control region of Cha. testudinaria, whereas the control region of L. planivena and L. sinica each contains only a single type of repeat units. Besides, poly-A regions are found at the end of control region in all sampled species, and 4 poly-T and 5 poly-A regions are presented in the control region of the 2 species of Chylizinae (Figure 5). Furthermore, several microsatellite-like “(TA)n” units (16–24 bp) are found in the control region of the 3 Loxocera species (Figure 5). These simple sequence repeats (SSRs) have been considered as potential useful molecular markers in species identification, genetic diversity studies, and phylogenetic analyses [23,86]. The above results indicate that the length, the nucleotide compositions as well as the copy numbers of repeat units in the control regions are highly variable among the known Psilidae mitogenomes, and such structural differences may provide useful information for phylogenetic and evolutionary studies of rust flies. Besides, in all sampled species, an intergenic region over 25 bp in length is detected between trnE and trnF, with the longest one in Cha. testudinaria (103 bp).

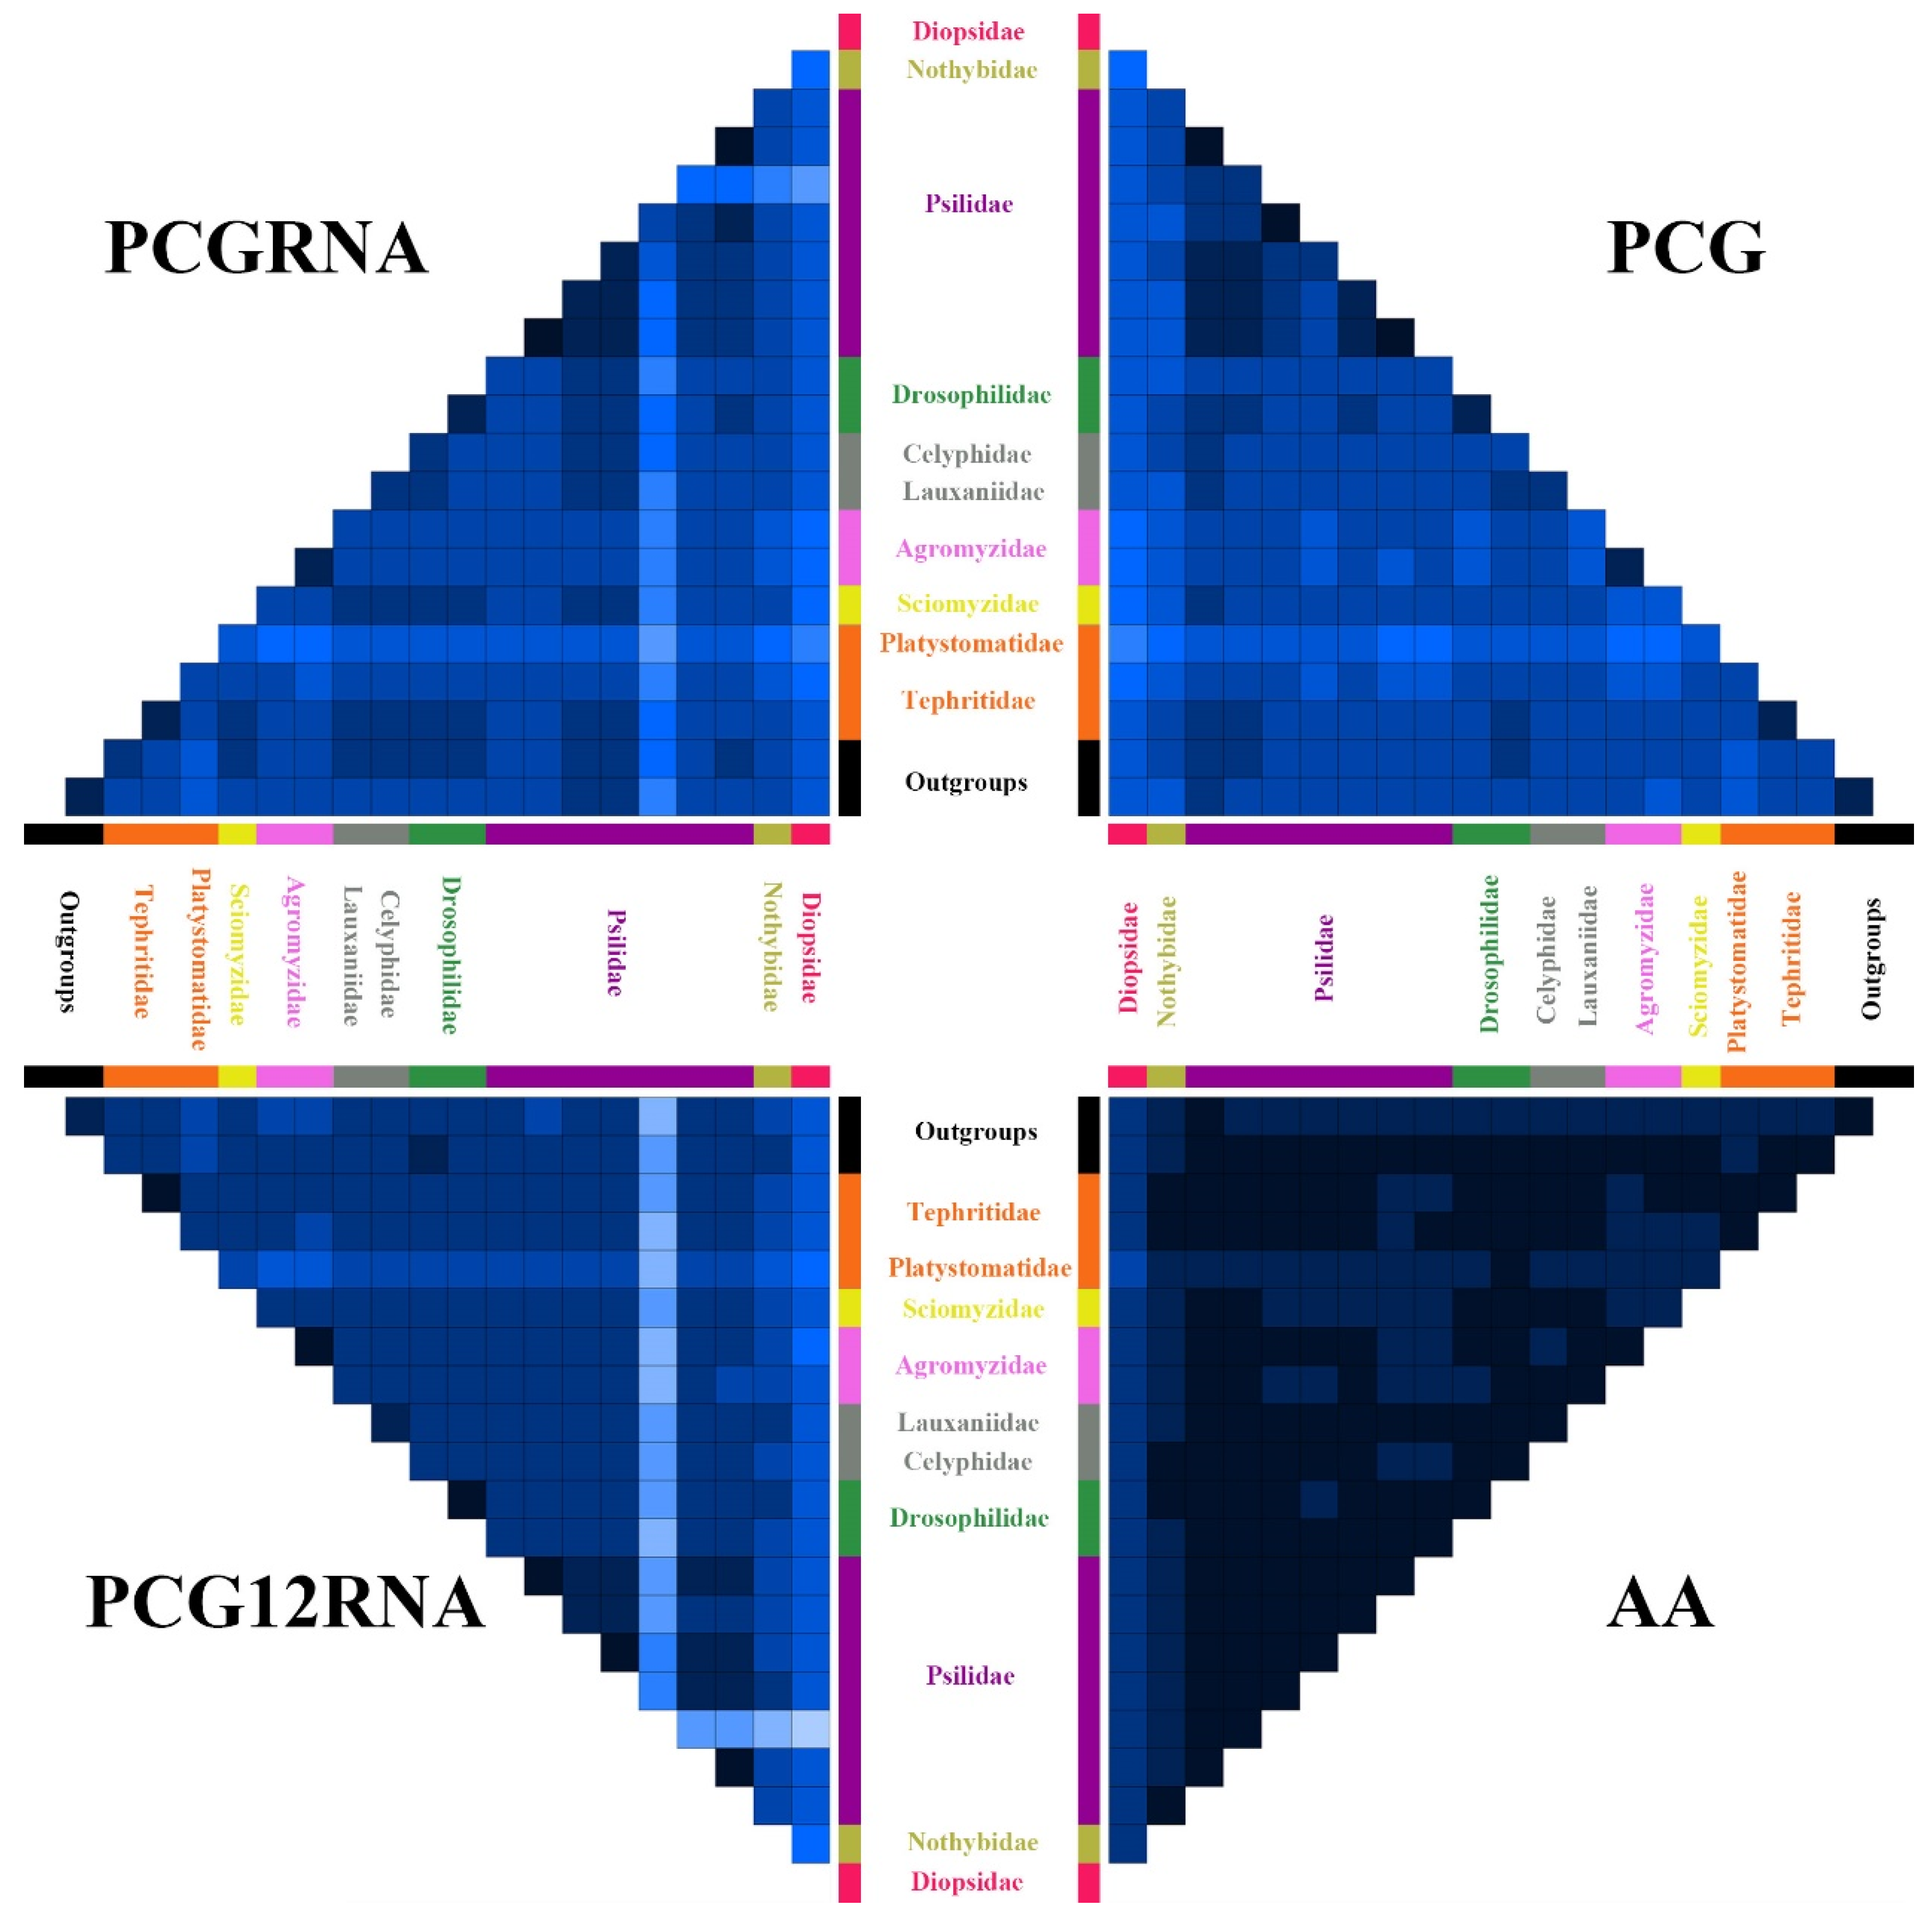
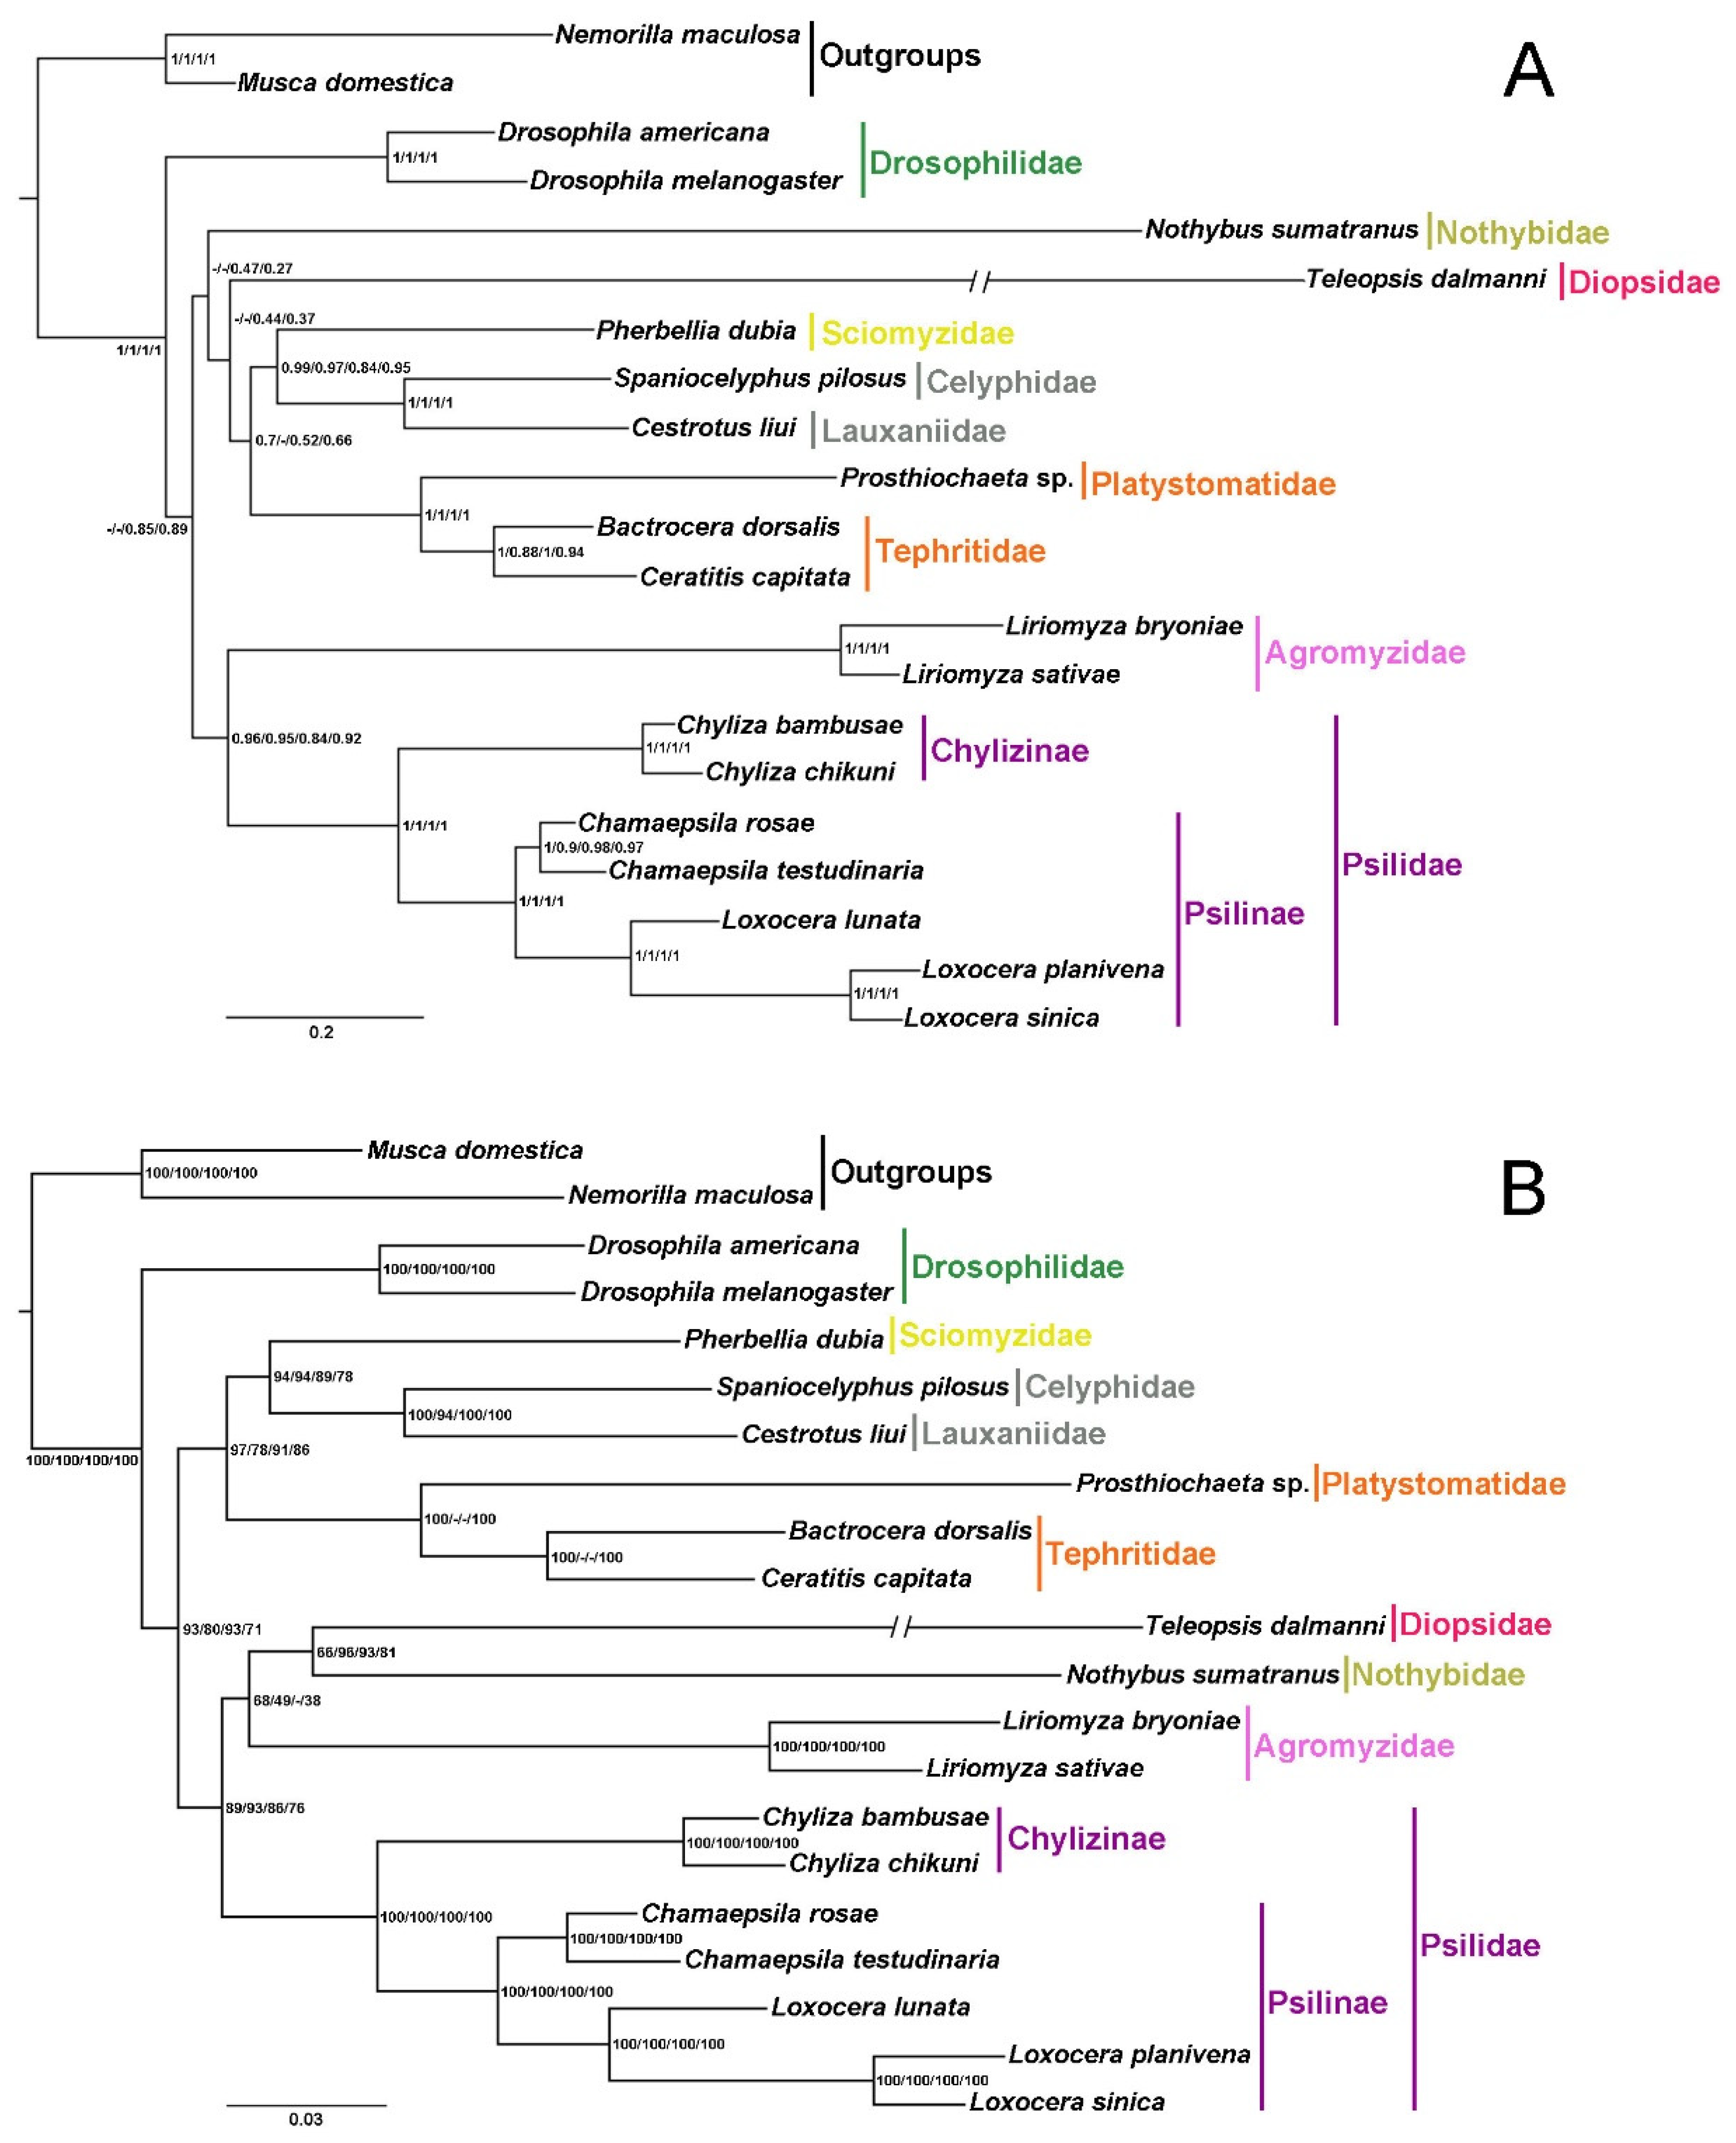
3.5. Phylogenetic Analyses

The sequence heterogeneity analyses show that the degrees of heterogeneity of the AA and PCG12RNA datasets are lower than those of the PCG and PCGRNA datasets (Figure 6). The lower heterogeneity of PCG12RNA dataset compared to the PCGRNA dataset indicate that third codon positions have higher heterogeneity than the first and second ones, as expected. The species of the family Diopsidae (Teleopsis dalmanni (Wiedemann)), Nothybidae (Nothybus sumatranus Enderlein) Nothybidae), and Platystomatidae (Prosthiochaeta sp.) exhibit a stronger heterogeneity in sequence divergence than to other acalyptrate species in all 4 datasets (Figure 6). The conspicuous high heterogeneity in sequence divergence of Chamaepsila rosae (Fabricius) (Psilidae) in the PCG12RNA and PCGRNA datasets (Figure 6) is attributed to a large amount of missing data in the rRNAs of the sequence. Highly heterogeneous sequences have been shown to reduce the nodal support confidence and topology accuracy [8,87,88], and the use of the heterogeneous model in phylogenetic analyses will largely improve the impact of heterogeneous sequences [9,89]. Therefore, the site-heterogeneous mixture CAT + GTR model was used in the phylogenetic analyses in this study.
19 species from 10 acalyptrate families are included in the phylogenetic analyses, representing 6 of the 10 traditional acalyptrate superfamilies. Results reconstructed based on the 4 datasets present similar topologies regarding family-level relationships within Acalyptratae, but the positions of several branches appear to be ambiguous (Figure 7).
The sister relationship between Chylizinae and Psilinae is supported with high Bayesian posterior probabilities (BPP = 1) and ML bootstrap values (BSV = 100), forming the monophyletic Psilidae (Figure 7). Three subfamilies have been recognized within Psilidae to date, among them Chylizinae and Psilinae have long been considered to be putative sister groups [26,28]. The systematic position of the third subfamily Belobackenbardiinae, which contains 4 described species in a single genus Belobackenbardia, has remained controversial [26,41,90]. A recent morphology-based phylogenetic study of Diopsoidea recovered Belobackenbardiinae as the basal-most clade of the monophyletic Psilidae, sister to a clade formed by the extinct genus Electrochyliza and (Chylizinae + Psilinae) [28]. Psilinae is consistently divided into 2 major clades in the present study (BBP = 1, BSV = 100), one includes the species of Chamaepsila and the other the species of Loxocera (Figure 7). Species of Psilinae are mainly spilt into Psila s. lat. and Loxocera s. lat. [28,37,38,39], whereas some subgroups within the 2 genera are sometimes treated as separate genera [26,43]. Phylogenetic relationships of the subfamilies within Psilidae and the genus-level groups within Psilinae are in need of further study.
Most works have treated Psilidae as a member of the superfamily Diopsoidea following Hennig [91] and McAlpine [92]. This superfamily also includes Diopsidae, Nothybidae, and several other families, but its composition keeps changing [28]. Diopsoidea has been reviewed and redefined by Lonsdale [28] to include 7 families, and this point of view has been tested by a morphology-based phylogenetic analysis. However, the resulting topologies from all analyses in the present study indicate that Diopsoidea is not a monophyletic group, with Psilidae either forms sister groups with Agromyzidae or with ((Diopsidae + Nothybidae) + Agromyzidae), and the positions of Diopsidae and Nothybidae vary between different topologies (Figure 7). The non-monophyletic Diopsoidea has also been recovered in several phylogenetic studies based on morphology [93] and molecular data [25,94]. Nonetheless, the available molecular data for Diopsoidea are still very scarce. Considering that denser taxon sampling has been confirmed to greatly improve the accuracy of phylogenetic inferences [95], sequencing mitogenomes of more taxon of Diopsoidea could help investigating controversial taxonomic problems within the superfamily and resolving phylogeny within Acalyptratae.

4. Conclusions

The present study provides new data on the mitochondrial genomes of Psilidae, including the first 2 mitogenomes of the subfamily Chylizinae (Chy. bambusae and Chy. chikuni), 3 mitogenomes of the genus Loxocera (L. lunata, L. planivena and L. sinica), and 1 mitogenome of the genus Chamaepsila (Cha. testudinaria). Comparative analyses show that the psilid mitogenomes are conserved in structure and present putative ancestral gene arrangements; nucleotide composition of the 6 mitogenomes are distinctly Adenine plus Thymine biased; all 13 PCGs are initiated with ATN start codons, except for COI and ND1 which started with TCG and TTG, respectively; TAA, TAG, or a single T residue are used as PCG stop codons; NNA and NNU are the most prevalently used codons for each amino acid; evolutionary rates vary among species, with species of Chylizinae exhibiting slower average rate than that of Psilinae; the length, the nucleotide composition, and the copy number of repeat units of the control region are highly variable among species, which may provide useful information for phylogenetic and evolutionary studies of Psilidae.
Bayesian and maximum likelihood analyses based on 4 datasets (AA, PCG, PCG12RNA, and PCGRNA) recover the monophyly of Psilidae, and the sister relationship between Chylizinae and Psilinae. Psilinae is divided into 2 major clades which represent Loxocera s. lat. and Psila s. lat., respectively. The monophyly of Diopsoidea is not supported in all the present analyses, with the position of Diopsidae and Nothybidae vary between different topologies, which may be due to the limited sampling of related taxa.
Our results show that the mitogenomic data are effective molecular markers to study the phylogeny and evolution of Psilidae, and sequencing mitogenomes of more taxa, especially the species of Belobackenbardiinae and Psilinae, could help to resolve the controversial taxonomic problems and higher-level phylogeny within the family.

Supplementary Materials

The following are available online at https://www.mdpi.com/article/10.3390/insects13060518/s1, Figure S1: Synonymous (A) and non-synonymous (B) substitutional rates of mitochondrial protein-coding genes of 6 Psilidae species. Abbreviations: ATP6 and ATP8 for adenosine triphosphate (ATP) synthase subunits 6 and 8; COX1–COX3 for cytochrome C oxidase subunits I–III; CYTB for cytochrome b; ND1–ND6 and ND4L for nicotinamide adenine dinu-cleotide hydrogen (NADH) dehydrogenase subunits 1–6 and 4L., Figure S2: Inferred secondary structures of 22 tRNAs of 6 Psilidae species. The tRNAs are labeled with the abbreviations of their corresponding amino acids. Inferred Watson-Crick bonds are illustrated by lines and GU bonds are illustrated by dots. Other mismatches are indicated by blue arrows. Table S1: Information of the voucher specimens used for mitochondrial genomes sequencing in the present study, Table S2: Structure of Chamaepsila testudinaria, Chyliza bambusae, Chyliza chikuni, Loxocera lunata, Loxocera planivena, and Loxocera sinica mitochondrial genome, Table S3: Synonymous and non-synonymous substitutional analysis of gene ATP6, ATP8, COX1, COX2, COX3, CYTB, ND1, ND2, ND3, ND4, ND4L, ND5, ND6.

Author Contributions

Conceptualization, J.Z.; methodology, J.Z.; software, J.Z.; validation, J.Z. and D.Y.; formal analysis, J.Z.; investigation, J.Z. and D.Y.; resources, J.Z. and D.Y.; data curation, J.Z. and D.Y.; writing—original draft preparation, J.Z.; writing—review and editing, J.Z. and D.Y.; visualization, J.Z.; supervision, D.Y.; project administration, D.Y.; funding acquisition, D.Y. All authors have read and agreed to the published version of the manuscript.

Funding

This study was supported by the National Natural Science Foundation of China (No. 31772497) and the 2115 Talent Development Program of China Agricultural University.

Data Availability Statement

All mitogenome sequences generated in this study were deposited in the GenBank under accession numbers ON258616 to ON258621.

Acknowledgments

We are grateful to Yunfei Wu (China Agricultural University, Beijing) for his valuable help in data analysis. We sincerely thank the two anonymous reviewers for critical reading and helpful suggestions of the manuscript.

Conflicts of Interest

The authors declare no conflict of interest.

References

  1. McBride, H.M.; Neuspiel, M.; Wasiak, S. Mitochondria: More than just a powerhouse. Curr. Biol. 2006, 16, R551–R560. [Google Scholar] [CrossRef] [PubMed] [Green Version]
  2. Boore, J.L. Animal mitochondrial genomes. Nucleic Acids Res. 1999, 27, 1767–1780. [Google Scholar] [CrossRef] [PubMed] [Green Version]
  3. Taanman, J.-W. The mitochondrial genome: Structure, transcription, translation and replication. Biochim. Biophys. Acta Bioenerg. 1999, 1410, 103–123. [Google Scholar] [CrossRef] [Green Version]
  4. Saccone, C.; Gissi, C.; Lanave, C.; Larizza, A.; Pesole, G.; Reyes, A. Evolution of the mitochondrial genetic system: An overview. Gene 2000, 261, 153–159. [Google Scholar] [CrossRef]
  5. Hebert, P.D.N.; Cywinska, A.; Ball, S.L.; de Waard, J.R. Biological identifications through DNA barcodes. Proc. R. Soc. B 2003, 270, 313–321. [Google Scholar] [CrossRef] [Green Version]
  6. Nelson, L.A.; Lambkin, C.L.; Batterham, P.; Wallman, J.F.; Dowton, M.; Whiting, M.F.; Yeates, D.K.; Cameron, S.L. Beyond barcoding: A mitochondrial genomics approach to molecular phylogenetics and diagnostics of blowflies (Diptera: Calliphoridae). Gene 2012, 511, 131–142. [Google Scholar] [CrossRef] [Green Version]
  7. Moritz, C.; Dowling, T.E.; Brown, W.M. Evolution of animal mitochondrial DNA: Relevance for population biology and systematics. Ann. Rev. Ecol. Syst. 1987, 18, 269–292. [Google Scholar] [CrossRef]
  8. Song, F.; Li, H.; Jiang, P.; Zhou, X.; Liu, J.; Sun, C.; Vogler, A.P.; Cai, W. Capturing the phylogeny of Holometabola with mitochondrial genome data and Bayesian site-heterogeneous mixture models. Genome Biol. Evol. 2016, 8, 1411–1426. [Google Scholar] [CrossRef]
  9. Li, H.; Leavengood, J.M.; Chapman, E.G.; Burkhardt, D.; Song, F.; Jiang, P.; Liu, J.; Zhou, X.; Cai, W. Mitochondrial phylogenomics of Hemiptera reveals adaptive innovations driving the diversification of true bugs. Proc. R. Soc. B 2017, 284, 20171223. [Google Scholar] [CrossRef]
  10. Song, F.; Li, H.; Liu, G.; Wang, W.; James, P.; Colwell, D.D.; Tran, A.; Gong, S.; Cai, W.; Shao, R. Mitochondrial genome fragmentation unites the parasitic lice of eutherian mammals. Syst. Biol. 2019, 68, 430–440. [Google Scholar] [CrossRef] [Green Version]
  11. Zink, R.M.; Barrowclough, G.F. Mitochondrial DNA under siege in avian phylogeography. Mol. Ecol. 2008, 17, 2107–2121. [Google Scholar] [CrossRef] [PubMed]
  12. Ma, C.; Yang, P.; Jiang, F.; Chapuis, M.-P.; Shali, Y.; Sword, G.A.; Kang, L. Mitochondrial genomes reveal the global phylogeography and dispersal routes of the migratory locust. Mol. Ecol. 2012, 21, 4344–4358. [Google Scholar] [CrossRef] [PubMed]
  13. Salvato, P.; Simonato, M.; Battisti, A.; Negrisolo, E. The complete mitochondrial genome of the bag-shelter moth Ochrogaster lunifer (Lepidoptera: Notodontidae). BMC Genom. 2008, 9, 331. [Google Scholar] [CrossRef] [PubMed] [Green Version]
  14. Shao, R.; Zhu, X.Q.; Barker, S.C.; Herd, K. Evolution of extensively fragmented mitochondrial genomes in the lice of humans. Genome Biol. Evol. 2012, 4, 1088–1101. [Google Scholar] [CrossRef] [PubMed] [Green Version]
  15. Curole, J.P.; Kocher, T.D. Mitogenomics: Digging deeper with complete mitochondrial genomes. Trends Ecol. Evol. 1999, 14, 394–398. [Google Scholar] [CrossRef]
  16. Timmermans, M.J.T.N.; Dodsworth, S.; Culverwell, C.L.; Bocak, L.; Ahrens, D.; Littlewood, D.T.J.; Pons, J.; Vogler, A.P. Why barcode? High-throughput multiplex sequencing of mitochondrial genomes for molecular systematics. Nucleic Acids Res. 2010, 38, e197. [Google Scholar] [CrossRef] [PubMed] [Green Version]
  17. Ye, F.; Samuels, D.C.; Clark, T.; Guo, Y. High-throughput sequencing in mitochondrial DNA research. Mitochondrion 2014, 17, 157–163. [Google Scholar] [CrossRef] [Green Version]
  18. Cameron, S.L. Insect mitochondrial genomics implications for evolution and phylogeny. Annu. Rev. Entomol. 2014, 59, 95–117. [Google Scholar] [CrossRef] [Green Version]
  19. Cameron, S.L.; Lambkin, C.L.; Barker, S.C.; Whiting, M.F. A mitochondrial genome phylogeny of Diptera: Whole genome sequence data accurately resolve relationships over broad timescales with high precision. Syst. Entomol. 2007, 32, 40–59. [Google Scholar] [CrossRef]
  20. Yan, L.; Pape, T.; Elgar, M.A.; Gao, Y.; Zhang, D. Evolutionary history of stomach bot flies in the light of mitogenomics. Syst. Entomol. 2019, 44, 797–809. [Google Scholar] [CrossRef]
  21. Li, X.; Yan, L.; Pape, T.; Gao, Y.; Zhang, D. Evolutionary insights into bot flies (Insecta: Diptera: Oestridae) from comparative analysis of the mitochondrial genomes. Int. J. Biol. Macromol. 2020, 149, 371–380. [Google Scholar] [CrossRef] [PubMed]
  22. Lin, X.-L.; Zhao, Y.-M.; Yan, L.-P.; Liu, W.-B.; Bu, W.-J.; Wang, X.-H.; Zheng, C.-G. Mitogenomes provide new insights into the evolutionary history of Prodiamesinae (Diptera: Chironomidae). Zool. Scr. 2022, 51, 119–132. [Google Scholar] [CrossRef]
  23. Zhang, X.; Yang, D.; Kang, Z. New data on the mitochondrial genome of Nematocera (lower Diptera): Features, structures and phylogenetic implications. Zool. J. Linn. Soc. 2022, zlac012. [Google Scholar] [CrossRef]
  24. Marshall, S.A. Flies: The Natural History and Diversity of Diptera; Firefly Books Ltd.: Richmond Hill, ON, Canada, 2012; p. 616. [Google Scholar]
  25. Bayless, K.M.; Trautwein, M.D.; Meusemann, K.; Shin, S.; Petersen, M.; Donath, A.; Podsiadlowski, L.; Mayer, C.; Niehuis, O.; Peters, R.S.; et al. Beyond Drosophila: Resolving the rapid radiation of schizophoran flies with phylotranscriptomics. BMC Biol. 2021, 19, 23. [Google Scholar] [CrossRef] [PubMed]
  26. Shatalkin, A.I. Psilidae. Manual of Afrotropical Diptera. In Brachycera–Cyclorrhapha, Excluding Calyptratae; Krik-Spriggs, A.H., Sinclair, B.J., Eds.; South African National Biodiversity Institute: Pretoria, South Africa, 2021; Volume 3, pp. 1545–1556. [Google Scholar]
  27. Shatalkin, A.I.; Merz, B. The Psilidae (Diptera) from Switzerland, with description of new Central European species. Rev. Suisse Zool. 2010, 117, 771–800. [Google Scholar] [CrossRef]
  28. Lonsdale, O. Family groups of Diopsoidea and Nerioidea (Diptera: Schizophora)–Definition, history and relationships. Zootaxa 2020, 4735, 1–177. [Google Scholar] [CrossRef]
  29. Yang, C.; Wang, X.L. A new species of Chyliza (Psilidae: Diptera) from China, injuring bamboo roots. For. Res. 1988, 1, 275–277. [Google Scholar]
  30. Xu, T.; Lv, R. A study on Chyliza bambusae. For. Res. 1988, 1, 278–284. [Google Scholar]
  31. Iwasa, M.; Hanada, T.; Kajino, Y. A new psilid species from Japan injurious to the root of carrot (Diptera: Psilidae). Appl. Entomol. Zool. 1987, 22, 310–315. [Google Scholar] [CrossRef]
  32. Collier, R.; Finch, S. A review of research to address carrot fly (Psila rosae) control in the UK. EPPO Bull. 2009, 39, 121–127. [Google Scholar] [CrossRef]
  33. Glendenning, R. Psila nigricornis Meig. (Diptera, Psilidae), a new pest of possible economic importance. Can. Entomol. 1952, 84, 107. [Google Scholar] [CrossRef]
  34. Ellis, P.R.; Hardman, J.A.; Saw, P.L. Host plants of the carrot fly, Psila rosae (F.) (Dipt., Psilidae). Entomol. Mon. Mag. 1992, 128, 1–10. [Google Scholar]
  35. Chandler, P.J. Observations on plant associations of the Psilidae (Diptera). Entomol. Rec. J. Var. 1975, 87, 13–17. [Google Scholar]
  36. Ferrar, P. A Guide to Breeding Habits and Immature Stages of Diptera Cyclorrhapha. In Entomonograph; Brill: Leiden, The Netherlands, 1987; Volume 8, pp. 1–478. [Google Scholar]
  37. Buck, M. Psilidae (Rust Flies, Psilid Flies). In Manual of Central American Diptera; Brown, B.V., Borkent, A., Cumming, J.M., Woodley, N.E., Zumbado, M.A., Eds.; NRC Research Press: Ottawa, ON, Canada, 2010; Volume 2, pp. 837–842. [Google Scholar]
  38. Buck, M.; Marshall, S.A. The identity of Pseudopsila, description of a new subgenus of Psila, and redefinition of Psila sensu lato (Diptera: Psilidae). Eur. J. Entomol. 2006, 103, 183–192. [Google Scholar] [CrossRef] [Green Version]
  39. Buck, M.; Marshall, S.A. Revision of New World Loxocera (Diptera: Psilidae), with phylogenetic redefinition of Holarctic subgenera and species groups. Eur. J. Entomol. 2006, 103, 193–219. [Google Scholar] [CrossRef] [Green Version]
  40. Shatalkin, A.I. Asian species of Loxocera Meigen (Diptera, Psilidae). Russ. Entomol. J. 1998, 6, 87–97. [Google Scholar]
  41. Shatalkin, A.I. Afrotropical Psilidae (Diptera). 1. Genera Belobackenbardia gen. n. and Psila Meigen, 1803. Russ. Entomol. J. 2002, 10, 417–424. [Google Scholar]
  42. Wang, X. Two new species of the genus Chyliza (Diptera: Psilidae) from China. Entomotaxonomia 1995, 17, 100–102. [Google Scholar]
  43. Wang, X.; Yang, C. Psilidae. In Flies of China; Xue, W., Chao, C., Eds.; Liaoning Science and Technology Press: Shenyang, China, 1998; Volume 1, pp. 424–456. [Google Scholar]
  44. Bolger, A.M.; Lohse, M.; Usadel, B. Trimmomatic: A flexible trimmer for Illumina sequence data. Bioinformatics 2014, 30, 2114–2120. [Google Scholar] [CrossRef] [Green Version]
  45. Schmieder, R.; Edwards, R. Quality control and preprocessing of metagenomic datasets. Bioinformatics 2011, 27, 863–864. [Google Scholar] [CrossRef] [Green Version]
  46. Peng, Y.; Leung, H.C.M.; Yiu, S.M.; Chin, F.Y.L. IDBA-UD: A de novo assembler for single cell and metagenomic sequencing data with highly uneven depth. Bioinformatics 2012, 28, 1420–1428. [Google Scholar] [CrossRef] [PubMed] [Green Version]
  47. Folmer, O.; Black, M.; Hoeh, W.; Lutz, R.; Vrijenhoek, R. DNA primers for amplification of mitochondrial cytochrome c oxidase subunit I from diverse metazoan invertebrates. Mol. Mar. Biol. Biotechnol. 1994, 3, 294–299. [Google Scholar] [CrossRef] [Green Version]
  48. Altschul, S.F.; Gish, W.; Miller, W.; Myers, E.W.; Lipman, D.J. Basic local alignment search tool. J. Mol. Biol. 1990, 215, 403–410. [Google Scholar] [CrossRef]
  49. Kearse, M.; Moir, R.; Wilson, A.; Stones-Havas, S.; Cheung, M.; Sturrock, S.; Buxton, S.; Cooper, A.; Markowitz, S.; Duran, C.; et al. Geneious basic: An integrated and extendable desktop software platform for the organization and analysis of sequence data. Bioinformatics 2012, 28, 1647–1649. [Google Scholar] [CrossRef] [PubMed]
  50. Meng, G.; Li, Y.; Yang, C.; Liu, S. MitoZ: A toolkit for animal mitochondrial genome assembly, annotation and visualization. Nucleic Acids Res. 2019, 47, e63. [Google Scholar] [CrossRef] [PubMed]
  51. Lowe, T.M.; Chan, P.P. tRNAscan-SE on-line: Integrating search and context for analysis of transfer RNA genes. Nucleic Acids Res. 2016, 44, W54–W57. [Google Scholar] [CrossRef]
  52. Chan, P.P.; Lin, B.Y.; Mak, A.J.; Lowe, T.M. tRNAscan-SE 2.0: Improved detection and functional classification of transfer RNA genes. Nucleic Acids Res. 2021, 49, 9077–9096. [Google Scholar] [CrossRef]
  53. Laslett, D.; Canbäck, B. ARWEN, a program to detect tRNA genes in metazoan mitochondrial nucleotide sequences. Bioinformatics 2008, 24, 172–175. [Google Scholar] [CrossRef] [Green Version]
  54. Kumar, S.; Stecher, G.; Tamura, K. MEGA7: Molecular evolutionary genetics analysis version 7.0 for bigger datasets. Mol. Biol. Evol. 2016, 33, 1870–1874. [Google Scholar] [CrossRef] [Green Version]
  55. Perna, N.T.; Kocher, T.D. Patterns of nucleotide composition at fourfold degenerate sites of animal mitochondrial genomes. J. Mol. Evol. 1995, 41, 353–358. [Google Scholar] [CrossRef]
  56. Librado, P.; Rozas, J. DnaSP v5: A software for comprehensive analysis of DNA polymorphism data. Bioinformatics 2009, 25, 1451–1452. [Google Scholar] [CrossRef] [PubMed] [Green Version]
  57. Hurst, L.D. The Ka/Ks ratio: Diagnosing the form of sequence evolution. Trends Genet. 2002, 18, 486–487. [Google Scholar] [CrossRef]
  58. Yang, Z.; Bielawski, J.R. Statistical methods for detecting molecular adaptation. Trends Ecol. Evol. 2000, 15, 496–503. [Google Scholar] [CrossRef]
  59. Li, X.; Wang, Y.; Su, S.; Yang, D. The complete mitochondrial genomes of Musca domestica and Scathophaga stercoraria (Diptera: Muscoidea: Muscidae and Scathophagidae). Mitochondrial DNA A 2016, 27, 1435–1436. [Google Scholar] [CrossRef] [PubMed]
  60. Zhou, J.; Li, M.; Yang, D. The mitochondrial genome of Nothybus sumatranus (Diptera: Nothybidae). Mitochondrial DNA B 2021, 6, 1573–1574. [Google Scholar] [CrossRef]
  61. Li, X.; Li, W.; Ding, S.; Cameron, S.L.; Mao, M.; Shi, L.; Yang, D. Mitochondrial genomes provide insights into the phylogeny of Lauxanioidea (Diptera: Cyclorrhapha). Int. J. Mol. Sci. 2017, 18, 773. [Google Scholar] [CrossRef] [Green Version]
  62. Yang, F.; Du, Y.; Cao, J.; Huang, F. Analysis of three leafminers’ complete mitochondrial genomes. Gene 2013, 529, 1–6. [Google Scholar] [CrossRef]
  63. Wang, S.; Lei, Z.; Wen, J.; Wang, H.; Li, X.; Dong, B.; Ren, B. The complete mitochondrial genome of Liriomyza huidobrensis and comparison with L. trifolii and L. sativae (Diptera: Agromyzidae). Mitochondrial DNA A 2013, 25, 104–105. [Google Scholar] [CrossRef] [PubMed]
  64. Li, X.; Zhou, J.; Wang, L.; Hou, P.; Yang, D. The mitochondrial genome of Prosthiochaeta sp. (Diptera: Platystomatidae). Mitochondrial DNA B 2020, 5, 2557–2558. [Google Scholar] [CrossRef]
  65. Spanos, L.; Koutroumbas, G.; Kotsyfakis, M.; Louis, C. The mitochondrial genome of the mediterranean fruit fly, Ceratitis capitata. Insect Mol. Biol. 2000, 9, 139–144. [Google Scholar] [CrossRef]
  66. Katoh, K.; Kuma, K.; Toh, H.; Miyata, T. MAFFT version 5: Improvement in accuracy of multiple sequence alignment. Nucleic Acids Res. 2005, 33, 511–518. [Google Scholar] [CrossRef] [PubMed]
  67. Abascal, F.; Zardoya, R.; Telford, M.J. TranslatorX: Multiple alignment of nucleotide sequences guided by amino acid translations. Nucleic Acids Res. 2010, 38, W7–W13. [Google Scholar] [CrossRef] [PubMed] [Green Version]
  68. Katoh, K.; Standley, D.M. MAFFT multiple sequence alignment software version 7: Improvements in performance and usability. Mol. Biol. Evol. 2013, 30, 772–780. [Google Scholar] [CrossRef] [PubMed] [Green Version]
  69. Kück, P.; Meid, S.A.; Groß, C.; Wägele, J.W.; Misof, B. AliGROOVE–visualization of heterogeneous sequence divergence within multiple sequence alignments and detection of inflated branch support. BMC Bioinform. 2014, 15, 294. [Google Scholar] [CrossRef] [PubMed] [Green Version]
  70. Lartillot, N.; Rodrigue, N.; Stubbs, D.; Richer, J. PhyloBayes MPI: Phylogenetic reconstruction with infinite mixtures of profiles in a parallel environment. Syst. Biol. 2013, 62, 611–615. [Google Scholar] [CrossRef] [Green Version]
  71. Trifinopoulos, J.; Nguyen, L.T.; von Haeseler, A.; Minh, B.Q. W-IQ-TREE: A fast-online phylogenetic tool for maximum likelihood analysis. Nucleic Acids Res. 2016, 44, W232–W235. [Google Scholar] [CrossRef] [Green Version]
  72. Chen, Z.; Liu, Y.; Wu, Y.; Song, F.; Cai, W.; Li, H. Novel tRNA gene rearrangements in the mitochondrial genome of Camarochiloides weiweii (Hemiptera: Pachynomidae). Int. J. Biol. Macromol. 2020, 165, 1738–1744. [Google Scholar] [CrossRef]
  73. Timmermans, M.J.; Vogler, A.P. Phylogenetically informative rearrangements in mitochondrial genomes of Coleoptera, and monophyly of aquatic elateriform beetles (Dryopoidea). Mol. Phylogenet. Evol. 2012, 63, 299–304. [Google Scholar] [CrossRef]
  74. Tang, P.; Zhu, J.; Zheng, B.; Wei, S.; Sharkey, M.; Chen, X.; Vogler, A.P. Mitochondrial phylogenomics of the Hymenoptera. Mol. Phylogenet. Evol. 2019, 131, 8–18. [Google Scholar] [CrossRef]
  75. Behura, S.K.; Lobo, N.F.; Haas, B.; deBruyn, B.; Lovin, D.D.; Shumway, M.F.; Puiu, D.; Romero-Severson, J.; Nene, V.; Severson, D.W. Complete sequences of mitochondria genomes of Aedes aegypti and Culex quinquefasciatus and comparative analysis of mitochondrial DNA fragments inserted in the nuclear genomes. Insect Biochem. Mol. Biol. 2011, 41, 770–777. [Google Scholar] [CrossRef] [Green Version]
  76. Beckenbach, A.T.; Joy, J.B. Evolution of the mitochondrial genomes of gall midges (Diptera: Cecidomyiidae): Rearrangement and severe truncation of tRNA genes. Genome Biol. Evol. 2009, 1, 278–287. [Google Scholar] [CrossRef] [PubMed] [Green Version]
  77. Wei, S.J.; Shi, M.; Chen, X.X.; Sharkey, M.J.; van Achterberg, C.; Ye, G.Y.; He, J.H. New views on strand asymmetry in insect mitochondrial genomes. PLoS ONE 2010, 5, e12708. [Google Scholar] [CrossRef] [PubMed] [Green Version]
  78. Rocha, E.P.C.; Danchin, A. Base composition bias might result from competition for metabolic resources. Trends Genet. 2002, 18, 291–294. [Google Scholar] [CrossRef]
  79. Foerstner, K.U.; von Mering, C.; Hooper, S.D.; Bork, P. Environments shape the nucleotide composition of genomes. EMBO Rep. 2005, 6, 1208–1213. [Google Scholar] [CrossRef] [PubMed]
  80. Chen, W.-H.; Lu, G.; Bork, P.; Hu, S.; Lercher, M.J. Energy efficiency trade-offs drive nucleotide usage in transcribed regions. Nat. Commun. 2016, 7, 11334. [Google Scholar] [CrossRef] [Green Version]
  81. Castro, L.R.; Austin, A.D.; Dowton, M. Contrasting rates of mitochondrial molecular evolution in parasitic Diptera and Hymenoptera. Mol. Biol. Evol. 2002, 19, 1100–1113. [Google Scholar] [CrossRef] [PubMed]
  82. Zhao, Z.; Su, T.; Chesters, D.; Wang, S.; Ho, S.Y.W.; Zhu, C.; Chen, X.; Zhang, C. The mitochondrial genome of Elodia flavipalpis Aldrich (Diptera: Tachinidae) and the evolutionary timescale of tachinid flies. PLoS ONE 2013, 8, e61814. [Google Scholar] [CrossRef]
  83. Shi, Y.Q.; Li, J.; Li, H. The complete mitochondrial genome of Syritta pipiens (Linnaeus, 1758) (Diptera: Syrphidae) and phylogenetic analysis. Mitochondrial DNA B 2021, 6, 2475–2477. [Google Scholar] [CrossRef]
  84. Ojala, D.; Montoya, J.; Attardi, G. tRNA punctuation model of RNA processing in human mitochondria. Nature 1981, 290, 470–474. [Google Scholar] [CrossRef]
  85. Zheng, N.; Sun, Y.X.; Yang, L.L.; Wu, L.; Abbas, M.N.; Chen, C.; Gao, J.; Li, X.K.; Liu, C.L.; Dai, L.S. Characterization of the complete mitochondrial genome of Biston marginata (Lepidoptera: Geometridae) and phylogenetic analysis among lepidopteran insects. Int. J. Biol. Macromol. 2018, 113, 961–970. [Google Scholar] [CrossRef]
  86. Dashnow, H.; Tan, S.; Das, D.; Easteal, S.; Oshlack, A. Genotyping microsatellites in next-generation sequencing data. BMC Bioinform. 2015, 16, A5. [Google Scholar] [CrossRef] [Green Version]
  87. Li, H.; Shao, R.; Song, N.; Song, F.; Jiang, P.; Li, Z.; Cai, W. Higher-level phylogeny of paraneopteran insects inferred from mitochondrial genome sequences. Sci. Rep. 2015, 5, 8527. [Google Scholar] [CrossRef] [PubMed] [Green Version]
  88. Timmermans, M.J.T.N.; Barton, C.; Haran, J.; Ahrens, D.; Culverwell, C.L.; Ollikainen, A.; Dodsworth, S.; Foster, P.G.; Bocak, L.; Vogler, A.P. Family-level sampling of mitochondrial genomes in Coleoptera: Compositional heterogeneity and phylogenetics. Genome Biol. Evol. 2015, 8, 161–175. [Google Scholar] [CrossRef] [PubMed] [Green Version]
  89. Liu, Y.; Song, F.; Jiang, P.; Wilson, J.-J.; Cai, W.; Li, H. Compositional heterogeneity in true bug mitochondrial phylogenomics. Mol. Phylogenet. Evol. 2018, 118, 135–144. [Google Scholar] [CrossRef] [PubMed]
  90. Shatalkin, A.I. Belobackenbardia mostovskii sp.n. (Diptera, Psilidae) is the fourth species of an endemic genus found in South Africa. Russian Entomol. J. 2021, 30, 342–344. [Google Scholar] [CrossRef]
  91. Hennig, W. Neue untersuchungen über die familien der Diptera Schizophora (Diptera: Cyclorrhapha). Stuttg. Beitr. Naturkd. 1971, 226, 5–76. [Google Scholar]
  92. McAlpine, J.F. Phylogeny and Classification of the Muscomorpha. In Manual of Nearctic Diptera; McAlpine, J.F., Wood, D.M., Eds.; Research Branch Agriculture Canada: Ottawa, ON, Canada, 1989; Volume 3, pp. 1397–1518. [Google Scholar]
  93. Lambkin, C.; Pape, T.; Sinclair, B.J.; Courtney, G.W.; Skevington, J.H.; Meier, R.; Yeates, D.K.; Blagoderov, V.; Wiegmann, B.M. The phylogenetic relationships among infraorders and superfamilies of Diptera based on morphological evidence. Syst. Entomol. 2013, 38, 164–179. [Google Scholar] [CrossRef]
  94. Wiegmann, B.M.; Trautwein, M.D.; Winkler, I.S.; Barr, N.B.; Kim, J.W.; Lambkin, C.; Bertone, M.A.; Cassel, B.K.; Bayless, K.M.; Heimberg, A.M.; et al. Episodic radiations in the fly tree of life. Proc. Natl. Acad. Sci. USA 2011, 108, 5690–5695. [Google Scholar] [CrossRef] [Green Version]
  95. Nabhan, A.R.; Sarkar, I.N. The impact of taxon sampling on phylogenetic inference: A review of two decades of controversy. Brief. Bioinform. 2012, 13, 122–134. [Google Scholar] [CrossRef] [Green Version]
Figure 1. Mitochondrial genomes of Chamaepsila testudinaria, Chyliza bambusae, Chyliza chikuni, Loxocera lunata, Loxocera planivena, and Loxocera sinica. The direction of gene transcription is indicated by the arrows on the strands. Transfer RNA genes are represented by the single letter IUPAC-IUB abbreviations for their corresponding amino acid. Abbreviations: ATP6 and ATP8 for adenosine triphosphate (ATP) synthase subunits 6 and 8; COI–COIII for cytochrome C oxidase subunits I–III; CYTB for cytochrome b; ND1–ND6 and ND4L for nicotinamide adenine dinucleotide hydrogen (NADH) dehydrogenase subunits 1–6 and 4 L; lrRNA and srRNA for large and small rRNA subunits; and CR for control region.
Insects 13 00518 g001
Figure 2. Patterns of codon usage of mitochondrial protein-coding genes of 6 Psilidae species. The X-axis shows the codon families, and the Y-axis shows the total codons.
Insects 13 00518 g002
Figure 3. Relative synonymous codon usage (RSCU) of mitochondrial protein-coding genes of 6 Psilidae species. The X-axis shows different amino acids, and the Y-axis shows the RSCU value (the number of times a certain synonymous codon is used/the average number of times that all codons encoding the amino acid are used).
Insects 13 00518 g003
Figure 4. Evolutionary rates (ratios of Ka/Ks) of mitochondrial protein-coding genes of 6 Psilidae species. Abbreviations: ATP6 and ATP8 for adenosine triphosphate (ATP) synthase subunits 6 and 8; COX1–COX3 for cytochrome C oxidase subunits I–III; CYTB for cytochrome b; and ND1–ND6 and ND4L for nicotinamide adenine dinucleotide hydrogen (NADH) dehydrogenase subunits 1–6 and 4L.
Insects 13 00518 g004
Figure 5. Control regions of mitochondrial genomes of 6 Psilidae species. Structure elements found in the control regions are labeled with different color blocks: repeat unit, pink and blue; poly-T, green; poly-A, red; (TA)s, orange; and control regions flanking genes srRNA, trnI, trnQ, and trnM, grey. R refers to repeat unit.
Insects 13 00518 g005
Figure 6. AliGROOVE analyses of AA, PCG, PCG12RNA, and PCGRNA datasets. The mean similarity score between sequences is represented by colored squares, based on AliGROOVE scores ranging from −1 [a great difference in rates from the remainder of the data set, or heterogeneity (red coloring)] to +1 [rates that matched all other comparisons (blue coloring)].
Insects 13 00518 g006
Figure 7. Phylogenetic trees inferred from Bayesian inference (A) and maximum likelihood (B) analyses of AA, PCG, PCG12RNA, and PCGRNA datasets. Supports at nodes (from left to right) are Bayesian posterior probabilities (BPP) or ML bootstrap values (BSV) for AA, PCG, PCG12RNA, and PCGRNA. “-” indicates node support values unavailable.
Insects 13 00518 g007
Table 1. Taxonomic information, GenBank accession numbers, and references of mitochondrial genomes used in the present study.
SuperfamilyFamilySpeciesGenBank NumberReference
Outgroup
MuscoideaMuscidaeMusca domesticaNC_024855[59]
OestroideaTachinidaeNemorilla maculosaMG786426Direct submission
Ingroup
DiopsoideaDiopsidaeTeleopsis dalmanniCM026973Direct submission
NothybidaeNothybus sumatranusMW387954[60]
PsilidaeChamaepsila rosaeMT941918Direct submission
Chamaepsila testudinariaON258616Present study
Chyliza bambusaeON258617Present study
Chyliza chikuniON258618Present study
Loxocera lunataON258619Present study
Loxocera planivenaON258620Present study
Loxocera sinicaON258621Present study
EphydroideaDrosophilidaeDrosophila americanaMK659804Direct submission
Drosophila melanogasterNC_024511Direct submission
LauxanioideaCelyphidaeSpaniocelyphus pilosusKX372562[61]
LauxaniidaeCestrotus liuiKX372559[61]
OpomyzoideaAgromyzidaeLiriomyza bryoniaeJN570504[62]
Liriomyza sativaeJQ862475[63]
SciomyzoideaSciomyzidaePherbellia dubiaMT628567Direct submission
TephritoideaPlatystomatidaeProsthiochaeta sp.MT528242[64]
TephritidaeBactrocera dorsalisKT343905Direct submission
Ceratitis capitataNC_000857[65]
Table 2. Nucleotide composition of mitochondrial genomes of the 6 Psilidae species.
SpeciesRegionsLength (bp)T%C%A%G%A + T%AT SkewGC Skew
Chamaepsila testudinariaWhole
genome
16,60937.312.241.59.178.80.053−0.147
PCGs11,18444.511.432.211.976.7−0.160.023
1st codon position55373712.641.68.878.60.058−0.181
2nd codon position553639.910.542.27.482.10.028−0.171
3rd codon position55363513.440.61175.60.075−0.1
tRNAs146938.79.938.512.977.3−0.0030.132
rRNAs213143.76.338.211.781.9−0.0660.299
Control
region
165837.16.351.74.888.80.165−0.135
Chyliza bambusaeWhole
genome
16,66436.713.141.68.678.30.062−0.207
PCGs11,18244.411.631.412.675.8−0.1720.041
1st codon position555538.512.542.46.5810.048−0.317
2nd codon position555535.213.141.510.276.70.081−0.124
3rd codon position555436.313.740.89.177.20.058−0.2
tRNAs1457399.838.612.777.6−0.0050.132
rRNAs211643.16.138.412.581.5−0.0580.347
Control
region
185837.17.352.43.289.60.171−0.392
Chyliza chikuniWhole
genome
16,75936.514.140.59770.052−0.222
PCGs11,18243.412.730.813.274.1−0.170.019
1st codon position55873613.740.89.576.90.062−0.182
2nd codon position558636.814.439.59.376.30.035−0.214
3rd codon position558636.614.241.28.177.80.059−0.274
tRNAs1456399.838.512.677.5−0.0060.125
rRNAs211442.86.438.312.681−0.0550.327
Control
region
194138.68.549.43.5880.122−0.416
Loxocera lunataWhole
genome
16,28338.911.940.78.579.60.023−0.165
PCGs11,19643.810.933.611.777.4−0.1320.038
1st codon position542840.312.438.88.579.1−0.02−0.184
2nd codon position542839.211.341.28.380.40.025−0.151
3rd codon position5427371242.28.879.20.065−0.157
tRNAs145840.28.938.612.378.8−0.020.165
rRNAs211843.55.939.311.382.8−0.0510.315
Control
region
138945.35.346.62.991.90.014−0.292
Loxocera planivenaWhole
genome
16,48938.811.841.18.2800.029−0.177
PCGs11,18344.31133.511.277.7−0.1390.009
1st codon position54973511.243.99.978.90.113−0.059
2nd codon position549638.714.437.29.775.9−0.02−0.194
3rd codon position549642.89.842.35.185.1−0.006−0.318
tRNAs145839.78.640.211.579.90.0060.147
rRNAs212342.75.94011.482.7−0.0330.319
Control
region
153445.75.745.23.590.9−0.006−0.243
Loxocera sinicaWhole
genome
16,52738.811.841.28.3800.031−0.175
PCGs11,18344.311.133.211.477.5−0.1430.013
1st codon position550938.410.4429.180.50.045−0.064
2nd codon position550937.214.438.79.875.90.02−0.189
3rd codon position550940.710.5435.883.60.027−0.285
tRNAs145539.78.740.311.380.10.0080.131
rRNAs212542.95.940.111.183−0.0340.308
Control
region
158544.55.246.93.391.50.026−0.215
Publisher’s Note: MDPI stays neutral with regard to jurisdictional claims in published maps and institutional affiliations.

