Article

Assessment of Non-Consumptive Predation Risk of Coccinella septempunctata (Coleoptera: Coccinellidae) on the Population Growth of Sitobion miscanthi (Hemiptera: Aphididae)

1
State Key Laboratory of Crop Stress Biology in Arid Areas, College of Plant Protection, Northwest A&F University, Yangling 712100, China
2
Department of Plant Protection, Faculty of Agriculture, Van Yüzüncü Yıl University, 65080 Van, Turkey
*
Author to whom correspondence should be addressed.
Insects 2022, 13(6), 524; https://doi.org/10.3390/insects13060524
Submission received: 10 May 2022 / Revised: 28 May 2022 / Accepted: 4 June 2022 / Published: 6 June 2022

Abstract

:

Simple Summary

Changes in prey biology driven by predation threats that do not involve direct consumption are referred to as non-consumptive effects (NCEs). In general, NCEs are considered common and can affect herbivores sometimes stronger than the direct consumptive effects. However, how the NCEs of predators affect the development, survival, fecundity, and population growth of prey has not been well documented, which is the primary consideration for the compatibility of prey with its natural enemies in agricultural ecosystems. We examined the NCEs of the predator Coccinella septempunctata on the life-history traits and population growth of Sitobion miscanthi via caged predator (i.e., S. miscanthi co-existed with caged C. septempunctata) and caged prey (i.e., C. septempunctata co-existed with caged S. miscanthi) treatments by employing the age-stage, two-sex life table. The findings indicate that S. miscanthi could respond to the predation risk of caged predators by either accelerating the developmental rate or reducing the net reproductive rate, while S. miscanthi might reduce their fitness in response to the predation risk of caged prey. Furthermore, S. miscanthi might also increase the number of winged morphs under both of the above treatments. The results have practical ramifications on managing this economically important pest on wheat production with reduced insecticide applications.

Abstract

How the non-consumptive effects (NCEs) of predators influence the development, survival, fecundity, and population growth of prey has not been well documented, which is the primary consideration for the compatibility of prey with its natural enemies in agricultural ecosystems. We herein employed the age-stage, two-sex life table to examine the NCEs of the predator Coccinella septempunctata on the life-history traits and population growth of prey Sitobion miscanthi via caged predator (prey co-existing with caged predator) and caged prey (predator co-existing with caged prey) treatments with daily different exposure times (i.e., 0 h (control), 12 h, and 24 h). The results indicated that the predation risk of a caged predator could reduce the first nymphal duration and net reproductive rate (R0) of S. miscanthi at 12 h, and the first nymphal duration, preadult duration, and mean generation time (T) at 24 h. However, the predation risk of the caged prey resulted in the prolongation of the pre-adult development time and total pre-reproductive period (TPRP) as well as lowered the intrinsic rate of increase (r), finite rate of increase (𝜆), R0, life expectancy, and reproductive value of S. miscanthi after both 12 h and 24 h. Furthermore, the predation risk of both the caged predator and caged prey could increase the percent of winged morph at 24 h. These findings indicate that S. miscanthi could respond to the predation risk of the caged predator by either accelerating the developmental rate or reducing the net reproductive rate, while S. miscanthi might reduce their fitness in response to the predation risk of caged prey. Furthermore, S. miscanthi might also alter to winged morphs for dispersal under both of the above treatments. The findings obtained have practical ramifications for managing this economically important pest in wheat production with reduced insecticide applications.

1. Introduction

The predator–prey interaction is the most common basic relationship in insect ecology, which is of great significance for the development of ecological communities of farmland and pest management [1,2]. Predators can alter the prey abundance via consumption or threat. In turn, the prey can also detect and utilize a variety of cues to avoid encounters with their predators. The common method used by prey is to alter their fitness [3,4] and to migrate (for instance, prey aphids release alarm pheromones that allow other aphids to escape from predators [5,6]). Biological changes in prey driven by predation threat that does not involve direct consumption are termed non-consumptive effects (NCEs), also referred to as risk effects. NCEs can ultimately impact the prey abundance by altering the prey phenotype (e.g., behavior, morphology, or physiology) [7]. NCEs increase the complexity of the prey and predator interactions, as there can be either positive or negative effects of the predator on the prey. This knowledge can add to our understanding of how biological control agents impact pests [8]. In general, NCEs are considered common and can affect herbivores as strongly as and sometimes stronger than the direct consumptive effects [9]. Biological control in agricultural ecosystems seeks to augment insect natural enemies to suppress pest populations; therefore, a further understanding of how NECs alter the predator–prey dynamics is of particular importance [10].
To date, the related studies of NCEs of arthropod predators on prey have mainly focused on behavioral and physiological changes including changes in habitat use [11,12], feeding behavior [13], oviposition [14,15], colonization or dispersal [16], life history adjustment [17], metabolic rate [18], and the expression level of stress proteins (e.g., heat shock proteins [19]). For example, under the predator convergent lady beetle (Hippodamia convergens (Guerin) (Coleoptera: Coccinellidae)) risk, the prey potato aphids (Macrosiphum euphorbiae Thomas (Hemiptera: Aphididae)) reduced the population density [20]. Furthermore, the threat of the predator Coccinella septempunctata L. (Coleoptera: Coccinellidae) also increased the formation of alates of the prey Rhopalosiphum padi (L.) (Hemiptera: Aphididae) [21]. Generally, prey can adapt by modifying their phenotypes to avoid encounters with predators (i.e., lower predation risk). In the biological control arena, if only the consumptive effect of a predator on a target pest population is considered, large numbers of predator individuals are required; however, if the NCEs have adequate impacts on pest populations, relatively small numbers of predators are required to keep the pest numbers below economic injury levels [22]. However, how the NCEs of predators affect the development, survival, fecundity, and population growth of prey, which is the primary consideration for the compatibility of natural enemy insects, is not understood comprehensively.
The grain aphid, Sitobion miscanthi (Takahashi) (Hemiptera: Aphididae), (widely misreported as Sitobion avenae (Fabricius) (Hemiptera: Aphididae) in China [23]), is an important pest in cereal crops. The piercing-sucking mouthparts of the aphid remove the wheat phloem sap and transmit the plant virus, which seriously affects the wheat growth and reduces wheat production [24,25,26,27]. S. miscanthi has several types of natural enemies, which is an important factor for its natural control of aphid populations. The seven-spotted lady beetle, C. septempunctata, is one of the important predatory natural enemies of S. miscanthi, and its population density is high in wheat fields [28]. In order to accurately assess the effectiveness of a natural enemy and its success as a biological control agent, the NCEs and consumption effects need to be evaluated simultaneously. Many studies have shown that the lady beetle consumption effects on S. miscanthi might play a significant role in the ecological regulation of pest populations in the wheat field ecosystem [29]. However, the NCEs of C. septempunctata on S. miscanthi have not been previously reported.
Life tables are composed of comprehensive datasets regarding the survival, development, and fecundity of a population [30,31]. As a powerful tool for data analysis, insect life tables have been extensively used in fundamental research in insect population ecology and integrated pest management tactics [32,33,34]. In order to determine the variability of the prey population dynamics under the NCEs, we conducted life table studies of S. miscanthi under predatory risk by the predator C. septempunctata. These results provide critical baseline information for predator–prey interactions and pest management programs in general.

2. Materials and Methods

2.1. Collection and Maintenance of Insects

The grain aphid S. miscanthi was collected as a single parthenogenetic female from a wheat field near Yangling, Shaanxi Province, China (34.28° N, 108.22° E). Wheat seedlings (Triticum aestivum cv. ‘Aikang58’) were grown as the host plant in the bioclimatic chamber at 20 ± 1 °C, 75 ± 5% RH, and a 16L:8D h photoperiod. The wheat plants were enclosed within 30 cm × 30 cm × 30 cm cages. S. miscanthi individuals were reared for more than thirty generations under predator-free conditions prior to their use in the current experiment.
The predator C. septempunctata individuals were collected from wheat fields at the same location as the aphid clone described above and maintained in growth chambers under the same environmental conditions for more than eight generations prior to the onset of the experiments and supplied with fresh S. miscanthi at all growth stages. The adults of C. septempunctata within 24 h after emergence were isolated, and the 3-d old unmated female adults (starved for 24 h in advance) were used for the experiments [35,36].

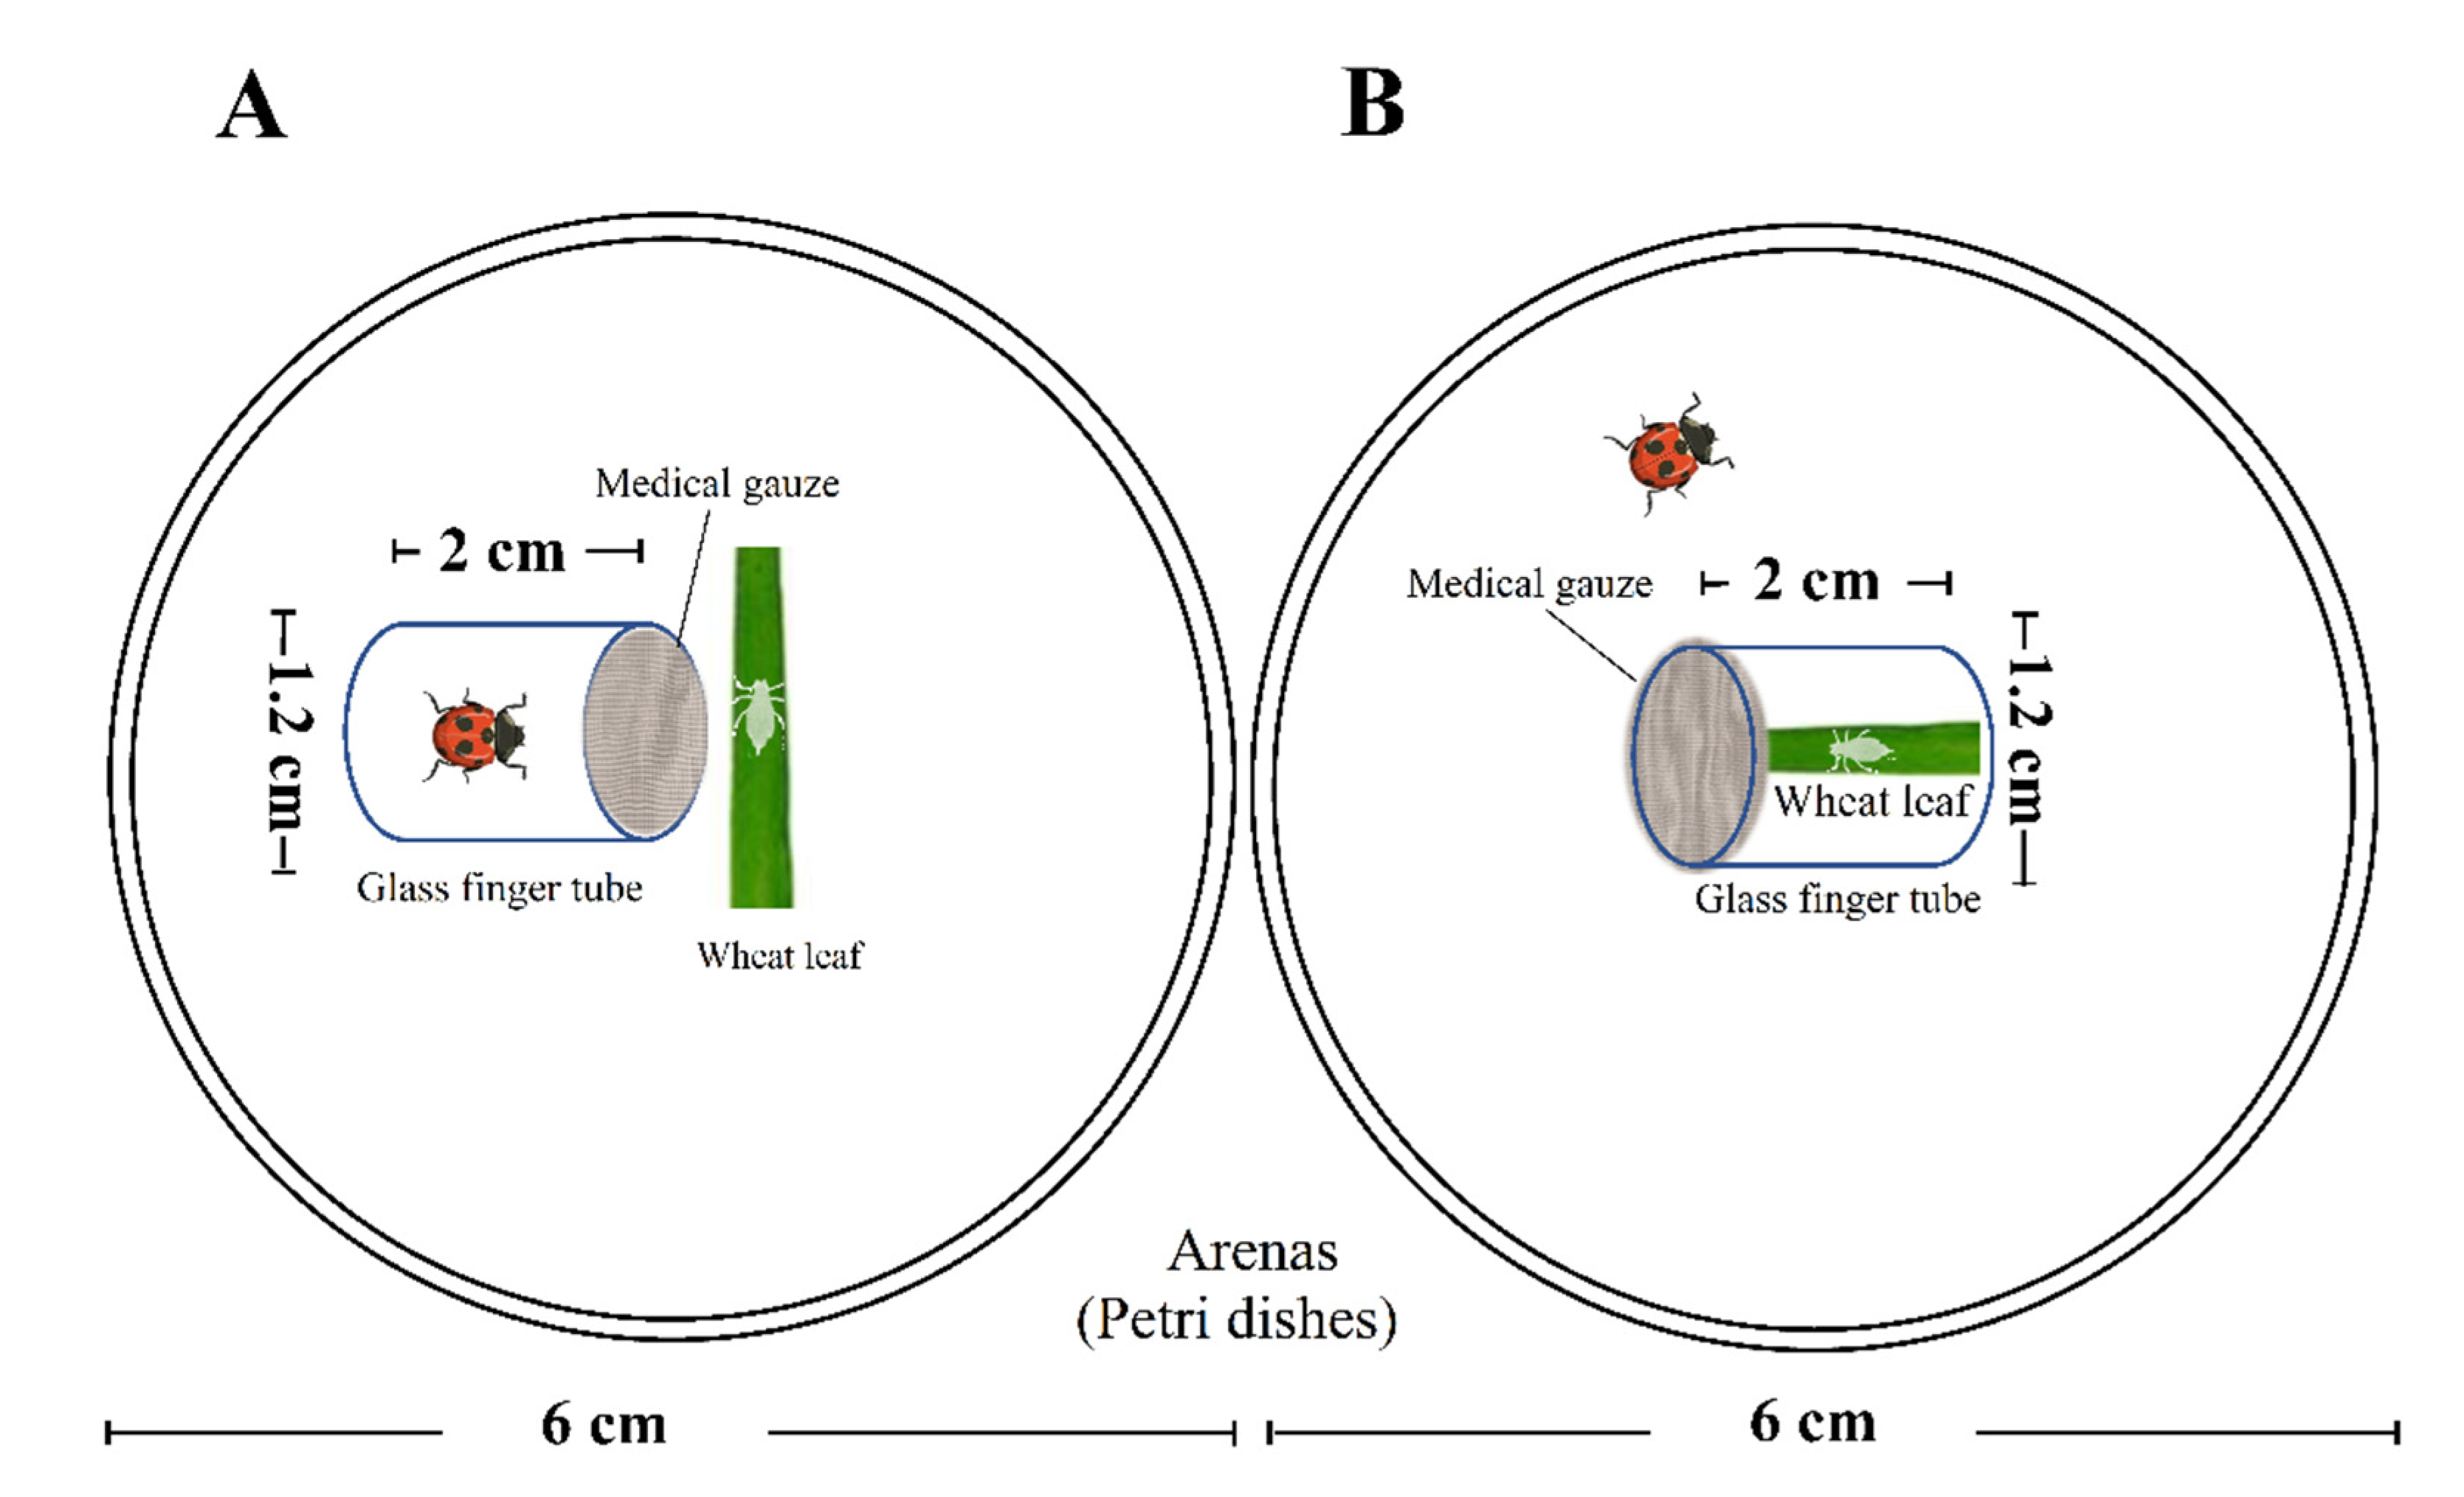
2.2. Experimental Design and Life Table Study

All experiments were conducted in the chamber conditions as shown above. Two types of predation risk treatments were employed, named, “caged predator” and “caged prey” (Figure 1); three different exposure durations per day were used in each treatment. The details are as follows:
“Caged predator” treatments: A single nymph (<12 h old) of S. miscanthi produced by a newly developed parthenogenic wingless adult aphid was transferred to a Petri dish (Ø 6 cm and 2.1 cm height) containing fresh wheat leaves (3 cm length). After 12 h of adaptation, a glass finger tube (Ø 1.2 cm and 2 cm height; sealed with medical gauze) with one randomly chosen newly emerged C. septempunctata female adult inside was transferred into the Petri dish with the aphid (Figure 1A). In the experiment, three treatments of exposed times [i.e., 0 h (control, transferred with empty glass finger tube), 12 h (half-day), and 24 h (whole day)] were employed. Every day, after being exposed for different times, the C. septempunctata was removed from the glass finger tube, and the tube was kept empty. An initial number of 30 nymphal aphids were used for each treatment. Wheat leaves were replaced with fresh ones every two days.
“Caged prey” treatments: the method was similar to the “caged predator” treatments, however, the aphid nymph was placed in the glass finger tube containing fresh wheat leaves (2 cm length), and the predator was in the Petri dish (Figure 1B). Every day, after being exposed for different times, the C. septempunctata was removed from the Petri dish.
Every 24 h, the development and survival of the immature stages were recorded for each individual. The adult pre-reproductive period (APRP), total pre-reproductive period (TPRP), number of nymphs produced, number of reproductive days, and adult longevity were all calculated after adult emergence. Newborn nymphs were removed from Petri dishes after their numbers were recorded during observations. The type of adult morph (winged or wingless adult) was also recorded.

2.3. Life Table Analysis

The life-history traits data, in other words, the development time, survival, longevity, adult pre-reproductive period (APRP; the duration from adult emergence to the first reproduction), total pre-reproductive period (TPRP; the duration from birth to the first reproduction), and fecundity of S. miscanthi were analyzed according to the age-stage, two-sex life table theory using the computer program Twosex-MSchart [37]. The population parameters estimated in the life table, their definitions, and equations used in the calculations are listed in Table 1.
The variances and standard errors of the biological and population parameters were estimated using the bootstrap resampling method with 100,000 iterations [41,45,46]. The differences between treatments were compared by using the paired bootstrap test based on the confidence interval of differences (5% significance level) [47,48,49]. The population growth of S. miscanthi for a 60 d duration was predicted using the computer program TIMING-MSChart [32,50,51]. The initial population consisted of 10 neonate nymphs.
The reproductive period considering the duration from the first to the last reproduction has been widely used in demographic studies. However, the actual number of days that an insect or mite has produced offspring is not equivalent to this period (i.e., a long reproductive period may not necessarily represent a high reproduction). Therefore, in this study, the parameter of reproductive days (Rd), which reflects the actual number of days that a female has produced offspring, was used instead of the reproductive period. The reproductive days was calculated according to Chen et al. [52] as:
R d = x = 1 N f r D x N f r
where Rd is the reproductive days; Nfr is the reproductive females (i.e., those females that actually produce live nymphs); Dx is the number of reproductive days of a single adult female.

3. Results

3.1. Nymphal Development

The immature developmental durations of S. miscanthi exposed to different predation risks are presented in Table 2. The results indicate that exposure to different predation risks affected the developmental time of the pest. Under the predation risk of the caged predator, the developmental time of the first nymphal stage aphid after 12 h and 24 h exposure time treatments was shorter than that obtained in the control treatment (p = 0.0010, p = 0.0003), leading to the shorter total preadult development time. The shortest total preadult developmental time was obtained with 24 h exposure time treatment (p = 0.0350), followed by 12 h exposure time and control treatments; however, there was no difference between the control and 12 h exposure time treatment, nor between the 12 h and 24 h exposure time treatments. In contrast to the caged predator treatment, the total preadult development time of the pest was prolonged in the caged prey treatment compared to the control treatment (p = 0.0017, p = 0.0006) (Table 2). This was due to the prolonged developmental time of the first and third nymphal stage for the 12 h and 24 h exposure time treatments.
The duration of the first nymphal stage in the caged prey trial was shorter at 0 h (p = 0.0019) and longer at exposure times of 12 and 24 h (p = 0.0059, p = 0.0252) compared to the caged predator trial. There was no difference in the duration of the second and third nymphal stages between the caged prey and caged predator trials at all exposure times. However, the duration of the fourth nymphal stage at 24 h (p = 0.041) and total preadult duration at exposure times of 12 and 24 h (p = 0.0055, p = 0.0043) were significantly shorter in the caged predator trials (Table 2).
The effects of exposure duration to different predation risks on the survival rate of the pest are shown in Table 2. Exposure to the predation risk of the caged predator for different durations (0, 12, or 24 h) did not change the pest’s survival rate. However, under the risk of the caged prey, the survival rate of the pest changed based on the exposure duration; the survival rate was the highest in the control treatment (0 h), and the lowest in the exposure of the 12 h treatment. However, the difference between the results obtained at 0 h and 24 h, and 12 h and 24 h treatments was insignificant (p > 0.05). Thus, there was no difference in the survival rate of the pest between the caged prey and caged predator trials at all exposure times.

3.2. Adult Longevity, Reproduction, and the Percent of Winged Morphs

Table 3 displays the APRP (adult pre-reproductive period), TPRP (total pre-reproductive period), adult longevity, total longevity, reproductive days, fecundity, and the percent of winged morphs of S. miscanthi exposed to different predation risks. Under the predation risk of the caged predator, exposure for 24 h resulted in a higher percentage of winged morphs than the control treatment (p < 0.001), and there was no difference between the cohorts exposed to different durations (i.e., 0, 12, and 24 h) in terms of the other biological parameters above-mentioned (Table 3). However, exposure for 12 h and 24 h to caged prey treatment resulted in a longer TPRP duration than the control treatment (p = 0.0095, p = 0.0135), and exposure for 24 h showed a higher percentage of winged morphs than the control treatment (p < 0.001). Exposure to caged prey treatment did not change the other parameters, as shown in Table 3.
Furthermore, exposure to different predation risks did not affect the APRP, total longevity, and the percentage of winged morphs of the pest. The TPRP values obtained for the aphid cohorts exposed for 12 h and 24 h to the caged predator treatment were lower than those obtained in the caged prey treatment (p = 0.0296, p = 0.0044); however, the exposure to the caged predator treatment for 24 h caused a longer adult longevity than the caged prey treatment at the same exposure duration (p = 0.0131). Exposure to caged prey for a duration of 0 h (control) and 24 h resulted in a lower number of reproductive days from the caged predator treatment. The fecundity values obtained under the caged prey treatment at 0, 12, and 24 h were significantly lower than those obtained under the caged predator treatment (p = 0.001, p = 0.0058, p < 0.001) at the same duration of exposure (Table 3).

3.3. Life Table and Population Parameters

The age-stage specific survival rate (sxj) of S. miscanthi shows the probability that a newly born nymph will survive to age x and stage j after exposure to the caged predator and caged prey systems for 0, 12, and 24 h, respectively (Figure 2). The results indicate that the probability of neonate nymphs surviving to the adult stage was the highest in the control treatment (0 h) and the lowest in the 12 h treatment in both the caged predator and caged prey systems. When exposed to 0, 12, and 24 h durations, the probability of the neonate nymphs surviving to the adult stage was 90, 77, and 87% in the caged predator system, and 93, 73, and 77% in the caged prey system, respectively. The results in the caged prey system at the 24 h exposure were different from the preadult survival rate of 80% (Table 2). The mentioned inconsistency was due to the fact that certain adults emerged earlier and died before other adults emerged. The results obtained in both systems at the same exposure duration were similar. In Figure 2, the variable rate of development among individuals is also graphically illustrated with overlap between stages.
The age-specific survival rate (lx), age-specific fecundity (mx), and age-specific maternity (lxmx) of S. miscanthi cohorts treated with different predation risks are shown in Figure 3. The curve of lx was a summation of the survival curves at different stages at age x. The highest mx and lxmx peaks occurred in the control treatments under both predation risk of the caged predator and caged prey. Under the predation risk of the caged predator, the highest peaks of mx occurred on day 13 with 4.3 offspring in the control (0 h), day 16 with 3.95 offspring at 12 h, and day 12 with 3.65 offspring at 24 h. Under the predation risk of caged prey, the highest peaks of mx occurred on day 12 with 3.33 offspring in the control (0 h), day 16 with 2.47 offspring at 12 h, and day 13 with 3.04 offspring at 24 h. The age-specific maternity (lxmx) curves showed a similar tendency.
Exposure to the predation risk of the caged predator did not affect the r and λ; there was no difference between the values obtained in the control (0 h) treatment and the two different exposure treatments (12 and 24 h). However, the R0 value at the exposure of 12 h and T value at the exposure of 24 h was significantly lower than that in the control treatment (p = 0.0494; p = 0.0036). Exposure to the predation risk of caged prey significantly affected the population parameters of the pest. Compared to the control treatment, the higher r, λ, and R0 values at the 12 h and 24 h exposure times (r: p = 0.0005, p = 0.0016; λ: p = 0.0011, p = 0.0052; R0: p = 0.0231, p = 0.0124) and a longer T value at the 12 h exposure time (p = 0.0202) were obtained (Table 4).
The life table results indicate that exposure to the predation risk of the caged prey affected the pest more than exposure to the predation risk of the caged predator. The r, λ, and R0 values, which reflect the combined effects of biological parameters such as developmental time, survival, and reproduction at 12 and 24 h exposure durations were significantly lower under the caged prey treatment from the values in the caged predator treatment (r: p = 0.0102, p = 0.0012; λ: p = 0.0097, p = 0.001). Moreover, in the control treatment, the R0 value obtained in the caged prey treatment was lower than that obtained in the caged predator treatment (Table 4). However, the T value under the caged prey treatment at 0 h (control) was significantly shorter than that at the caged predator treatment (p = 0.0014) (Table 4).
The life expectancy (exj) of S. miscanthi treated with different predation risks is shown in Figure 4. The life expectancy of the pest at age zero (i.e., e01) at the 0, 12, and 24 h exposure times was longer at the caged predator risk than under the caged prey risk. The e01 values of the pest at the 0, 12, and 24 h exposure times were determined as 24.43, 20.33, and 21.97 d in the caged predator treatment, and 22.43, 18.60, 18.87 d, respectively, in the caged prey treatment. The life expectancy of a neonate nymph was the same as the mean longevity of all individuals used in the life table study.
The reproductive value of a neonate nymph (i.e., v01, Figure 5) was the same as the finite rate (λ), as shown in Table 4. The major peak occurrence time of the reproductive values of females under the predation risk of the caged predator and caged prey were similar; however, the higher peak values were obtained with the caged predator treatment. The highest peak values of the pest cohorts at the exposure times of 0, 12, and 24 h were 16.25 (day 13), 13.93 (day 12), and 14.35 (day 12) in the caged predator treatment, respectively; and 11.85 (day 11), 11.02 (day 11), and 10.39 (day 12) in the caged prey treatment, respectively (Figure 5). The higher peaks in the caged predator treatment indicate that the aphid population will increase faster in this treatment than that of the caged prey treatment, irrespective of the exposure time durations (0, 12, or 24 h) (Figure 5).

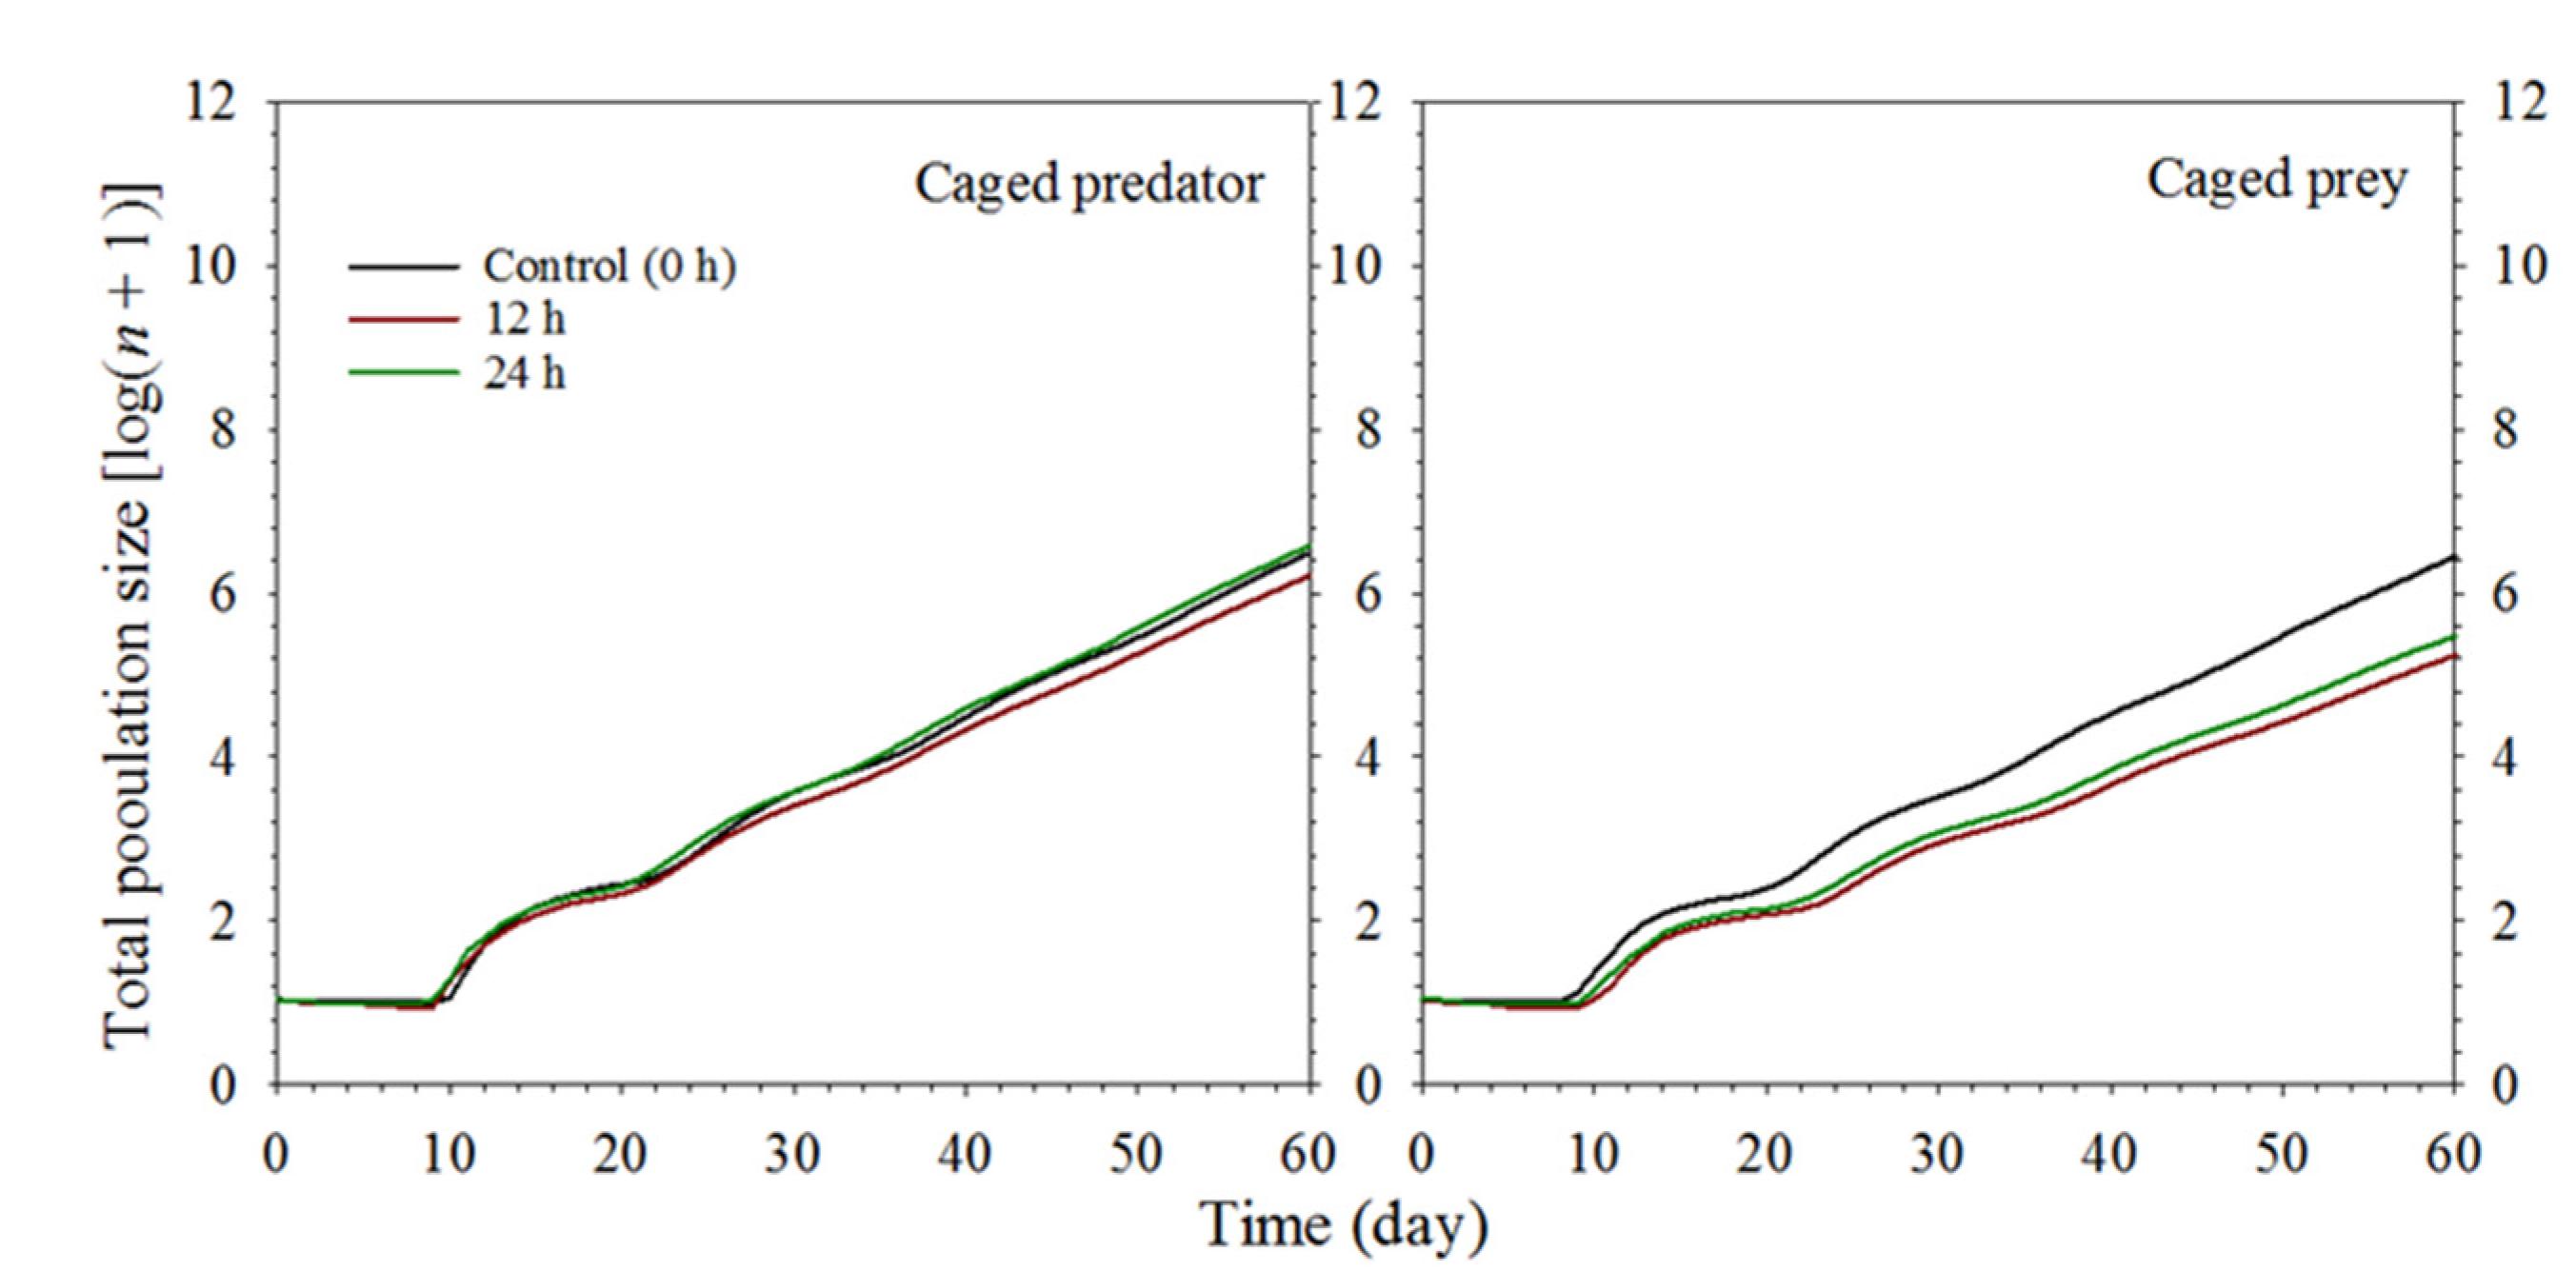
3.4. Population Projection of S. miscanthi

The projected total population size results of S. miscanthi under two different predation risks are shown in Figure 6. The population projection results in the logarithmic scale indicated that the lowest population growth rate was obtained at the exposure of 12 h under the predation risk of the caged predator. The population growth rate at the exposure of 24 h showed a similar trend as the control (0 h exposure) treatment. However, under the predation risk of the caged prey, the population growth rate at the control treatment was considerably higher than those exposed to the 12 and 24 h treatments. As with the caged predator treatment, the lowest population growth was at the 12 h exposure. In parallel with the life table results, a lower population growth was obtained in the 12 and 24 h exposure in the caged prey trial than that in the caged predator trial.

4. Discussion

Although survival/mortality estimates and life-history traits have become the main subject in many NCEs studies, there is a need for more accurate assessments. An analysis based on a robust life table method could provide the most comprehensive information to obtain a complete understanding of predation risk on the population of prey. The developmental rate, reproduction, survival, and consumption/predation capacity of arthropods may vary depending on their biological stage and sex. Therefore, considering the stage differentiation in parthenogenetic populations such as aphids is essential for a robust life table analysis and to accurately evaluate the overall fitness of a population [34]. The age-stage, two-sex life table can accurately describe the stage differentiation while incorporating the variable rate of development that occurs among individuals. Moreover, the age-stage, two-sex life table provides an accurate relationship between the mean fecundity (F) and net reproductive rate (R0), which is always R0 = F (Nf/N); where N is the initial number of nymphs used for the study and Nf is the number of female adults emerged [33]. Providing the mentioned relationship is a good indication of the reliability of the results obtained by the life table analysis.
Our results indicate that exposure to different predation risks affected the developmental time, survival rate, fecundity, and consequently, the population parameters of S. miscanthi. The population parameters obtained with life table analysis, in other words, the intrinsic rate of increase (r), finite rate of increase (λ), net reproductive rate (R0), and mean generation time (T) are appropriate indicators to evaluate the effect of different predation risks on biological traits (i.e., the development, survival, and fecundity) of the pest cohorts used in this study [46,53]. Compared to the control (0 h exposure) treatment, the lower R0 at 12 h exposure and shorter T duration at 24 h exposure in the caged predator treatment were due to differences in the preadult developmental time, survival rate, and fecundity, although the differences between the treatments in terms of survival and reproduction was insignificant. However, the lower r, λ, and R0, and longer T in the caged prey treatment for the duration of 12 and 24 h exposure were primarily due to the longer preadult developmental time and lower survival rate and reproduction. This indicates that the caged prey treatment leads to a decrease in the fitness of the pest population because even a minor decrease in the mentioned population parameters can cause a significant change in an insect population, as stated by Tuan et al. [44], Goundoudaki et al. [53], Bussaman et al. [54], Qayyum et al. [55], Zhang et al. [56], and Satishchandra et al. [57]. The population projection based on the age-stage, two-sex life table displayed a similar trend with the population parameters. As shown in our study, computer simulations based on the age-stage, two-sex life table can potentially be an invaluable tool for the evaluation of NCEs.
Our results indicated that predation risks strongly affected the development of winged polyphenism. A higher percentage of nymphs developed to alate adults under both the caged predator and caged prey treatments for 24 h exposure, which confirmed that alate polyphenism is an important biological indicator of the NCEs in S. miscanthi. Our findings are consistent with a previous study that proved that predation risk could induce winged adults in the cotton aphid, Aphis gossypii Glover (Hemiptera: Aphididae). These results suggest that the aphids showed a ‘fight or flight’ strategy by inducing winged morphs under predator risk, which could be a beneficial adaptation, facilitating aphid spread to new spaces to reduce the risk [22].
Wilson and Leather [11] reported that S. miscanthi shifted to nutritionally inferior resource/avoided preferred host under the Harmonia axyridis (Pallas) (Coleoptera: Coccinellidae) risk. Although no other studies have examined the NCEs of C. septempunctata on the population parameters of S. miscanthi, our results confirmed the results of other reports on predatory natural enemies [58,59,60]. These results suggest that the aphids also showed a ‘sit and wait’ strategy of lower population parameters [22]. Unlike that obtained in this study, exposure to the predator risk of caged H. axyridis over multiple generations in an agricultural system resulted in the increase in weight, development, and fecundity of Helicoverpa armigera (Hübner) (Lepidoptera: Noctuidae); however, it caused a reduction in its survival [17]. These results suggest that the NCEs are based on predator, prey species, and risk type. The detailed reasons for this observation need to be further examined.
Most studies that have considered the mechanism of NCEs have focused on chemical cues, however, other mechanisms including visual or tactile cues are not well documented [61,62]. In general, insect predators use chemical cues to locate prey [63], and more recently, it has been shown that prey can eavesdrop on predator chemical cues [64]. Using an experimental arena where predators had previously foraged and were subsequently removed, researchers have isolated specific contact chemical cues as a source of information for prey. For example, one previous study suggested that fewer bird cherry-oat aphids, R. padi, colonize plants where the ladybeetle predators, C. septempunctata, had previously foraged [21]. In this study, we speculated that the prey aphids were not able to avoid predator chemical cues under the caged prey treatment, while they had more space to avoid predator chemical cues under the caged predator treatment. Therefore, the negative effect of caged prey on S. miscanthi is greater than on caged predator. When a prey detects the presence of a predator, the perceived threat causes fear signals and certain adaptive changes in the prey. Walking away from the threatened feeding site is one of the prominent behavioral changes observed in aphids under predation risk [22]. The caged S. miscanthi may have been stressed because it could not do this, which may have affected its development, reproduction, and the percentage of winged morphs. However, in this study, only female individuals of C. septempunctata were used for the experiment, so the potential role of the absence of males and its effects on the NCEs of female predators needs further study.
As reported in some studies, the NCEs and their associated fitness costs have the ability or potential to restrict development and reproduction, and consequently, the population growth of prey populations [65]. The NCEs may also have an impact on irreversible life-history changes over time such as changes in the reproduction or metamorphosis timing, the quality and number of progenies produced, and even the development of winged morphs [66,67].
Large numbers of predators are necessary to generate a significant consumptive effect on a target population. However, fewer predators may be adequate to control pest populations in the case that the NCEs have a sufficient impact on the population, as stated by Carpenter et al. [68]. Although there has been progress in understanding the role of NCEs in biological control, the information on this subject is very limited. Therefore, a large amount of research is needed to clarify and exploit the effect of the NCEs in biological control studies, thus measuring the effect of natural enemies in biological control in all aspects. Moreover, prey species may respond to the presence of predators with rapid, non-genetic phenotype changes, however, the effects of this response on the biological control outcomes have been little considered [17]. Additionally, an assortment of additional factors needs to be included when projecting predator–prey interactions (e.g., the preference of the prey stage, the randomness of predation, etc.) [42].

5. Conclusions

In summary, our data revealed that S. miscanthi could implement a complex strategy of phenotypic changes in response to predation risk. Under caged predator treatment, phenotypic changes of S. miscanthi included accelerated nymphal development or decelerated net reproduction rate. However, under caged prey treatment, predation risk reduced S. miscanthi fitness. Furthermore, S. miscanthi might also change to winged morphs for dispersal under both of the above treatments. These results are expected to be used in practical applications in managing this economically important pest. However, phenotypic modifications are cross-generational and appear to be mediated by the parental effects, which amplify the adaptive responses over successive generations, and may also mitigate the associated phenotypic costs. Thus, further additional studies are required to determine the broader implications, especially regarding the information on the effects of the NCEs on the biological control outcomes.

Author Contributions

Conceptualization, Z.H., L.W. and R.A.; Methodology, Z.H. and L.W.; Software, Z.H. and L.W.; Validation, L.W., R.C. and Y.D.; Formal analysis, Z.H., L.W., R.A. and Y.D.; Investigation, L.W., Y.D. and R.C.; Resources, Z.H. and C.L.; Data curation, Z.H., R.A. and C.L.; Writing—original draft preparation, Z.H., L.W. and Y.D.; Writing—review and editing, Z.H., R.A. and C.L.; Funding acquisition, Z.H. and C.L. All authors have read and agreed to the published version of the manuscript.

Funding

This research was funded by the National Key Research and Development Program of China (grant number 2018YFD0200402) and the Chinese Universities Scientific (grant number 2452021045).

Institutional Review Board Statement

Not applicable.

Informed Consent Statement

Not applicable.

Data Availability Statement

The data presented in this study are available on request from the corresponding author.

Acknowledgments

The authors are grateful to Robert L. Stoltz, and Xinzhi Ni for their critical comments on this manuscript.

Conflicts of Interest

The authors declare no conflict of interest.

References

  1. Frank, D.A. Evidence for top predator control of a grazing ecosystem. Oikos 2008, 117, 1718–1724. [Google Scholar] [CrossRef]
  2. Hawlena, D.; Schmitz, O.J. Herbivore physiological response to predation risk and implications for ecosystem nutrient dynamics. Proc. Natl. Acad. Sci. USA 2010, 107, 15503–15507. [Google Scholar] [CrossRef] [Green Version]
  3. Sih, A. Antipredator responses and the perception of danger by mosquito larvae. Ecology 1986, 67, 434–441. [Google Scholar] [CrossRef]
  4. Turner, A.M.; Bernot, R.J.; Boes, C.M. Chemical cues modify species interactions: The ecological consequences of predator avoidance by freshwater snails. Oikos 2000, 88, 148–158. [Google Scholar] [CrossRef]
  5. Ingerslew, K.S.; Finke, D.L. Non-consumptive effects stabilize herbivore control over multiple generations. PLoS ONE 2020, 15, e0241870. [Google Scholar] [CrossRef]
  6. Fan, J.; Zhang, Y.; Francis, F.; Cheng, D.; Sun, J.; Chen, J. Orco mediates olfactory behaviors and winged morph differentiation induced by alarm pheromone in the grain aphid, Sitobion avenae. Insect Biochem. Mol. Biol. 2015, 64, 16–24. [Google Scholar] [CrossRef] [PubMed] [Green Version]
  7. Peacor, S.D.; Peckarsky, B.L.; Trussell, G.C.; Vonesh, J. Costs of predator-induced phenotypic plasticity: A graphical model for predicting the contribution of nonconsumptive and consumptive effects of predators on prey. Oecologia 2013, 171, 1–10. [Google Scholar] [CrossRef]
  8. Sheriff, M.J.; Thaler, J.S. Ecophysiological effects of predation risk; an integration across disciplines. Oecologia 2014, 176, 607–611. [Google Scholar] [CrossRef] [Green Version]
  9. Preisser, E.L.; Bolnick, D.I.; Benard, M.F. Scared to death? The effects of intimidation and consumption in predator–prey interactions. Ecology 2005, 86, 501–509. [Google Scholar] [CrossRef] [Green Version]
  10. Hajek, A.E. Natural Enemies: An Introduction to Biological Control; Cambridge University Press: Cambridge, UK, 2004. [Google Scholar]
  11. Wilson, M.R.; Leather, S.R. The effect of past natural enemy activity on host-plant preference of two aphid species. Entomol. Exp. Appl. 2012, 144, 216–222. [Google Scholar] [CrossRef]
  12. Lagrue, C.; Besson, A.A.; Lecerf, A. Interspecific differences in antipredator strategies determine the strength of non-consumptive predator effects on stream detritivores. Oikos 2015, 124, 1589–1596. [Google Scholar] [CrossRef]
  13. Rypstra, A.L.; Buddle, C. Spider silk reduces insect herbivory. Biol. Lett. 2013, 9, 20120948. [Google Scholar] [CrossRef] [Green Version]
  14. Wasserberg, G.; White, L.; Bullard, A.; King, J.; Maxwell, R. Oviposition site selection in Aedes albopictus (Diptera: Culicidae): Are the effects of predation risk and food level independent? J. Med. Entomol. 2013, 50, 1159–1164. [Google Scholar] [CrossRef] [PubMed] [Green Version]
  15. Sendoya, F.; Freitas, V.L.; Oliveira, P.S. Egg-laying butterflies distinguish predaceous ants by sight. Am. Nat. 2015, 174, 134–140. [Google Scholar] [CrossRef]
  16. Bucher, R.; Menzel, F.; Entling, M.H. Risk of spider predation alters food web structure and reduces local herbivory in the field. Oecologia 2015, 178, 571–577. [Google Scholar] [CrossRef] [PubMed]
  17. Xiong, X.; Michaud, J.P.; Li, Z.; Wu, P.; Chu, Y.; Zhang, Q.; Liu, X. Chronic, predator-induced stress alters development and reproductive performance of the cotton bollworm, Helicoverpa armigera. BioControl 2015, 60, 827–837. [Google Scholar] [CrossRef]
  18. Thaler, J.S.; Contreras, H.; Davidowitz, G. Effects of predation risk and plant resistance on Manduca sexta caterpillar feeding behaviour and physiology. Ecol. Entomol. 2014, 39, 210–216. [Google Scholar] [CrossRef]
  19. Pauwels, K.; Stoks, R.; De Meester, L. Coping with predator stress: Interclonal differences in induction of heat-shock proteins in the water flea Daphnia magna. J. Evol. Biol. 2005, 18, 867–872. [Google Scholar] [CrossRef]
  20. Kersch-Becker, M.F.; Thaler, J.S. Plant resistance reduces the strength of consumptive and non-consumptive effects of predators on aphids. J. Anim. Ecol. 2015, 84, 1222–1232. [Google Scholar] [CrossRef]
  21. Ninkovic, V.; Feng, Y.; Olsson, U.; Pettersson, J. Ladybird footprints induce aphid avoidance behavior. Biol. Control 2013, 65, 63–71. [Google Scholar] [CrossRef] [Green Version]
  22. Venkanna, Y.; Suroshe, S.S.; Dahuja, A. Non-consumptive effects of the zigzag ladybird beetle, Cheilomenes sexmaculata (Fab.) on its prey, the cotton aphid, Aphis gossypii Glover. Biocontrol Sci. Technol. 2021, 31, 1204–1219. [Google Scholar] [CrossRef]
  23. Jiang, X.; Zhang, Q.; Qin, Y.; Yin, H.; Zhang, S.; Li, Q.; Zhang, Y.; Fan, J.; Chen, J. A chromosome-level draft genome of the grain aphid Sitobion miscanthi. GigaScience 2019, 8. [Google Scholar] [CrossRef] [Green Version]
  24. Li, D.; Su, D.; Tong, Z.; Zhang, C.; Zhang, G.; Zhao, H.; Hu, Z. Virus-dependent and -independent responses of Sitobion avenae (Hemiptera: Aphididae) feeding on wheat infected by transmitted and nontransmitted viruses at transcriptomic level. J. Econ. Entomol. 2019, 112, 2067–2076. [Google Scholar] [CrossRef]
  25. Luo, C.; Monticelli, L.S.; Li, D.; Ahmed, S.S.; Pandharikar, G.; Zhao, H.; Desneux, N.; Hu, Z. Comparison of life-history traits and resistance for Sitobion avenae (Fabricius) harboring a facultative symbiont. Entomol. Gen. 2020, 40, 39–47. [Google Scholar] [CrossRef]
  26. Hu, Z.; Su, D.; Li, D.; Tong, Z.; Zhang, C.; Zhang, G.; Zhao, H.; Luo, C. Diversity of secondary endosymbionts among different geographical populations of the grain aphid, Sitobion avenae (Fabricius) (Hemiptera:Aphididae) in China. Entomol. Gen. 2020, 40, 253–262. [Google Scholar] [CrossRef]
  27. Luo, C.; Chai, R.; Liu, X.; Dong, Y.; Desneux, N.; Feng, Y.; Hu, Z. The facultative symbiont Regiella insecticola modulates non-consumptive and consumptive effects of Harmonia axyridis on host aphids. Entomol. Gen. 2022. [Google Scholar] [CrossRef]
  28. Krengel, S.; Richter, C.; Freier, B.; Stangl, G.I.; Brandsch, C. The effect of elevated temperatures on food conversion ef-ficiencies of Coccinella septempunctata and Harmonia axyridis young adults feeding on Sitobion avenae. J. Plant. Dis. Prot. 2013, 120, 218–226. [Google Scholar] [CrossRef]
  29. Chen, F.J.; Gang, W.; Parajulee, M.N.; Feng, G. Impact of elevated CO2 on the third trophic level: A predator Harmonia axyridis and a parasitoid Aphidius picipes. Biocontrol. Sci. Techn. 2007, 17, 313–324. [Google Scholar] [CrossRef]
  30. Stark, J.D.; Banks, J.E. Population-level effects of pesticides and other toxicants on arthropods. Annu. Rev. Entomol. 2003, 48, 505–519. [Google Scholar] [CrossRef] [PubMed]
  31. Guedes, R.N.C.; Smagghe, G.; Stark, J.D.; Desneux, N. Pesticide-induced stress in arthropod pests for optimized integrated pest management programs. Annu. Rev. Entomol. 2016, 61, 43–62. [Google Scholar] [CrossRef] [Green Version]
  32. Chi, H.; Liu, H. Two new methods for the study of insect population ecology. Bull. Inst. Zool. Acad. Sinica. 1985, 24, 225–240. [Google Scholar]
  33. Chi, H. Life-table analysis incorporating both sexes and variable development rates among individuals. Environ. Entomol. 1988, 17, 26–34. [Google Scholar] [CrossRef]
  34. Chi, H.; You, M.S.; Atlihan, R.; Smith, C.L.; Kavousi, A.; Özgökçe, M.S.; Güncan, A.; Tuan, S.; Fu, J.; Xu, Y.; et al. Age-Stage, two-sex life table: An introduction to theory, data analysis, and application. Entomol. Gen. 2020, 40, 103–124. [Google Scholar] [CrossRef]
  35. Ramírez-Cáceres, G.E.; Moya-Hernández, M.G.; Quilodrán, M.; Nespolo, R.F.; Ramírez, C.C. Harbouring the secondary endosymbiont Regiella insecticola increases predation risk and reproduction in the cereal aphid Sitobion avenae. J. Pest. Sci. 2019, 92, 1039–1047. [Google Scholar] [CrossRef]
  36. Yu, X.L.; Tang, R.; Xia, P.L.; Wang, B.; Feng, Y.; Liu, T.X. Effects of prey distribution and heterospecific interactions on the functional response of Harmonia axyridis and Aphidius gifuensis to Myzus persicae. Insects 2020, 11, 325. [Google Scholar] [CrossRef] [PubMed]
  37. Chi, H. TWOSEX-MSChart: A Computer Program for the Age-Stage, Two-Sex Life Table Analysis; National Chung Hsing University: Taichung, Taiwan, 2020; Available online: http://140.120.197.173/Ecology/prod02.htm (accessed on 13 May 2020).
  38. Chang, C.; Huang, Y.C.; Dai, S.M.; Atlihan, R.; Chi, H. Genetically engineered ricin suppresses Bactrocera dorsalis (Diptera: Tephritidae) based on demographic analysis of group-reared lifetable. J. Econ. Entomol. 2016, 109, 987–992. [Google Scholar] [CrossRef] [PubMed] [Green Version]
  39. Chi, H.; Su, H.-Y. Age-stage, two-sex life tables of Aphidius gifuensis(Ashmead) (Hymenoptera: Braconidae) and its host Myzus persicae(Sulzer) (Homoptera: Aphididae) with mathematical proof of the relationship between female fecundity and the net reproductive rate. Environ. Entomol. 2006, 35, 10–21. [Google Scholar] [CrossRef]
  40. Cook, L. The genetical theory of natural selection: A complete variorum edition. Heredity 2000, 84, 390–391. [Google Scholar] [CrossRef]
  41. Huang, Y.B.; Chi, H. The age-stage, two sex life table with an offspring sex ratio dependent on female age. J. Agri. Fore. 2011, 60, 337–345. Available online: https://www.researchgate.net/publication/265661520_The_Age-Stage_Two-Sex_Life_Table_with_an_Offspring_Sex_Ratio_Dependent_on_Female_Age (accessed on 2 January 2022).
  42. Tuan, S.J.; Lee, C.C.; Chi, H. Population and damage projection of Spodoptera litura (F.) on peanuts (Arachis hypogaea L.) under different conditions using the age-stage, two-sex life table. Pest. Manag. Sci. 2014, 70, 805–813. [Google Scholar] [CrossRef] [PubMed]
  43. Tuan, S.J.; Lee, C.C.; Chi, H. Population and damage projection of Spodoptera litura (F.) on peanuts (Arachis hypogaea L.) under different conditions using the age-stage, two-sex life table. Pest. Manag. Sci. 2014, 70, 1936, Erratum. [Google Scholar] [CrossRef]
  44. Tuan, S.J.; Yeh, C.C.; Atlihan, R.; Chi, H.; Tang, L.C. Demography and consumption of Spodoptera literal(Lepidoptera: Noctuidae) reared on cabbage and Taro. J. Econ. Entomol. 2015, 109, 732–739. [Google Scholar] [CrossRef]
  45. Efron, B.; Tibshirani, R.J. An introduction to the bootstrap. Chapman & Hall: New York, NY, USA, 1993; Available online: https://onlinelibrary.wiley.com/doi/pdf/10.1111/1467-9639.00050 (accessed on 2 January 2022).
  46. Akköprü, E.P.; Atlıhan, R.; Okut, H.; Chi, H. Demographic assessment of plant cultivar resistance to insect pests: A case study of the dusky-veined walnut aphid (Hemiptera: Callaphididae) on five walnut cultivars. J. Econ. Entomol. 2015, 108, 378–387. [Google Scholar] [CrossRef]
  47. Brandstätter, E. Confidence intervals as an alternative to significance testing. Methods. Psychol. Res. 1999, 4, 33–46. [Google Scholar]
  48. Hesterberg, T.; Moore, D.S.; Monaghan, S.; Clipson, A.; Epstein, R. Bootstrap methods and permutation tests. In The Practice of Business Statistics, 2nd ed.; Moore, D.S., McCabe, G.P., Duckworth, W.M., Sclove, S.L., Eds.; W. H. Freeman and Company: New York, NY, USA, 2005; Chapter 14. [Google Scholar]
  49. Hesterberg, T. It’s time to retire the “n >= 30” rule; Proceedings of the American Statistical Association.; Statistical Com-puting Section. 2008. Available online: https://www.semanticscholar.org/paper/It's-Time-To-Retire-the-%22n-%3E%3D-30%22-rule.-Hesterberg/66ab2c3b77b9e1e5ece37e804559ae4b0d17fe15 (accessed on 2 January 2022).
  50. Chi, H. Timing of control based on the stage structure of pest populations: A simulation approach. J. Econ. Entomol. 1990, 83, 1143–1150. [Google Scholar] [CrossRef]
  51. Chi, H. Timing-MSChart: A Computer Program for the Population Projection Based on Age-Stage, Two-Sex Life Table; National Chung Hsing University: Taichung, Taiwan, 2020; Available online: http://140.120.197.173/Ecology/prod02.htm (accessed on 13 May 2020).
  52. Chen, G.M.; Chi, H.; Wang, R.C.; Wang, Y.P.; Xu, Y.Y.; Li, X.D.; Yin, P.; Zheng, F.Q. Demography and uncertainty of population growth of Conogethes punctiferalis (Lepidoptera: Crambidae) reared on five host plants with discussion on some life history statistics. J. Econ. Entomol. 2018, 111, 2143–2152. [Google Scholar] [CrossRef] [PubMed]
  53. Goundoudaki, S.; Tsitsipis, J.A.; Margaritopoulos, J.T.; Zarpas, K.D.; Divanidis, S. Performance of the tobacco aphid Myzus persicae (Hemiptera: Aphididae) on Oriental and Virginia tobacco varieties. Agric. For. Entomol. 2003, 5, 285–291. [Google Scholar] [CrossRef]
  54. Bussaman, P.; Sa-Uth, C.; Chandrapatya, A.; Atlihan, R.; Gökçe, A.; Saska, P.; Chi, H. Fast Population growth in physogastry reproduction of Luciaphorus perniciosus (Acari: Pygmephoridae) at different temperatures. J. Econ. Entomol. 2017, 110, 1397–1403. [Google Scholar] [CrossRef]
  55. Qayyum, A.; Aziz, A.; Iftikhar, A.; Hafeez, F.; Atlihan, R. Demographic parameters of Lipaphis erysimi (Hemiptera: Aphididae) on different cultivars of brassica vegetables. J. Econ. Entomol. 2018, 111, 1885–1894. [Google Scholar] [CrossRef] [PubMed]
  56. Zhang, Y.; Guo, L.; Atlihan, R.; Chi, H.; Chu, D. Demographic analysis of progeny fitness and timing of resurgence of Laodelphax striatellus after insecticides exposure. Entomol. Gen. 2019, 39, 221–230. [Google Scholar] [CrossRef]
  57. Satishchandra, K.N.; Chakravarthy, A.K.; Özgökçe, M.S.; Atlihan, R. Population growth potential of Tuta absoluta (Meyrick) (Lepidoptera: Gelechiidae) on tomato, potato, and eggplant. J. Appl. Entomol. 2019, 143, 518–526. [Google Scholar] [CrossRef]
  58. Siepielski, A.M.; Wang, J.; Prince, G. Nonconsumptive predator-driven mortality causes natural selection on prey. Evolution 2013, 68, 696–704. [Google Scholar] [CrossRef]
  59. Sitvarin, M.I.; Breen, K.; Rypstra, A.L. Predator cues have contrasting effects on lifespan of Pardosa milvina (Araneae: Lycosidae). J. Arachnol. 2015, 43, 107–110. [Google Scholar] [CrossRef]
  60. Rendon, D.; Whitehouse, M.E.; Taylor, P.W. Consumptive and non-consumptive effects of wolf spiders on cotton bollworms. Entomol. Exp. et Appl. 2016, 158, 170–183. [Google Scholar] [CrossRef]
  61. Bray, A.; Nieh, J. Non-consumptive predator effects shape honey bee foraging and recruitment dancing. PLoS ONE 2014, 9, e87459. [Google Scholar] [CrossRef] [Green Version]
  62. Hermann, S.L.; Thaler, J.S. Prey perception of predation risk: Volatile chemical cues mediate non-consumptive effects of a predator on a herbivorous insect. Oecologia 2014, 176, 669–676. [Google Scholar] [CrossRef]
  63. Hatano, E.; Kunert, G.; Michaud, J.; Weisser, W.W. Chemical cues mediating aphid location by natural enemies. Eur. J. Èntomol. 2008, 105, 797–806. [Google Scholar] [CrossRef] [Green Version]
  64. Gonthier, D.J. Do herbivores eavesdrop on ant chemical communication to avoid predation? PLoS ONE 2012, 7, e28703. [Google Scholar] [CrossRef]
  65. Nelson, E.H. Predator avoidance behavior in the pea aphid: Costs, frequency, and population consequences. Oecologia 2006, 151, 22–32. [Google Scholar] [CrossRef]
  66. Relyea, R.A. Getting out alive: How predators affect the decision to metamorphose. Oecologia 2007, 152, 389–400. [Google Scholar] [CrossRef]
  67. Mappes, J.; Mappes, T.; Lappalainen, T. Unequal maternal investment in offspring quality in relation to predation risk. Evol. Ecol. 1997, 11, 237–243. [Google Scholar] [CrossRef]
  68. Carpenter, S.R.; Kitchell, J.F.; Hodgson, J.R.; Cochran, P.A.; Elser, J.; Elser, M.M.; Lodge, D.M.; Kretchmer, D.; He, X.; Von Ende, C.N. Regulation of lake primary productivity by food web structure. Ecology 1987, 68, 1863–1876. [Google Scholar] [CrossRef] [PubMed] [Green Version]
Figure 1. The experimental design for the caged predator model (A) and caged prey model (B). n = 30.
Insects 13 00524 g001
Figure 2. The age-stage specific survival rates (sxj) of Sitobion miscanthi under predator Coccinella septempunctata risk at different exposure times (0, 12, and 24 h) with either the caged predator or caged prey treatments. N: Nymphal instar of S. miscanthi.
Insects 13 00524 g002
Figure 3. The age-specific survival rates (lx), age-specific fecundity (mx), and net maternity (lxmx) of Sitobion miscanthi reared under predator Coccinella septempunctata risk at different exposure times (0, 12, and 24 h) with either the caged predator or caged prey treatments.
Insects 13 00524 g003
Figure 4. The age-stage specific life expectancy (exj) of Sitobion miscanthi reared under predator Coccinella septempunctata risk at different exposure times (0, 12, and 24 h) with either the caged predator or caged prey treatments. N: Nymphal instar of S. miscanthi.
Insects 13 00524 g004
Figure 5. The age-stage specific reproductive value (vxj) of Sitobion miscanthi reared under predator Coccinella septempunctata risk at different exposure times (0, 12, and 24 h) with either the caged predator or caged prey treatments. N: Nymphal instar of S. miscanthi.
Insects 13 00524 g005
Figure 6. Population projections for Sitobion miscanthi reared under predator Coccinella septempunctata risk at different exposure times (0, 12, and 24 h) with either the caged predator or caged prey treatments.
Insects 13 00524 g006
Table 1. The population parameters, their definitions, and the equations used in their calculations.
Parameter and EquationDefinition
Adult pre-reproductive period:   A P R P = i = 1 N f D i / N f The mean duration from the emergence of a female adult to its first reproduction.
Total pre-reproductive period:   T P R P = i = 1 N f T i / N f The mean duration from the birth of a female individual to its first reproduction. A short TPRP denotes that the cohort can produce offspring earlier.
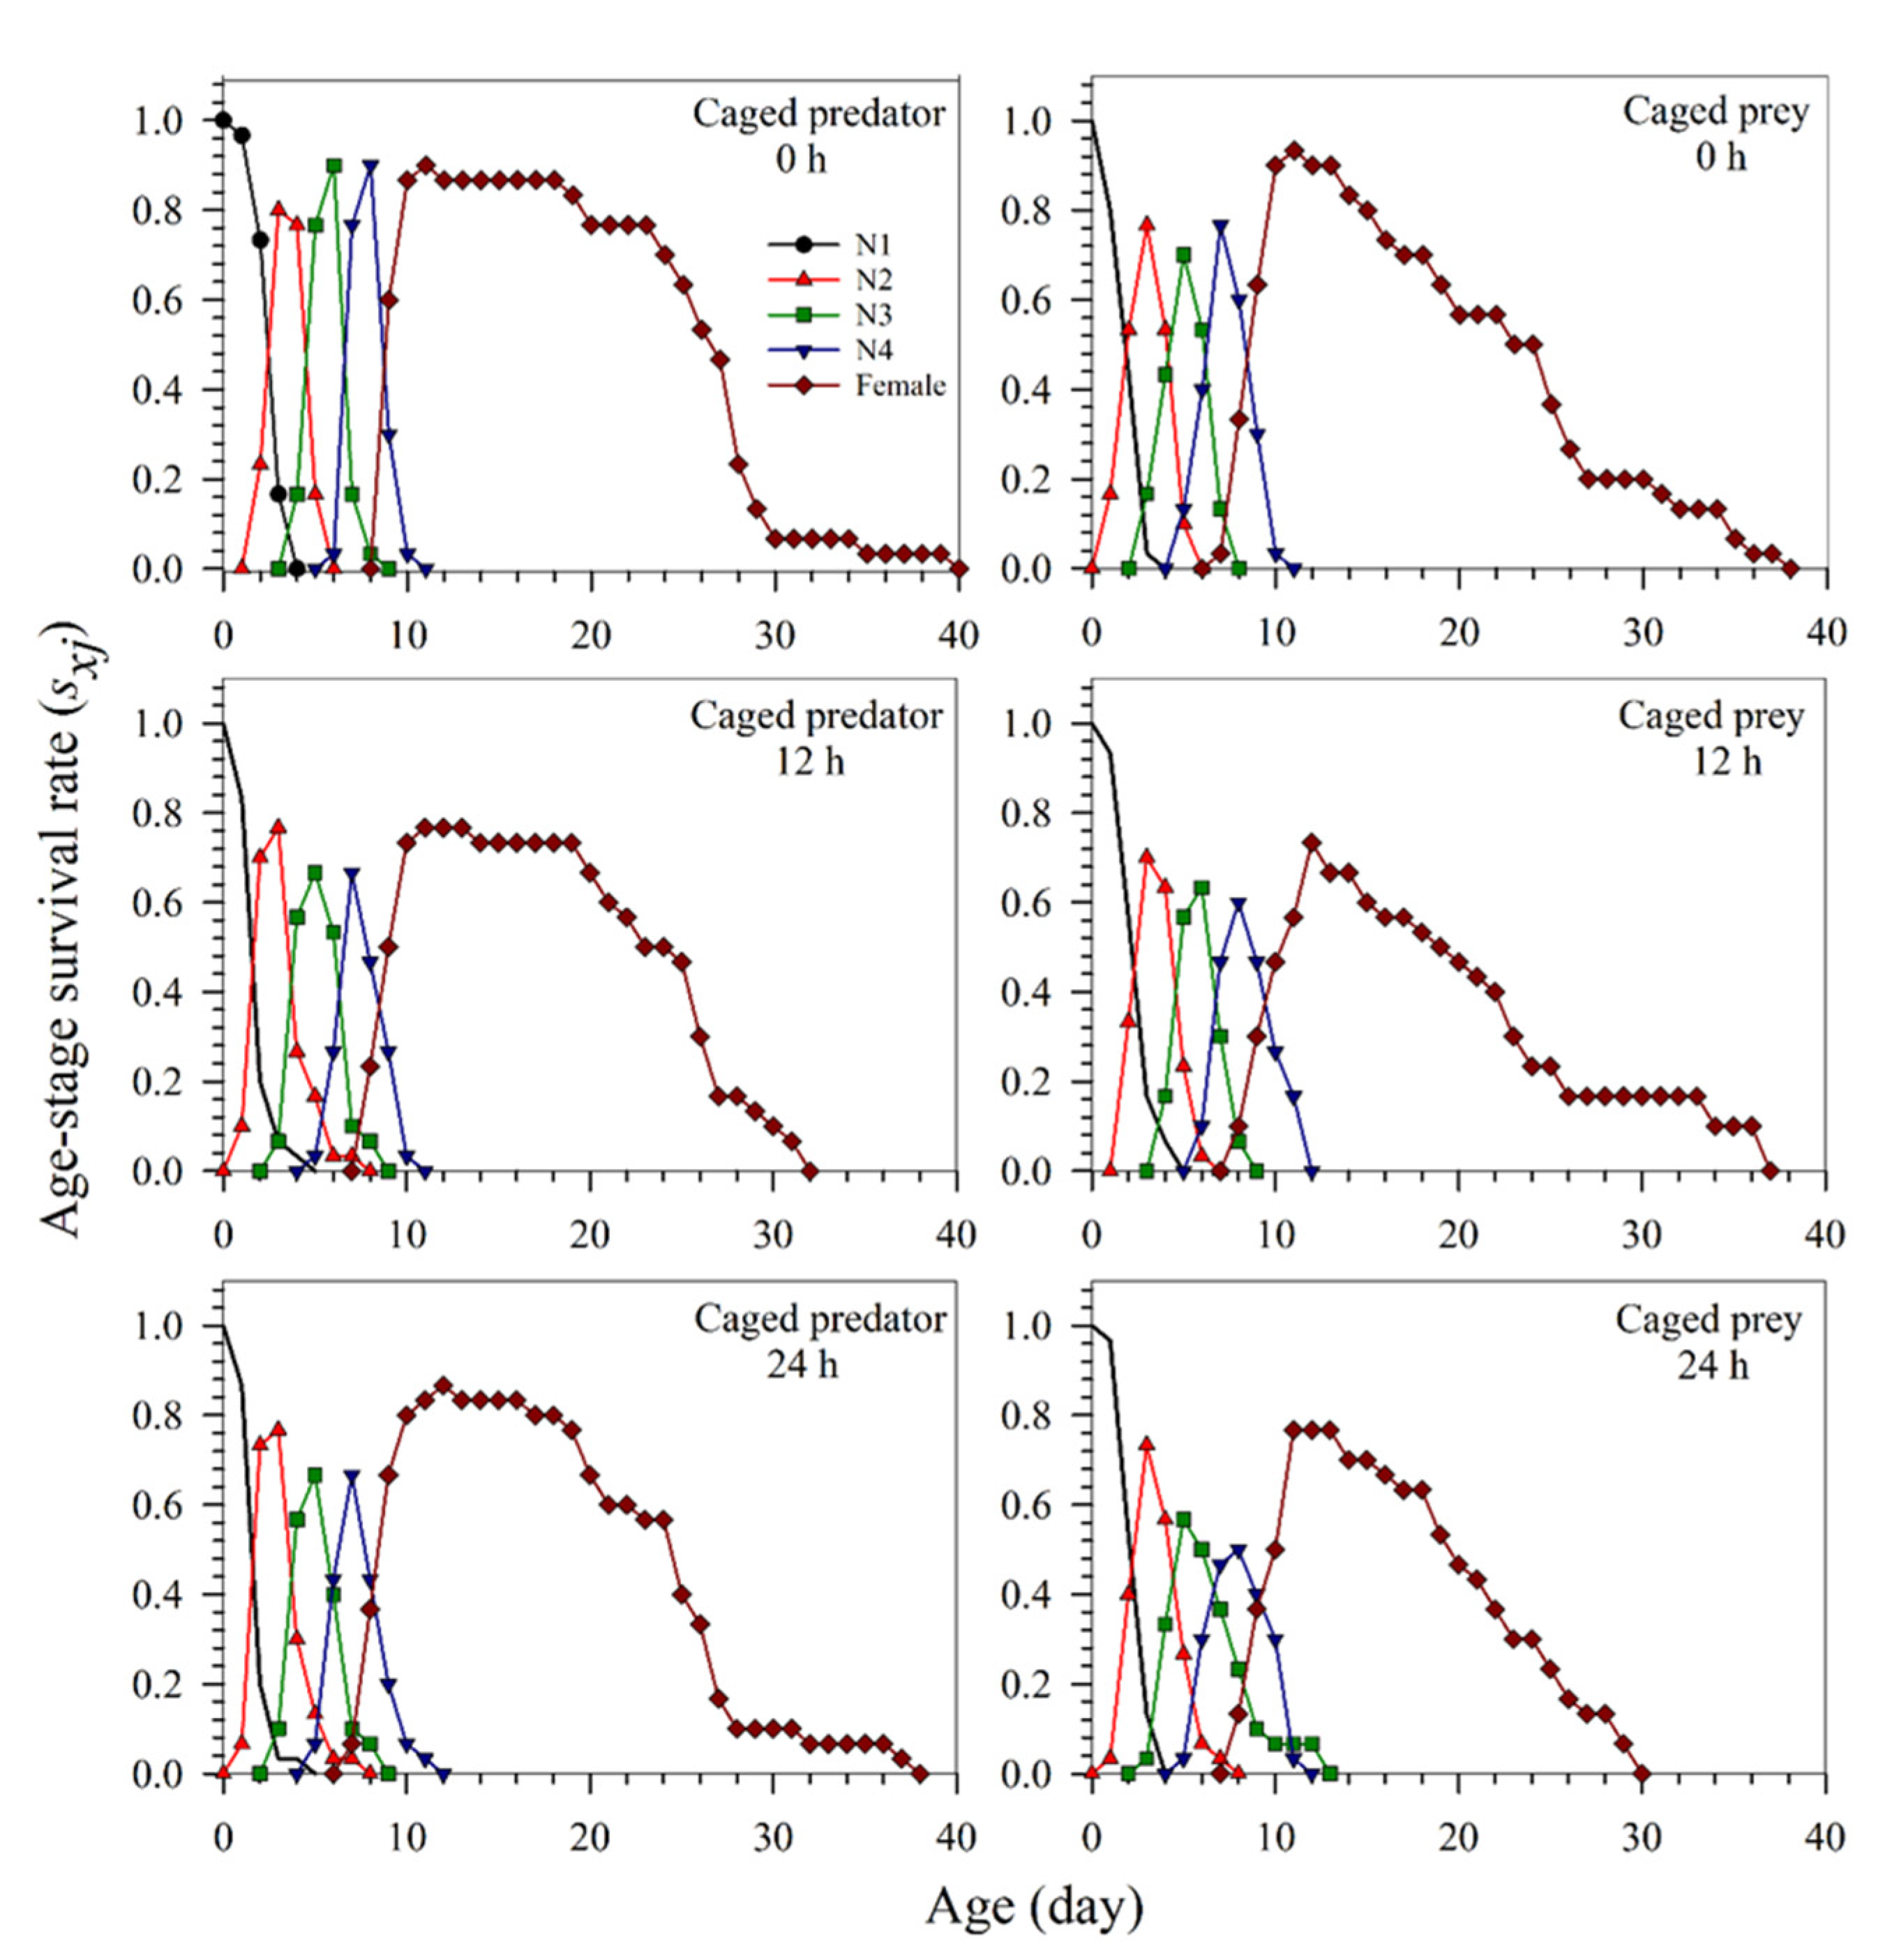
Age-stage survival rate: s x j = n x j / n 01 The notation sxj represents the probability that a newly born individual will survive to age x and stage j, where n01 is the number of individuals used at the beginning of the life table study (i.e., the cohort size, and nxj is the number of surviving individuals at age x and stage j). The curves of sxj reveal the stage differentiation and the emergence of adults [38].
Age-stage specific fecundity: fxjThe mean number of offspring produced by female adults at age x. The values fxj occurred at younger ages make a greater contribution to the intrinsic rate of increase and the finite rate of increase [32].
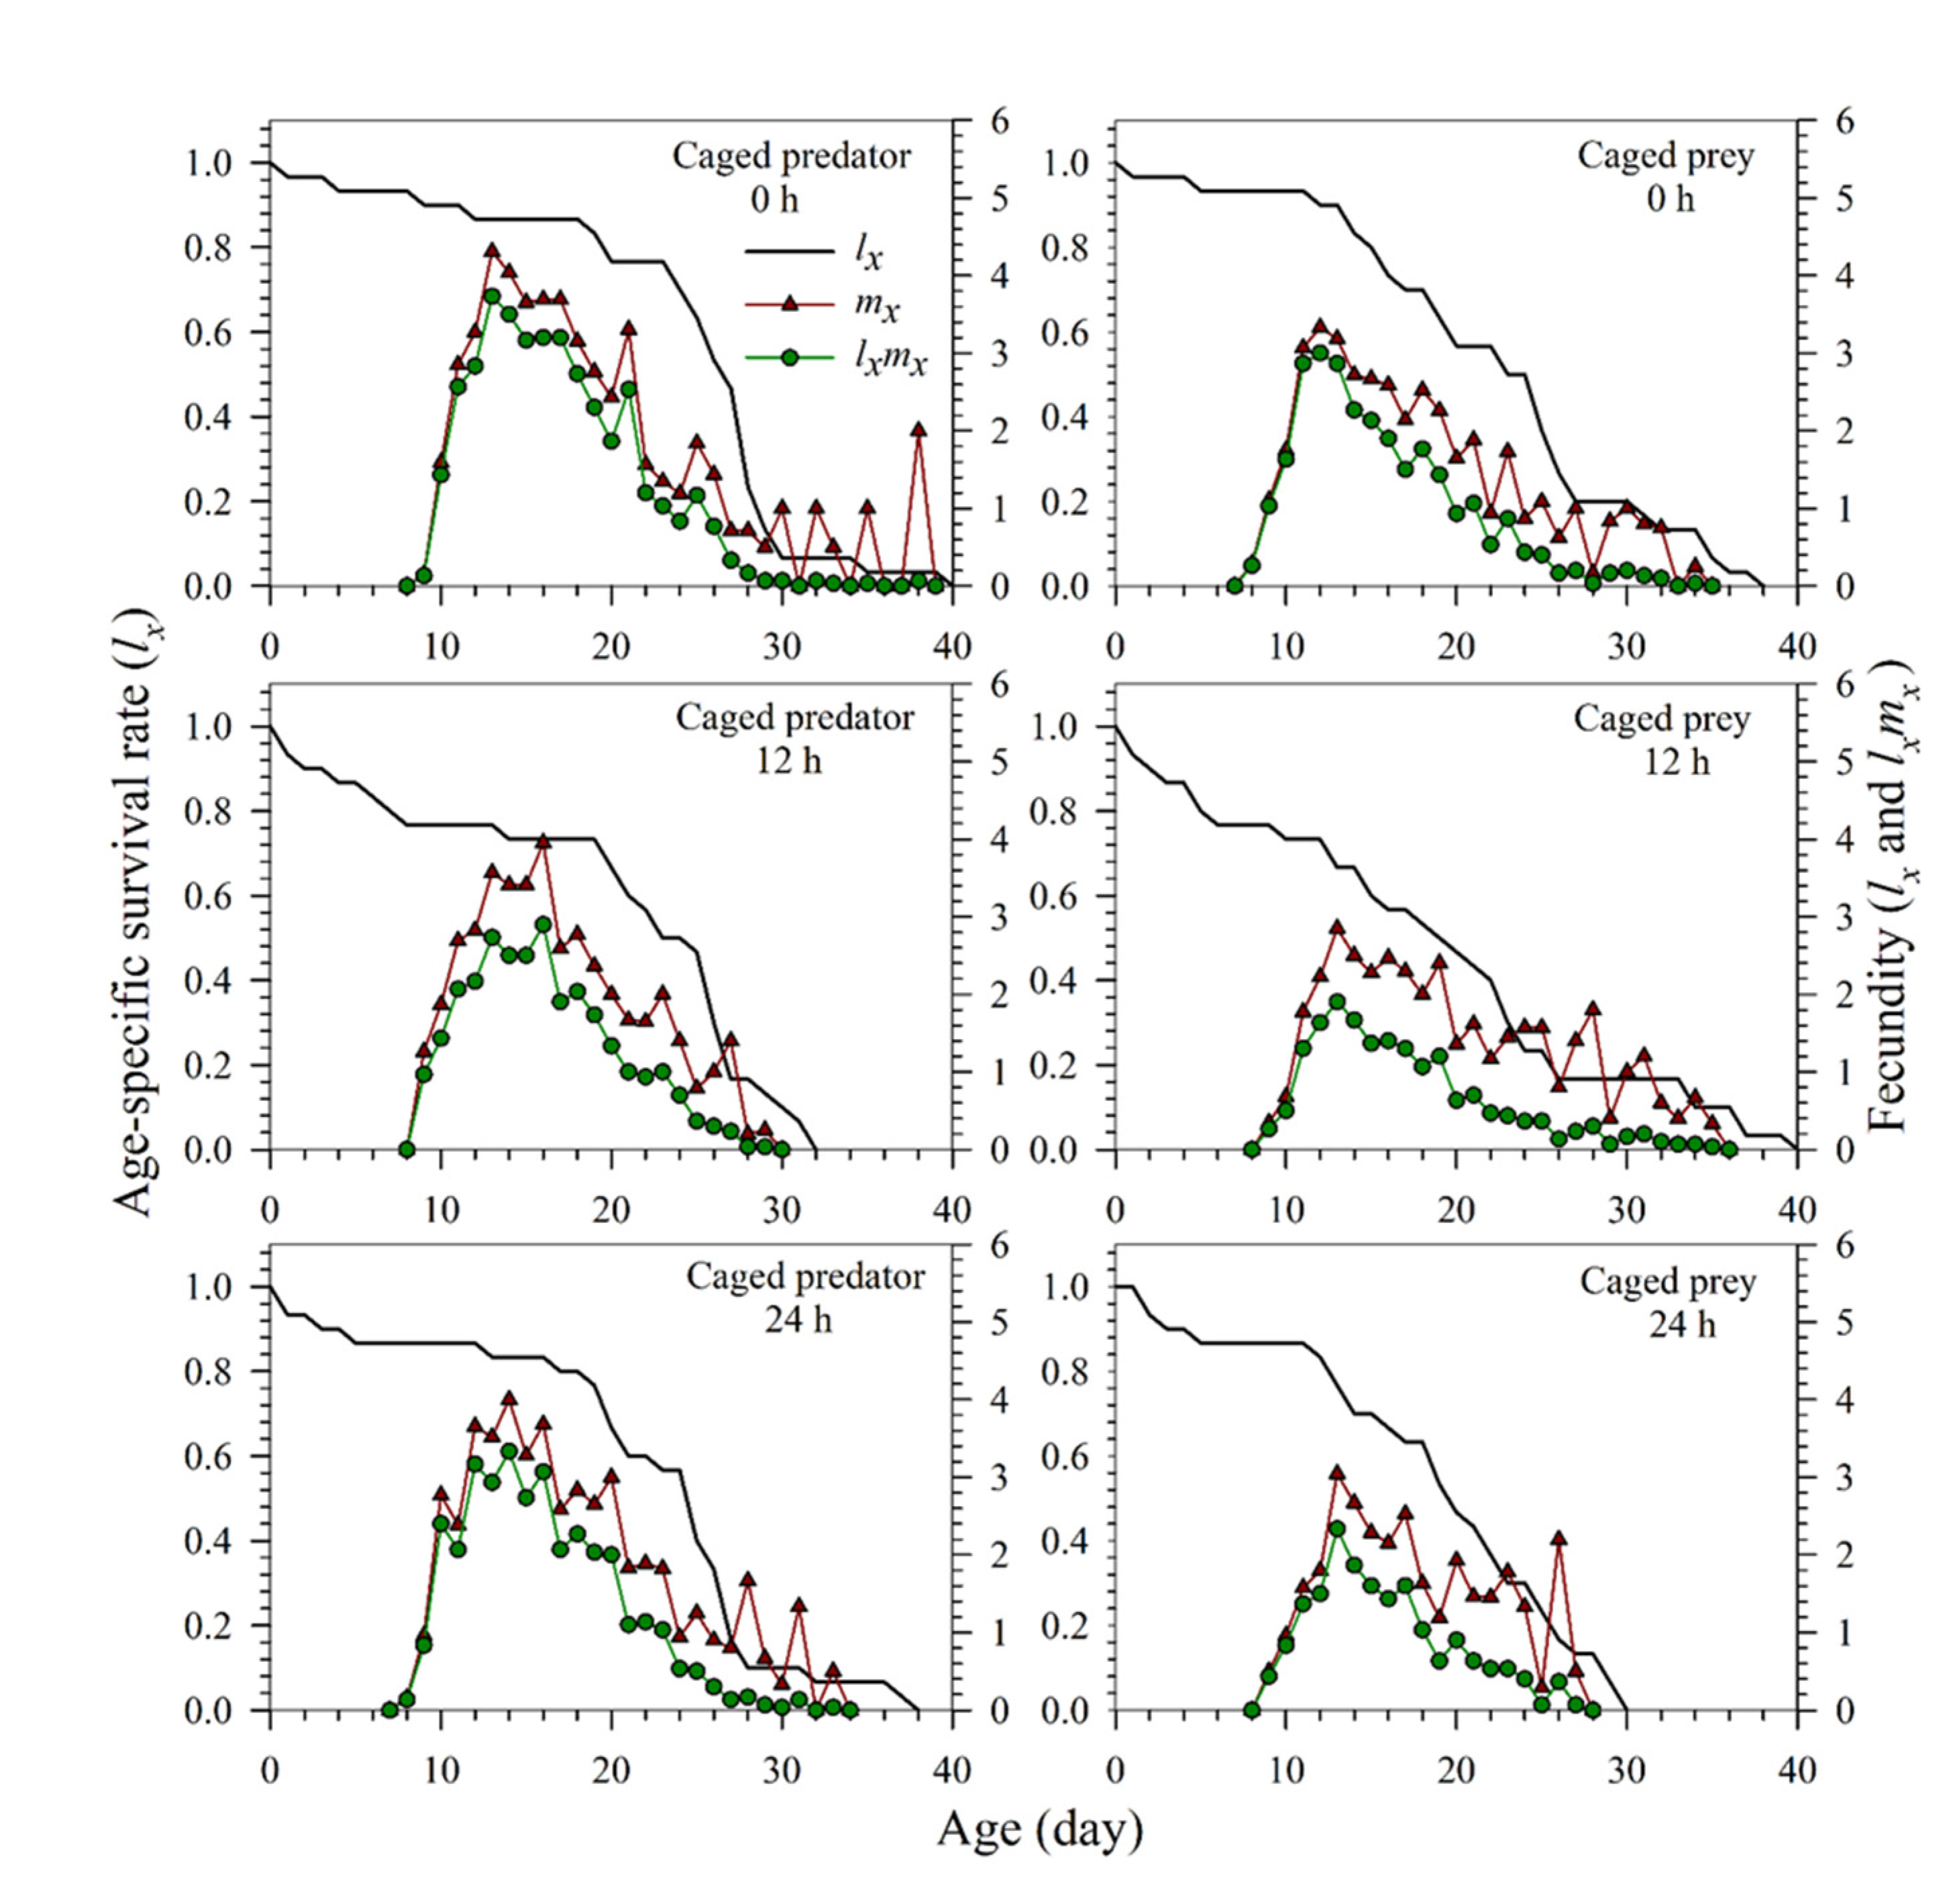
Age-specific survival rate: l x = j = 1 m s x j The probability that a newborn offspring will survive to age x (m is the number of stages). It is the pooled survival rate of all stages; therefore, it is the simplified version of sxj ignoring the stage differentiation [32].
Age-specific fecundity: m x = j = 1 m s x j f x j / j = 1 m s x j The mean number of offspring produced by all surviving individuals at age x. If only a few individuals among all surviving ones can produce offspring at age x, there will be a significant gap between fxj and mx [32].
Net reproductive rate: R 0 = x = 0 l x m x The total number of offspring that an average individual (including females, and those died in the immature stage) can produce during its lifetime. Because R0 takes into consideration of the survival rate, it is usually less than the mean fecundity calculated based on female adults (i.e., R0 < F) [32].
Intrinsic rate of increase: x = 0 e r x + 1 j = 1 m s x j f x j = x = 0 e r x + 1 l x m x = 1 The population growth rate as the time approaches infinity and the population reaches the stable age-stage distribution (SASD). The population size will increase at the rate of er per time unit. It is calculated by using the Euler–Lotka equation with age indexed from 0. The intrinsic rate is commonly used as an indicator of population fitness [32].
The finite rate: λ = e r The population growth rate as the time approaches infinity and the population reaches the stable age-stage distribution. The population size will increase at the rate of λ per time unit. The finite rate of increase is also used as an indicator of population fitness [32].
Mean generation time: T = ln R 0 / r It is the time length that a population requires to increase to R0-fold of its size as the population growth rate reaches r and λ [32].
Age-stage life expectancy: e x j = i = x y = j m s i y The time that an individual of age x and stage j is expected to live. The notation s i y is the probability that an individual of age x and stage j will survive to age i and stage y. It is calculated by assuming sxj = 1 [39]. Because the calculation of exj is not based on the assumption of SASD, it can be used to predict the longevity of individuals at age x and stage j.
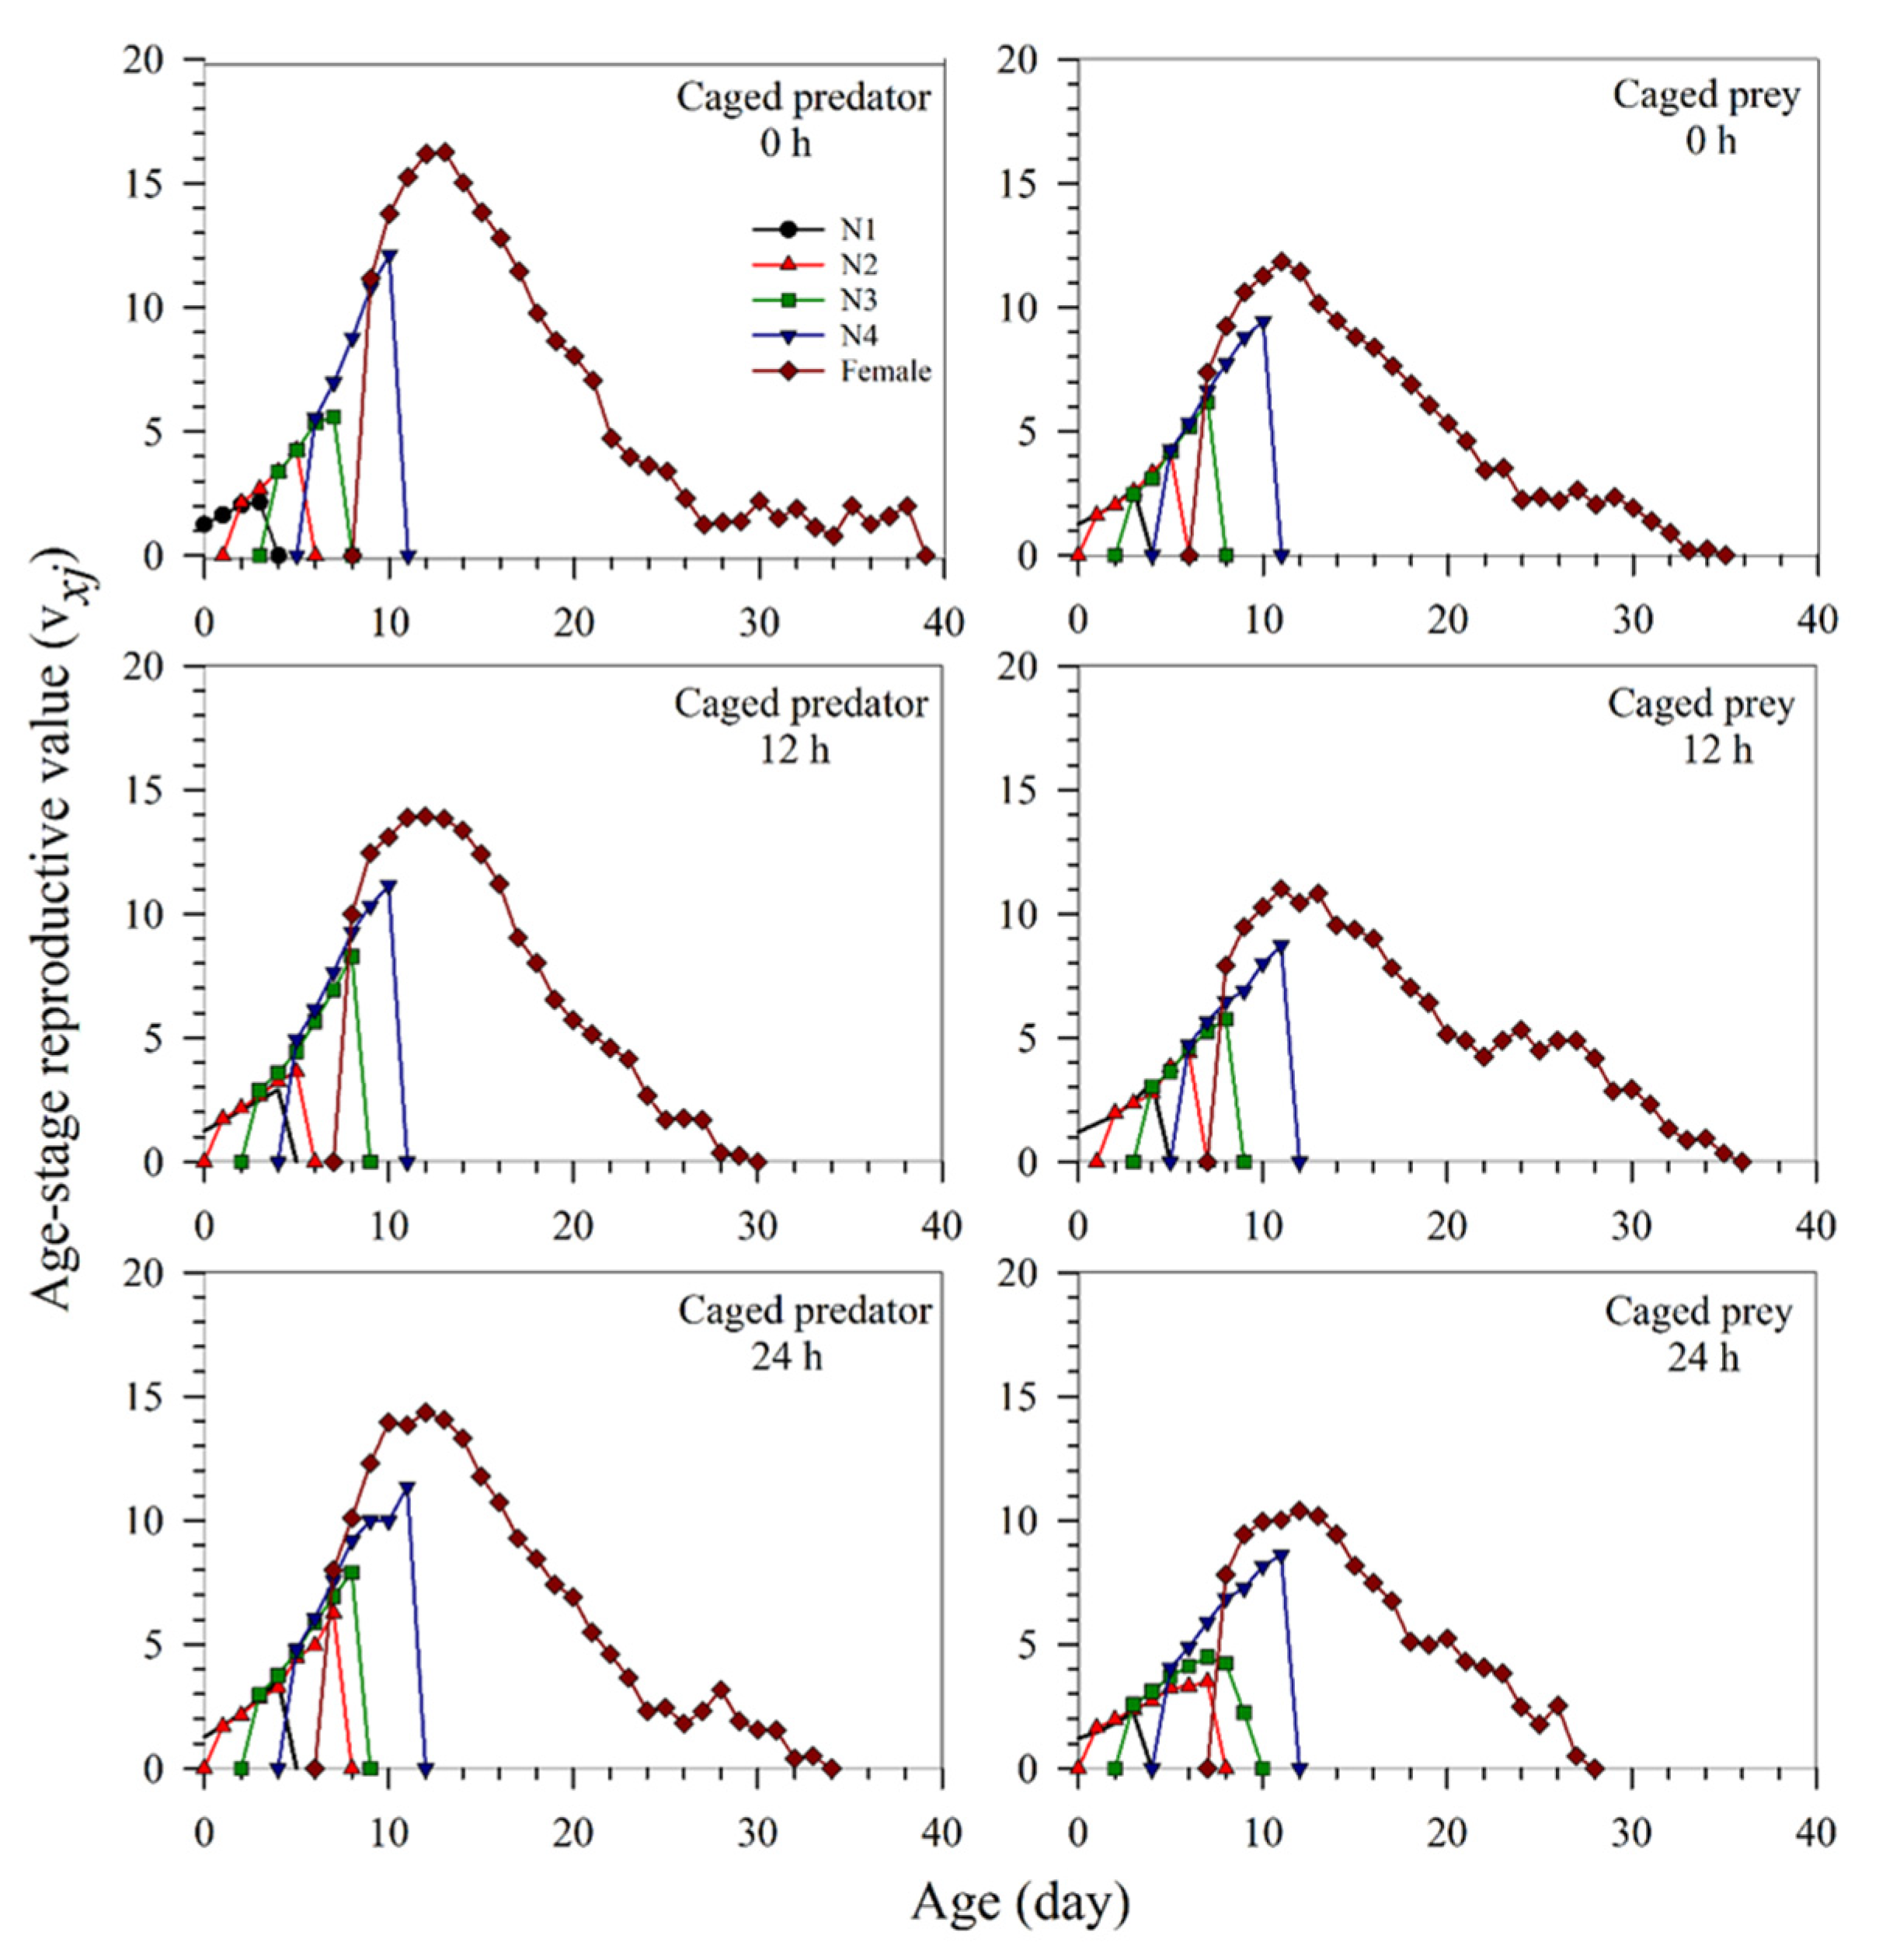
Age-stage reproductive value: v x j = e r ( x + 1 ) s x j i = x e r x + 1 y = j m S i y f i y The contribution of an individual of age x and stage j to the future population. Individuals survived to reproductive age (i.e., fxj > 0) usually have greater vxj (i.e., greater contribution) [40,41,42,43,44].
Table 2. The effects of the predation risks on the developmental duration (N1 to adult) and preadult survival rate of Sitobion miscanthi. Values are presented by the mean ± SE.
Types of
Predation Risk
Exposed Time
(h)
N1 (d)N2 (d)N3 (d)N4 (d)Preadult (d)Preadult Survival Rate
Caged predator02.89 ± 0.12 Aa2.11 ± 0.12 Aa2.15 ± 0.12 Aa2.26 ± 0.10 Aa9.37 ± 0.11 Aa0.90 ± 0.05 Aa
122.22 ± 0.16 Bb2.32 ± 0.15 Aa2.39 ± 0.20 Aa2.26 ± 0.14 Aa9.09 ± 0.19 Bab0.77 ± 0.08 Aa
242.21 ± 0.14 Bb2.23 ± 0.13 Aa2.19 ± 0.11 Aa2.19 ± 0.12 Ba8.85 ± 0.23 Bb0.87 ± 0.06 Aa
Caged prey02.31 ± 0.15 Bb2.17 ± 0.09 Aa2.04 ± 0.06 Ab2.39 ± 0.11 Aa8.96 ± 0.18 Ab0.93 ± 0.05 Aa
122.88 ± 0.18 Aa2.33 ± 0.13 Aa2.22 ± 0.13 Aab2.68 ± 0.19 Aa10.05 ± 0.30 Aa0.73 ± 0.08 Ab
242.67 ± 0.15 Aab2.35 ± 0.11 Aa2.46 ± 0.17 Aa2.54 ± 0.12 Aa9.79 ± 0.25 Aa0.80 ± 0.07 Aab
Different upper-case letters following the means within a column denote the significant differences between the caged predator and caged prey conditions at the same exposure time, whereas different lower-case letters following the means denote the significant differences among the exposure times at the same risk type based on the paired bootstrap test at a 5% significance level.
Table 3. The effects of the predation risks on the adult pre-reproductive period (APRP), total pre-reproductive period (TPRP), longevity, and fecundity of Sitobion miscanthi. Values are presented by the mean ± SE.
Types of Predation RiskExposure Time (h)APRP (d)TPRP (d)Adult Longevity (d)Total Longevity (d)Reproductive Days (d)Fecundity Winged Morphs to the Adults
Caged predator01.12 ± 0.14 Aa10.42 ± 0.18 Aa17.26 ± 1.03 Aa24.43 ± 1.52 Aa14.00 ± 0.71 Aa43.37 ± 3.05 Aa0.037 ± 0.037 Ab
121.17 ± 0.12 Aa10.26 ± 0.25 Ba16.17 ± 0.95 Aa20.33 ± 1.81 Aa12.65 ± 0.85 Aa37.65 ± 3.11 Aa0.130 ± 0.071 Ab
241.08 ± 0.14 Aa9.88 ± 0.26 Ba16.12 ± 1.18 Aa21.97 ± 1.70 Aa13.24 ± 0.82 Aa39.46 ± 3.15 Aa0.269 ± 0.089 Aa
Caged prey01.15 ± 0.13 Aa10.07 ± 0.27 Ab14.86 ± 1.36 Aa22.43 ± 1.60 Aa11.33 ± 1.03 Ba29.93 ± 2.80 Ba0.071 ± 0.049 Ab
121.05 ± 0.14 Aa11.09 ± 0.29 Aa13.82 ± 1.79 Aa18.60 ± 2.09 Aa9.86 ± 1.40 Aa24.45 ± 3.73 Ba0.136 ± 0.075 Ab
241.27 ± 0.12 Aa10.95 ± 0.28 Aa12.21 ± 1.08 Ba18.87 ± 1.50 Aa9.73 ± 0.86 Ba22.67 ± 2.60 Ba0.250 ± 0.090 Aa
Different upper-case letters following the means within a column denote the significant differences between the caged predator and caged prey conditions at the same exposure time, whereas the different lower-case letters following the means denote the significant differences among the exposure times at the same risk type based on the paired bootstrap test at the 5% significance level.
Table 4. The effects of the predation risks on the population parameters of Sitobion miscanthi. Values are mean ± SE.
Types of Predation RiskExposed Time (h)r  (d−1)Λ (d−1)R0§ (offspring)T  (d)
Caged predator00.2294 ± 0.0066 Aa1.2578 ± 0.0083 Aa39.04 ± 3.57 Aa15.96 ± 0.18 Aa
120.2189 ± 0.0103 Aa1.2447 ± 0.0128 Aa28.87 ± 3.73 Ab15.33 ± 0.28 Aab
240.2335 ± 0.0083 Aa1.2630 ± 0.0104 Aa34.21 ± 3.62 Aab15.11 ± 0.22 Ab
Caged prey00.2268 ± 0.0086 Aa1.2546 ± 0.0107 Aa27.94 ± 2.90 Ba14.67 ± 0.35 Bb
120.1793 ± 0.0111 Bb1.1963 ± 0.0133 Bb17.94 ± 3.32 Bb16.01 ± 0.45 Aa
240.1878 ± 0.0109 Bb1.2067 ± 0.0131 Bb18.15 ± 2.61 Bb15.39 ± 0.37 Aab
Different upper-case letters following the means within a column denote the significant differences between the caged predator and caged prey conditions at the same exposure time, whereas different lower-case letters following the means denote the significant differences among the exposure times at the same risk type based on the paired bootstrap test at the 5% significance level. the intrinsic rate of increase, finite rate of increase, § net reproductive rate, mean generation time.
Publisher’s Note: MDPI stays neutral with regard to jurisdictional claims in published maps and institutional affiliations.

