1. Introduction
Florida is the major snap bean (
Phaseolus vulgaris L.)-producing state in the United States. During the winter season, almost 100% of the country’s fresh snap beans are grown in Florida. The southeastern region of Florida, mainly Miami-Dade County, is the major (57%) snap bean-producing region in the state [
1]. Snap bean growers in this area of Florida face severe losses from many native and invasive insect pests. Among insect pests, thrips as a group cause significant damage and can disperse and exist in a wide range of habitats; tropical and subtropical regions are suitable for the survival and colonization of thrips [
2].
Asian bean thrips,
Megalurothrips usitatus, are a newly arrived invasive species, first recorded in Miami-Dade County, Florida, in 2020 [
3]. This is the first record of
M. usitatus in the continental USA. The common hosts are various leguminous crops with a preference for snap beans. Damage is mainly caused by the direct feeding of larvae on leaves, flowers, buds, and pods. A severe infestation can cause 100% crop loss (D.R. Seal, personal observations).
Thrips palmi Karny (Thysanoptera: Thripidae) is another important pest of beans and other vegetable crops, causing similar damage as
M. usitatus. Both
M. usitatus and
T. palmi are native to Asia.
In the past, various researchers often had difficulties identifying thrips to species [
4]. Due to multiple biotic (i.e., availability of food sources) and abiotic factors (climatic conditions), thrips have a diverse host range, and sometimes host ranges overlap among thrips species [
5,
6,
7]. Some researchers reported that the
T. palmi population in southern Florida was higher in the fall and spring than in summer due to unfavorable climatic conditions for thrips reproduction during the summer [
8]. Adverse climatic conditions for reproduction include high summer temperatures and frequent precipitation. Information about within-plant distribution and population dynamics of thrips will provide information for locating pest infestations early in the season.
Insect distribution is positively correlated with environmental factors. In general, an insect’s population can be distributed in three ways: random, clumped, or regular [
9]. The distribution of insects often depends upon the population density in a field. When sampling, a low number of insects results in a low capture rate, which indicates a random distribution of insects [
10]. In a random distribution pattern, every insect has an equal chance of occurring in an area of the habitat. The denser the pest population, the more aggregated the distribution in the field, resulting in a clumped pattern. If an individual insect’s presence at one point increases the probability of another individual being nearby, then the distribution is clumped [
9]. On the contrary, if an individual’s presence at one point decreases the likelihood of another being nearby, then the pattern is more uniform or regular. The distribution pattern of melon thrips (
T. palmi) in snap bean and chilli thrips (
Scirtothrips dorsalis, Thysanoptera: Thripidae) in pepper were aggregated in the field [
11,
12]. Detecting such aggregation at any point of the crop growing period may be helpful in addressing pest problems selectively, thereby reducing the cost of pest control. For example, common blossom thrips’ density is high at the edge of a tomato field at the beginning of an infestation. However, regardless of the distribution pattern, insecticide application is uniform in the field [
13]. Such an application of insecticides can cause environmental, economic, and ecological damage. In addition to within-field distribution, thrips exhibit a preference for specific plant parts. Thrips such as
Frankliniella schultzei Trybom (Thysanoptera: Thripidae) and
Frankliniella fusca (Hinds) (Thysanoptera: Thripidae) mostly feed on flowers; however, their feeding preferences are not limited to flowers only. Studies showed that chilli thrips were most abundant on the top young leaves of pepper plants, followed by middle and lower leaves [
12]. Other researchers reported that larvae of
F. schultzei feed on the leaf buds of apples, whereas adults feed on leaves as well as flowers [
14]. Overall, information about the distribution pattern and feeding behavior of thrips is essential for developing an effective management program.
The objective of this study was to determine the within-field and within-plant dispersion pattern of Asian bean thrips (M. usitatus) and melon thrips (T. palmi) in snap bean fields in southern Florida. These two thrips species were common in south Florida bean fields during this study. The main emphasis of this study was Asian bean thrips because it is a recently arrived invasive pest of beans.
4. Discussion
Asian bean thrips invaded Miami-Dade County, Florida, USA, in 2019. In 2020, about 40% of the bean crops in the area were infested, and the pest had dispersed to additional counties (Miami-Dade Agri-Council, personal communication). In 2021, there was a 2- to 10-fold increase in the abundance and density of thrips, and the pest was observed in almost 100% of bean crops, comprising more than 8000 hectares in Miami-Dade County (D.R. Seal, personal observations). Melon thrips arrived in southern Florida in 1990 and infested all vegetable crops in the area. Snap beans are a suitable host of Asian bean thrips and melon thrips, as documented in the present study. In the within-plant distribution study, the mean numbers of thrips collected in flower samples were significantly higher than in the other plant parts (leaves and pods) in both years of the study in all fields (Fields 1, 2, and 3). In 2021 in Field 3, melon thrips and larval thrips populations were higher on leaves than on flowers. Kawai [
31] reported that adult melon thrips were usually found on young leaves of cucumber plants. In sweet pepper, Kawai [
31] found more melon thrips adults on flowers and more larvae on fruit than on other plant parts. The difference in within-plant distribution among crops resulted in diverse types of injury. For example, in cucumbers, leaf injuries were common, whereas fruit injuries were common in sweet pepper.
The combined larval population of Asian bean thrips and melon thrips was higher than the adult population in Field 1 in 2020 and Field 3 in 2021. Comparable results were observed by Seal and Stansly [
11] in snap beans, where more larvae than adults and more female adults than male melon adults were observed. They also concluded that the infestation of thrips began on the lower leaves and slowly moved to the middle and upper leaves. After depleting food resources in leaves, the melon thrips population moved to the flowers and fruit of snap beans. Irrespective of the field, the thrips population was higher on the abaxial than the adaxial surface of the leaves.
In the present study, the within-field distribution of Asian bean thrips was assessed using traditional methods based on the relationship between the sample mean,
m, and sample variance, s
2. Spatial analysis by distance indices (SADIE) and variogram analysis, which were not used in the present study, can provide a true spatial distribution for quantitatively examining changes within the field and should be considered for future studies. In the within-field distribution studies in 2020 (Fields 1 and 2), 2021 (Fields 3 and 4), and 2022 (Fields 5 and 6), Asian bean thrips males showed a variable distribution pattern based on field, plot size and model used. Variability in the aggregation percentage of Asian bean thrips and melon thrips in different fields indicated the dissimilarity of various factors, such as crop phenology, environmental conditions, and the population abundance of thrips in the surrounding vegetation. Similarly, Kakkar et al. [
32] reported varied distributions in different fields in the same season, but the reason for this was unclear. In sampling small plots (11.14 m
2), the aggregation of Asian bean thrips males was observed in two fields using Taylor’s power law and also in a similar number of fields using Iwao’s patchiness regression. The distribution pattern of males was regular in most fields, irrespective of the model used. Increasing the plot size from 11.14 m
2 to 44.59 m
2, Asian bean thrips males showed aggregation in a higher number of fields (three for each linear model), irrespective of the model used. The rest of the fields showed a regular distribution pattern. In small plots,
r2 values using Taylor’s power law ranged from 0.0006 to 0.17, whereas
r2 values ranged from 0.81 to 0.98 using Iwao’s patchness regression. A similar pattern of high and consistent
r2 values was recorded for Iwao’s patchiness regression in large plots, indicating a strong fit for Iwao’s patchiness regression model in describing the distribution of Asian bean thrips males.
The distribution of Asian bean thrips females in small plots showed a similar pattern as the male distribution, having an aggregated (Fields 2 and 3) and regular (Fields 1, 4, 5, and 6) distribution in small plots using Taylor’s power law and aggregated (Fields 2 and 3) and random (Fields 1, 4, 5, and 6) distributions using Iwao’s patchiness regression in six different fields. In larger plots, the distribution of Asian bean thrips females was aggregated in 83% of the instances and regular in 17% of the instances using Taylor’s power law. Using Iwao’s patchiness regression, the female distribution was 50% aggregated and 50% random. In commercial fields, we observed that Asian bean thrips infestations were initiated at the edge of a field and spread inward as the season progressed. This dispersion behavior explains the aggregation of Asian bean thrips in larger plots. Our results concur with the findings of Kakkar et al. [
32] and Seal et al. [
12] for
F. schultzei and
Scirtothrips dorsalis (Hood), respectively. Kakkar et al. [
33] observed an aggregated distribution pattern of common blossom thrip (
F. schultzei) adults and larvae in larger plots (1260 m
2) using Taylor’s power law and Iwao’s patchiness regression models. Similarly, Seal et al. [
12] observed an aggregated distribution pattern of
Scirtothrips dorsalis (Hood) in larger plots of 24 and 48 m
2, although, in that study, the distribution pattern was regular (1 > b) in smaller plots of 6 and 12 m
2.
In the present study, the
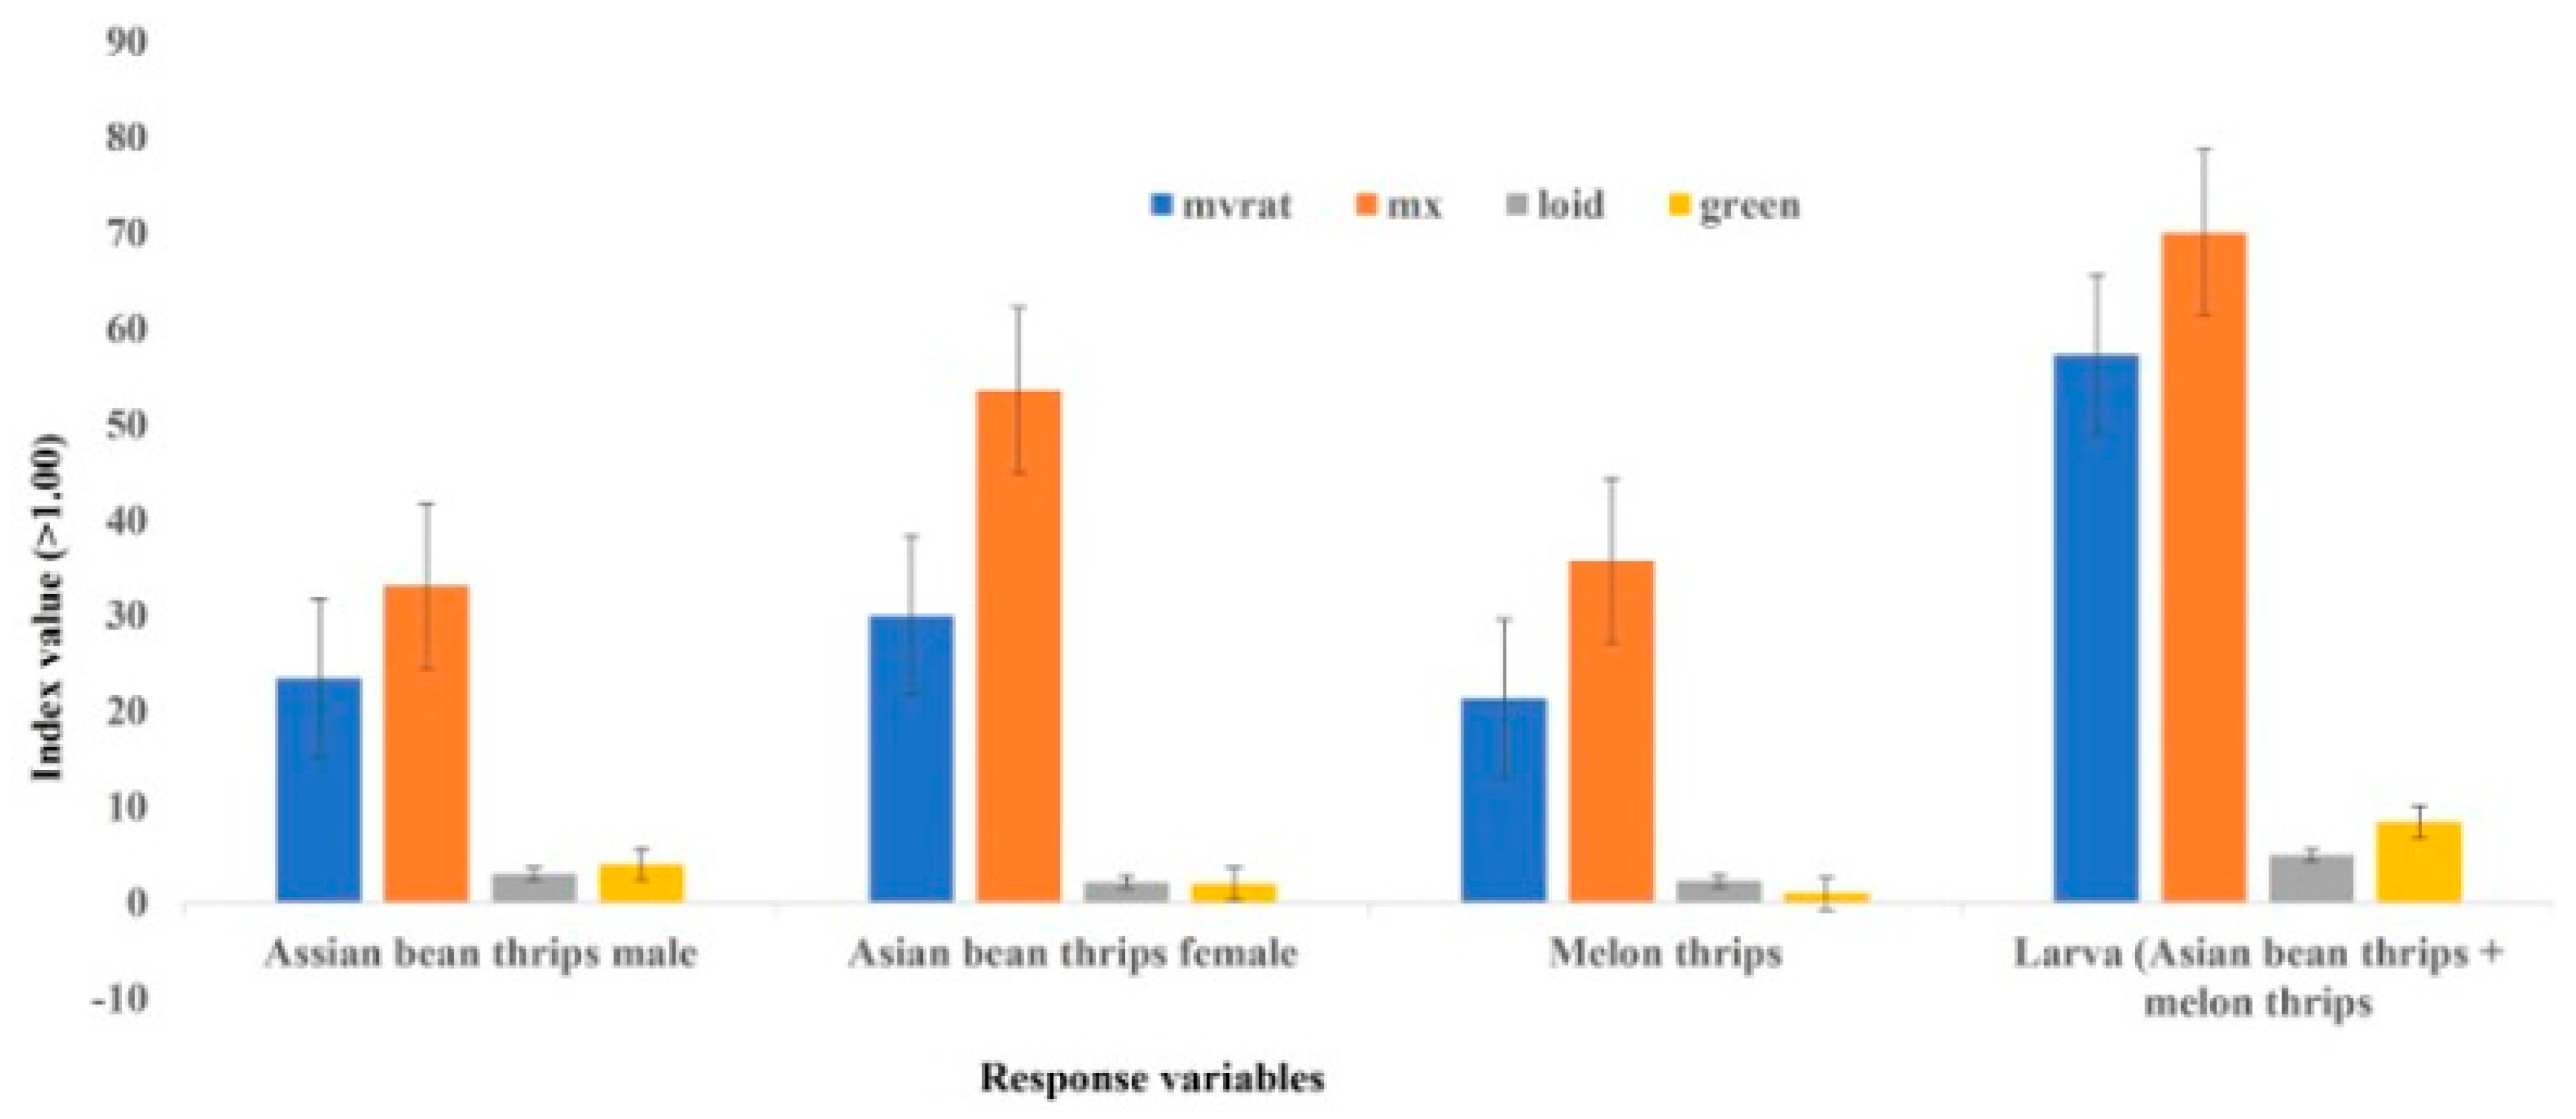
r2 values in both plot sizes were higher for Iwao’s patchiness regression than Taylor’s power law, supporting a better fit for Iwao’s patchiness regression model than Taylor’s power law in describing the distribution of female thrips. However, the generalized pattern of distribution based on the combined data of all fields was aggregated, irrespective of the model used. This generalized distribution pattern is also supported by other statistical indices (index of dispersion, mean crowding, Green’s index, and Lloyd’s mean crowding), consistently showing an aggregated distribution pattern of Asian bean thrips females (
Figure 1).
The melon thrips’ distribution was mostly regular and random in small plots, irrespective of the model used (
Table 5). However, in large plots (44.59 m
2), the distribution was predominantly aggregated irrespective of the model used. Melon thrips are foliage-feeding insects that explore newly emerged young foliage, which is a rich source of nutrients [
8]. When the distribution pattern was generalized by combining data from all fields, the melon thrips’ distribution was aggregated, irrespective of plot size and model used. Aggregation in flowers could be under the influence of plant physiology, temperature, the presence of natural enemies, reproduction, and thigmotactic behavior. Milne [
33] suggested that aggregation of
F. schultzei males on any plant part is primarily to attract conspecific females for mating, possibly by the release of sex pheromones.
The distribution of larvae was predominantly regular, irrespective of plot size and model used. However, the generalized pattern of larvae distribution was clumped based on combined data from six fields, irrespective of the plot size and model used. All other statistical indices (index of dispersion, mean crowding, Green’s index, and Lloyd’s mean crowding) were consistent with the linear regression models in describing an aggregated distribution of larvae in bean fields (
Figure 1).
The aggregation of thrips species has been established by several researchers. Cho et al. [
5] reported an aggregated distribution pattern of adult and immature melon thrips in potato fields. Seal et al. [
12] reported a clumped distribution pattern of
Scirtothrips dorsalis in pepper. A clumped distribution of
F. schultzei was reported by Kakkar et al. [
34] in a cucumber field. Sedaratian et al. [
35] reported an aggregated distribution pattern of
Thrips tabaci in a soybean crop. They also reported that a clumped distribution of
T. tabaci was probably due to its mode of reproduction. Cho et al. [
5] observed a clumped pattern of the spatial distribution of
F. occidentalis in cucumbers in a greenhouse. Similarly, various studies [
36,
37,
38] showed a clumped distribution pattern of
F. occidentalis in cucumber, cotton, and strawberries using Taylor’s power law.
Other thrips species,
Aeolothrips intermedius,
Frankliniella intonsa, and
Thrips angusticeps, had aggregated distribution patterns [
39]. Larral et al. [
40] reported that adults, pupae, and larvae of greenhouse thrips (
Heliothrips haemorrhoidalis Bouche) in avocado (
Persea americana Mill.) leaves and fruit had a clumped distribution pattern. In mango (
Mangifera indica L.) orchards, it was observed that immature specimens of
Thrips hawaiiensis Morgan,
F. schulzei,
S. dorsalis, and
Megalurothrips usitatus Bagnell were more clumped than adults [
41]. Similarly, other researchers noticed a more significant aggregation of immature than adult thrips [
5,
42,
43]. They speculated that the reduced mobility of immature thrips was responsible for this type of clumped pattern. Several factors influence thrips aggregation in the field, including host suitability, fertilizer, irrigation, and climatic conditions [
22]. More studies are needed to determine the factors that affect the distribution patterns of Asian bean thrips.
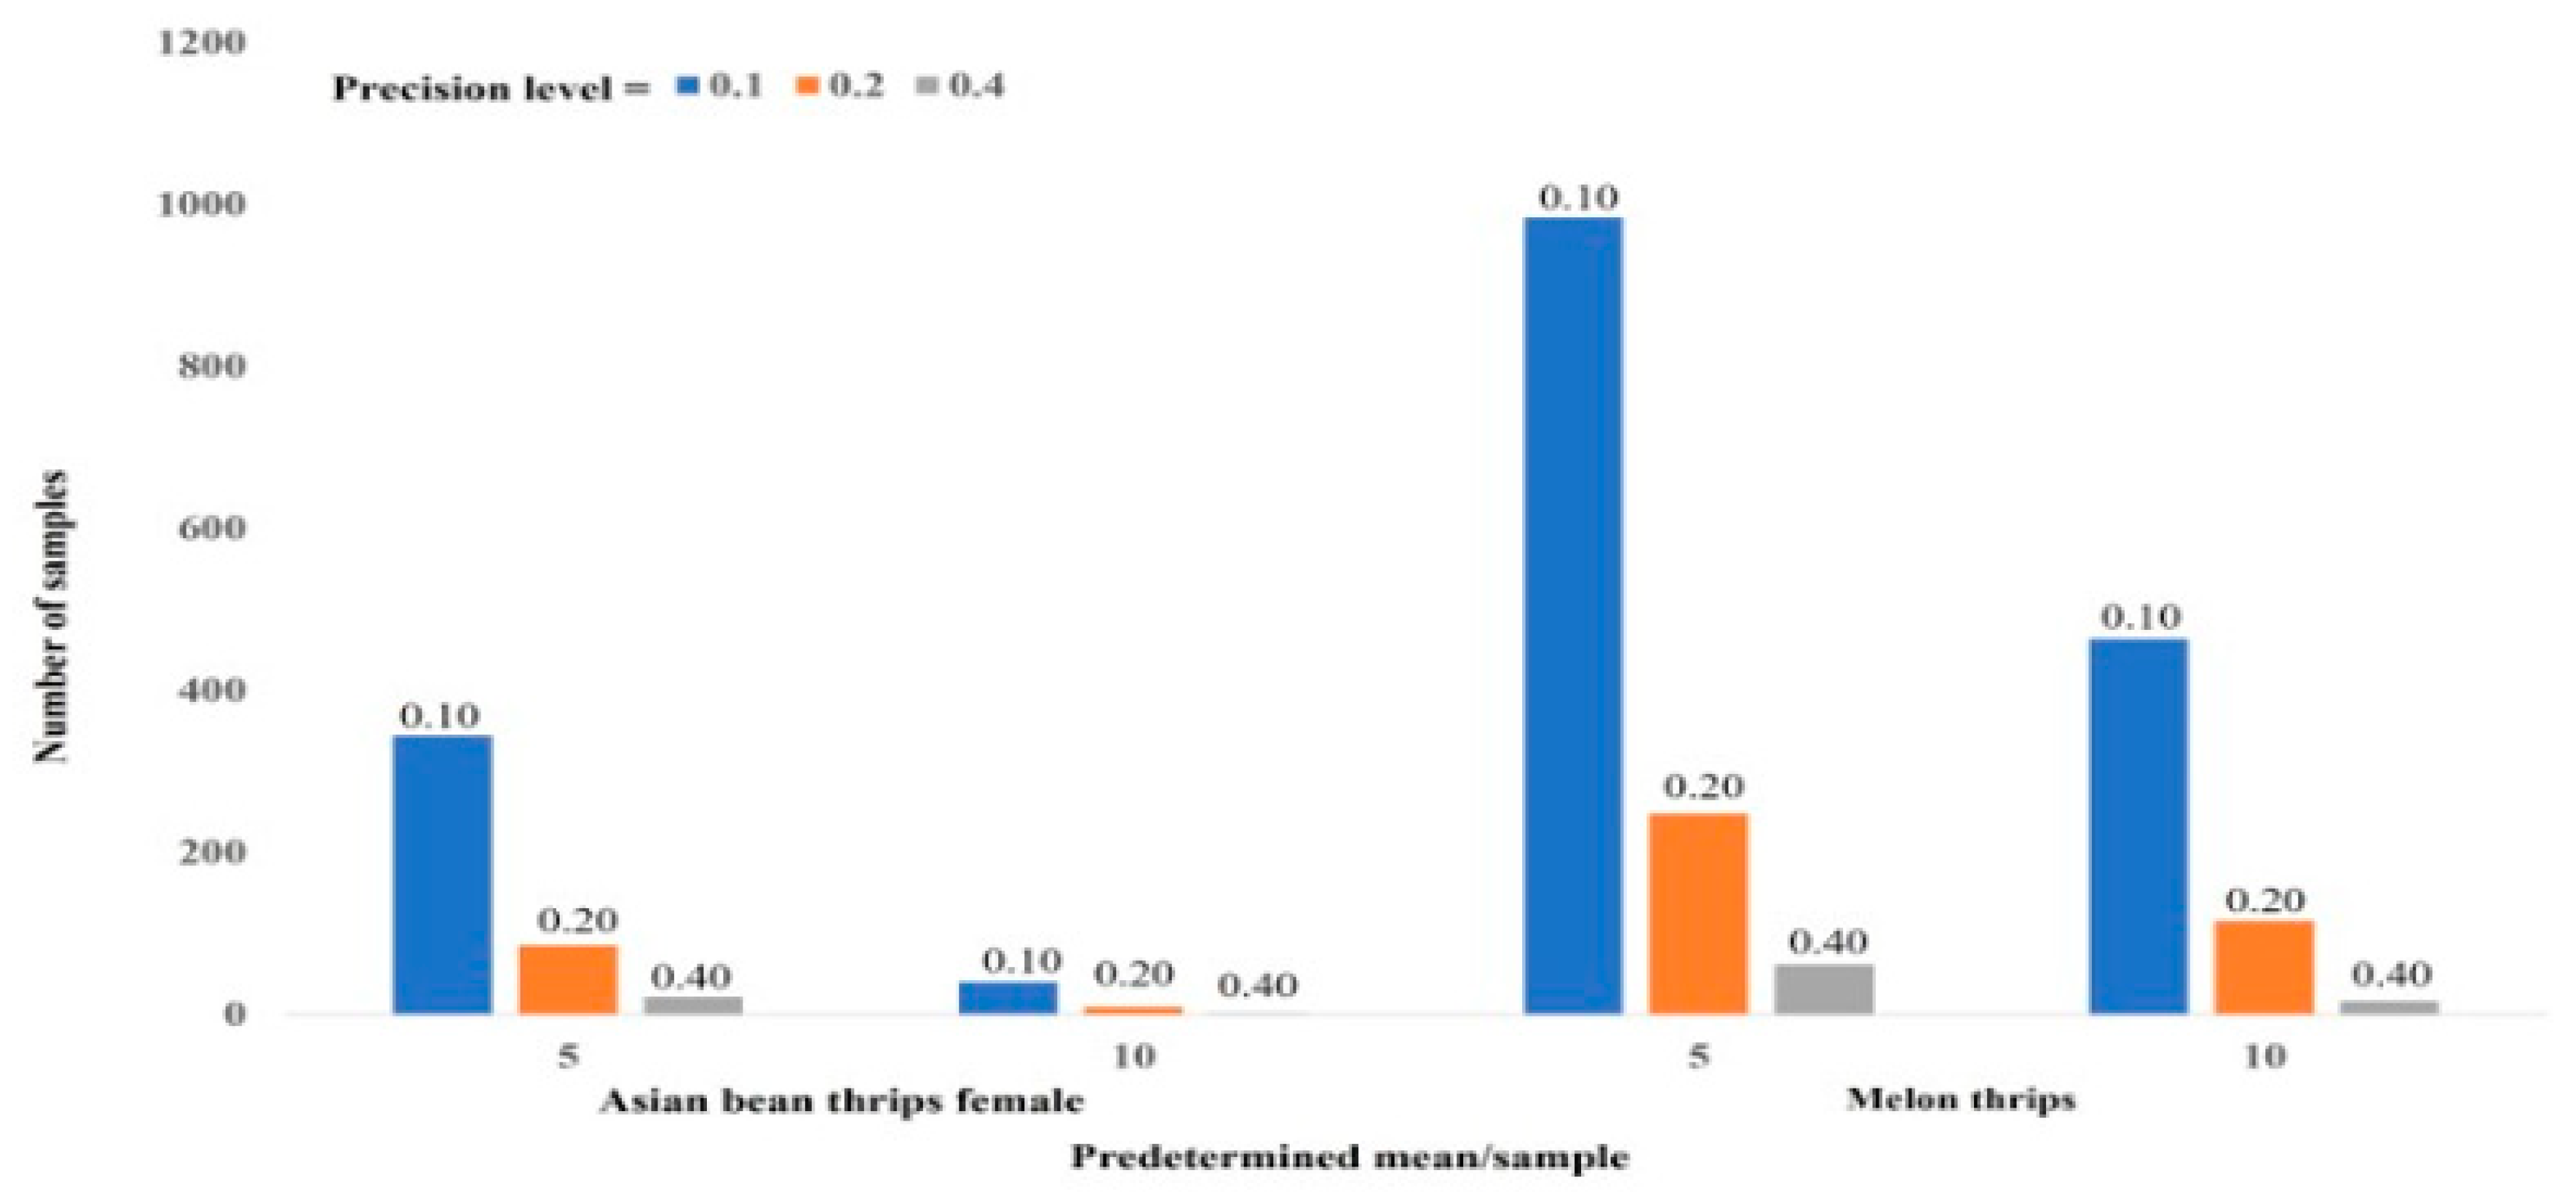
We determined the sample size using a predetermined density of thrips per sample (5.0 and 10.0) at three levels of precision (0.10, 0.20, and 0.40). Southwood [
10] suggested 0.25 as the recommended level of precision to assess insect population density. We presume that the suitable precision level to assess male and female Asian bean thrips population density was 0.20. Similarly, a 0.40 precision level was suitable for the density determination of melon thrips and larvae of both species together. If a grower can determine the average density per sample based on previous experience, he or she will be able to collect a smaller number of samples to estimate the correct population density of the pest in the field. As this is a knowledge-based program, growers should have “hands-on” basic training to properly implement a sample size determination program. This information will help in the development of sustainable management practices for Asian bean thrips and melon thrips, two potentially devastating pest species of snap bean in south Florida.


