
Characterisation of Antennal Sensilla and Electroantennography Responses of the Dung Beetles Bubas bison, Onitis aygulus and Geotrupes spiniger (Coleoptera: Scarabaeoidea) to Dung Volatile Organic Compounds

 ,
,  ,
,  , , , , and
Abstract
:Simple Summary
Abstract
1. Introduction

| Compound | Structure | Compound Group | Presence in Livestock Dung | Presence in Dung Mimicking Organisms | Presence as a Dung Beetle Semiochemicals | Antennal Responses by Dung Beetle Species |
|---|---|---|---|---|---|---|
| indole |  | indoles and derivatives | Cow [49] Cow, horse, sheep and boar [9] Fox [46] Horse and sheep [38] Cow [42] | Wurmbea elatior [53] Typhonium brownie and T. eliosurum [54] Arum spp. [55] | Male abdominal secretions of Kheper bonellii [50] | G. auratus [48] Onthophagus binodis [41] Ammoecius elevates, Anomius baeticus, Aphodius fimetarius, Ceratophyus hoffmannseggi, Jekelius hernandezi, Sericotrupes niger, Thorectes valencianus, Typhaeus typhoeus, Ateuchetus cicatricosus, Bubas bison, Copris hispanus, O. emarginatus, O. fracticornis, O. maki and O. melitaeus [49] |
| skatole |  | indoles and derivatives | Cow, horse, sheep and boar [9] Horse [49] Cow, horse and sheep [38] Cow [42] | W. elatior [53] T. brownie and T. eliosurum [54] | Male abdominal secretions of K. lamarchi, K. nigroaeneu, K. subaeneus and K. bonellii [50] | G. auratus [48] Ammoecius elevates, Anomius baeticus, Aphodius fimetarius, Ceratophyus hoffmannseggi, Jekelius hernandezi, Sericotrupes niger, Thorectes valencianus, Typhaeus typhoeus, Ateuchetus cicatricosus, Bubas bison, Copris hispanus, O. emarginatus, O. fracticornis, O. maki and O. melitaeus [49] |
| phenol |  | phenolic compounds | Cow, fox [46] Cow, horse and sheep [38] Weka [7] Cow [42] | Pygidial gland secretions of Canthon cyanellus cyanellus and C. femoralis femoralis [56] | G. auratus [48] O. binodis [41] | |
| p-cresol | 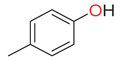 | phenolic compounds | Cow and horse [49] Cow, horse, sheep and boar [9] Horse, sheep, deer, cow, fox, and wild boar [46] Cow, horse and sheep [38] Cow [42] Weka [7] | Typhonium brownie and T. eliosurum [54] Arum spp. [55] | G. auratus [48] Onthophagus binodis [41] Ammoecius elevates, Anomius baeticus, Aphodius fimetarius, Ceratophyus hoffmannseggi, Jekelius hernandezi, Sericotrupes niger, Thorectes valencianus, Typhaeus typhoeus, Ateuchetus cicatricosus, Bubas bison, Copris hispanus, O. emarginatus, O. fracticornis, O. maki and O. melitaeus [49] | |
| butanone |  | ketone | Cow, horse and sheep [38] Cow [42] | G. auratus [48] | ||
| butyric acid | 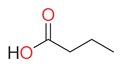 | fatty acids and conjugates | Weka [7] Cow [42] | Male abdominal secretions of K. subaeneus and K. bonellii [50] | ||
| eucalyptol |  | monoterpenes | Horse [38] Rabbit [49] | O. binodis [41] Ammoecius elevates, Anomius baeticus, Aphodius fimetarius, Ceratophyus hoffmannseggi, Jekelius hernandezi, Sericotrupes niger, Thorectes valencianus, Typhaeus typhoeus, Ateuchetus cicatricosus, Bubas bison, Copris hispanus, O. emarginatus, O. fracticornis, O. maki and O. melitaeus [49] | ||
| toluene |  | benzene and substituted derivatives | Cow, horse and sheep [38] Cow [42] | Onthophagus binodis [41] | ||
| dimethyl sulfide |  | thioethers | Horse and sheep [38] Cow [42] | |||
| dimethyl disulfide |  | Aliphatic disulfides | Horse and sheep [38] Cow [42] |
2. Materials and Methods
2.1. Collection of Beetles
2.2. Scanning Electron Microscopy (SEM) of Antennal Sensilla
2.3. Chemicals and Odour Stimuli Preparation
2.4. Antennal Preparation and Electroantennogram Recordings
2.5. Data Analysis
3. Results
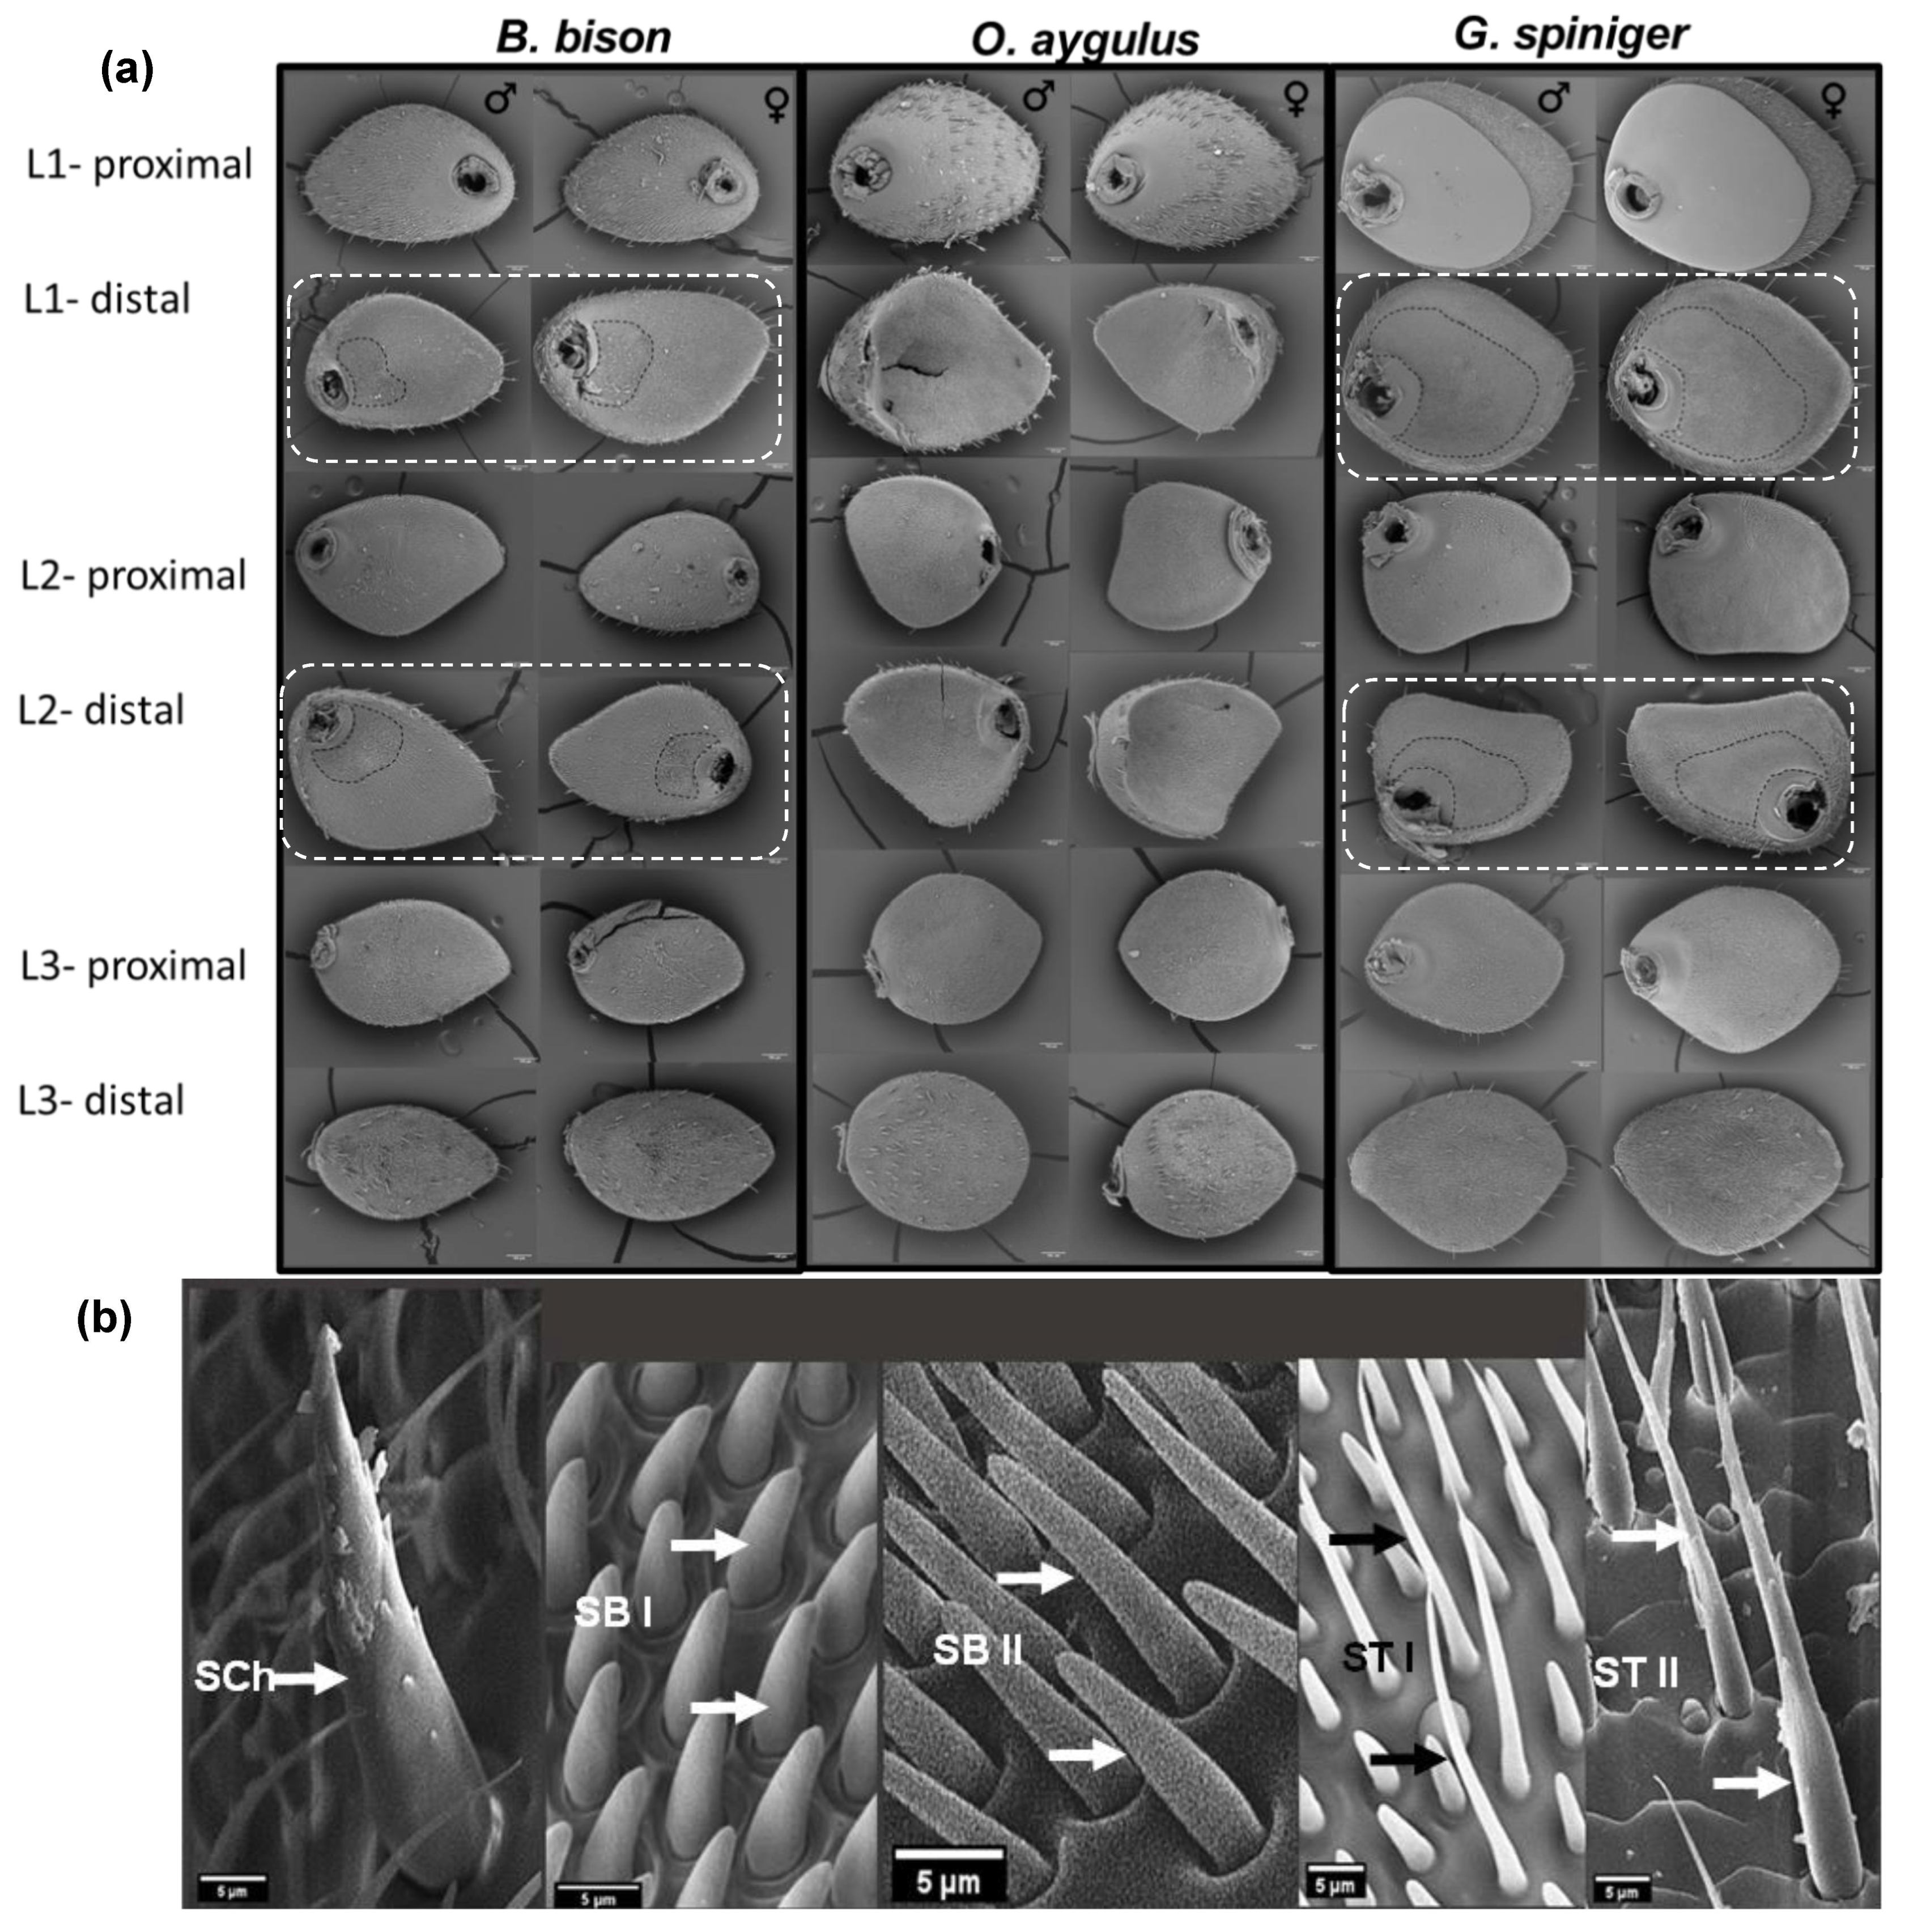
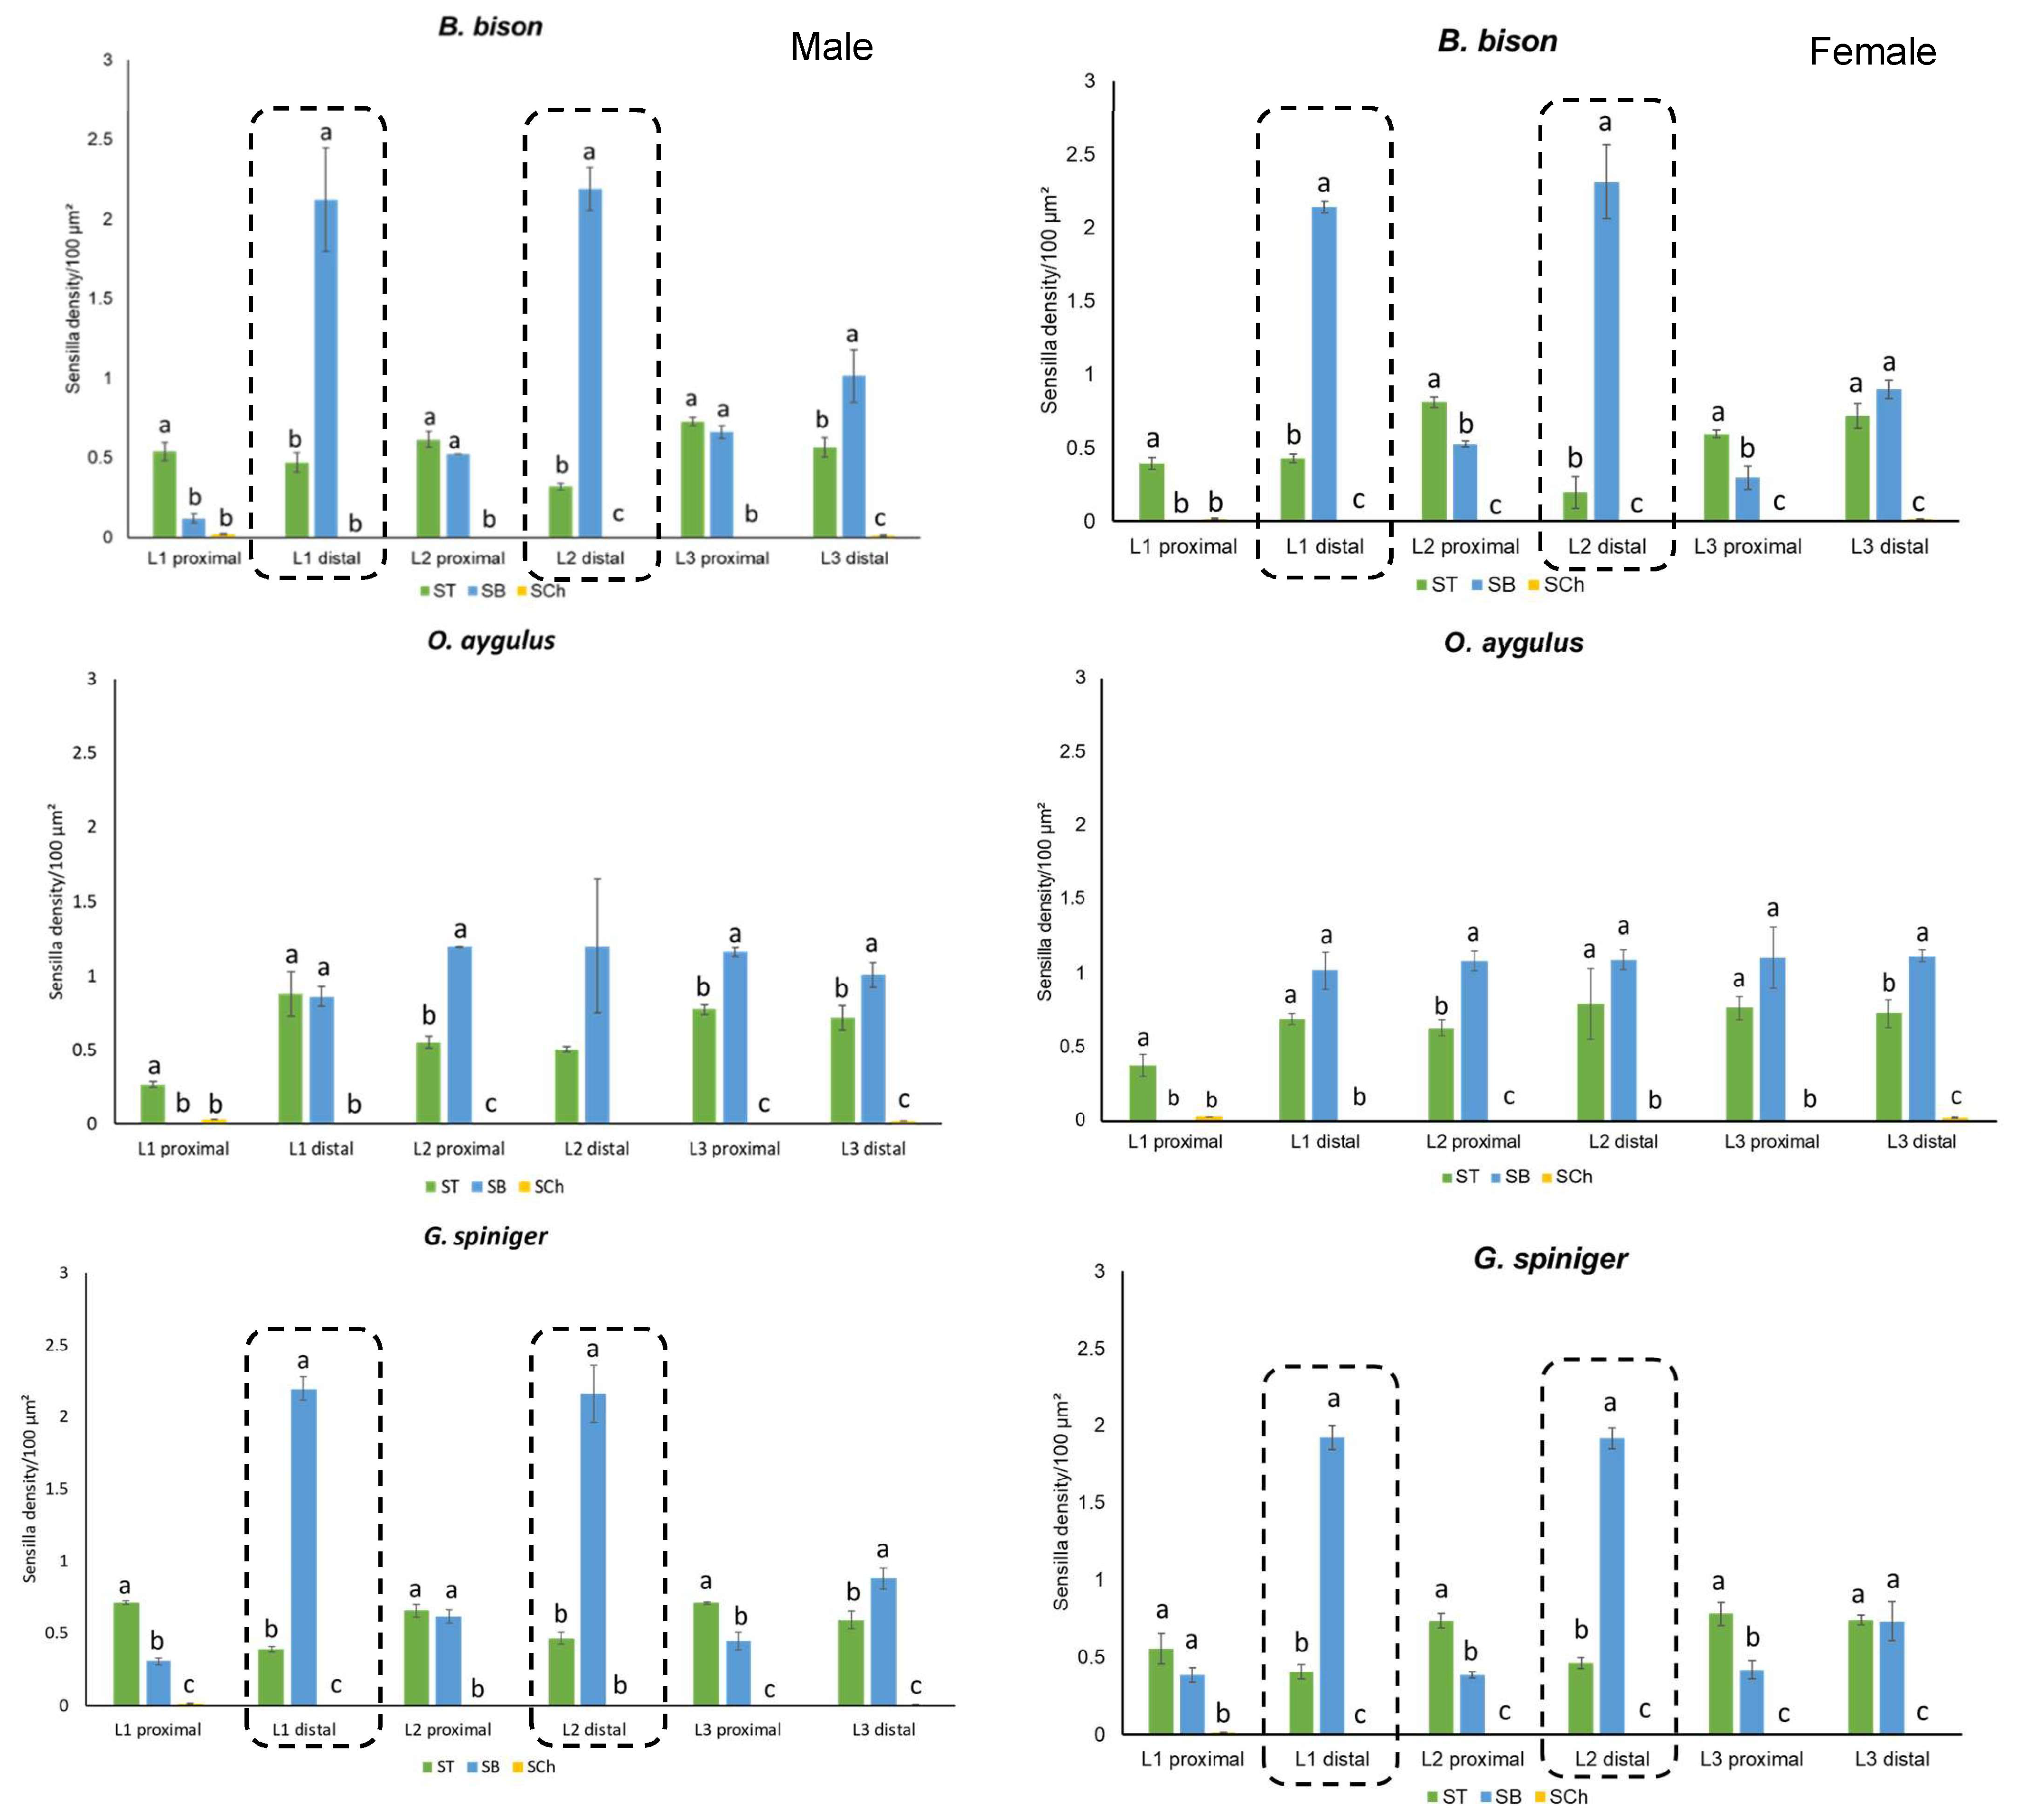
3.1. Comparative Morphology and the Variation of Antennal Sensilla
3.1.1. General Morphology of the Antennae
3.1.2. Main Antennal Sensilla Types and Their Distribution on Each Lamella
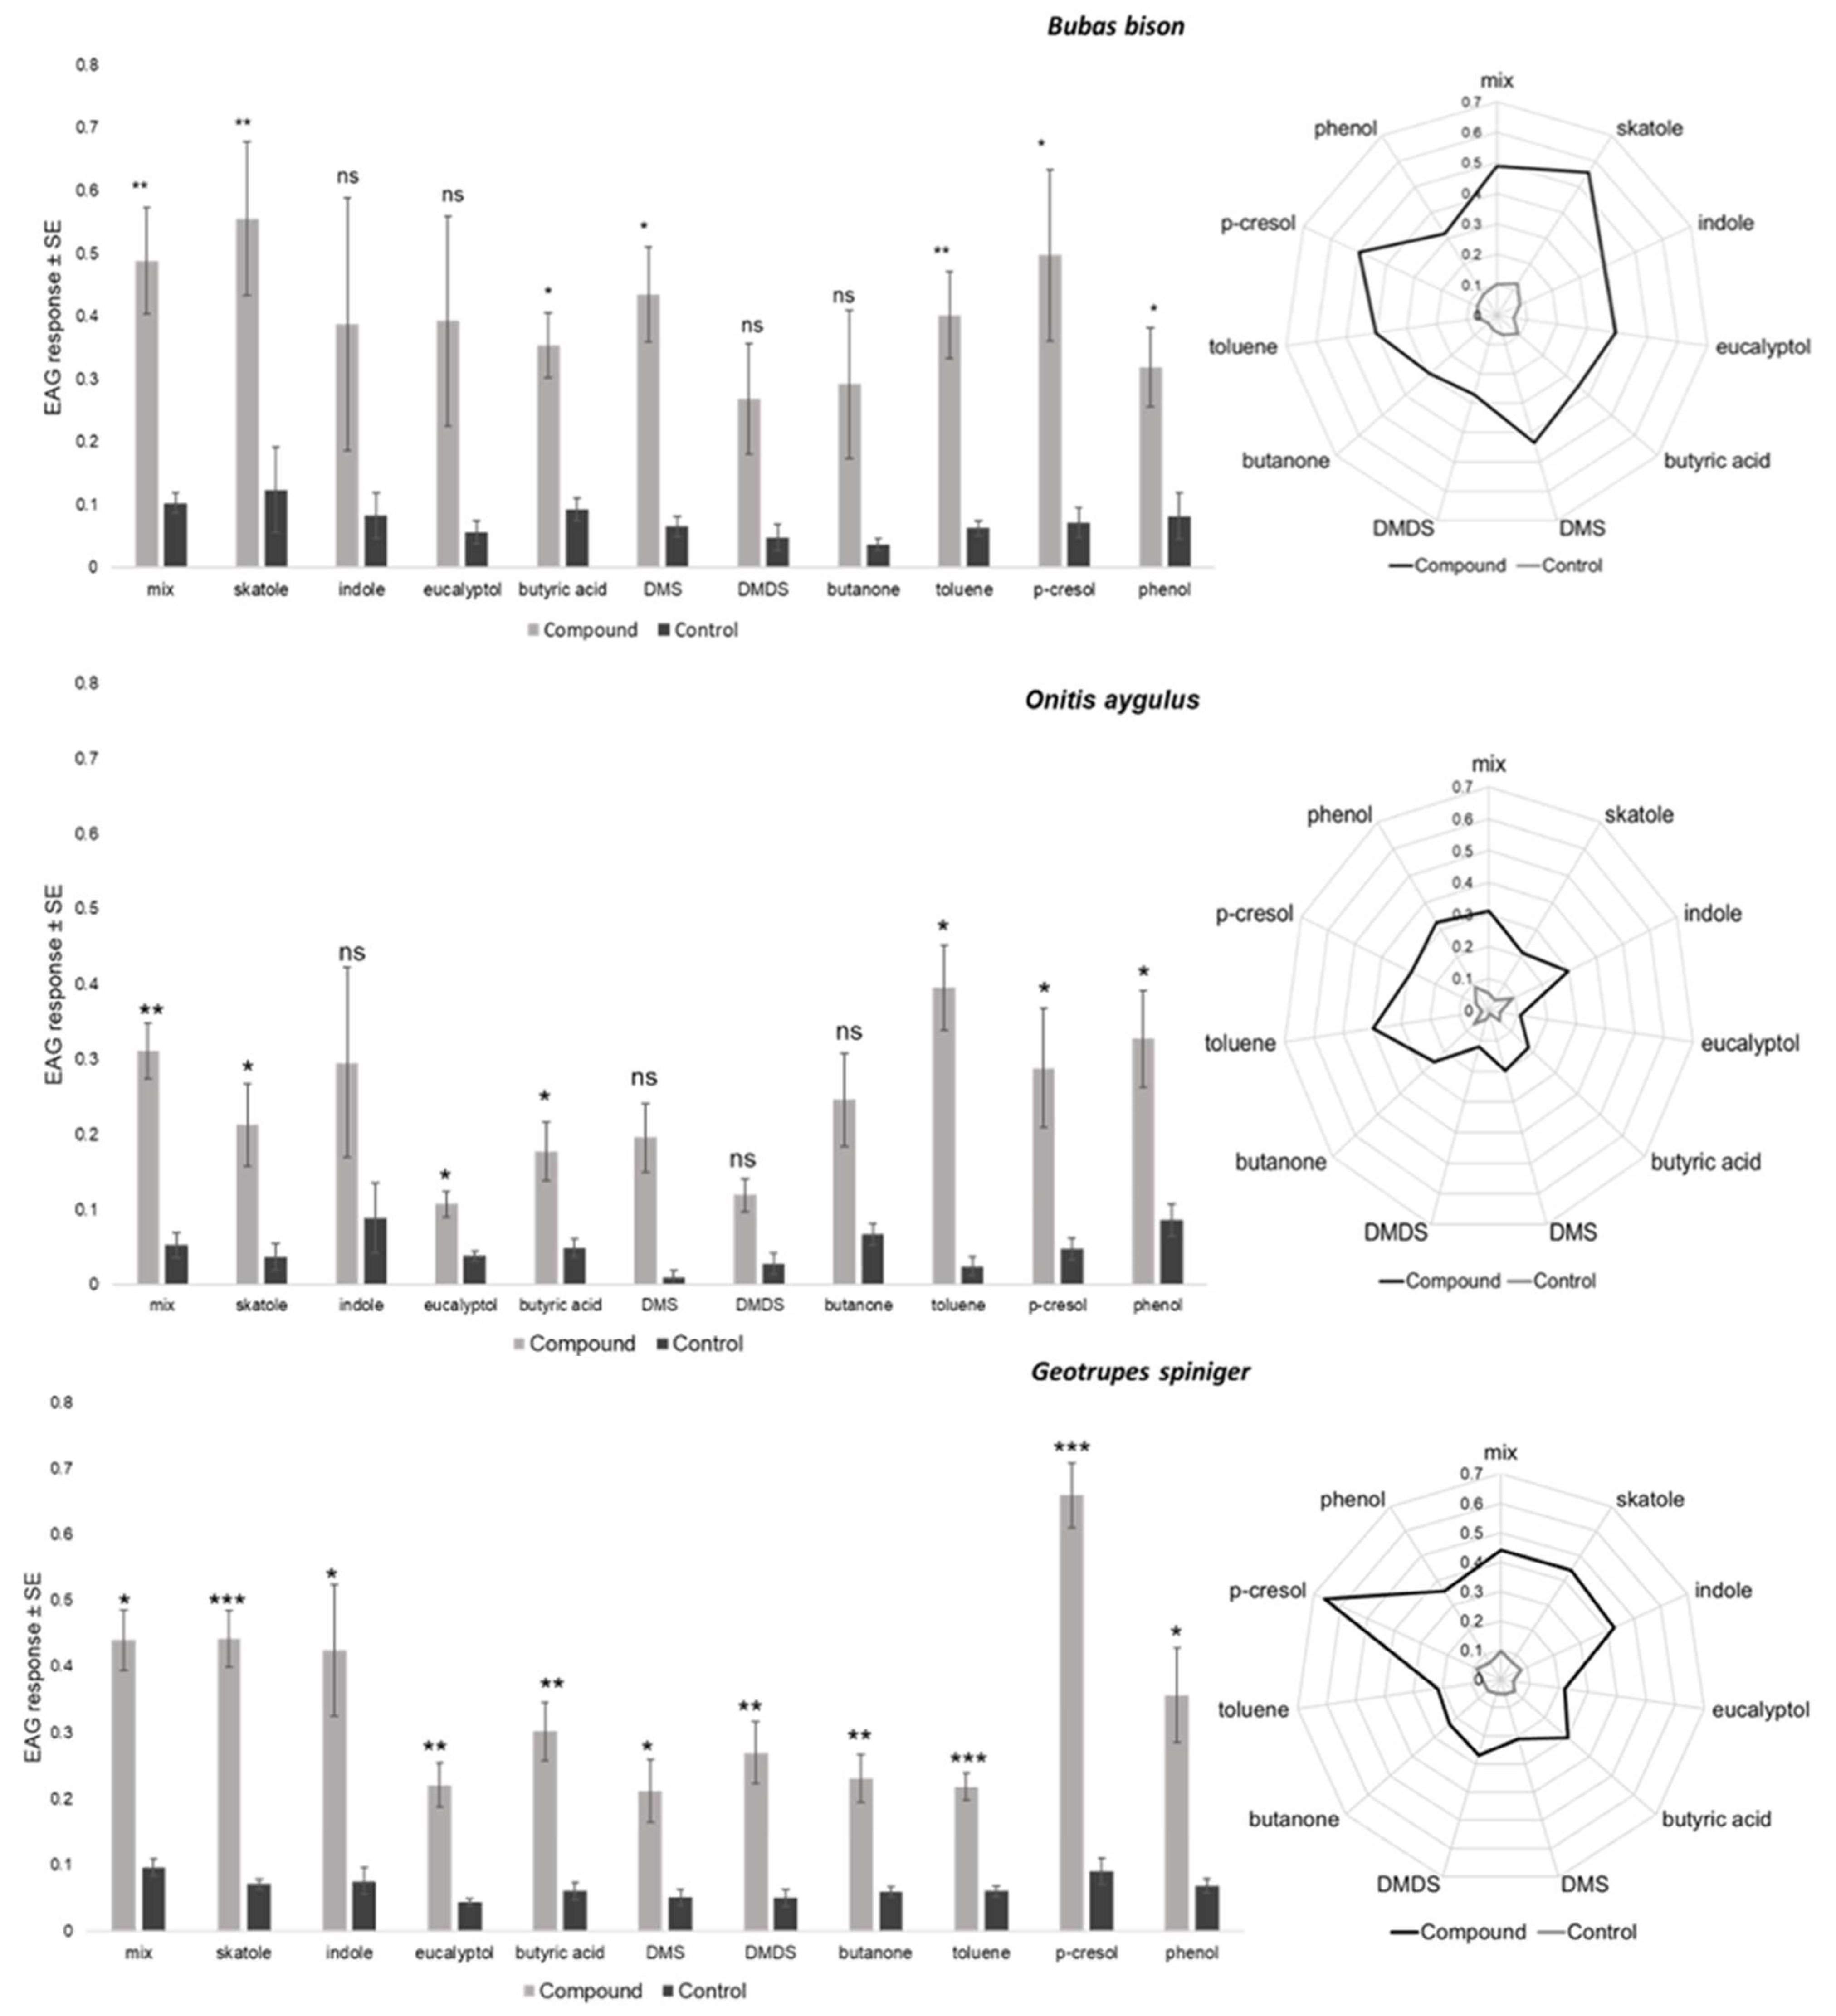
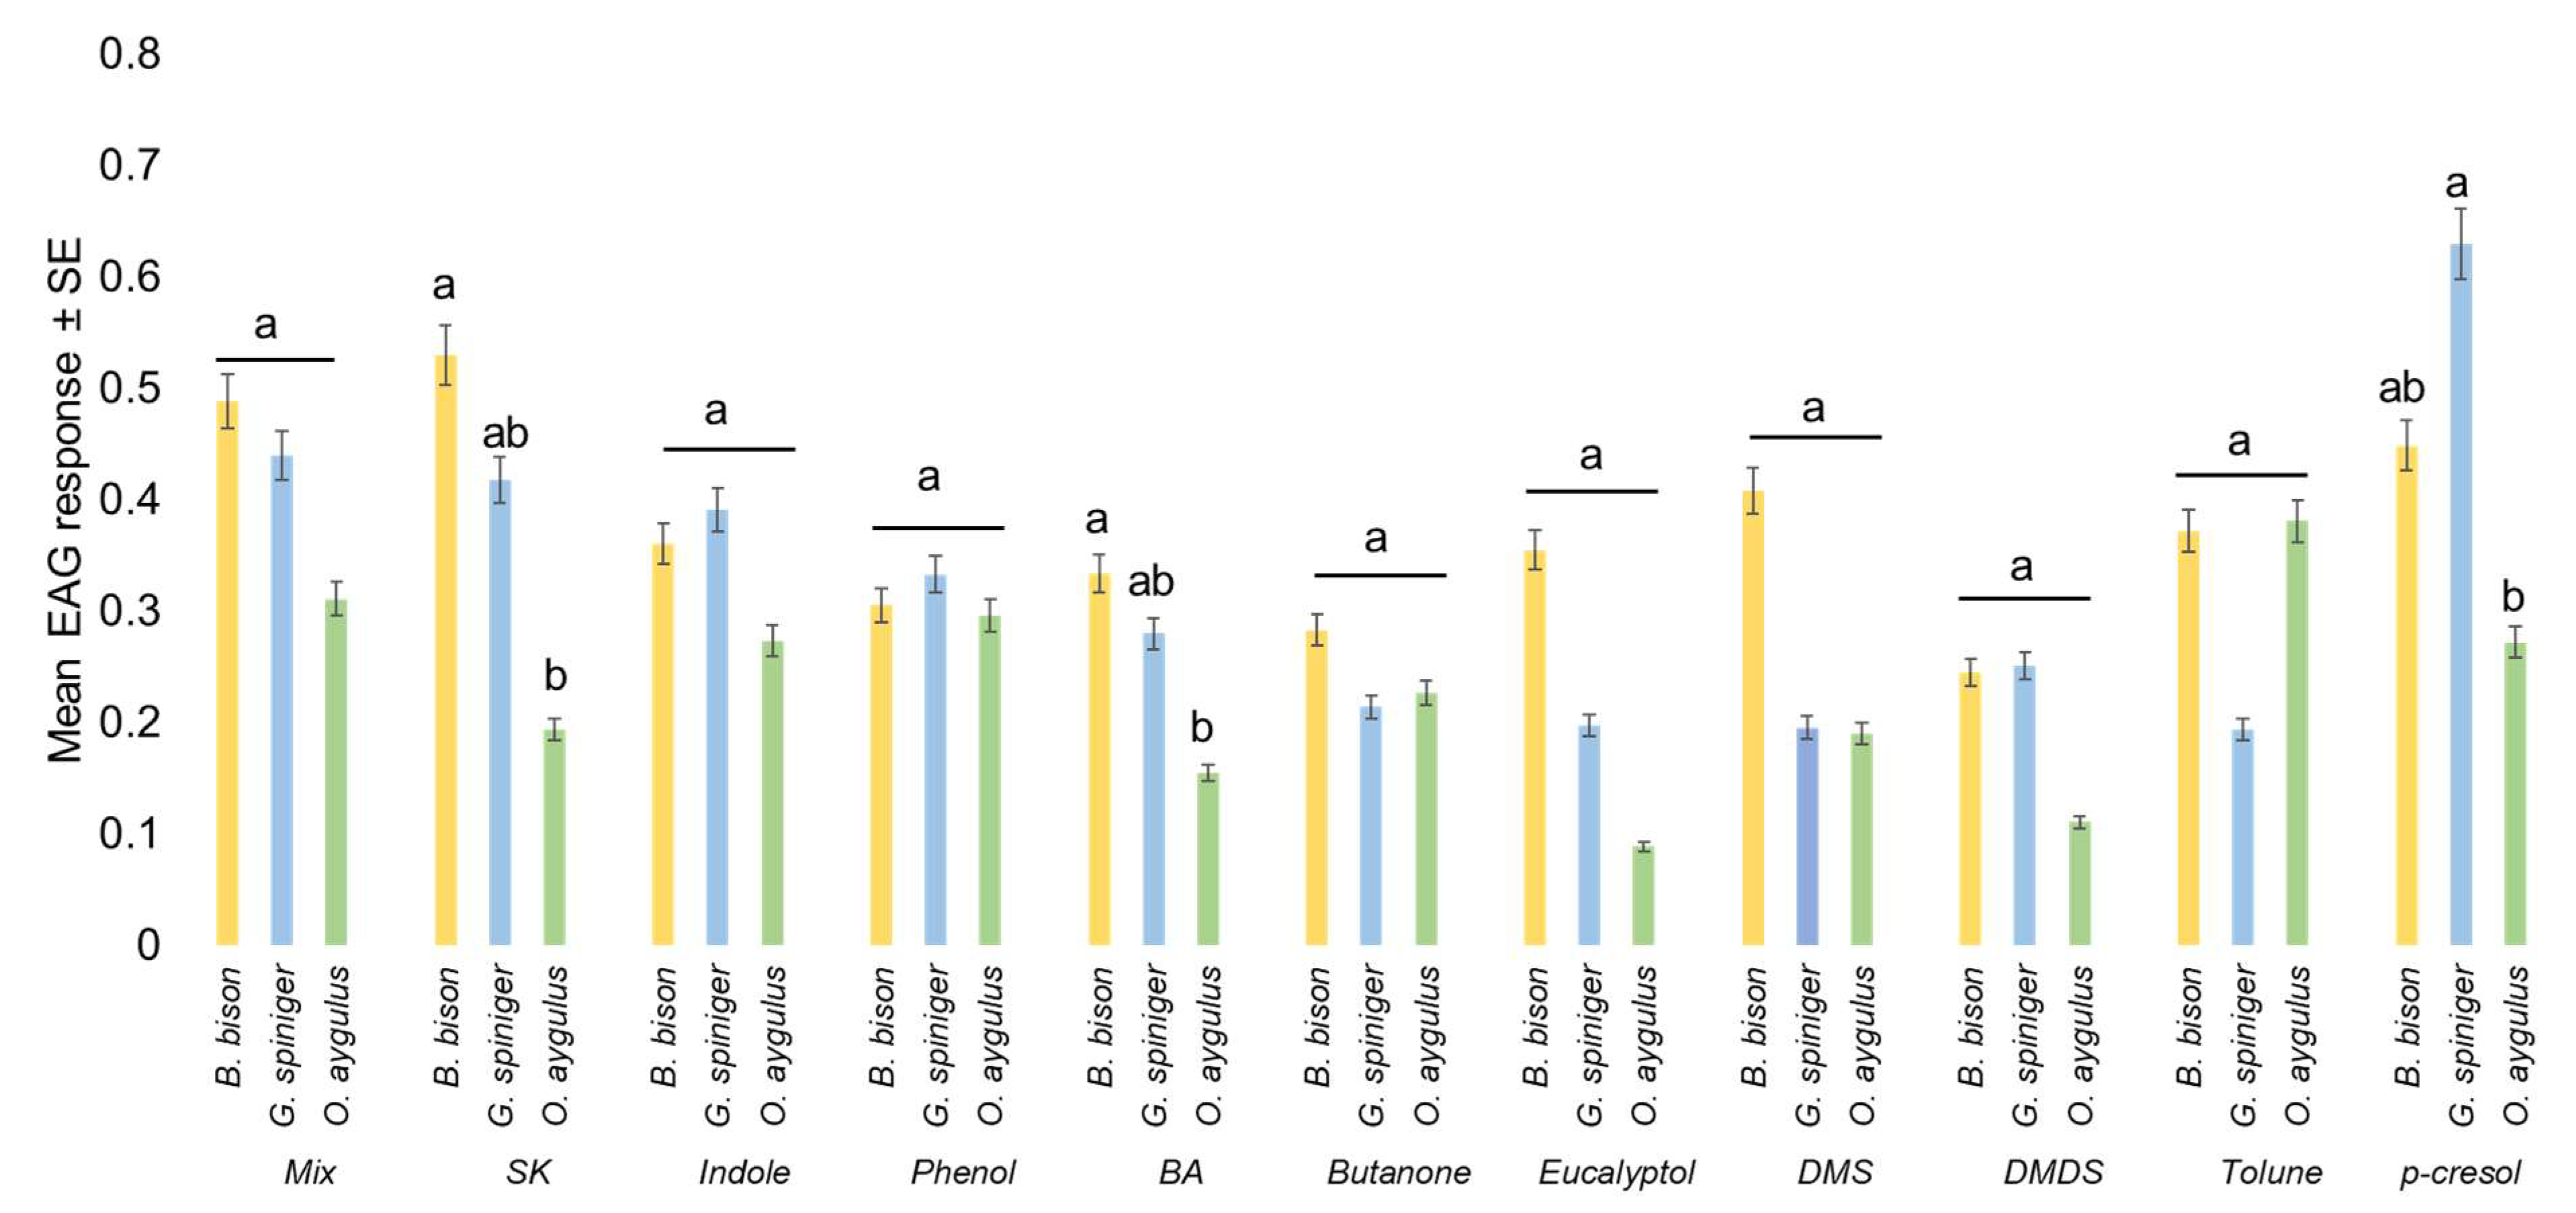
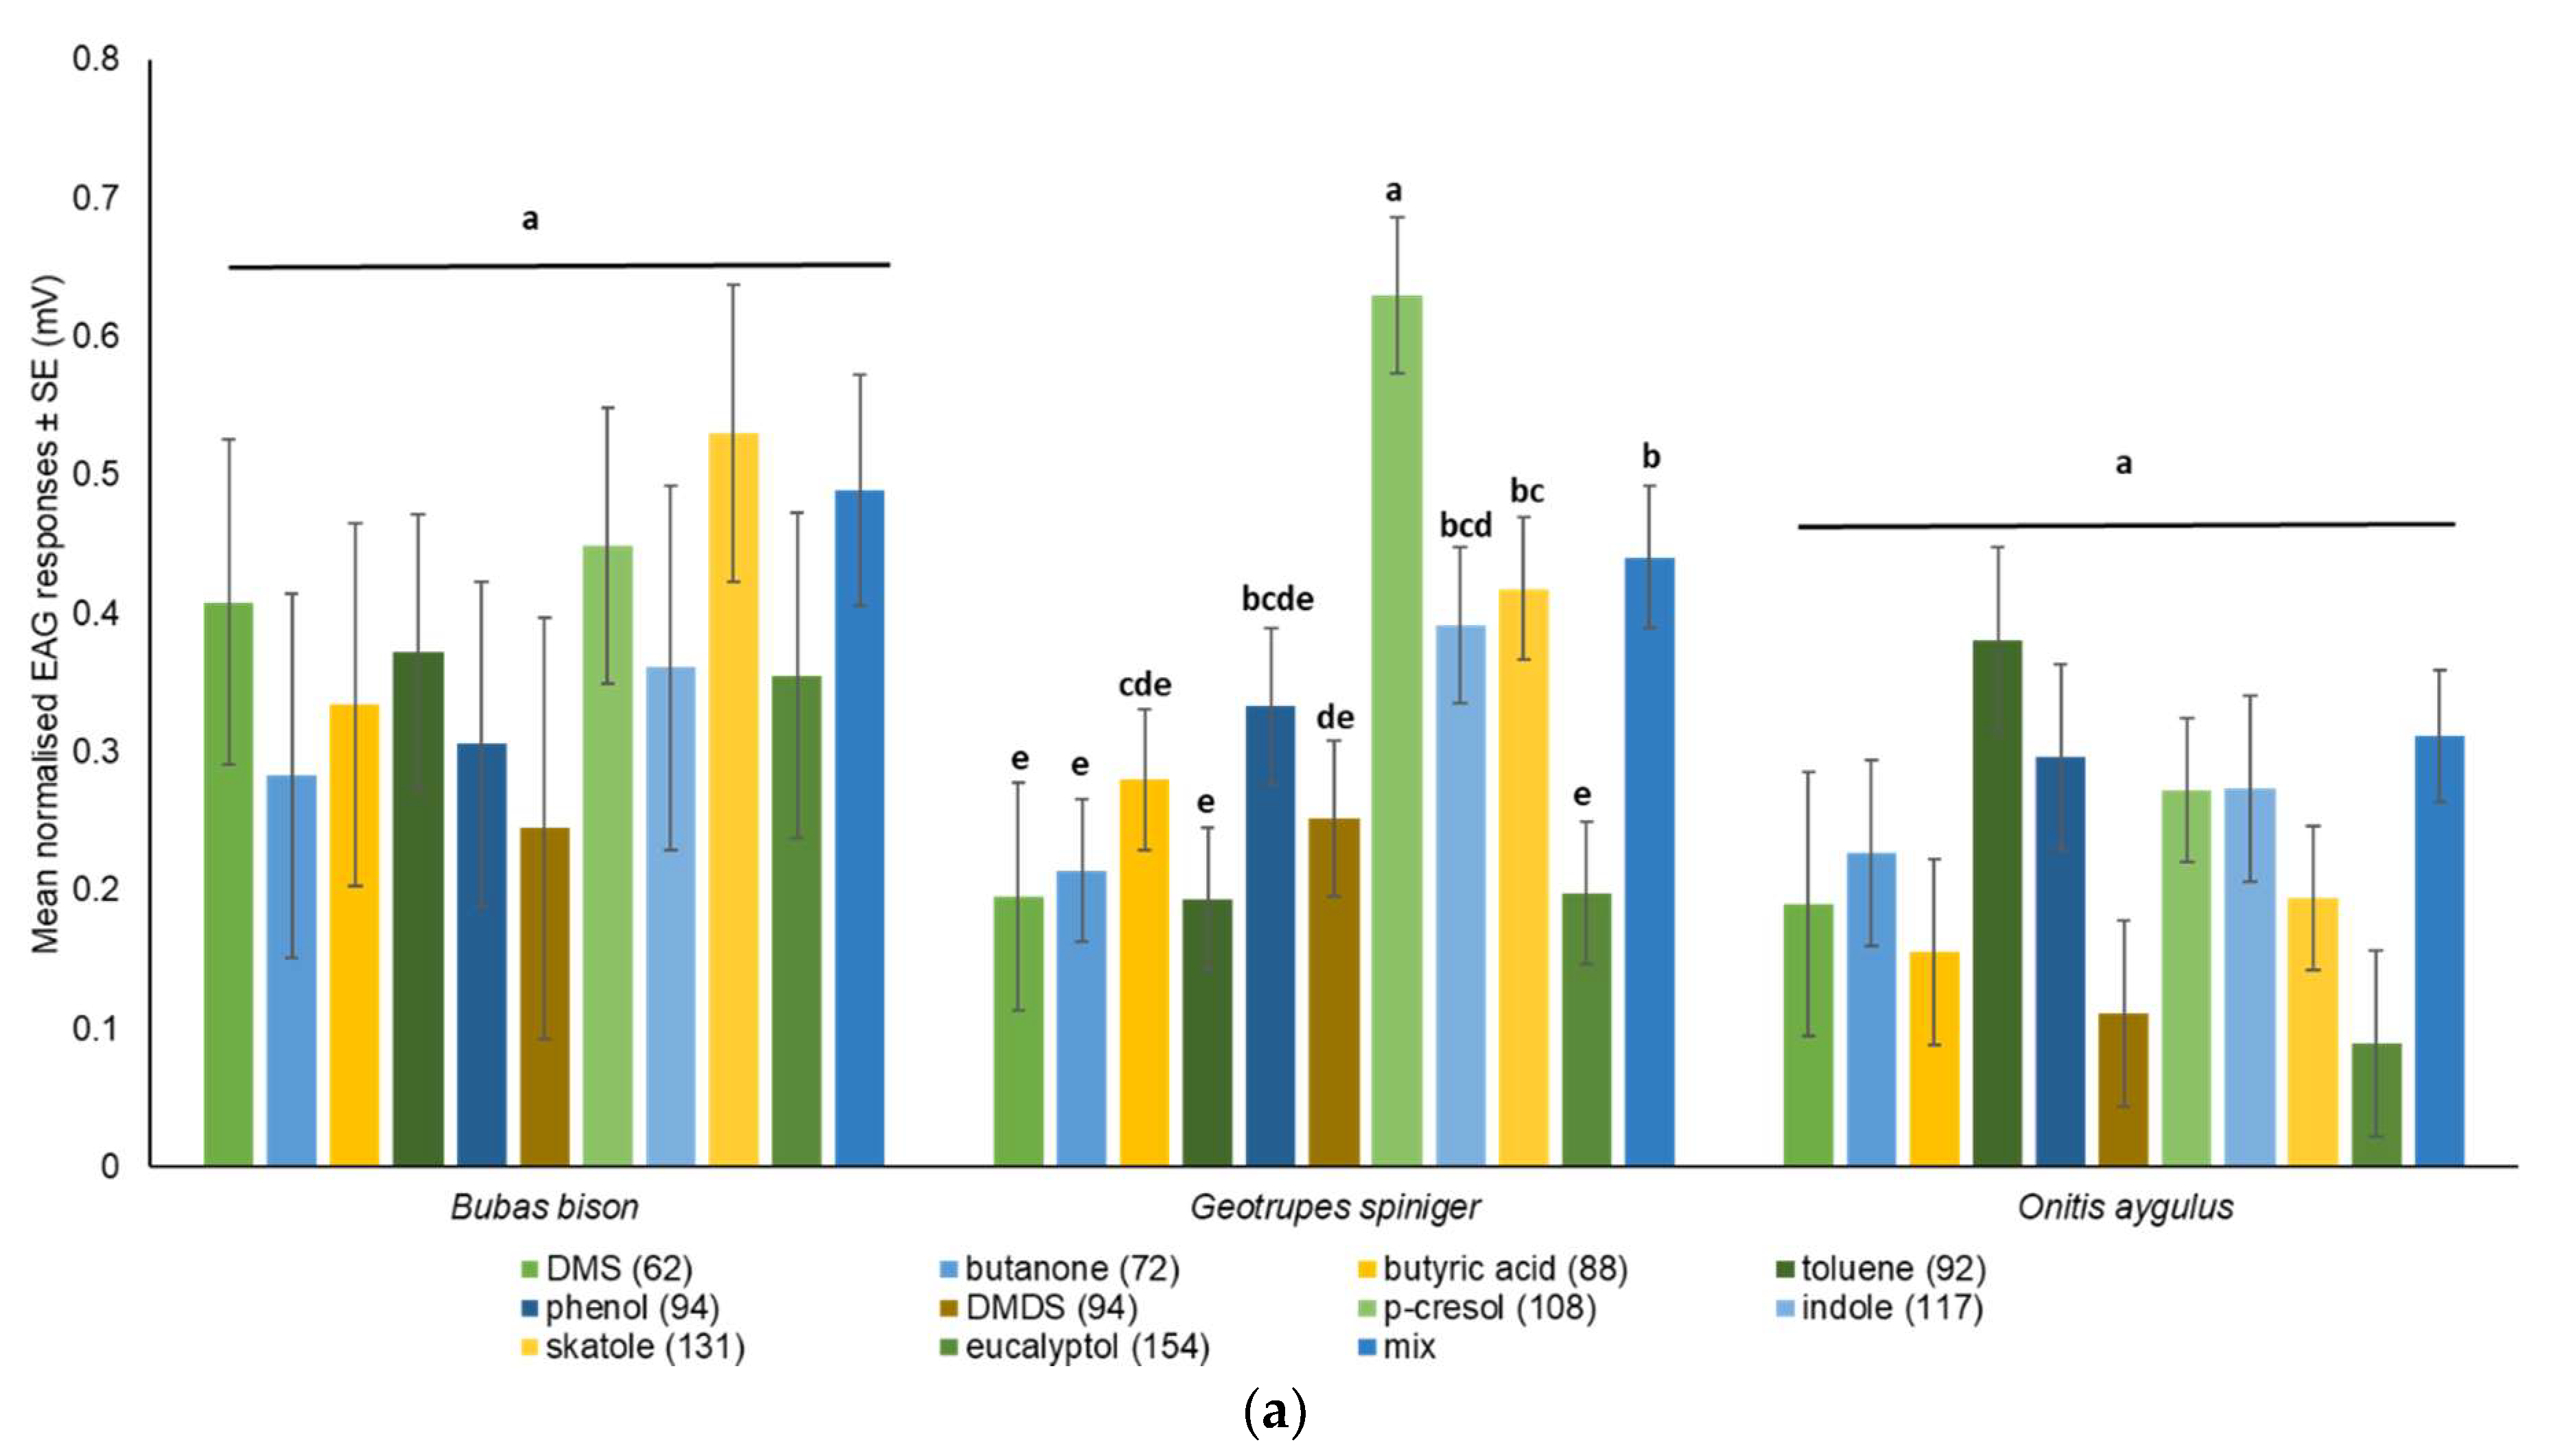
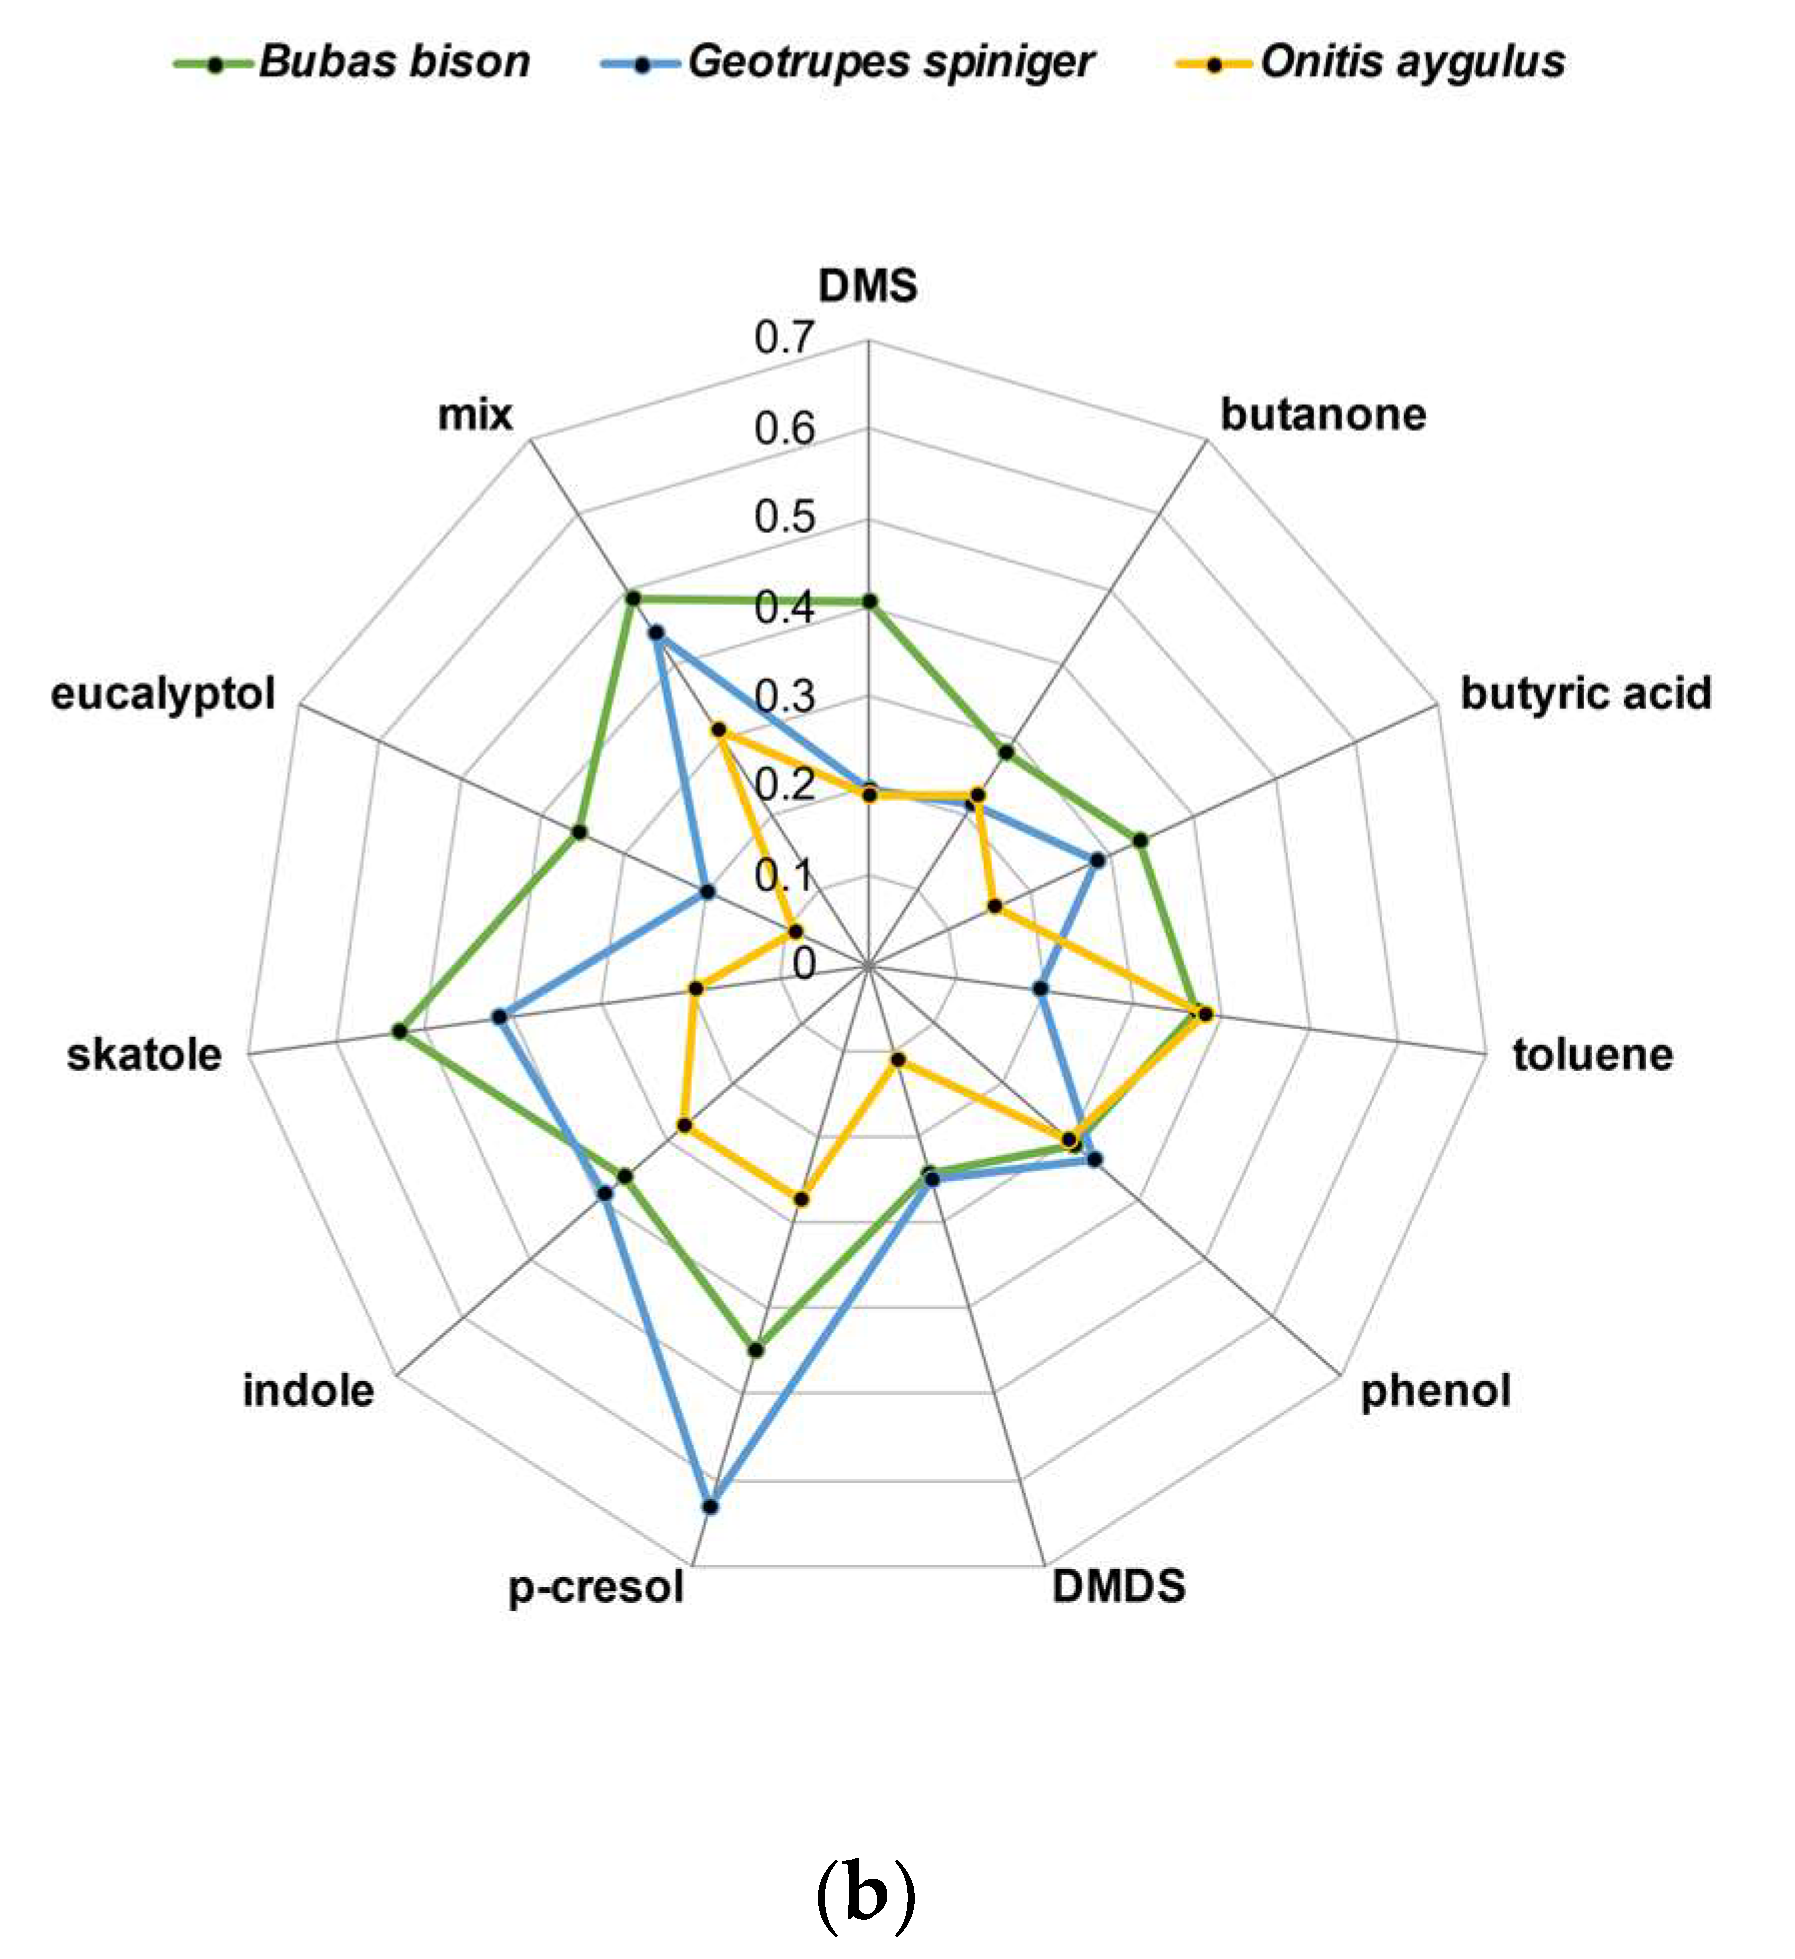
3.2. EAG Responses of Female Beetles to Selected Dung VOCs
4. Discussion
Supplementary Materials
Author Contributions
Funding
Data Availability Statement
Acknowledgments
Conflicts of Interest
References
- Nichols, E.; Spector, S.; Louzada, J.; Larsen, T.; Amezquita, S.; Favila, M.E. Ecological Functions and Ecosystem Services Provided by Scarabaeinae Dung Beetles. Biol. Conserv. 2008, 141, 1461–1474. [Google Scholar] [CrossRef]
- Doube, B.M. Ecosystem Services Provided by Dung Beetles in Australia. Basic Appl. Ecol. 2018, 26, 35–49. [Google Scholar] [CrossRef]
- Slade, E.M.; Riutta, T.; Roslin, T.; Tuomisto, H.L. The Role of Dung Beetles in Reducing Greenhouse Gas Emissions from Cattle Farming. Sci. Rep. 2016, 6, 18140. [Google Scholar] [CrossRef] [PubMed] [Green Version]
- Iwasa, M.; Moki, Y.; Takahashi, J. Effects of the Activity of Coprophagous Insects on Greenhouse Gas Emissions from Cattle Dung Pats and Changes in Amounts of Nitrogen, Carbon, and Energy. Environ. Entomol. 2015, 44, 106–113. [Google Scholar] [CrossRef] [PubMed]
- Byk, A.; Piętka, J. Dung Beetles and Their Role in the Nature. Eduk. Biol. I Środowiskowa 2018, 1, 17–26. [Google Scholar] [CrossRef]
- Dormont, L.; Epinat, G.; Lumaret, J.; Vale, P. Trophic Preferences Mediated by Olfactory Cues in Dung Beetles Colonizing Cattle and Horse Dung. Environ. Entomol. 2004, 33, 370–377. [Google Scholar] [CrossRef]
- Stavert, J.; Drayton, B.; Beggs, J.; Gaskett, A. The Volatile Organic Compounds of Introduced and Native Dung and Carrion and Their Role in Dung Beetle Foraging Behaviour. Ecol. Entomol. 2014, 39, 556–565. [Google Scholar] [CrossRef]
- Manning, P.; Ford, J.P. Evidence That Sex-Specific Signals May Support Mate Finding and Limit Aggregation in the Dung Beetle Aphodius Fossor. Ecol. Entomol. 2016, 41, 500–504. [Google Scholar] [CrossRef]
- Dormont, L.; Jay-Robert, P.; Bessière, J.M.; Rapior, S.; Lumaret, J.P. Innate Olfactory Preferences in Dung Beetles. J. Exp. Biol. 2010, 213, 3177–3186. [Google Scholar] [CrossRef] [Green Version]
- Tribe, G.D.; Burger, B.V. Olfactory Ecology. In Ecology and Evolution of Dung Beetles; Blackwell Publishing Ltd.: Chichester, UK, 2011; pp. 87–106. ISBN 9781444333152. [Google Scholar]
- Sato, K.; Touhara, K. Insect Olfaction: Receptors, Signal Transduction, and Behavior. In Chemosensory Systems in Mammals, Fishes, and Insects; Korsching, S., Meyerhof, W., Eds.; Springer: Berlin/Heidelberg, Germany, 2008; Volume 47, pp. 203–220. ISBN 9783540699187. [Google Scholar]
- Pophof, B. Pheromone-Binding Proteins Contribute to the Activation of Olfactory Receptor Neurons in the Silkmoths Antheraea polyphemus and Bombyx mori. Chem. Senses 2004, 29, 117–125. [Google Scholar] [CrossRef] [Green Version]
- Leal, W.S. Odorant Reception in Insects: Roles of Receptors, Binding Proteins, and Degrading Enzymes. Annu. Rev. Entomol. 2013, 58, 373–391. [Google Scholar] [CrossRef] [PubMed]
- Sato, K.; Pellegrino, M.; Nakagawa, T.; Nakagawa, T.; Vosshall, L.B.; Touhara, K. Insect Olfactory Receptors Are Heteromeric Ligand-Gated Ion Channels. Nature 2008, 452, 1002–1006. [Google Scholar] [CrossRef] [PubMed]
- Wicher, D.; Schäfer, R.; Bauernfeind, R.; Stensmyr, M.C.; Heller, R.; Heinemann, S.H.; Hansson, B.S. Drosophila Odorant Receptors Are Both Ligand-Gated and Cyclic-Nucleotide- Activated Cation Channels. Nature 2008, 452, 1007–1011. [Google Scholar] [CrossRef] [PubMed]
- Xiao, S.; Sun, J.S.; Carlson, J.R. Robust Olfactory Responses in the Absence of Odorant Binding Proteins. eLife 2019, 8, e51040. [Google Scholar] [CrossRef]
- Zacharuk, R. Ultrastructure and Function of Insect Chemosensilla. Annu. Rev. Entomol. 1980, 25, 27–47. [Google Scholar] [CrossRef]
- Schneider, D. Insect Antennae. Annu. Rev. Entomol. 1964, 9, 103–122. [Google Scholar] [CrossRef]
- Amat, C.; Marion-Poll, F.; Navarro-Roldán, M.A.; Gemeno, C. Gustatory Function of Sensilla Chaetica on the Labial Palps and Antennae of Three Tortricid Moths (Lepidoptera: Tortricidae). Sci. Rep. 2022, 12, 18882. [Google Scholar] [CrossRef]
- Liu, F.; Chen, L.; Appel, A.G.; Liu, N. Olfactory Responses of the Antennal Trichoid Sensilla to Chemical Repellents in the Mosquito, Culex quinquefasciatus. J. Insect Physiol. 2013, 59, 1169–1177. [Google Scholar] [CrossRef]
- Wee, S.L.; Oh, H.W.; Park, K.C. Antennal Sensillum Morphology and Electrophysiological Responses of Olfactory Receptor Neurons in Trichoid Sensilla of the Diamondback Moth (Lepidoptera: Plutellidae). Fla. Entomol. 2016, 99, 146–158. [Google Scholar] [CrossRef] [Green Version]
- Yuvaraj, J.K.; Andersson, M.N.; Anderbrant, O.; Löfstedt, C. Diversity of Olfactory Structures: A Comparative Study of Antennal Sensilla in Trichoptera and Lepidoptera. Micron 2018, 111, 9–18. [Google Scholar] [CrossRef]
- Hallberg, E. Sensory Organs in Ips typographus (Insecta: Coleoptera) Fine Structure of the Sensilla of the Maxillary and Labial Palps. Acta Zool. 1982, 63, 191–198. [Google Scholar] [CrossRef]
- Elgar, M.A.; Zhang, D.; Wang, Q.; Wittwer, B.; Pham, H.T.; Johnson, T.L.; Freelance, C.B.; Coquilleau, M. Insect Antennal Morphology: The Evolution of Diverse Solutions to Odorant Perception. Yale J. Biol. Med. 2018, 91, 457–469. [Google Scholar] [PubMed]
- Hansson, B.S.; Stensmyr, M.C. Evolution of Insect Olfaction. Neuron 2011, 72, 698–711. [Google Scholar] [CrossRef] [PubMed] [Green Version]
- Zauli, A.; Maurizi, E.; Carpaneto, G.M.; Chiari, S.; Svensson, G.P.; Di Giulio, A. Antennal Fine Morphology of the Threatened Beetle Osmoderma eremita (Coleoptera: Scarabaeidae), Revealed by Scanning Electron Microscopy. Microsc. Res. Tech. 2016, 79, 178–191. [Google Scholar] [CrossRef]
- Li, Y.Y.; Shao, K.M.; Liu, D.; Chen, L. Structure and Distribution of Antennal Sensilla in Pseudosymmachia flavescens (Brenske) (Coleoptera: Scarabaeidae: Melolonthinae). Microsc. Res. Tech. 2022, 85, 1588–1596. [Google Scholar] [CrossRef]
- Inouchi, J.; Shibuya, T.; Hatanaka, T.; Matsuzaki, O.; Hatanaka, T. Distribution and Fine Structure of Antennal Olfactory Sensilla in Japanese Dung Beetles, Geotrupes auratus Mtos.(Coleoptera: Geotrupidae) and Copris pecuarius Lew. (Coleoptera: Scarabaeidae). Int. J. Insect Morphol. Embryol. 1987, 16, 177–187. [Google Scholar] [CrossRef]
- Bohacz, C.; Harrison, J.D.G.; Ahrens, D. Comparative Morphology of Antennal Surface Structures in Pleurostict Scarab Beetles (Coleoptera). Zoomorphology 2020, 139, 327–346. [Google Scholar] [CrossRef]
- Oehlschlager, A.C.; Pierce, A.M.; Pierce, H.D.; Borden, J.H. Chemical Communication in Cucujid Grain Beetles. J. Chem. Ecol. 1988, 14, 2071–2098. [Google Scholar] [CrossRef]
- Park, K.C.; Ochieng, S.A.; Zhu, J.; Baker, T.C. Odor Discrimination Using Insect Electroantennogram Responses from an Insect Antennal Array. Chem. Senses 2002, 27, 343–352. [Google Scholar] [CrossRef] [Green Version]
- Tonelli, M.; Giménez Gómez, V.C.; Verdú, J.R.; Casanoves, F.; Zunino, M. Dung Beetle Assemblages Attracted to Cow and Horse Dung: The Importance of Mouthpart Traits, Body Size, and Nesting Behavior in the Community Assembly Process. Life 2021, 11, 873. [Google Scholar] [CrossRef]
- Finn, J.A.; Giller, P.S. Experimental Investigations of Colonisation by North Temperate Dung Beetles of Different Types of Domestic Herbivore Dung. Appl. Soil Ecol. 2002, 20, 1–13. [Google Scholar] [CrossRef]
- Kalinová, B.; Podskalská, H.; Růžička, J.; Hoskovec, M. Irresistible Bouquet of Death-How Are Burying Beetles (Coleoptera: Silphidae: Nicrophorus) Attracted by Carcasses. Naturwissenschaften 2009, 96, 889–899. [Google Scholar] [CrossRef] [PubMed]
- Galante, E.; Cartagena, M.C. Comparison of Mediterranean Dung Beetles (Coleoptera: Scarabaeoidea) in Cattle and Rabbit Dung. Environ. Entomol. 1999, 28, 420–424. [Google Scholar] [CrossRef]
- Martín-Piera, F.; Lobo, J.M. A Comparative Discussion of Trophic Preferences in Dung Beetle Communities. Misc. Zool. 1996, 19, 13–31. [Google Scholar]
- Whipple, S.D.; Hoback, W.W. A Comparison of Dung Beetle (Coleoptera: Scarabaeidae) Attraction to Native and Exotic Mammal Dung. Environ. Entomol. 2012, 41, 238–244. [Google Scholar] [CrossRef] [Green Version]
- Perera, N.N.; Weston, P.A.; Barrow, R.A.; Weston, L.A.; Gurr, G.M. Contrasting Volatilomes of Livestock Dung Drive Preference of the Dung Beetle Bubas bison (Coleoptera: Scarabaeidae). Molecules 2022, 27, 4152. [Google Scholar] [CrossRef]
- Dormont, L.; Rapior, S.; McKey, D.B.; Lumaret, J.-P.P. Influence of Dung Volatiles on the Process of Resource Selection by Coprophagous Beetles. Chemoecology 2007, 17, 23–30. [Google Scholar] [CrossRef]
- Sladecek, F.X.J.; Dötterl, S.; Schäffler, I.; Segar, S.T.; Konvicka, M. Succession of Dung-Inhabiting Beetles and Flies Reflects the Succession of Dung-Emitted Volatile Compounds. J. Chem. Ecol. 2021, 47, 433–443. [Google Scholar] [CrossRef]
- Kaur, A.P. Assessing Nutritional Resources for Dung Beetles—Optimising Ecosystem Services. Ph.D. Thesis, University of New England, Armidale, NSW, Australia, 2019. [Google Scholar]
- Aii, T.; Yonaga, M.; Tanaka, H. Changes in Headspace Volatiles of Feed in the Digestive Tracts of Cattle. Jpn. J. Grassl. Sci. 1980, 26, 223–230. [Google Scholar] [CrossRef]
- Okada, K.; Mori, M.; Shimazaki, K.; Chuman, T. Morphological Studies on the Antennal Sensilla of the Cigarette Beetle, Lasioderma serricorne(F.)(Coleoptera:Anobiidae). Appl. Entomol. Zool. 1992, 27, 269–276. [Google Scholar] [CrossRef] [Green Version]
- Schröder, R.; Hilker, M. The Relevance of Background Odor in Resource Location by Insects: A Behavioral Approach. Bioscience 2008, 58, 308–316. [Google Scholar] [CrossRef] [Green Version]
- Beyaert, I.; Wäschke, N.; Scholz, A.; Varama, M.; Reinecke, A.; Hilker, M. Relevance of Resource-Indicating Key Volatiles and Habitat Odour for Insect Orientation. Anim. Behav. 2010, 79, 1077–1086. [Google Scholar] [CrossRef]
- Frank, K.; Brückner, A.; Blüthgen, N.; Schmitt, T. In Search of Cues: Dung Beetle Attraction and the Significance of Volatile Composition of Dung. Chemoecology 2018, 28, 145–152. [Google Scholar] [CrossRef] [Green Version]
- Wurmitzer, C.; Blüthgen, N.; Krell, F.T.; Maldonado, B.; Ocampo, F.; Müller, J.K.; Schmitt, T. Attraction of Dung Beetles to Herbivore Dung and Synthetic Compounds in a Comparative Field Study. Chemoecology 2017, 27, 75–84. [Google Scholar] [CrossRef]
- Inouchi, J.; Shibuya, T.; Hatanaka, T. Food Odor Responses of Single Antennal Olfactory Cells in the Japanese Dung Beetle, Geotrupes auratus (Coleoptera: Geotrupidae). Appl. Entomol. Zool. 1988, 23, 167–174. [Google Scholar] [CrossRef] [Green Version]
- Urrutia, M.A.; Cortez, V.; Verdú, J.R. Links Between Feeding Preferences and Electroantennogram Response Profiles in Dung Beetles: The Importance of Dung Odor Bouquets. J. Chem. Ecol. 2022, 48, 690–703. [Google Scholar] [CrossRef]
- Burger, B.V. First Investigation of the Semiochemistry of South African Dung Beetle Species. In Neurobiology of Chemical Communication; Mucignat-Caretta, C., Ed.; CRC Press: Boca Raton, FL, USA, 2014; pp. 57–97. ISBN 9781466553422. [Google Scholar]
- Goolsby, J.A.; Singh, N.K.; Thomas, D.B.; Ortega, A.S.; Hewitt, D.G.; Campbell, T.A.; Perez De Leon, A. Comparison of Chemical Attractants against Dung Beetles. Southwest. Entomol. 2017, 42, 339–346. [Google Scholar] [CrossRef]
- Pokhrel, M.R.; Cairns, S.C.; Hemmings, Z.; Floate, K.D.; Andrew, N.R. A Review of Dung Beetle Introductions in the Antipodes and North America: Status, Opportunities, and Challenges. Environ. Entomol. 2021, 50, 762–780. [Google Scholar] [CrossRef]
- Johnson, S.D.; Sivechurran, J.; Doarsamy, S.; Shuttleworth, A. Dung Mimicry: The Function of Volatile Emissions and Corolla Patterning in Fly-Pollinated Wurmbea Flowers. N. Phytol. 2020, 228, 1662–1673. [Google Scholar] [CrossRef]
- Sayers, T.D.J.; Steinbauer, M.J.; Farnier, K.; Miller, R.E. Dung Mimicry in Typhonium (Araceae): Explaining Floral Trait and Pollinator Divergence in a Widespread Species Complex and a Rare Sister Species. Bot. J. Linn. Soc. 2020, 193, 375–401. [Google Scholar] [CrossRef]
- Kite, G.; Hetterscheid, W.; Lewis, M.; Boyce, P.; Ollerton, J.; Cocklin, E.; Diaz, A.; Simonds, M.S. Inflorescence Odours and Pollinators of Arum and Amorphophallus (Araceae). Reprod. Biol. 1998, 295–315. [Google Scholar]
- Cortez, V.; Favila, M.E.; Verdú, J.R.; Ortiz, A.J. Behavioral and Antennal Electrophysiological Responses of a Predator Ant to the Pygidial Gland Secretions of Two Species of Neotropical Dung Roller Beetles. Chemoecology 2012, 22, 29–38. [Google Scholar] [CrossRef]
- Zacharuk, R. Antennae and Sensilla. In Comprehensive Insect Physiology, Biochemistry and Pharmacology; Pergamon Press: Oxford, UK, 1985; Volume 6, pp. 1–69. [Google Scholar]
- Steinbrecht, R.A. Structure and Function of Insect Olfactory Sensilla. CIBA Found. Symp. 1996, 200, 158–177. [Google Scholar] [PubMed]
- Pfrommer, A.; Krell, F.T. Who Steals the Eggs? Coprohanaeus telamon (Erichson) Buries Decomposing Eggs in Western Amazonian Rain Forest (Coleoptera: Scarabaeidae). Coleopt. Bull. 2004, 58, 21–27. [Google Scholar] [CrossRef]
- Harvey, D.J.; Vuts, J.; Hooper, A.; Finch, P.; Woodcock, C.M.; Caulfield, J.C.; Kadej, M.; Smolis, A.; Withall, D.M.; Henshall, S.; et al. Environmentally Vulnerable Noble Chafers Exhibit Unusual Pheromone-Mediated Behaviour. PLoS ONE 2018, 13, e0206526. [Google Scholar] [CrossRef]
- Olsson, S.B.; Hanson, B.S. Electroantennogram and Single Sensillum Recording in Insect Antennae. In Pheromone Signaling: Methods and Protocols; Touhara, K., Ed.; Humana Press: Totowa, NJ, USA, 2013; pp. 157–177. ISBN 978-1-62703-618-4. [Google Scholar]
- Li, Y.-Y.; Liu, D.; Wen, P.; Chen, L. Detection of Volatile Organic Compounds by Antennal Lamellae of a Scarab Beetle. Front. Ecol. Evol. 2021, 9, 759778. [Google Scholar] [CrossRef]
- Mutis, A.; Palma, R.; Parra, L.; Alvear, M.; Isaacs, R.; Morón, M.; Quiroz, A. Morphology and Distribution of Sensilla on the Antennae of Hylamorpha elegans Burmeister (Coleoptera: Scarabaeidae). Neotrop. Entomol. 2014, 43, 260–265. [Google Scholar] [CrossRef]
- Vuts, J.; Szanyi, S.; Szanyi, K.; König, L.; Nagy, A.; Imrei, Z.; Birkett, M.A.; Tóth, M. Development of a Phytochemical-Based Lure for the Dried Bean Beetle Acanthoscelides obtectus Say (Coleoptera: Chrysomelidae). J. Chem. Ecol. 2021, 47, 987–997. [Google Scholar] [CrossRef]
- Williams, L.J.; Abdi, H. Fisher’s Least Significant Difference Test. Encycl. Res. Des. 2010, 218, 840–853. [Google Scholar] [CrossRef]
- Welch, B.L. On the Comparison of Several Mean Values: An Alternative Approach. Biometrika 1951, 38, 330–336. [Google Scholar] [CrossRef]
- Levene, H. Robust Tests for the Equality of Variance. In Contributions to Probability and Statistics: Essays in Honor of Harold Hotelling; Stanford University Press: Redwood City, CA, USA, 1960; pp. 278–292. [Google Scholar]
- Sen, A.; Raina, R.; Joseph, M.; Tungikar, V.B. Response of Trichogramma chilonis to Infochemicals: An SEM and Electrophysiological Investigation. BioControl 2005, 50, 429–447. [Google Scholar] [CrossRef]
- Meinecke, C.C. Riechsensillen Und Systematik Der Lamellicornia (Insecta, Coleoptera). Zoomorphologie 1975, 82, 1–42. [Google Scholar] [CrossRef]
- Berg, J.; Schmidt, K. Comparative Morphology and Moulting of Sensilla Basiconica of Lepisma saccharina Linnaeus (Zygentoma: Lepismatidae) and Machilis sp. (Archaeognatha: Machilidae). Int. J. Insect Morphol. Embryol. 1997, 26, 161–172. [Google Scholar] [CrossRef]
- Lopes, O.; Barata, E.N.; Mustaparta, H.; Araújo, J. Fine Structure of Antennal Sensilla Basiconica and Their Detection of Plant Volatiles in the Eucalyptus Woodborer, Phoracantha semipunctata Fabricius (Coleoptera: Cerambycidae). Arthropod Struct. Dev. 2002, 31, 1–13. [Google Scholar] [CrossRef] [PubMed]
- Ali, S.A.I.; DIakite, M.M.; Ali, S.; Wang, M.Q. Effects of the Antennal Sensilla Distribution Pattern on the Behavioral Responses of Tribolium castaneum (Coleoptera: Tenebrionidae). Fla. Entomol. 2016, 99, 52–59. [Google Scholar] [CrossRef] [Green Version]
- Mustaparta, H. Responses of Single Olfactory Cells in the Pine Weevil Hylobius abietis L. (Col.: Curculionidae). J. Comp. Physiol. A 1975, 97, 271–290. [Google Scholar] [CrossRef]
- Larsson, M.C.; Leal, W.S.; Hansson, B.S. Olfactory Receptor Neurons Detecting Plant Odours and Male Volatiles in Anomala cuprea Beetles (Coleoptera: Scarabaeidae). J. Insect Physiol. 2001, 47, 1065–1076. [Google Scholar] [CrossRef]
- Bengtsson, J.M.; Khbaish, H.; Reinecke, A.; Wolde-Hawariat, Y.; Negash, M.; Seyoum, E.; Hansson, B.S.; Hillbur, Y.; Larsson, M.C. Conserved, Highly Specialized Olfactory Receptor Neurons for Food Compounds in 2 Congeneric Scarab Beetles, Pachnoda interrupta and Pachnoda marginata. Chem. Senses 2011, 36, 499–513. [Google Scholar] [CrossRef] [Green Version]
- Hallberg, E.; Hansson, B.S.; Steinbrecht, R.A. Morphological Characteristics of Antennal Sensilla in the European Cornborer Ostrinia nubilalis (Lepidoptera: Pyralidae). Tissue Cell 1994, 26, 489–502. [Google Scholar] [CrossRef]
- Ochieng, S.A.; Hallberg, E.; Hansson, B.S. Fine Structure and Distribution of Antennal Sensilla of the Desert Locust, Schistocerca gregaria (Orthoptera: Acrididae). Cell Tissue Res. 1998, 291, 525–536. [Google Scholar] [CrossRef]
- Siju, K.P.; Hill, S.R.; Hansson, B.S.; Ignell, R. Influence of Blood Meal on the Responsiveness of Olfactory Receptor Neurons in Antennal Sensilla Trichodea of the Yellow Fever Mosquito, Aedes aegypti. J. Insect Physiol. 2010, 56, 659–665. [Google Scholar] [CrossRef] [PubMed] [Green Version]
- Merivee, E.; Rahi, M.; Luik, A. Antennal Sensilla of the Click Beetle, Melanotus villosus (Geoffroy) (Coleoptera: Elateridae). Int. J. Insect Morphol. Embryol. 1999, 28, 41–51. [Google Scholar] [CrossRef]
- Isidoro, N.; Bartlet, E.; Ziesmann, J.; Williams, I.H. Antennal Contact Chemosensilla in Psylliodes chrysocephala Responding to Cruciferous Allelochemicals. Physiol. Entomol. 1998, 23, 131–138. [Google Scholar] [CrossRef]
- Pitts, R.J.; Zwiebel, L.J. Antennal Sensilla of Two Female Anopheline Sibling Species with Differing Host Ranges. Malar. J. 2006, 5, 26. [Google Scholar] [CrossRef] [Green Version]
- Khbaish, H. Identification of Olfactory Receptor Neurons in Two Species of Scarab Beetles: A Comparative Study by Means of Single Sensillum Recording; Swedish University of Agricultural Sciences: Uppsala, Sweden, 2010. [Google Scholar]
- Olson, D.M.; Andow, D.A. Antennal Sensilla of Female Trichogramma nubilale (Ertle and Davis) (Hymenoptera: Trichogrammatidae) and Comparisons with Other Parasitic Hymenoptera. Int. J. Insect Morphol. Embryol. 1993, 22, 507–520. [Google Scholar] [CrossRef]
- Khalifa, R.; El-Nady, N.A.; Ahmed, A.M.; Hassan, F. Comparative Study of the Sensilla on Antenna and Maxillary Palps of Five Culicine Mosquitoes in Sohag Governorate. J. Egypt. Soc. Parasitol. 2013, 43, 481–491. [Google Scholar]
- Hughes, D.T.; Pelletier, J.; Luetje, C.W.; Leal, W.S. Odorant Receptor from the Southern House Mosquito Narrowly Tuned to the Oviposition Attractant Skatole. J. Chem. Ecol. 2010, 36, 797–800. [Google Scholar] [CrossRef] [Green Version]
- Leal, W.S.; Barbosa, R.M.R.; Xu, W.; Ishida, Y.; Syed, Z.; Latte, N.; Chen, A.M.; Morgan, T.I.; Cornel, A.J.; Furtado, A. Reverse and Conventional Chemical Ecology Approaches for the Development of Oviposition Attractants for Culex Mosquitoes. PLoS ONE 2008, 3, e3045. [Google Scholar] [CrossRef] [Green Version]
- Weithmann, S.; von Hoermann, C.; Schmitt, T.; Steiger, S.; Ayasse, M. The Attraction of the Dung Beetle Anoplotrupes atercorosus (Coleoptera: Geotrupidae) to Volatiles from Vertebrate Cadavers. Insects 2020, 11, 476. [Google Scholar] [CrossRef]


| Species | Antennal Section | Sensilla Density/100 µm² (Mean ± SE) | |||||
|---|---|---|---|---|---|---|---|
| Sensilla Trichodea | Sensilla Basiconica | Sensilla Chaetica | |||||
| Male | Female | Male | Female | Male | Female | ||
| B. bison | L1 proximal | 0.54 ± 0.049 abc | 0.4693 ± 0.05 b | 0.12 ± 0.16 c * | d | 0.02 ± 0.001 a | 0.02 ± 0.002 a |
| L1 distal | 0.47 ± 0.05 bc | 0.43 ± 0.05 b | 2.12 ± 0.16 a | 2.14 ± 0.08 a | c | c | |
| L2 proximal | 0.62 ± 0.06 ab | 0.81 ± 0.05 a | 0.52 ± 0.20 bc | 0.53 ± 0.77 bc | c | c | |
| L2 distal | 0.32 ± 0.05 c | 0.43 ± 0.05 b | 2.19 ± 0.16 a | 2.31 ± 0.09 a | c | c | |
| L3 proximal | 0.73 ± 0.05 a * | 0.59 ± 0.06 ab | 0.66 ± 0.16 bc * | 0.30 ± 0.09 cd | c | c | |
| L3 distal | 0.57 ± 0.05 ab | 0.71 ± 0.47 a | 1.01 ± 0.16 b | 0.90 ± 0.08 b | 0.01 ± 0.002 b | 0.016 ± b | |
| O. aygulus | L1 proximal | 0.27 ± 0.05 c | 0.38 ± 0.06 cd | - | 0.00 ± 0.11 b | 0.03 ± 2.45 × 10⁻¹⁸ a | 0.03 ± 2.45 × 10⁻¹⁸ a |
| L1 distal | 0.88 ± 0.07 a | 0.43 ± 0.06 bcd | 0.86 ± 0.16 a | 1.02 ± 0.11 a | c | c | |
| L2 proximal | 0.55 ± 0.05 b | 0.81 ± 0.06 a | 1.19 ± 0.13 a | 1.05 ± 0.11 a | c | c | |
| L2 distal | 0.50 ± 0.07 bc | 0.20 ± 0.08 d | 1.20 ± 0.16 a | 1.16 ± 0.14 a | c | c | |
| L3 proximal | 0.77 ± 0.05 ab * | 0.59 ± 0.08 abc | 1.16 ± 0.13 a * | 1.11 ± 0.11 a | c | c | |
| L3 distal | 0.72 ± 0.05 ab | 0.71 ± 0.06 ab | 1.01 ± 0.13 a | 1.12 ± 0.14 a | 0.02 ± 0.003 b | 0.02 ± 0.002 b | |
| G. spiniger | L1 proximal | 0.72 ± 0.01 a | 0.55 ± 0.10 abc | 0.31 ± 0.02 c | 0.38 ± 0.04 c | 0.01 ± 0.003 a | 0.01 ± 0.003 a |
| L1 distal | 0.39 ± 0.02 c | 0.40 ± 0.05 c | 2.20 ± 0.08 a | 1.92 ± 0.08 a | b | b | |
| L2 proximal | 0.66 ± 0.05 a | 0.74 ± 0.05 ab | 0.62 ± 0.04 bc ** | 0.39 ± 0.02 bc | b | b | |
| L2 distal | 0.47 ± 0.04 bc | 0.46 ± 0.04 bc | 2.16 ± 0.20 a | 1.92 ± 0.07 a | b | b | |
| L3 proximal | 0.71 ± 0.01 a | 0.78 ± 0.08 a | 0.45 ± 0.06 bc | 0.42 ± 0.06 bc | b | b | |
| L3 distal | 0.59 ± 0.06 ab | 0.74 ± 0.03 ab | 0.88 ± 0.07 b | 0.73 ± 0.13 b | 0.01 ± 0.0013 ab | 0.005 ± 0.0003 b | |
| Source of Variation | df | F | p |
|---|---|---|---|
| Sex | 1 | 1.124 | 0.229 |
| Lamella surface | 5 | 122.323 | <0.001 |
| Species | 2 | 1.149 | 0.319 |
| Sensilla type | 2 | 1419.180 | <0.001 |
| Sex × lamella surface | 5 | 0.523 | 0.759 |
| Sex × species | 2 | 1.311 | 0.272 |
| Sex × sensilla type | 2 | 3.539 | 0.031 |
| Lamella surface × species | 10 | 16.057 | <0.001 |
| Lamella surface × sensilla type | 10 | 145.910 | <0.001 |
| Species × sensilla type | 4 | 8.402 | <0.001 |
| Sex × lamella surface × species | 10 | 0.808 | 0.621 |
| Sex × lamella surface × sensilla type | 10 | 0.798 | 0.631 |
| Sex × species × sensilla type | 4 | 0.803 | 0.525 |
| Lamella surface × species × sensilla type | 20 | 27.505 | <0.001 |
| Sex × lamella surface × species × sensilla type | 20 | 1.272 | 0.202 |
| Source of Variation | df | F | p |
|---|---|---|---|
| Compound | 10 | 2.724 | 0.005 |
| Species | 2 | 6.615 | 0.002 |
| Compounds × species | 20 | 0.942 | 0.536 |
| ANOVA | LSD | |||
|---|---|---|---|---|
| F | pP | Bubas bison | Geotrupes spiniger | Onitis aygulus |
| 9.37 | 0.0002 | 0.397 ± 0.026 A | 0.3171 ± 0.025 B | 0.2352 ± 0.032 C |
| ANOVA | |
| F | p |
| 2.61 | 0.0059 |
| LSD | |
| p-cresol | 0.450 ± 0.048 A |
| mix | 0.430 ± 0.042 AB |
| skatole | 0.391 ± 0.048 ABC |
| indole | 0.352 ± 0.057 ABCD |
| phenol | 0.314 ± 0.055 ABCD |
| toluene | 0.307 ± 0.050 BCD |
| DMS | 0.276 ± 0.055 CD |
| butyric acid | 0.268 ± 0.055 CD |
| butanone | 0.238 ± 0.055 D |
| eucalyptol | 0.231 ± 0.053 D |
| DMDS | 0.211 ± 0.060 D |
Disclaimer/Publisher’s Note: The statements, opinions and data contained in all publications are solely those of the individual author(s) and contributor(s) and not of MDPI and/or the editor(s). MDPI and/or the editor(s) disclaim responsibility for any injury to people or property resulting from any ideas, methods, instructions or products referred to in the content. |
© 2023 by the authors. Licensee MDPI, Basel, Switzerland. This article is an open access article distributed under the terms and conditions of the Creative Commons Attribution (CC BY) license (https://creativecommons.org/licenses/by/4.0/).
Share and Cite
Perera, N.N.; Barrow, R.A.; Weston, P.A.; Rolland, V.; Hands, P.; Gurusinghe, S.; Weston, L.A.; Gurr, G.M. Characterisation of Antennal Sensilla and Electroantennography Responses of the Dung Beetles Bubas bison, Onitis aygulus and Geotrupes spiniger (Coleoptera: Scarabaeoidea) to Dung Volatile Organic Compounds. Insects 2023, 14, 627. https://doi.org/10.3390/insects14070627
Perera NN, Barrow RA, Weston PA, Rolland V, Hands P, Gurusinghe S, Weston LA, Gurr GM. Characterisation of Antennal Sensilla and Electroantennography Responses of the Dung Beetles Bubas bison, Onitis aygulus and Geotrupes spiniger (Coleoptera: Scarabaeoidea) to Dung Volatile Organic Compounds. Insects. 2023; 14(7):627. https://doi.org/10.3390/insects14070627
Chicago/Turabian StylePerera, Nisansala N., Russell A. Barrow, Paul A. Weston, Vivien Rolland, Philip Hands, Saliya Gurusinghe, Leslie A. Weston, and Geoff M. Gurr. 2023. "Characterisation of Antennal Sensilla and Electroantennography Responses of the Dung Beetles Bubas bison, Onitis aygulus and Geotrupes spiniger (Coleoptera: Scarabaeoidea) to Dung Volatile Organic Compounds" Insects 14, no. 7: 627. https://doi.org/10.3390/insects14070627