Simple Summary
North American bean thrips, Caliothrips fasciatus, native to California (U.S.), is a regular contaminant of navel oranges exported from California. Despite more than 100 years of accidental shipments overseas, this polyphagous thrips has not established outside of its native range. Understanding why this thrips has not successfully invaded other parts of the world may be explained, in part, by the effects of temperature on fitness. This study investigated the effects of nine fluctuating temperatures that averaged 8, 10, 15, 20, 25, 30, 32, 35, and 37 °C over a 24 h period on the developmental and reproductive biology of C. fasciatus to better understand the effects of temperature on these critical life history characters and how temperature may influence the invasion potential of this thrips.
Abstract
North American bean thrips, Caliothrips fasciatus, native to California U.S., has been detected inside the navels of navel oranges exported from California for more than 120 years. Despite this long history of accidental movement into new areas, this thrips has failed to establish populations outside of its native range. The cold accumulation hypothesis postulates that increasing levels of cold stress experienced by thrips overwintering inside navels is compounded when harvested fruit is shipped under cold storage conditions. Consequently, the fitness of surviving thrips is compromised, which greatly diminishes invasion potential. At the time this study was conducted, the effects of temperature on C. fasciatus fitness were unknown. To address this shortcoming, the effects of nine fluctuating temperatures that averaged 8, 10, 15, 20, 25, 30, 32, 35, and 37 °C over a 24 h period on the developmental and reproductive biology of C. fasciatus were evaluated. One linear and five nonlinear regression functions were fit to egg-to-adult development rate data for parent and offspring thrips to characterize thermal performance curves. Estimates of minimum, optimal, and maximum temperature thresholds for development were in the ranges of −4.37–6.52 °C (i.e., Tmin), 31.19–32.52 °C (i.e., Topt), and 35.07–37.98 °C (i.e., Tmax), respectively. Degree day accumulation to complete development, estimated from linear regression, ranged 370.37–384.61. Average development times for eggs, first and second instar larvae, propupae, pupae, and adult longevity, and mean lifetime fecundity of females were significantly affected by temperature. These biological responses to temperature may provide insight into how this abiotic variable affects the invasion potential of C. fasciatus.
1. Introduction
North American bean thrips, Caliothrips fasciatus (Pergande, 1895) (Thysanoptera: Thripidae), is native to California (U.S.) and has a natural range that extends north from California into western Canada, south into México, and east into Idaho and Florida (both U.S. states) [1]. Confirmation of putative breeding populations of C. fasciatus outside of this native range in Puerto Rico, Hawai’i [U.S.], Argentina, Brazil, and China are lacking [2,3]. In California, C. fasciatus is widely distributed and breeds on various native and introduced weed species including sow thistle (Sonchus oleraceus L.), prickly lettuce (Latuca scariola L.), cheese weed (Malva parviflora L.), fennel (Foeniculum vulgare Miller), and California poppy (Eschscholzia californica Cham.) [4,5,6,7].
Historically, C. fasciatus was a significant agricultural pest in California, infesting alfalfa (Medicago sativa L.), beans (Phaseolus vulgaris L.), cantaloupes (Cucumis melo L.), cotton (Gossypium hirsutum L.), lettuce (Lactuca sativa L.), pear (Pyrus spp.), pea (Pisum sativum L.), and walnut (Juglans regia L.) [4,5,6]. Curiously, pestiferousness has waned significantly, possibly due to development of integrated pest management programs, use of insecticides with greater efficacy, or development of resistance cultivars [8]. Currently, the major agricultural issue associated with C. fasciatus in California is trade related. In California, adult C. fasciatus overwinter inside the “navels” of navel oranges from early November to late March [3]. Infested fruit are harvested over this time period and exported. Detections of C. fasciatus concealed within fruit exported from California trigger quarantine procedures when intercepted by importing countries (e.g., Australia and New Zealand). In some years ~6% of imported shipments may be contaminated with live thrips [2,7]. Caliothrips fasciatus is amongst the 10 most frequently border-intercepted Thysanoptera for Australia (over the period 2003–2016) and New Zealand (2000–2017) (Rebecca Turner pers. comm. 2023). To mitigate quarantine issues, research on C. fasciatus has focused, in part, on the development of sampling, monitoring, and management programs in citrus [2,9,10] and fumigation strategies for harvested fruit [11,12].
Interestingly, exports of fresh citrus fruit contaminated with overwintering C. fasciatus have been occurring for >120 years. Caliothrips fasciatus was detected in navel oranges exported from California to Nebraska, Illinois, and Hawai’i (all U.S. states) as early as 1899, 1907, and 1929, respectively [3]. Therefore, it is likely that C. fasciatus has been unintentionally and widely distributed in navel oranges exported from California, the largest producer of this fruit in the U.S. [13], for a long period of time. Amongst the top 15 importing markets for fresh U.S. grown oranges in 2021 (South Korea was ranked number 1) are Australia (ranked 7) and New Zealand (ranked 15) [14]. The navel orange marketing season in California is 1 October–15 June [13], with the bulk of exports to Australia and New Zealand, for example, occurring over the period November–March, which spans meteorological fall–winter in California. This export period coincides mainly with meteorological spring–summer in Australia and New Zealand, a time of year when temperatures would be favorable for C. fasciatus establishment, and host plants in a suitable phenological state for infestation would be abundant [7].
Propagule pressure, a function of frequency of introductions and numbers of individuals introduced each time [15,16,17], is a reliable predictor of establishment likelihood [16,17]. For example, low propagule pressure (<10 individuals) results in low establishment rates due to Allee effects (e.g., inability to locate mates) or environmental stochasticity (e.g., inclement weather events) [16,17]. In contrast, propagule pressure, in the range of >10–100 individuals, is associated with increased invasion success, due to greater likelihood of establishment by species introduced into new areas [16,17]. Importantly, thrips (i.e., Thysanoptera) are one of the most commonly intercepted insect orders found during border inspections [18]. Assuming that C. fasciatus propagule pressure has been relatively consistent, but fluctuating in intensity over time due to variations in infestation dynamics [16], a question of interest is: “Why has C. fasciatus, a polyphagous thrips, failed to establish outside of its native range, despite, presumably, a long history of frequent accidental introductions via importation of infested navel oranges into new areas with favorable receiving environments?” The accumulative cold stress hypothesis, in part, may provide a potential explanation for this outcome [2,7].
The accumulative cold stress hypothesis suggests that C. fasciatus adults suffer adverse effects from accumulating cold stress that results from overwintering inside fruit in a field prior to harvest. Cold stress accumulation increases when harvested fruit is subjected to refrigerated shipping (i.e., ~3 °C for 15–16 days in transit [7]). Collectively, accumulative cold stress from low temperature exposure in a field prior to fruit harvest, which is then followed by refrigerated shipping, may impact the fitness (e.g., longevity, fecundity, and offspring sex ratio) of surviving thrips. Consequently, live-but-cold-stressed C. fasciatus that make it to Australia and New Zealand, for example, may be too debilitated to establish viable populations [2,7].
Almost nothing is known about the effects of exposure that different temperature regimens have on C. fasciatus developmental and reproductive biology. The lack of these types of fundamental temperature-driven data is a significant impediment to investigating the effects of temperature on the fitness of C. fasciatus and how varying temperature exposures may affect the invasion potential of this thrips. As a first step in investigating the effects of temperature on C. fasciatus, work reported here was undertaken to determine the minimum, optimal, and maximum temperatures, and degree-day requirements for C. fasciatus to complete development and how temperature affects basic population demographic parameters such as preimaginal developmental times, adult female reproductive outputs, offspring sex ratios, and adult longevities.
2. Materials and Methods
2.1. Establishment of Thrips Colonies for Experiments
Approximately 97% of navel-orange-producing acreage in California is planted in the Central Valley, with Tulare, Kern, and Fresno Counties having 59, 22, and 18%, respectively, of the fruit-bearing acreage in the Central Valley [19]. Consequently, the major region of origin for the export of navel orange fruit contaminated with C. fasciatus is the Central Valley. Therefore, to ensure thrips used for initiating colonies from which material for experiments would be sourced had phenotypes representing those likely to be found contaminating citrus exported from the Central Valley, adult C. fasciatus were collected from Visalia and Porterville, both of which are in Tulare County, the largest county growing and exporting navel oranges. To start thrips colonies for temperature experiments, adult C. fasciatus were collected from foliage of asparagus, Asparagus officinalis L., and California poppy, E. californica, two very good host plants for this pest [4,5,6], which were growing in the vicinity of Visalia and Porterville, Tulare County.
To collect thrips to initiate colonies, adult C. fasciatus were dislodged from infested plants by gently beating foliage over a white plastic tray. Adult bean thrips were aspirated from the tray and vials of aspirated thrips were emptied into ventilated plastic boxes (25 cm × 25 cm × 40 cm) covered with 105 µm ventilation mesh that contained potted lima bean plants (Phaseolus lunatus L.), cultivar Fordhook 242 (Gurneys Seed and Nursery Company, Lawrenceburg, IN, USA). Colonies of C. fasciatus were subsequently maintained on this host plant at the University of California Riverside Insectary and Quarantine Facility inside ventilated BugDorm-2120 Insect Rearing Tents (60 cm × 60 cm × 60 cm, 160 µm ventilation mesh (Mega View Science, Taiwan)), at 26.6 °C ± 1.03 °C and 50% RH under long days (L:D 14:10 h). Plants were watered every third day and fertilized with MiracleGro® (The Scotts Company LLC) at the recommended label rate. At 14-day intervals, new plants were introduced into cages, and existing plants were allowed to die, thereby forcing thrips onto new host plants. Adult thrips from this colony were collected and used to initiate the experiments detailed below.
2.2. Preimaginal Development, Adult Longevity, and Female Fecundity across Nine Fluctuating Temperature Regimens
To obtain thrips eggs for fluctuating temperature studies (see below), approximately 20–30 adult male–female pairs of C. fasciatus were removed from colony cages, and thrips pairs were placed onto the undersides (i.e., abaxial side) of clean excised Lima bean leaves, cultivar Fordhook 242, which were enclosed in labeled Munger cells [20,21]. Adult pairs of thrips were then immediately placed into temperature cabinets set for each experimental temperature regimen (see below for details on fluctuating temperature regimens). Male–female pairs were moved to new leaves every 24 h, and leaves exposed to mating pairs of thrips were removed from Munger cells, placed adaxial side (i.e., top side of leaf) down on water-saturated foam pads, and maintained at the same temperature regimen, under which oviposition had occurred. Leaves were checked daily, and the time to emergence in days for first instar thrips larvae was recorded for each experimental temperature. A minimum of 10 and a maximum of 30 first instar larvae were moved from natal leaves using a fine camel hair brush and placed individually onto clean excised Lima bean leaves, cultivar Fordhook 242, which were enclosed in labeled Munger cells. Preimaginal life stages were observed daily, and time of development in days for first and second instar larvae, propupae, and pupae were recorded for each individual thrips reared at each experimental temperature. Bailey [4] provided excellent illustrations of preimaginal and adult C. fasciatus life stages, and these were used to identify transitions between life stages. Feeding thrips life stages (i.e., first and second instars, and adults) were moved to fresh Lima bean leaves as this food source deteriorated. Time between leaf changes varied and was temperature dependent.
Development time of preimaginal thrips life stages (i.e., eggs, larvae, propupae, and pupae) and longevity of resultant adult male and female C. fasciatus in days (referred to as G1 (see below)) and fecundity of mated G1 adult female and male thrips were quantified across nine experimental temperatures that fluctuated over the course of a 24 h period (see below). To determine fecundity under fluctuating temperature regimens, mated G1 female thrips and their male partners were moved every 24 h to fresh Lima bean leaves enclosed in labeled Munger cells until death. Males that died before their female partners were replaced with similarly reared males. A minimum of 20 pairs of adult male–female pairs of thrips were used for initiating experimental cohorts for each experimental temperature. Leaves exposed to individual ovipositing G1 females, and their male partners were labeled, maintained adaxial side down on saturated foam pads, and examined every 24 h for emergence of thrips larvae. The number of larvae (referred to as G2 (see below)) emerging from leaves over time were recorded and used as an estimate of fecundity for each female by temperature regimen. G2 larvae were individually isolated in Munger cells and reared to adulthood under their natal temperature regimen to determine development times and sex ratio of progeny produced by G1 females. G2 larvae from each experimental temperature regimen that reached adulthood were set up, and a minimum of 10 male–female pairs were maintained under their experimental natal temperature conditions. Progeny production from G2 male–female pairs were used to estimate average lifetime fecundity, the mean number of males and females produced, and average egg-to-adult development times across nine fluctuating temperature regimens (see below for details). G2 thrips used for experiments were set up and maintained in a manner identical to that described above for G1 thrips.
Fluctuating temperature profiles used in experiments were representative of the Central Valley where C. fasciatus were collected for use in experiments and from where the majority of navel oranges and mandarins likely to be contaminated with adult thrips were exported from. To produce nine different fluctuating temperature regimes, climate-controlled cabinets (plant growth chamber model PG034; Darwin Chambers, St. Louis, MO, USA) were programmed with ramping temperature increments oscillating over a 24 h cycle so that mean daily temperatures of 8, 10, 15, 20, 25, 30, 32, 35, and 37 °C were obtained (Table 1).

Table 1.
Fluctuating temperature profiles utilized for rearing Caliothrips fasciatus.
Incremental steps were based on the hourly temperature profiles of days with target average temperatures from five years (2014–2018 inclusive) of field-recorded data downloaded from CIMIS weather station 39 (Latitude: 36.597444; Longitude −119.50404), located in Parlier Fresno County [22,23,24] for details on hourly temperature data calculations to determine mean daily temperature over a 24 h period). Environmental chambers were maintained at 14:10 L:D at a light intensity of 100 μE m−2 s−1, and 50% RH across all temperature profiles. Target conditions were verified by HOBO Pro V2 Temperature/RH loggers programmed to record at 15 min intervals (Onset Computer Corp., Bourne, MA, USA).
2.3. Statistical Analyses of Preimaginal Developmental, Female Fecundity, and Offspring Sex Ratio Data across Fluctuating Temperature Regimens
All statistical results were generated using SAS [25]. Generalized linear mixed models (GLMMs) were employed to examine the relationship between temperature and development times of G1 C. fasciatus offspring. The PROC GLIMMIX procedure in SAS [25] was used for the analysis. The fixed effects included in the models were the fluctuating temperature profile (ranging from 8 to 35 °C, with no development observed at 37 °C (see Results section)), sex (male or female), and their interactions. Separate models were created for each developmental stage, including C. fasciatus eggs, larvae, propupae, pupae, combined eggs-to-adults, and adult longevity. To account for the potential lack of statistical independence, the nesting structure incorporated G1 individuals within parent identity and temperature profile. Poisson distributions were employed for all models, based on the variances of the response variables.
Similarly, GLMMs and the PROC GLIMMIX procedure in SAS [25] were used to investigate the impact of varying temperatures on the lifetime fecundity of G1 female C. fasciatus and the sex ratios of adult G2 progeny. The fluctuating temperature profile, excluding 37 °C (no development occurred at this temperature (see below)), was considered as a fixed effect. The G2 C. fasciatus egg count, estimated from numbers of emerged larvae, followed a negative binomial distribution, whereas the G2 female-to-male sex ratio was modeled using a binomial distribution, based on the variances of the response variables. Additionally, the models included G1 female longevity and its interaction with temperature as covariates to account for their potential influence on the outcomes. To address the possible lack of statistical independence within G2 progeny from individual G1 female/male parent pairs, a nested structure was implemented. This involved considering the identity of the leaves exposed to each ovipositing G1 female and her male partner within the parent identity and temperature profile. By incorporating shared characteristics and influences within the same parent and temperature conditions, this nested approach ensured analyses were accurate.
Similar to the analysis of G1 development and adult longevity times, a GLMM was utilized to investigate the correlation between temperature and egg-to-adult development times of G2 C. fasciatus offspring. The PROC GLIMMIX procedure in SAS [25] was employed for this analysis. The fixed effects considered in the model were the fluctuating temperature profiles (ranging from 8 to 35 °C, with no development observed at 37 °C as stated in the Results section), sexes, and their interactions. To address potential lack of statistical independence, a nested structure was implemented for G2 individuals within G1 parent identity and temperature profile. The model utilized a Poisson distribution based on the variance of the response variable.
In all GLMMs, temperature was treated as a categorical rather than continuous variable as it exhibited a highly nonlinear relationship with each variable considered for analysis [26,27]. Pairwise comparisons for significant main effects were made using least-squared means option (SAS GLIMMIX procedure and LSMEANS statement). The Tukey–Kramer method was applied to adjust the pairwise comparisons for multiple comparisons, and a significance level of 0.05 was used for all comparisons.
Notably, no significant differences in egg-to-adult development times were observed between G1 females and G1 males, or G2 females and G2 males (see Results section; Table 2, Table 3, Table 4 and Table 5), and values were pooled by generation (i.e., G1 (pooled G1 male and G1 female data) and G2 (pooled G1 male and G1 female data)) for subsequent model fitting.
Table 2.
Results of generalized linear mixed models examining the effects of sexes, temperatures (i.e., fluctuating temperature regimens that averaged 8, 10, 15, 20, 25, 30, 32, or 35 °C over a 24 h period), and their interactions on development times of first-generation (i.e., G1) Caliothrips fasciatus eggs (A), first and second instar larvae (B, C), propupae (D), pupae (E), egg-to-adult (F), and adults (G), reared under fluctuating temperature regimes.
Table 3.
Mean development times (mean days ± SE) of first-generation (G1) Caliothrips fasciatus eggs, first and second instar larvae, propupae, pupae, combined egg-to-adult, and adult longevity reared under eight fluctuating temperature regimes that averaged 8, 10, 15, 20, 25, 30, 32, or 35 °C, over a 24 h period.
Table 4.
Mean estimated lifetime fecundity, and numbers of emerged second-generation (G2) C. fasciatus males and females (±SE), produced by first generation (G1) female Caliothrips fasciatus reared under eight fluctuating temperature profiles that averaged 8, 10, 15, 20, 25, 30, 32, or 35 °C over a 24 h period.
Table 5.
Mean egg-to-adult development time in days (± SE) for second-generation (G2) Caliothrips fasciatus females and males reared under eight fluctuating temperature profiles that averaged 8, 10, 15, 20, 25, 30, 32, or 35 °C over a 24 h period.
2.4. Fitting of Models to Temperature-Driven Caliothrips fasciatus Development Data
One linear (i.e., Ordinary Linear [28]) and seven nonlinear regression functions (i.e., Beta [29,30,31], Brière-2 [32], Lactin-2 [33,34], Lobry-Rosso-Flandrois [35,36], Performance-2 [37,38], Ratkowsky [39], and Weibull [40]) were fit to datasets to test for a relationship between fluctuating temperature profiles (see [23,24]). Models were fit only to data spanning 8 to 35 °C, as no C. fasciatus larvae emerged from eggs oviposited at 37 °C, and this temperature profile was omitted from regression analyses (see Table 6 for model equations and parameter definitions) and egg-to-adult development rates (1/d), which were the reciprocals of mean egg-to-adult development times (i.e., days−1) of G1 and G2 C. fasciatus (i.e., pooled male and female data). Of the seven nonlinear models evaluated, the Beta and Weibull models failed to fit development rate data for C. fasciatus, regardless of thrips generation, and were removed from further analyses.
Table 6.
Mathematical model equations, model parameters, parameter estimates, and goodness-of-fit metrics for six functions describing the relationship between temperature and development rates (Dr) of first-generation (G1) and second-generation (G2) Caliothrips fasciatus (male and female data combined) reared under eight fluctuating temperature profiles that averaged 8, 10, 15, 20, 25, 30, 32, or 35 °C over a 24 h period.
Linear regression [28] and a PROC REG procedure in SAS [25] were used to calculate degree days required for egg-to-adult developmental completions of G1 and G2 C. fasciatus (i.e., K; pooled male and female data) under fluctuating temperatures and the theoretical lower development thresholds (i.e., Tmin). The reciprocal of the line slope quantified parameter K, and Tmin was calculated by solving for y = 0 [28]. Linear model goodness-of-fit was assessed with adjusted R-squared (R2adj), where R2adj > 0.9 indicates a good fit to the data (Table 4; [28]). Cook’s D metric was used to identify and remove influential outliers from analyses (i.e., development rate at 35 °C for both G1 and G2 thrips), where observations above a specified threshold value of D > 4/number of observations were classified as influential [41].
Egg-to-adult development rate data of G1 and G2 C. fasciatus and PROC NLIN procedure in SAS [25] were used to parameterize nonlinear models [42]. All five nonlinear models tested have four parameters and thus the same degrees of freedom [df] [43,44]. Therefore, nonlinear model goodness-of-fit was assessed with residual sum of squares (i.e., RSS):
where n represents the number of observations, and yi and ŷi denote the observed and expected development rates at the i-th temperature, respectively. Nonlinear models with smallest RSS values indicated a better fit to the data [23,24,31,43,45]. R2adj was not used to assess goodness of fit for nonlinear models, as R2adj inaccurately describes the validity of a nonlinear fit to data [46].
All temperature-based development models were fitted with development rate as the response variable as data satisfied homogeneity assumptions [47]. No additional transformations of the Brière-2, Lactin-2, LRF, and Performance-2 expressions were necessary, and the least squares estimation was applied to each model in its untransformed form [47]. In the square-root (i.e., Ratkowsky) model, however, both sides of the equation were squared, so the left-hand side of the equation was the development rate rather than the square root of the rate [42]. All model outputs were graphed in SigmaPlot [48].
3. Results
3.1. Effects of Temperature on G1 Thrips Development Times
All G1 C. fasciatus completed development under experimental temperature profiles that ranged from 8 to 35 °C (Table 2, Table 3, Table 4 and Table 5). Mean development times of G1 C. fasciatus eggs, larvae, propupae, pupae, and combined egg-to-adult differed with temperature (temperature effects: p < 0.02 for all response variables; Table 2 and Table 3), but not with sex (sex effects: p > 0.36 for all response variables; Table 2), and their interactions were insignificant (sex × temperature interaction effects: p > 0.85 for all response variables; Table 2). Development times of G1 C. fasciatus eggs, larvae, propupae, pupae, and combined egg-to-adult decreased with increasing temperature, irrespective of thrips sex (Table 3).
3.2. Effects of Temperature on G1 Thrips Longevity Times, G1 Female Fecundity Rates, and G2 Offspring Sex Ratios
Mean longevity times of G1 C. fasciatus males and females differed with temperature (temperature effect; Table 2 and Table 3), but not with sex (i.e., sex effect; Table 2) and their interaction was insignificant (i.e., sex × temperature effect; Table 2). Longevity for C. fasciatus males and females was shortest at 8, 32 and 35 °C (Table 3). The greatest longevity for adult C. fasciatus males and females was observed at 10 and 15 °C (Table 3). Mean lifetime fecundity rates for G1 C. fasciatus females differed with temperature (F = 22.45; df1 = 7, df2 = 1160; p < 0.0001), with the highest numbers of G2 C. fasciatus eggs being produced at 20 and 25 °C (Table 4). However, these fecundity rates did not show any significant variation with G1 female longevity (F = 1.28; df1 = 1, df2 = 1160; p = 0.23) or the interaction between sex and female longevity (F = 1.31; df1 = 7, df2 = 1160; p = 0.19). Moreover, the sex ratios of G2 offspring, representing the ratio of males to females, remained constant across different temperature conditions (F = 1.23; df1 = 7, df2 = 1022; p = 0.28), G1 female longevity (F = 1.09; df1 = 1, df2 = 1022; p = 0.31), and their interaction (F = 1.51; df1 = 7, df2 = 1022; p = 0.17).
3.3. Effects of Temperature on G2 Thrips Egg-to-Adult Development Times
Similar to their G1 parent thrips, all G2 C. fasciatus offspring individuals successfully completed their development under experimental temperature profiles ranging from 8 to 35 °C (Table 5). Mean egg-to-adult development times of G2 C. fasciatus differed with temperature (F = 185.29; df1 = 7, df2 = 2016; p < 0.0001; Table 5), but not with sex (F = 2.38; df1 = 1, df2 = 2016; p = 0.12; Table 5), and their interactions were insignificant (F = 1.05; df1 = 1, df2 = 2016; p = 0.29; Table 5). Egg-to-adult development times of G2 C. fasciatus decreased with increasing temperature, irrespective of thrips sex (Table 5).
3.4. Fitting Models to Temperature-Driven Development Data
The Ordinary Linear model had R2adj values of >0.98 for G1 and G2 C. fasciatus, indicating very good fit to datasets (Table 6). The regression line predicted lower developmental thresholds (i.e., Tmin) of 6.52 °C for G1 thrips (Table 6; Figure 1a) and 5.34 °C for G2 thrips (Table 6; Figure 1g), and the thermal requirements for development completion (i.e., K) were 370.37 and 384.61 degree days above these minimum threshold estimates for G1 and G2 C. fasciatus, respectively (Table 6; Figure 1a,g). All five nonlinear models exhibited good fits to observed data for G1 and G2 C. fasciatus, producing RSS values < 0.0001 (Table 6). Compared to the Brière-2, LRF, and Ratkowsky nonlinear equations, the Lactin-2 and Performance-2 models yielded higher RSS values for development completions of G1 and G2 C. fasciatus (Table 6), indicating slightly poorer fits to both datasets. Nevertheless, estimations of Topt (i.e., estimated optimal temperature for development) and Tmax (i.e., upper temperature limit for development) for G1 and G2 C. fasciatus were similar among models ranging from 31.34 to 32.52 °C (G1) and 31.19 to 31.92 °C (G2) for Topt, and 35.12 to 37.98 °C (G1) and 35.07 to 37.63 °C (G2) for Tmax, (Table 6; Figure 1b–f,h–l). Considerable divergences in model predictions were observed for values of Tmin (i.e., minimum temperature above which development occurs) for G1 and G2 C. fasciatus, which ranged from −4.37 to 6.52 °C for G1 and from –3.77 to 6.28 °C for G2 thrips (Table 6; Figure 1b–f,h–l).
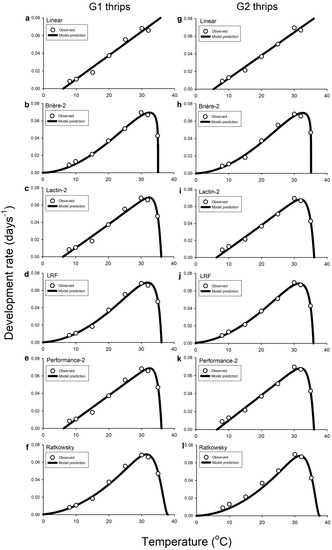
Figure 1.
Predicted rate of total development as a function of temperature for generation 1 (G1 (a–f)) and generation 2 (G2 (g–l)) of Caliothrips fasciatus (pooled males and females) at different eight fluctuating temperature profiles (i.e., 8, 10, 15, 20, 25, 30, 32, or 35 °C) using linear (a,g), Brière-2 (b,h), Lactin-2 (c,i), LRF (d,j), Performance-2 (e,k), and Ratkowsky (f,l) models. In all graphs, the ordinate is the rate of development (1/D, in days−1), and the abscissa is the temperature (°C). Open circles represent the average of recorded data in all graphs. In the linear regression (a,g), the last data values (i.e., 35 °C) for both the G1 and G2 Caliothrips fasciatus development times have been omitted because of deviations from a straight line.
4. Discussion
The main driver of critical life history functions for insects is temperature, which strongly influences development, survival, reproduction, and movement [49]. In this study, estimates of C. fasciatus pre-imaginal development times, adult longevity, and daily and lifetime fecundity were significantly affected by fluctuating temperature cycles that averaged 8, 10, 15, 20, 25, 30, 32, or 35 °C over a 24 h period (no development was observed at 37 °C). Non-linear model fitting indicated that Tmin, Topt, and Tmax may have laid within the following temperature ranges, 6.23–6.52, 31.19–32.52, and 35.07–37.98 °C, respectively. Tmin predictions from linear regression were in the range of 5.35–6.52 °C and were in agreement with estimates provided by Lactin-2, Brière-2, and Performance-2. Notable outliers with regard to Tmin estimates were negative values (i.e., <0 °C) returned by the Lobry-Rosso-Flandrois (LRF) and Ratkowsky models. Linear regression estimates predicted that 370.37–384.61 degree days above Tmin were required for C. fasciatus to complete egg-to-adult development.
With respect to Caliothrips spp., temperature affects population phenology [50,51], and, for C. fasciatus specifically, overwintering biology, host plant use, pestiferousness, and geographic distribution are influenced strongly by temperature [4,5,6,7]. In addition to C. fasciatus, at least two additional pest species of Caliothrips are recognized: C. indicus (Bagnall), a pest of peanut (Arachis hypogaea L.) [50], and C. phaseoli (Hood), a pest of bean (P. vulgaris) [51]. The effects of varying temperatures on the developmental rates and life history parameters for these two pest species, or other species of Caliothrips (excluding C. fasciatus), have not been investigated.
Bailey [4] made the first attempt to investigate the relationship between C. fasciatus preimaginal development rates, longevity, reproductive biology, and behavior, with constant temperature and humidity. Bailey’s [4] developmental time data for larvae, and propupae and pupae combined, at constants of 15.56, 21.11, 26.67, 32.22, and 37.78 °C, decreased consistently over these five temperatures and followed a linear pattern. These data [4] were not subjected to any statistical or model fitting analyses. As part of this study, analysis of Bailey’s [4] data for these five temperatures was performed using linear regression. Analyses provided estimates of Tmin = 12.15 °C (cf. 5.35–6.52 °C from this study) and a degree-day accumulation of 208.33 (cf. 196.08 from this study) (see Supplementary Materials, Table S1).
This study has expanded considerably on Bailey’s [4] original temperature studies by assessing the effects of nine fluctuating temperatures that averaged 8, 10, 15, 20, 25, 30, 32, 35, and 37 °C (no development was observed at 37 °C) over a 24 h period on development and survivorship rates, fecundities, and sex ratios of C. fasciatus. Work presented here has provided estimates of Tmin (i.e., 5.35–6.52 °C), Topt (i.e., 31.19–32.52 °C), and Tmax (i.e., 35.07–37.98 °C), which provided important baseline data for assessing effects of accumulative cold stress on C. fasciatus fitness. The non-linear relationship between temperature and insect development rates at lower and upper temperature extremes that fluctuate could affect life history traits, and expected outcomes could diverge from those predicted from constant temperature studies [52]. For example, fluctuating temperatures that remained within tolerable temperature ranges could improve fitness, or, alternatively, negative impacts could result from stress accumulations of compounds during successive exposures to stress-inducing temperatures at the lower and upper extremes of the temperature profiles under investigation (i.e., excessive cold or heat exposure) [52]. Therefore, understanding the effects of fluctuating temperatures on C. fasciatus is necessary for predictions of insect performances in the field, and, arguably, perhaps most importantly, during prolonged periods of fluctuating low temperatures over winter, when thrips are hibernating inside navel oranges.
One putative explanation for the failure of C. fasciatus to establish outside of its native range is the accumulative cold stress hypothesis, which postulates that the fitness of adult thrips is reduced due to the negative aggregative effects of low temperature while overwintering in the navels of oranges in orchards prior to harvest. This stress is further amplified by low refrigerated temperatures experienced during shipping to export destinations [2]. With respect to C. fasciatus, Tmin predictions from linear and non-linear analyses completed in this study ranged from ~5 to 7 °C (Tmin estimates from non-linear models ranging from −4.37 to −1.48 °C likely had no biological accuracy (Table 6)) and could be a potential starting temperature range for manipulative field and laboratory experiments assessing the impacts of varying durations of accumulative cold stress on the fitness of adult thrips and the subsequent effects on invasion potential.
In regard to invasive insect pests, the likelihood of invasion and establishment in new areas is affected by the receiving environment, which needs to have a favorable year-round climate and habitat to sustain permanent populations [53]. Meta-analyses indicate that invasive insect species, when compared to non-invasive congeners from similar source-areas, differ significantly with respect to one key thermal requirement, the lower developmental threshold (Tmin), which tends to be higher for invasive species when compared to congeneric species not recorded outside of their native range [54]. Additionally, for some species of thrips, there is a negative relationship between Tmin and degree days required for development, such that degree days needed to complete development decline as Tmin increases [55]. These findings suggest that low temperatures may, in part, prevent some insect species, like pest thrips, from successfully invading new areas, and species from warmer areas closer to the tropics with higher Tmin values and lower degree day requirements to complete development may have greater establishment and invasion potentials following introduction into suitable new areas [54,55]. The potential application of these findings [54,55] for assessing the invasion threat posed by C. fasciatus warrants investigation.
The genus Caliothrips is represented by 23 extant species, of which one, C. insularis, originally described from the tropical Caribbean Islands of St. Croix and Cuba and recorded from Venezuela and Brazil and throughout the Caribbean to Florida [56], has been recorded outside of this presumptive native range in Mauritius in the Indian Ocean [56] and in China [57]. Horticultural trade in live plants is the suspected conduit for moving C. insularis into new areas [57]. Caliothrips insularis is polyphagous, having been collected on various species of grasses, Cymbogon sp., Cyperus esculentus L., Lilium sp., Saccharum officinarum L., Setaria barbata (Lam.), and Zea mays L. [53,55]. Caliothrips fasciatus is similarly polyphagous and has been intercepted numerous times over long periods of time (i.e., decades) in shipments of contaminated citrus originating from California in countries (e.g., New Zealand and Australia) at times of the year where the receiving environment would be considered hospitable for surviving thrips [7]. Agricultural exports, like fresh fruit, are recognized as important conduits for movement of invasive insect pests into new areas [58,59]. Yet, despite high levels of propagule pressure over time, C. fasciatus, unlike C. insularis, has failed to establish outside of its presumptive native range. In this instance, determination of Tmin and degree day requirements for C. insularis would be useful for comparison to C. fasciatus to ascertain if the invasion potential of C. fasciatus would be considered “low” (i.e., lower Tmin and higher degree day accumulation for development) when compared to C. insularis.
Another potential factor affecting the invasion potential of C. fasciatus is its unusual reproductive biology and the probable existence of cryptic species, one of which is infected with Wolbachia, an endosymbiont associated with reproductive incompatibility [8]. Populations of C. fasciatus from different geographic source areas are less likely to interbreed and exhibit high levels of pre- and post-mating isolation and outbreeding depression [8]. This situation could exist if imported fruits from different geographic location areas are contaminated with C. fasciatus from populations that are reproductively incompatible, and these fruits are commingled prior to packing and shipping. Additionally, C. fasciatus is arrhenotokous, and unfertilized eggs produce male offspring. Females need to mate continuously to produce daughters from fertilized eggs [4]. In the absence of males, mated females deplete sperm reserves and produce only male offspring. Sperm depletion may occur within 10 days of mating and subsequent oviposition of fertilized eggs [4]. Unmated female C. fasciatus, when isolated individually, fail to produce male offspring, but, when present in groups of five, male offspring are produced by the majority (i.e., 90%) of female groupings [8]. The necessity for a quorum of unmated females to be present together to stimulate oviposition of unfertilized eggs for production of male offspring, which may be able to mate with the foundress population, is an Allee effect and, potentially, a significant barrier to establishment.
5. Conclusions
In conclusion, this study is the first to assess the effects of fluctuating temperatures on the development and reproductive biology of C. fasciatus, a regular contaminant of fresh citrus fruit exported from California. This thrips has failed to establish outside of its native range, and there are at least two possibilities exist to explain this observation: the accumulation of cold stress and reproductive barriers, neither of which are mutually exclusive, and both of which could affect the fitness of adults that survive the harvesting and export processes. Deeper insight into lack of invasiveness of C. fasciatus is possible through additional manipulative studies investigating the effects of stress from low temperature exposures. The accumulative cold stress hypothesis is amenable to laboratory-based experimentation, and the results could be verified by conducting fitness evaluation studies with live adult male and female C. fasciatus detected during quarantine inspections of fresh fruit imports at ports of entry.
Supplementary Materials
The following supporting information, can be downloaded at: https://www.mdpi.com/article/10.3390/insects14070641/s1. Table S1. Estimated parameters and R2adj values of the linear model for describing the relationship between development rate (Dr) and temperature for immature stages (i.e., larvae and, propupae and pupae combined) of Caliothrips fasciatus (male and female data combined) under constant (i.e., 15.56, 21.11, 26.67, 32.22, and 37.78 °C).
Author Contributions
Conceptualization, M.S.H.; Methodology, M.S.H., I.M., and R.A.; Software, I.M.; Validation, M.S.H., I.M., and R.A.; Formal Analysis, I.M.; Investigation, I.M. and R.A.; Resources, M.S.H.; Data Curation, I.M. and R.A.; Writing—Original Draft Preparation, M.S.H.; Writing—Review and Editing, M.S.H. and I.M.; Visualization, M.S.H. and I.M.; Supervision, M.S.H. and I.M.; Project Administration, M.S.H.; Funding Acquisition, M.S.H. All authors have read and agreed to the published version of the manuscript.
Funding
Funding for this research was provided, in part, by Citrus Research Board Project 5500-210 and USDA-TASC Grant 17-5050-010F.
Data Availability Statement
Data are available upon request.
Conflicts of Interest
The authors declare no conflict of interest.
References
- Mound, L.A.; Hoddle, M.S.; Hastings, A. Thysanoptera Californica—Thrips of California. Lucidcentral.org, Identic Pty Ltd., Queensland, Australia. 2019. Available online: https://keys.lucidcentral.org/keys/v3/thrips_of_california_2019//index.html (accessed on 5 June 2023).
- Hoddle, M.S. North American bean thrips—A perennial export problem for California citrus growers. Citrograph 2020, 11, 40–43. [Google Scholar]
- Mound, L.A.; Zhang, H.; Bei, Y. Caliothrips tongi n. sp. (Thysanoptera: Thripidae) from China, and a dubious record of North American bean thrips. Zootaxa 2011, 2736, 57–62. [Google Scholar] [CrossRef]
- Bailey, S.F. The biology of the bean thrips. Hilgardia 1933, 7, 467–522. [Google Scholar] [CrossRef][Green Version]
- Bailey, S.F. The Bean Thrips. In Monograph Bulletin 609; University of California Experiment Station: Berkeley, CA, USA, 1937. [Google Scholar]
- Bailey, S.F. Thrips of economic importance in California. In Circular of the University of California Berkeley Agricultural Experiment Station 346; University of California Experiment Station: Berkeley, CA, USA, 1938. [Google Scholar]
- Hoddle, M.S.; Stosic, C.D.; Mound, L.A. Populations of North American bean thrips, Caliothrips fasciatus (Pergande) (Thysanoptera: Thripidae: Panchaetothripinae) not detected in Australia. Aust. J. Entomol. 2006, 45, 122–129. [Google Scholar] [CrossRef]
- Rugman-Jones, P.F.; Hoddle, M.S.; Amrich, R.; Heraty, J.M.; Stouthamer-Ingel, C.E.; Stouthamer, R. Phylogeographic structure, outbreeding depression, and reluctant virgin oviposition in bean thrips, Caliothrips fasciatus (Pergande) (Thysanoptera: Thripidae), in California. Bull. Entomol. Res. 2012, 102, 698–709. [Google Scholar] [CrossRef]
- Harman, J.A.; Mao, C.X.; Robinson, L.J.; Morse, J.G. Evaluation of two non-destructive sampling methods for bean thrips (Thysanoptera: Thripidae) detection in navel oranges. Crop Prot. 2007, 26, 1747–1754. [Google Scholar] [CrossRef]
- Harman, J.A.; Mao, C.X.; Morse, J.G. Selection of colour sticky traps for monitoring adult bean thrips, Caliothrips fasciatus (Thysanoptera: Thripidae). Pest Manag. Sci. 2007, 63, 201–216. [Google Scholar] [CrossRef]
- Bikoba, V.N.; Pupin, F.; Biasi, W.V.; Rutaganira, F.U.; Mitcham, E.J. Use of ethyl formate fumigation to control adult bean thrips in navel oranges. J. Econ. Entomol. 2019, 112, 591–596. [Google Scholar] [CrossRef]
- Walse, S.S.; Jimenez, L.R. Postharvest fumigation of fresh citrus with cylinderized phosphine to control bean thrips (Thysanoptera: Thripidae). Horticulturae 2021, 7, 134. [Google Scholar] [CrossRef]
- USDA-NAS. Citrus Fruits 2022 Summary. Available online: https://ccqc.org/wp-content/uploads/USDA-NASS-Citrus-Fruits-2022-Summary-090822.pdf (accessed on 5 June 2023).
- Anon. US Citrus Exports—Top Markets for Oranges. Available online: https://ccqc.org/wp-content/uploads/2021-Top-Export-Markets-for-Citrus-QTY-VAL.pdf (accessed on 5 June 2023).
- Williamson, M. Biological Invasions; Chapman and Hall: London, UK, 1997; p. 40. [Google Scholar]
- Seebens, H.; Briski, E.; Ghabooli, S.; Shiganova, T.; MacIsaac, H.J.; Blasius, B. Non-native species spread in a complex network: The interaction of global transport and local population dynamics determines invasion success. Proc. R. Soc. B 2019, 286, 20190036. [Google Scholar] [CrossRef]
- Cassey, P.; Delean, S.; Lockwood, J.L.; Sadowski, J.S.; Blackburn, T.M. Dissecting the null model for biological invasions: A meta-analysis of the propagule pressure effect. PLoS Biol. 2018, 16, e2005987. [Google Scholar] [CrossRef] [PubMed]
- Turner, R.M.; Brockerhoff, E.G.; Bertelsmeier, C.; Blake, R.E.; Caton, B.; James, A.; MacLeod, A.; Nahrung, H.F.; Pawson, S.M.; Plank, M.J.; et al. Worldwide border interceptions provide a window into human-mediated global insect movement. Ecol. Appl. 2021, 31, e02412. [Google Scholar] [CrossRef] [PubMed]
- CDFA. California Citrus Acreage Report. 2022. Available online: https://www.nass.usda.gov/Statistics_by_State/California/Publications/Specialty_and_Other_Releases/Citrus/Acreage/202208citac.pdf (accessed on 7 March 2023).
- Munger, F. A method for rearing citrus thrips in the laboratory. J. Econ. Entomol. 1942, 35, 373–375. [Google Scholar] [CrossRef]
- Hoddle, M.S. Developmental and reproductive biology of Scirtothrips perseae (Thysanoptera: Thripidae): A new avocado pest in California. Bull. Entomol. Res. 2002, 92, 279–285. [Google Scholar] [CrossRef]
- [CIMIS] California Irrigation Management Information System. California Department of Water Resources’ California Irrigation Management Information System. State of California, Sacramento, CA. Available online: http://www.cimis.water.ca.gov (accessed on 5 June 2023).
- McCalla, K.A.; Keçeci, M.; Milosavljević, I.; Ratkowsky, D.A.; Hoddle, M.S. The influence of temperature variation on life history parameters and thermal performance curves of Tamarixia radiata (Hymenoptera: Eulophidae), a parasitoid of the Asian citrus psyllid (Hemiptera: Liviidae). J. Econ. Entomol. 2019, 112, 1560–1567. [Google Scholar] [CrossRef]
- Milosavljević, I.; McCalla, K.A.; Ratkowsky, D.A.; Hoddle, M.S. Effects of constant and fluctuating temperatures on development rates and longevity of Diaphorencyrtus aligarhensis (Hymenoptera: Eulophidae). J. Econ. Entomol. 2019, 112, 1062–1072. [Google Scholar] [CrossRef]
- SAS. Statistical Analysis Software, Users’ Guide Statistics Version 9.4; SAS Institute Inc.: Cary, NC, USA, 2013.
- Streiner, D.L. Breaking up is hard to do: The heartbreak of dichotomizing continuous data. Can. J. Psychiatry 2002, 47, 262–266. [Google Scholar] [CrossRef] [PubMed]
- Pasta, D. Learning when to be discrete: Continuous vs. categorical predictors. SAS Glob. Forum. Pap. 2009, 248, 1–10. [Google Scholar]
- Campbell, A.; Frazer, B.D.; Gilbert, N.; Gutierrez, A.P.; Mackauer, M. Temperature requirements of some aphids and their parasites. J. Appl. Ecol. 1974, 11, 431–438. [Google Scholar] [CrossRef]
- Yin, X.; Goudriaan, J.; Lantinga, E.A.; Vos, J.; Spiertz, H.J. A flexible sigmoid function of determinate growth. Ann. Bot. 2003, 91, 361–371. [Google Scholar] [CrossRef]
- Auzanneau, J.; Huyghe, C.; Escobar-Gutiérrez, A.J.; Julier, B.; Gastal, F.; Barre, P. Association study between the gibberellic acid insensitive gene and leaf length in a Lolium perenne L. synthetic variety. BMC Plant Biol. 2011, 11, 183. [Google Scholar] [CrossRef] [PubMed]
- Shi, P.; Reddy, J.G.V.; Chen, L.; Ge, F. Comparison of thermal performance equations in describing temperature-dependent developmental rates of insects: (I) empirical models. Ann. Entomol. Soc. Am. 2015, 109, 211–215. [Google Scholar] [CrossRef]
- Brière, J.F.; Pracros, P.; Le Roux, A.Y.; Pierre, J.S. A novel rate model of temperature-dependent development for arthropods. Environ. Entomol. 1999, 28, 22–29. [Google Scholar] [CrossRef]
- Logan, J.A.; Wolkind, D.J.; Hoyt, S.C.; Tanigoshi, L.K. An analytic model for description of temperature dependent rate phenomena in arthropods. Environ. Entomol. 1976, 5, 1133–1140. [Google Scholar] [CrossRef]
- Lactin, D.J.; Holliday, N.J.; Johnson, D.L.; Craigen, R. Improved rate model of temperature-dependent development by arthropods. Environ. Entomol. 1995, 24, 68–75. [Google Scholar] [CrossRef]
- Lobry, J.R.; Rosso, L.; Flandrois, J.P. A FORTRAN subroutine for the determination of parameter confidence limits in non-linear models. Binary 1991, 3, 86–93. [Google Scholar]
- Rosso, L.; Lobry, J.R.; Flandrois, J.P. An unexpected correlation between cardinal temperatures of microbial growth highlighted by a new model. J. Theor. Biol. 1993, 162, 447–463. [Google Scholar] [CrossRef]
- Shi, P.; Ge, F.; Sun, Y.; Chen, C. A simple model for describing the effect of temperature on insect developmental rate. J. Asia Pac. Entomol. 2011, 14, 15–20. [Google Scholar] [CrossRef]
- Wang, L.; Shi, P.; Chen, C.; Xue, F. Effect of temperature on the development of Laodelphax striatellus (Homoptera: Delphacidae). J. Econ. Entomol. 2013, 106, 107–114. [Google Scholar] [CrossRef]
- Ratkowsky, D.A.; Lowry, R.K.; McMeekin, T.A.; Stokes, A.N.; Chandler, R. Model for bacterial culture growth rate throughout the entire biokinetic temperature range. J. Bacteriol. 1983, 154, 1222–1226. [Google Scholar] [CrossRef]
- Angilletta, M.J., Jr. Estimating and comparing thermal performance curves. J. Therm. Biol. 2006, 31, 541–545. [Google Scholar] [CrossRef]
- Bollen, K.A.; Jackman, R.W. Regression diagnostics: An expository treatment of outliers and influential cases. Mod. Methods Data Anal. 1990, 13, 257–291. [Google Scholar] [CrossRef]
- Shi, P.; Ge, F. A comparison of different thermal performance functions describing temperature-dependent development rates. J. Therm. Biol. 2010, 35, 225–231. [Google Scholar] [CrossRef]
- Ratkowsky, D.A.; Reddy, G.V. Empirical model with excellent statistical properties for describing temperature-dependent developmental rates of insects and mites. Ann. Entomol. Soc. Am. 2017, 110, 302–309. [Google Scholar] [CrossRef]
- Mirhosseini, M.; Fathipour, A.Y.; Reddy, G.V. Arthropod development’s response to temperature: A review and new software for modeling. Ann. Entomol. Soc. Am. 2017, 110, 507–520. [Google Scholar] [CrossRef]
- Milosavljević, I.; McCalla, K.A.; Morgan, D.J.W.; Hoddle, M.S. The effects of constant and fluctuating temperatures on development of Diaphorina citri (Hemiptera: Liviidae), the Asian citrus psyllid. J. Econ. Entomol. 2020, 113, 633–645. [Google Scholar] [CrossRef]
- Spiess, A.N.; Neumeyer, N. An evaluation of R2 as an inadequate measure for nonlinear models in pharmacological and biochemical research: A Monte Carlo approach. BMC Pharmacol. 2010, 10, 6. [Google Scholar] [CrossRef] [PubMed]
- Ratkowsky, D.A. Model Fitting and Uncertainty. In Modeling Microbial Responses in Food; McKellar, R.C., Lu, X., Eds.; CRC Press: Boca Raton, FL, USA, 2004; pp. 151–196. [Google Scholar]
- SigmaPlot, Version 12.3; Systat Software, Inc.: San Jose, CA, USA, 2013.
- Rebaudo, F.; Rabhi, V.-B. Modeling temperature-dependent development rate and phenology in insects: Review of major developments, challenges, and future directions. Entomol. Exp. Appl. 2018, 166, 607–617. [Google Scholar] [CrossRef]
- Prasad, T.V.; Nandogopal, V.; Gedia, M.V. Seasonal abundance of sesbania thrips, Caliothrips indicus Bagnall (sic) in groundnut. J. Agrometerol. 2008, 10, 211–214. [Google Scholar]
- Boica, A.L.; Costa, E.N.; Chiorato, A.F. Infestation of Caliothrips phaseoli (Thysanoptera: Thripidae) on bean cultivars grown in winter, rainy, and dry seasons in Brazil. Environ. Entomol. 2015, 44, 1108–1115. [Google Scholar]
- Tobin, P.C.; Robient, C. 2022. Advances in understanding and predicting the spread of invading insect populations. Curr. Opin. Insect Sci. 2022, 54, 100985. [Google Scholar] [CrossRef]
- Jarošik, V.; Kenis, M.; Honĕk, A.; Skuhrovec, J.; Pyšek, P. Invasive insects differ from non-invasive in their thermal requirements. PLoS ONE 2015, 10, e0131072. [Google Scholar] [CrossRef] [PubMed]
- Stacey, D.A.; Fellowes, M.D.E. Temperature and development rate of thrips: Evidence for a constraint on local adaptation? Eur. J. Entomol. 2002, 99, 399–404. [Google Scholar] [CrossRef]
- Colinet, H.; Sinclair, B.J.; Vernon, P.; Renault, D. Insects in fluctuating thermal environments. Ann. Rev. Entomol. 2015, 60, 123–140. [Google Scholar] [CrossRef] [PubMed]
- Nakahara, S. Two new species of Caliothrips (Thysanoptera: Thripidae) and a key to Nearctic species. J. N. Y. Entomol. Soc. 1991, 99, 97–103. [Google Scholar]
- Wang, Z.; Mound, L.; Mao, R.; Tong, X. Two new synonyms among Panchaetothripinae (Thysanoptera: Thripidae) with three species newly recorded from China. Zootaxa 2022, 5190, 275–285. [Google Scholar] [CrossRef]
- Lu, G.; Zhao, Z.; Pan, X. Potential pest invasion risk posed by international sweet cherry trade. Food Energy Secur. 2021, 10, e257. [Google Scholar] [CrossRef]
- Paini, D.R.; Sheppard, A.W.; Cook, D.C.; De Barro, P.J.; Worner, S.P.; Thomas, M.B. Global threat to agriculture from invasive species. Proc. Nat. Acad. Sci. USA 2016, 113, 7575–7579. [Google Scholar] [CrossRef]

Disclaimer/Publisher’s Note: The statements, opinions and data contained in all publications are solely those of the individual author(s) and contributor(s) and not of MDPI and/or the editor(s). MDPI and/or the editor(s) disclaim responsibility for any injury to people or property resulting from any ideas, methods, instructions or products referred to in the content. |
© 2023 by the authors. Licensee MDPI, Basel, Switzerland. This article is an open access article distributed under the terms and conditions of the Creative Commons Attribution (CC BY) license (https://creativecommons.org/licenses/by/4.0/).