
Divergent Heat Stress Responses in Bactrocera tryoni and Ceratitis capitata


Abstract
:Simple Summary
Abstract
1. Introduction
2. Materials and Methods
2.1. Fruit Fly Colony
2.2. Heat Bioassays
2.3. RNA Extraction and cDNA Library Construction
2.4. Barcoding and Sequencing
2.5. RNA Sequencing Data Analysis
3. Results
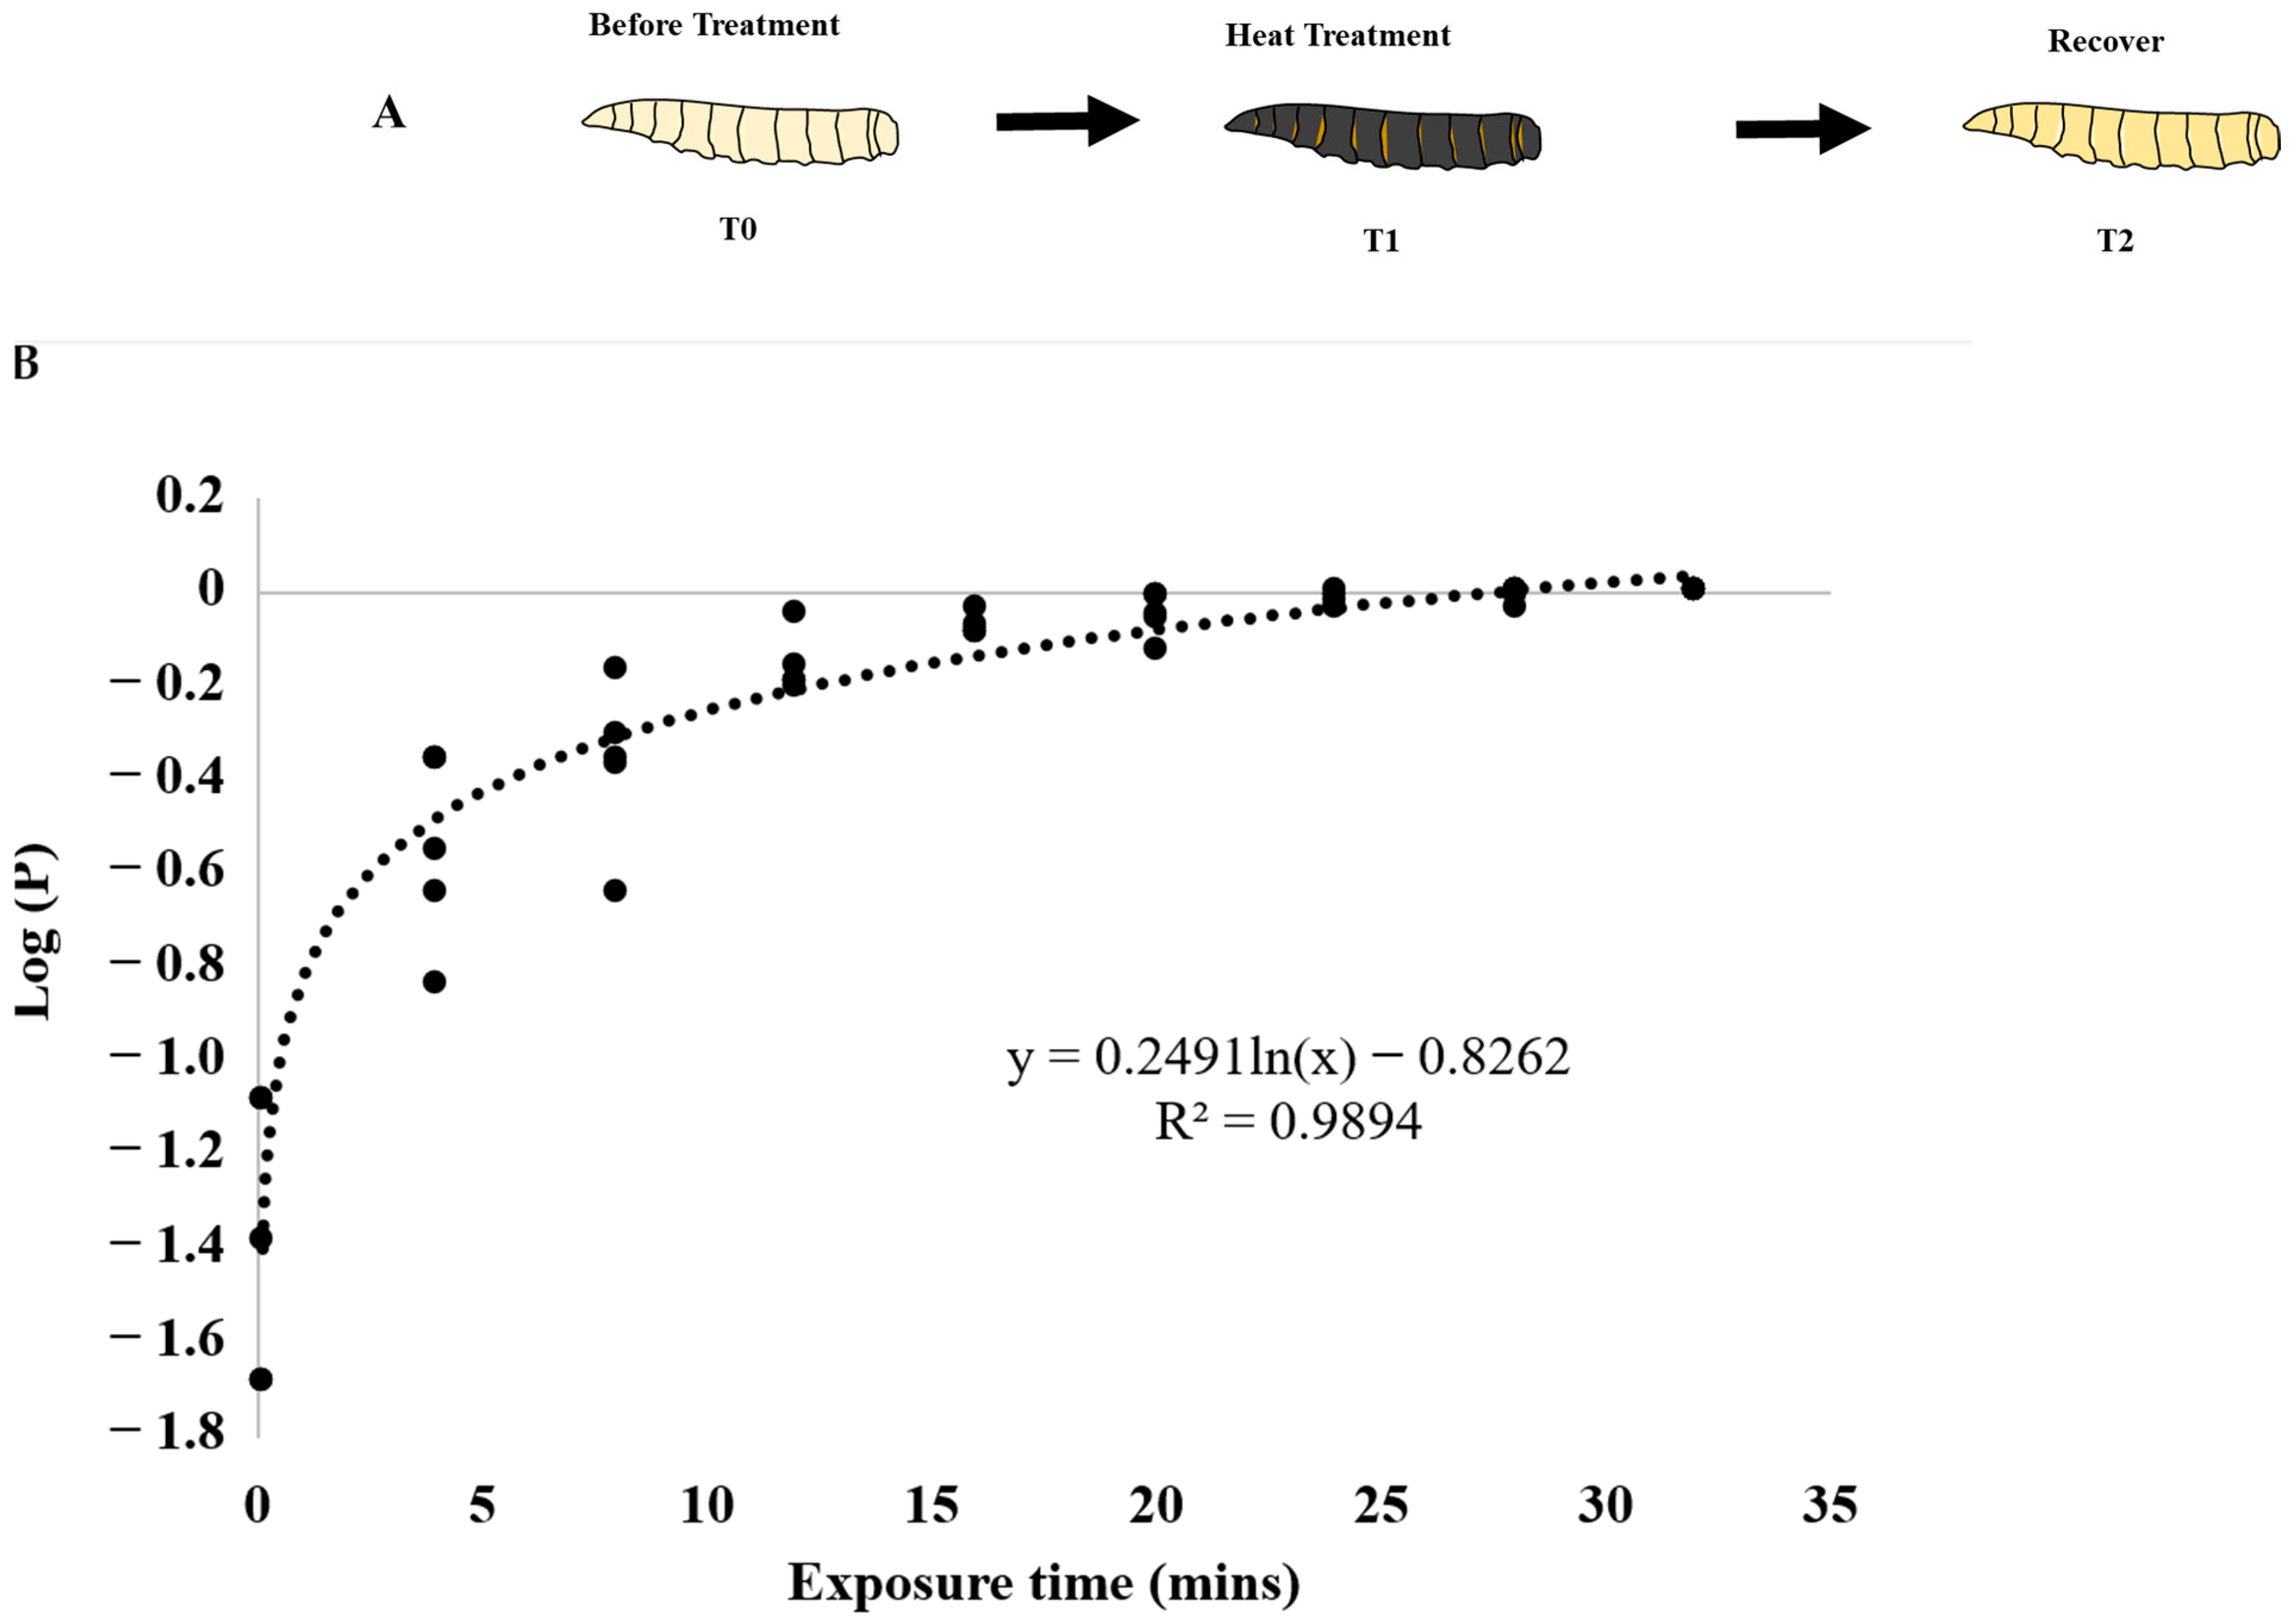
3.1. Heat Bioassays
3.2. Expression Analysis
3.3. Differentially Expressed Genes between Qfly and Medfly after Heat Treatments
3.4. Heat Shock Proteins (HSPs)
4. Discussion
Supplementary Materials
Author Contributions
Funding
Data Availability Statement
Acknowledgments
Conflicts of Interest
References
- Garcia, F.R.M.; Ovruski, S.M.; Suarez, L.; Cancino, J.; Liburd, O.E. Biological Control of Tephritid Fruit Flies in the Americas and Hawaii: A Review of the Use of Parasitoids and Predators. Insects 2020, 11, 662. [Google Scholar] [CrossRef] [PubMed]
- Mutamiswa, R.; Nyamukondiwa, C.; Chikowore, G.; Chidawanyika, F. Overview of oriental fruit fly, Bactrocera dorsalis (Hendel) (Diptera: Tephritidae) in Africa: From invasion, bio-ecology to sustainable management. Crop Prot. 2021, 141, 105492. [Google Scholar] [CrossRef]
- White, I.M.; Elson-Harris, M. Fruit Flies of Economic Significance: Their Identification and Bionomics; CAB International: Wallingford, UK, 1992; p. 601. [Google Scholar]
- Raphael, K.A.; Whyard, S.; Shearman, D.; An, X.; Frommer, M. Bactrocera tryoni and closely related pest tephritids--molecular analysis and prospects for transgenic control strategies. Insect Biochem. Mol. Biol. 2004, 34, 167–176. [Google Scholar] [CrossRef] [PubMed]
- Kean, J.M.; Manoukis, N.C.; Dominiak, B.C. Review of surveillance systems for tephritid fruit fly threats in Australia, New Zealand, and the United States. J. Econ. Entomol. 2024, 117, 8–23. [Google Scholar] [CrossRef]
- Bourtzis, K.; Vreysen, M.J.B. Sterile Insect Technique (SIT) and Its Applications. Insects 2021, 12, 638. [Google Scholar] [CrossRef] [PubMed]
- Al-Behadili, F.J.M.; Agarwal, M.; Xu, W.; Ren, Y. Cold Responses of the Mediterranean Fruit Fly Ceratitis capitata Wiedemann (Diptera: Tephritidae) in Blueberry. Insects 2020, 11, 276. [Google Scholar] [CrossRef]
- Al-Behadili, F.J.M.; Agarwal, M.; Xu, W.; Ren, Y. Mediterranean Fruit Fly Ceratitis capitata (Diptera: Tephritidae) Eggs and Larvae Responses to a Low-Oxygen/High-Nitrogen Atmosphere. Insects 2020, 11, 802. [Google Scholar] [CrossRef]
- Follett, P.A. Phytosanitary Irradiation of Tephritid Fruit Flies. In Management of Fruit Flies in the Americas; Mello Garcia, F.R., Ed.; Springer International Publishing: Cham, Switzerland, 2024; pp. 143–165. [Google Scholar] [CrossRef]
- Al-Behadili, F.J.M.; Bilgi, V.; Li, J.; Wang, P.; Taniguchi, M.; Agarwal, M.; Ren, Y.; Xu, W. Cold Response of the Mediterranean Fruit Fly (Ceratitis capitata) on a Lab Diet. Insects 2019, 10, 48. [Google Scholar] [CrossRef]
- Broughton, S.; De Lima, C.P.F. Field evaluation of female attractants for monitoring Ceratitis capitata (Diptera:Tephritidae) under a range of climatic conditions and population levels in Western Australia. J. Econ. Entomol. 2002, 95, 507–512. [Google Scholar] [CrossRef]
- Dohino, T.; Hallman, G.J.; Grout, T.G.; Clarke, A.R.; Follett, P.A.; Cugala, D.R.; Tu, D.M.; Murdita, W.; Hernandez, E.; Pereira, R.; et al. Phytosanitary Treatments Against Bactrocera dorsalis (Diptera: Tephritidae): Current Situation and Future Prospects. J. Econ. Entomol. 2017, 110, 67–79. [Google Scholar] [CrossRef]
- Mahajan, P.V.; Caleb, O.J.; Singh, Z.; Watkins, C.B.; Geyer, M. Postharvest treatments of fresh produce. Philos. Trans. A Math. Phys. Eng. Sci. 2014, 372, 20130309. [Google Scholar] [CrossRef] [PubMed]
- Papanicolaou, A.; Schetelig, M.F.; Arensburger, P.; Atkinson, P.W.; Benoit, J.B.; Bourtzis, K.; Castanera, P.; Cavanaugh, J.P.; Chao, H.; Childers, C.; et al. The whole genome sequence of the Mediterranean fruit fly, Ceratitis capitata (Wiedemann), reveals insights into the biology and adaptive evolution of a highly invasive pest species. Genome Biol. 2016, 17, 192. [Google Scholar] [CrossRef] [PubMed]
- Wei, D.; Xu, H.Q.; Chen, D.; Zhang, S.Y.; Li, W.J.; Smagghe, G.; Wang, J.J. Genome-wide gene expression profiling of the melon fly, Zeugodacus cucurbitae, during thirteen life stages. Sci. Data 2020, 7, 45. [Google Scholar] [CrossRef]
- Popa-Baez, A.D.; Catullo, R.; Lee, S.F.; Yeap, H.L.; Mourant, R.G.; Frommer, M.; Sved, J.A.; Cameron, E.C.; Edwards, O.R.; Taylor, P.W.; et al. Genome-wide patterns of differentiation over space and time in the Queensland fruit fly. Sci. Rep. 2020, 10, 10788. [Google Scholar] [CrossRef]
- Anantanawat, K.; Papanicolaou, A.; Hill, K.; Xu, W. Molecular Response of the Mediterranean Fruit Fly (Diptera: Tephritidae) to Heat. J. Econ. Entomol. 2020, 113, 2495–2504. [Google Scholar] [CrossRef] [PubMed]
- Moadeli, T.; Taylor, P.W.; Ponton, F. High productivity gel diets for rearing of Queensland fruit fly, Bactrocera tryoni. J. Pest Sci. 2017, 90, 507–520. [Google Scholar] [CrossRef]
- Chang, C.L.; Vargas, R.I.; Caceres, C.; Jang, E.; Cho, I.K. Development and assessment of a liquid larval diet for Bactrocera dorsalis (Diptera:Tephritidae). Ann. Entomol. Soc. Am. 2006, 99, 1191–1198. [Google Scholar] [CrossRef]
- Heather, N.W.; Kopittke, R.A.; Pike, E.A. A heated air quarantine disinfestation treatment against Queensland fruit fly (Diptera:Tephritidae) for tomatoes. Aust. J. Exp. Agric. 2002, 42, 1125–1129. [Google Scholar] [CrossRef]
- Gazit, Y.; Rossler, Y.; Wang, S.; Tang, J.; Lurie, S. Thermal death kinetics of egg and third instar Mediterranean fruit fly (Diptera: Tephritidae). J. Econ. Entomol. 2004, 97, 1540–1546. [Google Scholar] [CrossRef] [PubMed]
- Hernandez, E.; Rivera, P.; Bravo, B.; Toledo, J.; Caro-Corrales, J.; Montoya, P. Hot-water phytosanitary treatment against Ceratitis capitata (Diptera: Tephritidae) in ’Ataulfo’ mangoes. J. Econ. Entomol. 2012, 105, 1940–1953. [Google Scholar] [CrossRef]
- Langevin, S.A.; Bent, Z.W.; Solberg, O.D.; Curtis, D.J.; Lane, P.D.; Williams, K.P.; Schoeniger, J.S.; Sinha, A.; Lane, T.W.; Branda, S.S. Peregrine: A rapid and unbiased method to produce strand-specific RNA-Seq libraries from small quantities of starting material. RNA Biol. 2013, 10, 502–515. [Google Scholar] [CrossRef] [PubMed]
- Robinson, M.D.; McCarthy, D.J.; Smyth, G.K. edgeR: A Bioconductor package for differential expression analysis of digital gene expression data. Bioinformatics 2010, 26, 139–140. [Google Scholar] [CrossRef] [PubMed]
- Fulda, S.; Gorman, A.M.; Hori, O.; Samali, A. Cellular stress responses: Cell survival and cell death. Int. J. Cell Biol. 2010, 2010, 214074. [Google Scholar] [CrossRef] [PubMed]
- Storey, J.M.; Storey, K.B. Chaperone proteins: Universal roles in surviving environmental stress. Cell Stress Chaperones 2023, 28, 455–466. [Google Scholar] [CrossRef]
- Wang, S.; Tang, J.; Cavalieri, R.P. Modeling fruit internal heating rates for hot air and hot water treatments. Postharvest Biol. Technol. 2001, 22, 257–270. [Google Scholar] [CrossRef]
- Hallman, G.J. Insect Thermotolerance Comparing Host Infestation Methods: Anastrepha ludens (Diptera: Tephritidae) Reared in Grapefruit or Diet. J. Econ. Entomol. 2014, 107, 1377–1384. [Google Scholar] [CrossRef] [PubMed]
- Huang, L.H.; Chen, B.; Kang, L. Impact of mild temperature hardening on thermotolerance, fecundity, and Hsp gene expression in Liriomyza huidobrensis. J. Insect Physiol. 2007, 53, 1199–1205. [Google Scholar] [CrossRef]
- Huang, L.H.; Wang, C.Z.; Kang, L. Cloning and expression of five heat shock protein genes in relation to cold hardening and development in the leafminer, Liriomyza sativa. J. Insect Physiol. 2009, 55, 279–285. [Google Scholar] [CrossRef]
- Anantanawat, K.; Papanicolaou, A.; Hill, K.; Xu, W. Mediterranean fruit fly genes exhibit different expression patterns between heat and cold treatments Bull. Entomol. Res. 2022, 112, 236–242. [Google Scholar] [CrossRef]


Disclaimer/Publisher’s Note: The statements, opinions and data contained in all publications are solely those of the individual author(s) and contributor(s) and not of MDPI and/or the editor(s). MDPI and/or the editor(s) disclaim responsibility for any injury to people or property resulting from any ideas, methods, instructions or products referred to in the content. |
© 2024 by the authors. Licensee MDPI, Basel, Switzerland. This article is an open access article distributed under the terms and conditions of the Creative Commons Attribution (CC BY) license (https://creativecommons.org/licenses/by/4.0/).
Share and Cite
Anantanawat, K.; Papanicolaou, A.; Hill, K.; Liao, Y.; Xu, W. Divergent Heat Stress Responses in Bactrocera tryoni and Ceratitis capitata. Insects 2024, 15, 759. https://doi.org/10.3390/insects15100759
Anantanawat K, Papanicolaou A, Hill K, Liao Y, Xu W. Divergent Heat Stress Responses in Bactrocera tryoni and Ceratitis capitata. Insects. 2024; 15(10):759. https://doi.org/10.3390/insects15100759
Chicago/Turabian StyleAnantanawat, Kay, Alexie Papanicolaou, Kelly Hill, Yalin Liao, and Wei Xu. 2024. "Divergent Heat Stress Responses in Bactrocera tryoni and Ceratitis capitata" Insects 15, no. 10: 759. https://doi.org/10.3390/insects15100759