Simple Summary
Biological invasions, such as those by the Asiatic rhinoceros beetle (Oryctes rhinoceros), threaten biodiversity, ecosystems, economies, and human health. This study used the MaxEnt model and ArcGIS software to predict the global distribution of this invasive beetle. The model identified areas with high suitability for the beetle mainly between 30° N and 30° S, particularly in South Asia, East Asia, Southeast Asia, and northern Oceania. Key environmental factors influencing its distribution include the amount of precipitation in the wettest month, temperatures in July and November, and precipitation in September. These findings can guide efforts to prevent and control the spread of this beetle and inform quarantine measures.
Abstract
The Asiatic rhinoceros beetle, Oryctes rhinoceros (Linnaeus, 1758) (Coleoptera: Scarabaeidae), is a destructive invasive species that poses a serious threat to palms, oil palms, and other plants. Defining a suitable area for the distribution of O. rhinoceros is essential for the development of appropriate policies and preventive measures. In this work, the MaxEnt niche model and ArcGIS software were used to predict the potential geographic distribution of O. rhinoceros in the world based on occurrence data and related environmental variables and to speculate on the influence of environmental variables on the distribution of O. rhinoceros. The results showed that the suitable areas of O. rhinoceros beetle were mainly distributed in 30° N–30° S, and the highly suitable areas were concentrated in South Asia, East Asia, Southeast Asia, and northern Oceania. The key environmental variables that determine the distribution location of O. rhinoceros are Precipitation of Wettest Month (bio13), Temperature of July (tmin7), Minimum Temperature of November (tmin11), and Precipitation of September (prec9). The prediction results of the MaxEnt model can reflect the global distribution of O. rhinoceros. This study can provide a theoretical basis for the prevention and control of O. rhinoceros and the development of relevant quarantine measures.
1. Introduction
Predicting the potential geographic distribution of pests is one of the crucial research topics in quantitative pest risk assessment [1]. The Asiatic rhinoceros beetle, Oryctes rhinoceros (Coleoptera: Scarabaeidae), is a destructive invasive species that has various host plants, is parasitic on a variety of palm plants, and occasionally harms other cultivated or wild plants; among them, coconut and oil palm are the main host plants [2,3]. As important food, fiber, and wood resources, oil palm, coconut, and other palm plants have great development potential and high economic and ecological value. The occurrence of O. rhinoceros seriously affects the yield of crops, inhibits the growth and development of host plants, and causes the plants to wither or even die, resulting in huge losses [4].
O. rhinocerosis is a polyphagous pest that not only seriously harms palm plants but also feeds on sugarcane, pineapple, sisal, papaya, and other crops. When the damage is serious, it will also cause a large number of plant deaths [5]. The pest has great dispersal potential. It can reproduce in dead trunk and stump residues smoothly, spread to new settlements through the trunk tissue, and then continue to harm; the beetle can also lay eggs and survive in livestock manure accumulation sites, sawdust dump sites, and garbage dumps. These places are often neglected by people, increasing the difficulty of prevention and control [6,7]. In addition, the occurrence of natural disasters is also conducive to the reproduction of O. rhinoceros [8]. O. rhinoceros is considered a globally invasive species [9] and has invaded many countries and regions that have not previously suffered from the pest in recent years [10], including Guam (2007), Hawaii (2013), the Solomon Islands (2017), Vanuatu, and New Caledonia (2019) [11]. O. rhinoceros has spread all over Asia (Southeast Asia), Africa, and South Pacific Island countries, among others. The countries and regions that have experienced more serious harm include India, Mexico, Vietnam, Laos, Cambodia, Thailand, Sri Lanka, Malaysia, Singapore, Indonesia, Fiji Islands, Hawaii Islands, etc. [12,13].
O. rhinoceros has a long survival cycle and the phenomenon of overlapping generations. The growth and development of O. rhinoceros are significantly affected by climate or nutritional conditions. In general, it takes 326–455 d to complete a generation, including egg, larva, pupa, and adult. Under certain conditions, the developmental period of the egg needs 4–14 d, and the egg is white and oval as usual. The larval development period is prolonged with the increase in insect age. The developmental stages of 1st, 2nd, and 3rd instar larvae are 8–22 d, 14–28 d, and 100–156 d, respectively. The development period of the pre-pupa takes 7–18 d, and the pupa lasts for 25–41 d to reach the adult stage. The adult has a brown, smooth, and elastic dorsal surface and a brownish-red abdomen. It takes 5–29 d in the early stage of oviposition [14]. As the pest bores into the tree trunk, it is difficult for general chemicals to contact the insect’s body, so it is very difficult to control the beetle efficiently. However, studies have shown that O. rhinoceros can be effectively controlled by pheromones and natural enemies [3,15,16,17].
Climate changes can affect insect communities and dispersal, which in turn affect pests’ geographic distribution, numbers, and growth [1,18]. Identifying the potential distribution areas and the trend of ecological range change for invasive species is beneficial to the development of environmental management measures. Based on niche theory, the Ecological Niche Models (ENMs) analyzed the known distribution information of species and related environmental variables, constructed the model according to the corresponding algorithm to judge the ecological needs of species, and estimated and predicted the potential distribution areas of species [19,20]. Based on the principle of maximum entropy, Phillips established the maximum entropy method niche model (MaxEnt) to predict the geographical distribution of species, which can be used as a tool for statistical inference to predict the potential distribution areas of species [21]. Compared with other models, such as BIOCLIM [22], GARP [23], CLIMEX [24], and DOMAIN [25], the MaxEnt model has better prediction ability [26] and has been used to predict the potential distribution area of species in various fields [27].
Today, research on O. rhinoceros mainly focuses on morphological characteristics, biological habits, distribution, and harm control [14,28,29]. Prior to this, our team had already predicted the distribution of O. rhinoceros in China [30]. As a global invasive species [9], O. rhinoceros has caused great harm worldwide. Understanding the potential distribution area and change trend globally have a great effect on the prevention and control of O. rhinoceros. In this work, based on known distribution data and combined with environmental data, MaxEnt and ArcGIS were combined to predict the potential distribution area of O. rhinoceros in the world and to evaluate the potential invasion risk of O. rhinoceros in the future, providing the theoretical basis for the prevention and control of O. rhinoceros worldwide.
2. Materials and Methods
2.1. Species Distribution Data and Processing
By consulting the literature and querying the Global Biodiversity Information Facility (GBIF: https://www.gbif.org, accessed on 23 January 2024), the European and Mediterranean Plant Protection Organization (EPPO: https://www.eppo.int/, accessed on 23 January 2024), and the Commonwealth Agricultural Bureaux International (CABI: https:// www.cabi.org/, accessed on 23 January 2024), we obtained the O. rhinoceros distribution data. In order to reduce the influence of sampling deviation on the model accuracy, the obtained distribution point data of O. rhinoceros was screened using the buffer analysis method of the ArcGIS 10.8.1 software. Finally, 321 global distribution data of O. rhinoceros were reserved for prediction. The longitudes and latitudes of distribution points were converted into CSV format for further model analysis.
2.2. Bioclimatic Factors
The environmental variables used in this research were all from WorldClim (version 2.1, http://www.worldclim.org/, accessed on 26 January 2024). The environmental variables included 19 bioclimatic variables, monthly minimum temperature, monthly maximum temperature, monthly average temperature, and precipitation (Table 1), and the spatial resolution was 30 s. Environmental variables under historical climate conditions covered climate data from 1971 to 2000. The future climate data for the 2050s (2041–2060) and 2090s (2081–2100) were obtained by querying the Climate Change, Agriculture, and Food Security website (CCAFS, https://ccafs.cgiar.org/, accessed on 29 January 2024). The Intergovernmental Panel on Climate Change (IPCC) has reported four representative greenhouse gas concentration scenarios and CMIP6 has been released, so three representative concentration pathways (SSP1-2.6, SSP2-4.5, and SSP5-8.5) were selected to predict the distribution of O. rhinoceros.

Table 1.
Climatic variables used for predicting potential geographic distribution of O. rhinoceros.
The contribution rate of each environmental variable was detected using the jack knife test of the MaxEnt 3.4.1 software [31], and the variables with a smaller contribution were deleted [32]. The selection of climate variables has an important impact on the assessment of species habitat suitability, and there are problems, such as multi-linear repetition, among climate variables [32,33]. In this study, the extraction and analysis tool in the ArcGIS 10.8.1 software was used to execute the sampling command for the multicollinearity analysis of each climate variable, and then Pearson correlation analysis was performed on the data in R 4.4.1 software. Highly correlated variables (|r| > 0.8) were removed to eliminate the effects of multicollinearity and further improve the prediction accuracy of the models [34]. Finally, environmental variables with a high contribution rate and a low correlation coefficient were retained.
2.3. Parameter Settings for MaxEnt Model
The purpose of our work was to explore the influence of environmental factors on the distribution of O. rhinoceros. The distribution data and environmental variables of the beetle were imported into MaxEnt (version 3.4.1) to establish the initial model; 25% were randomly selected as the test set; the Jackknife method was selected to calculate the variable contribution rate; and the others were set as default values. We used the method in Section 2.2 to filter out environmental variables for model reconstruction. We selected “Make pictures of predictions” and “Do Jackknife to measure variable importance” and created a response curve. The number of repetitions was set to 10 times.
2.4. Suitable Area Division and Model Accuracy Evaluation
The operation results of MaxEnt 3.4.1 software were imported into ArcGIS 10.8.1 software to analyze the distribution suitability of O. rhinoceros. According to the partition method of assessment possibility in the IPCC report and the actual situation of O. rhinoceros (IPCC, 2007), habitat suitability was divided into four criteria and represented by different colors: high suitability area (0.66–1, red), medium suitability area (0.33–0.66, orange), low suitability area (0.15–0.33, yellow), and unsuitable area (0–0.15, white).
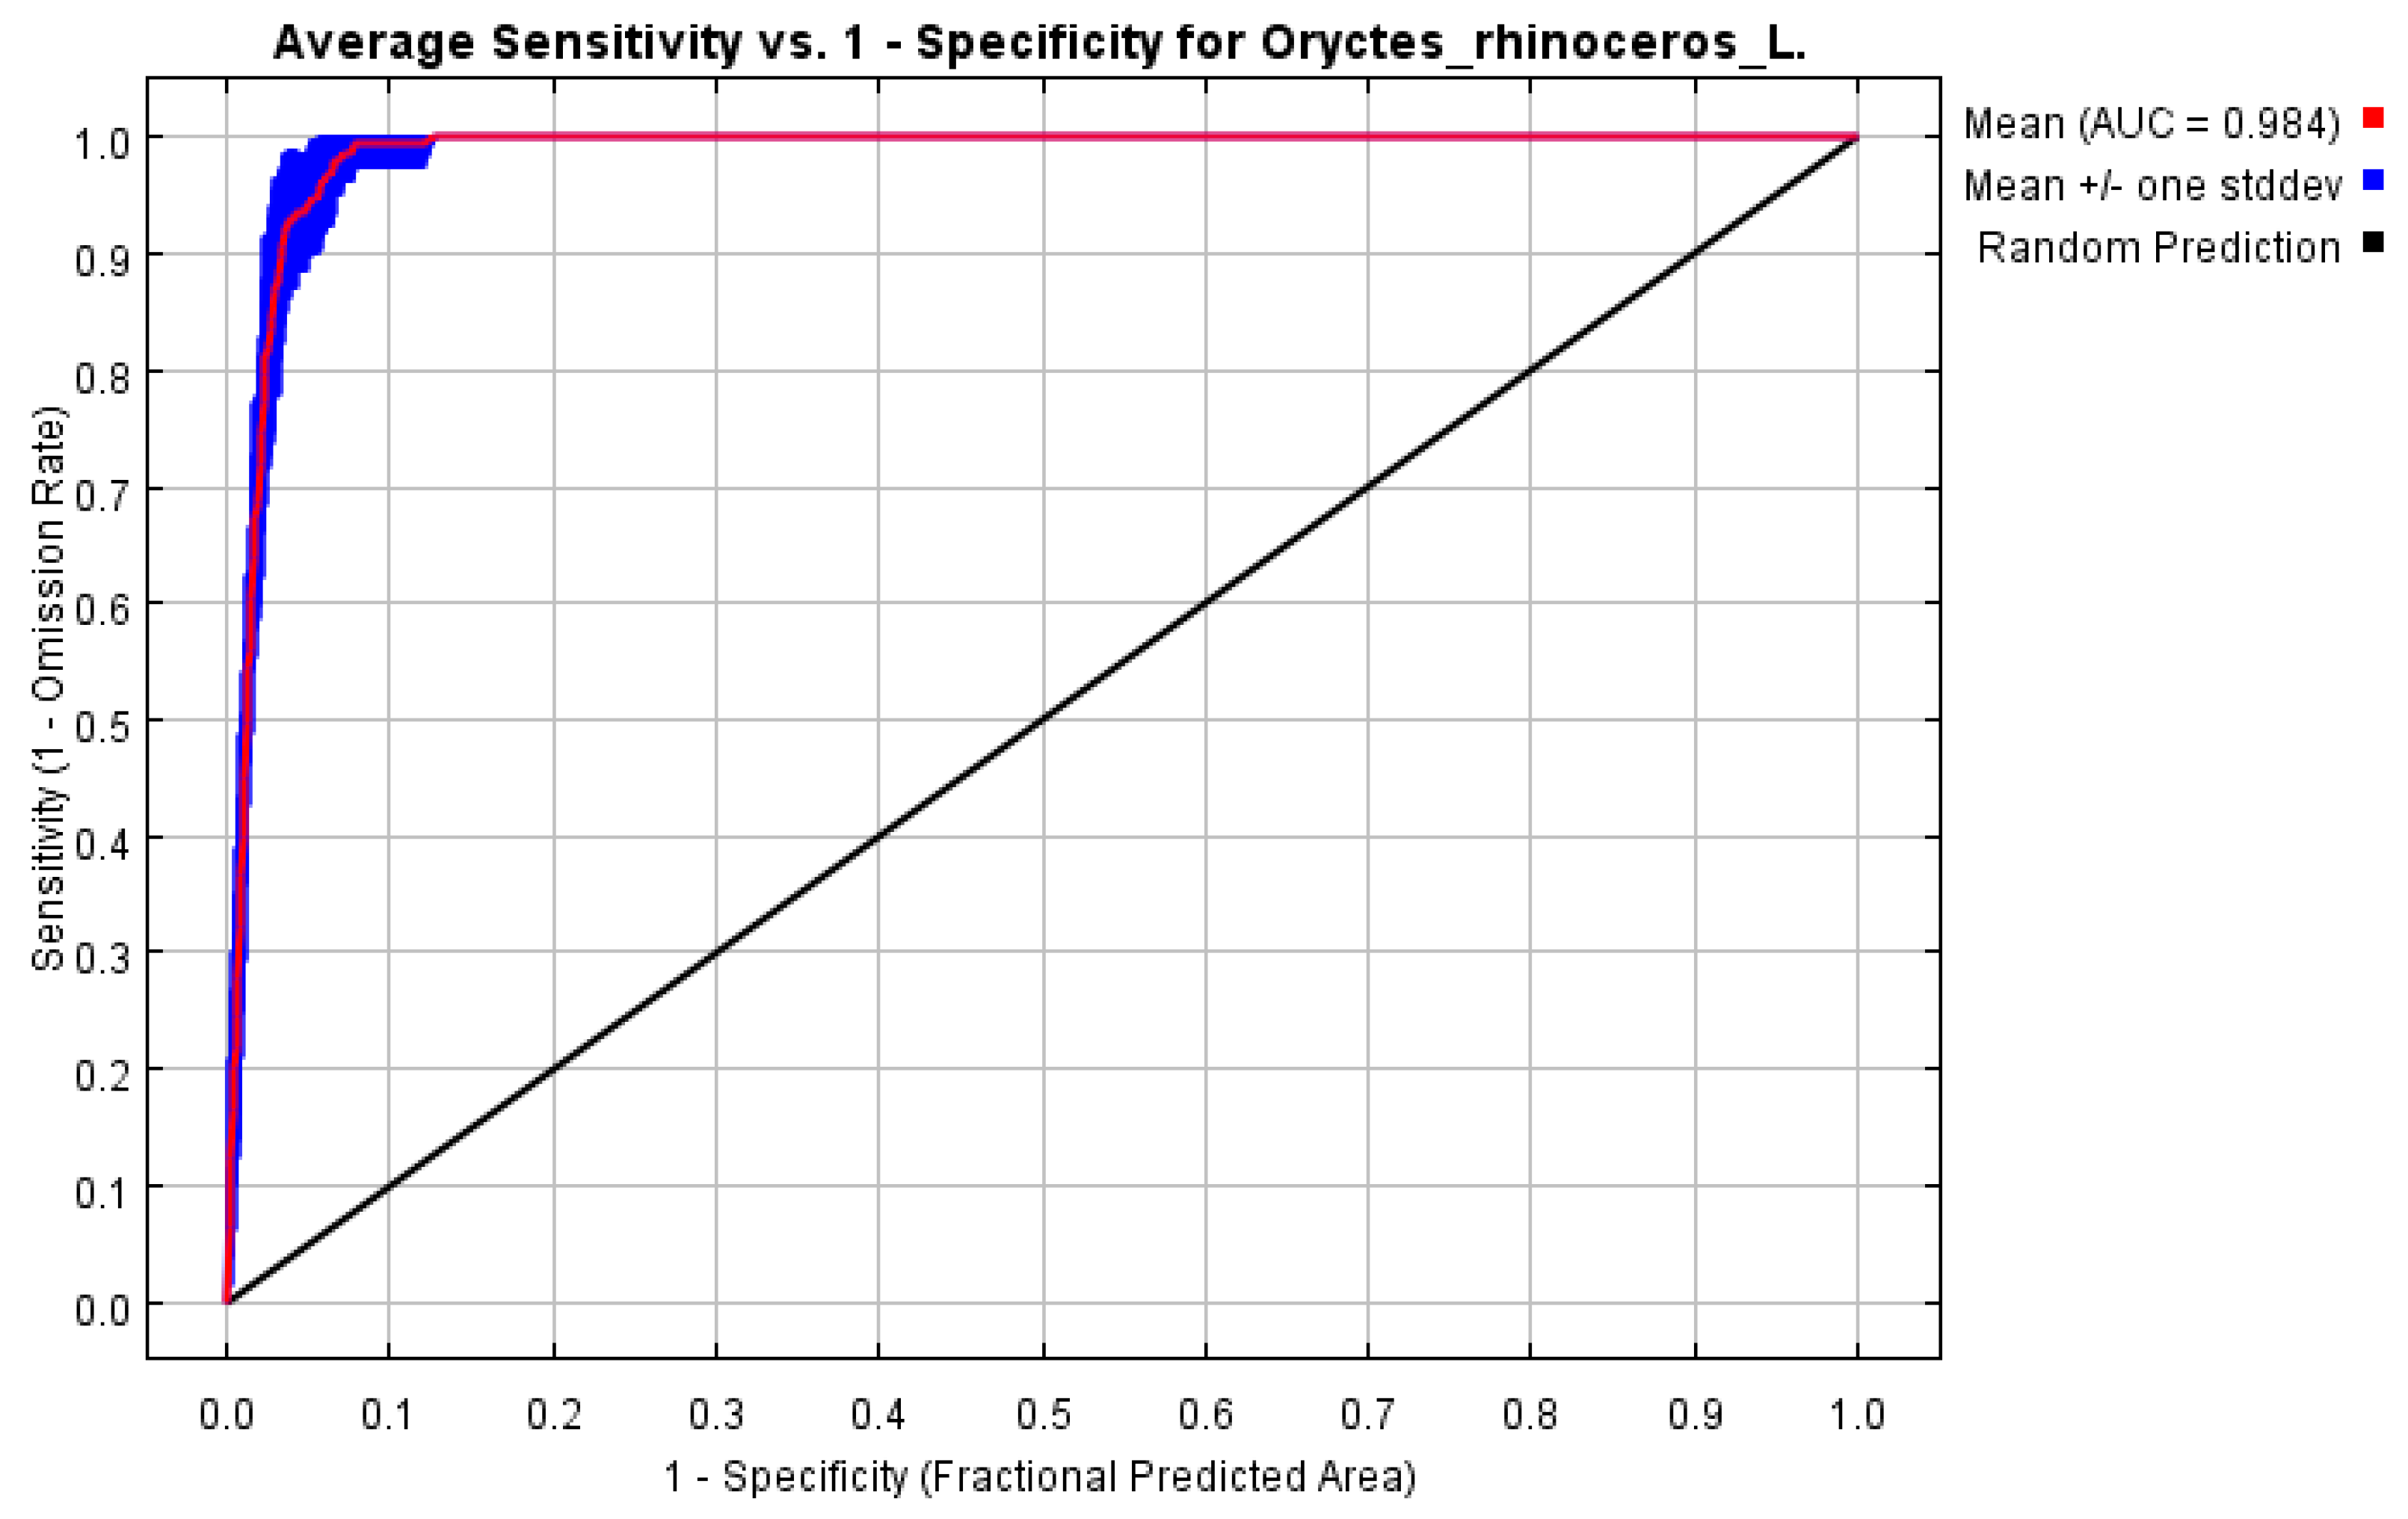
The contribution rate of bioclimatic factors was analyzed using the Jackknife test method and the Area Under the Curve (AUC) of the Receiver Operating Characteristic (ROC) curve was used to evaluate the simulation results of the model. The range of the AUC value is 0 to 1. The closer the AUC value is to 1, the higher the correlation between the prediction model and bioclimatic factors, and the higher the accuracy of the prediction results [35]. When the AUC value is less than 0.8, it indicates that the model’s performance is low. When the AUC value is in the range of 0.8 to 0.9, it indicates that the model’s performance is good. When the AUC value is in the range of 0.9–1, it indicates the excellent performance of the model.
3. Results
3.1. Verification of Model Accuracy
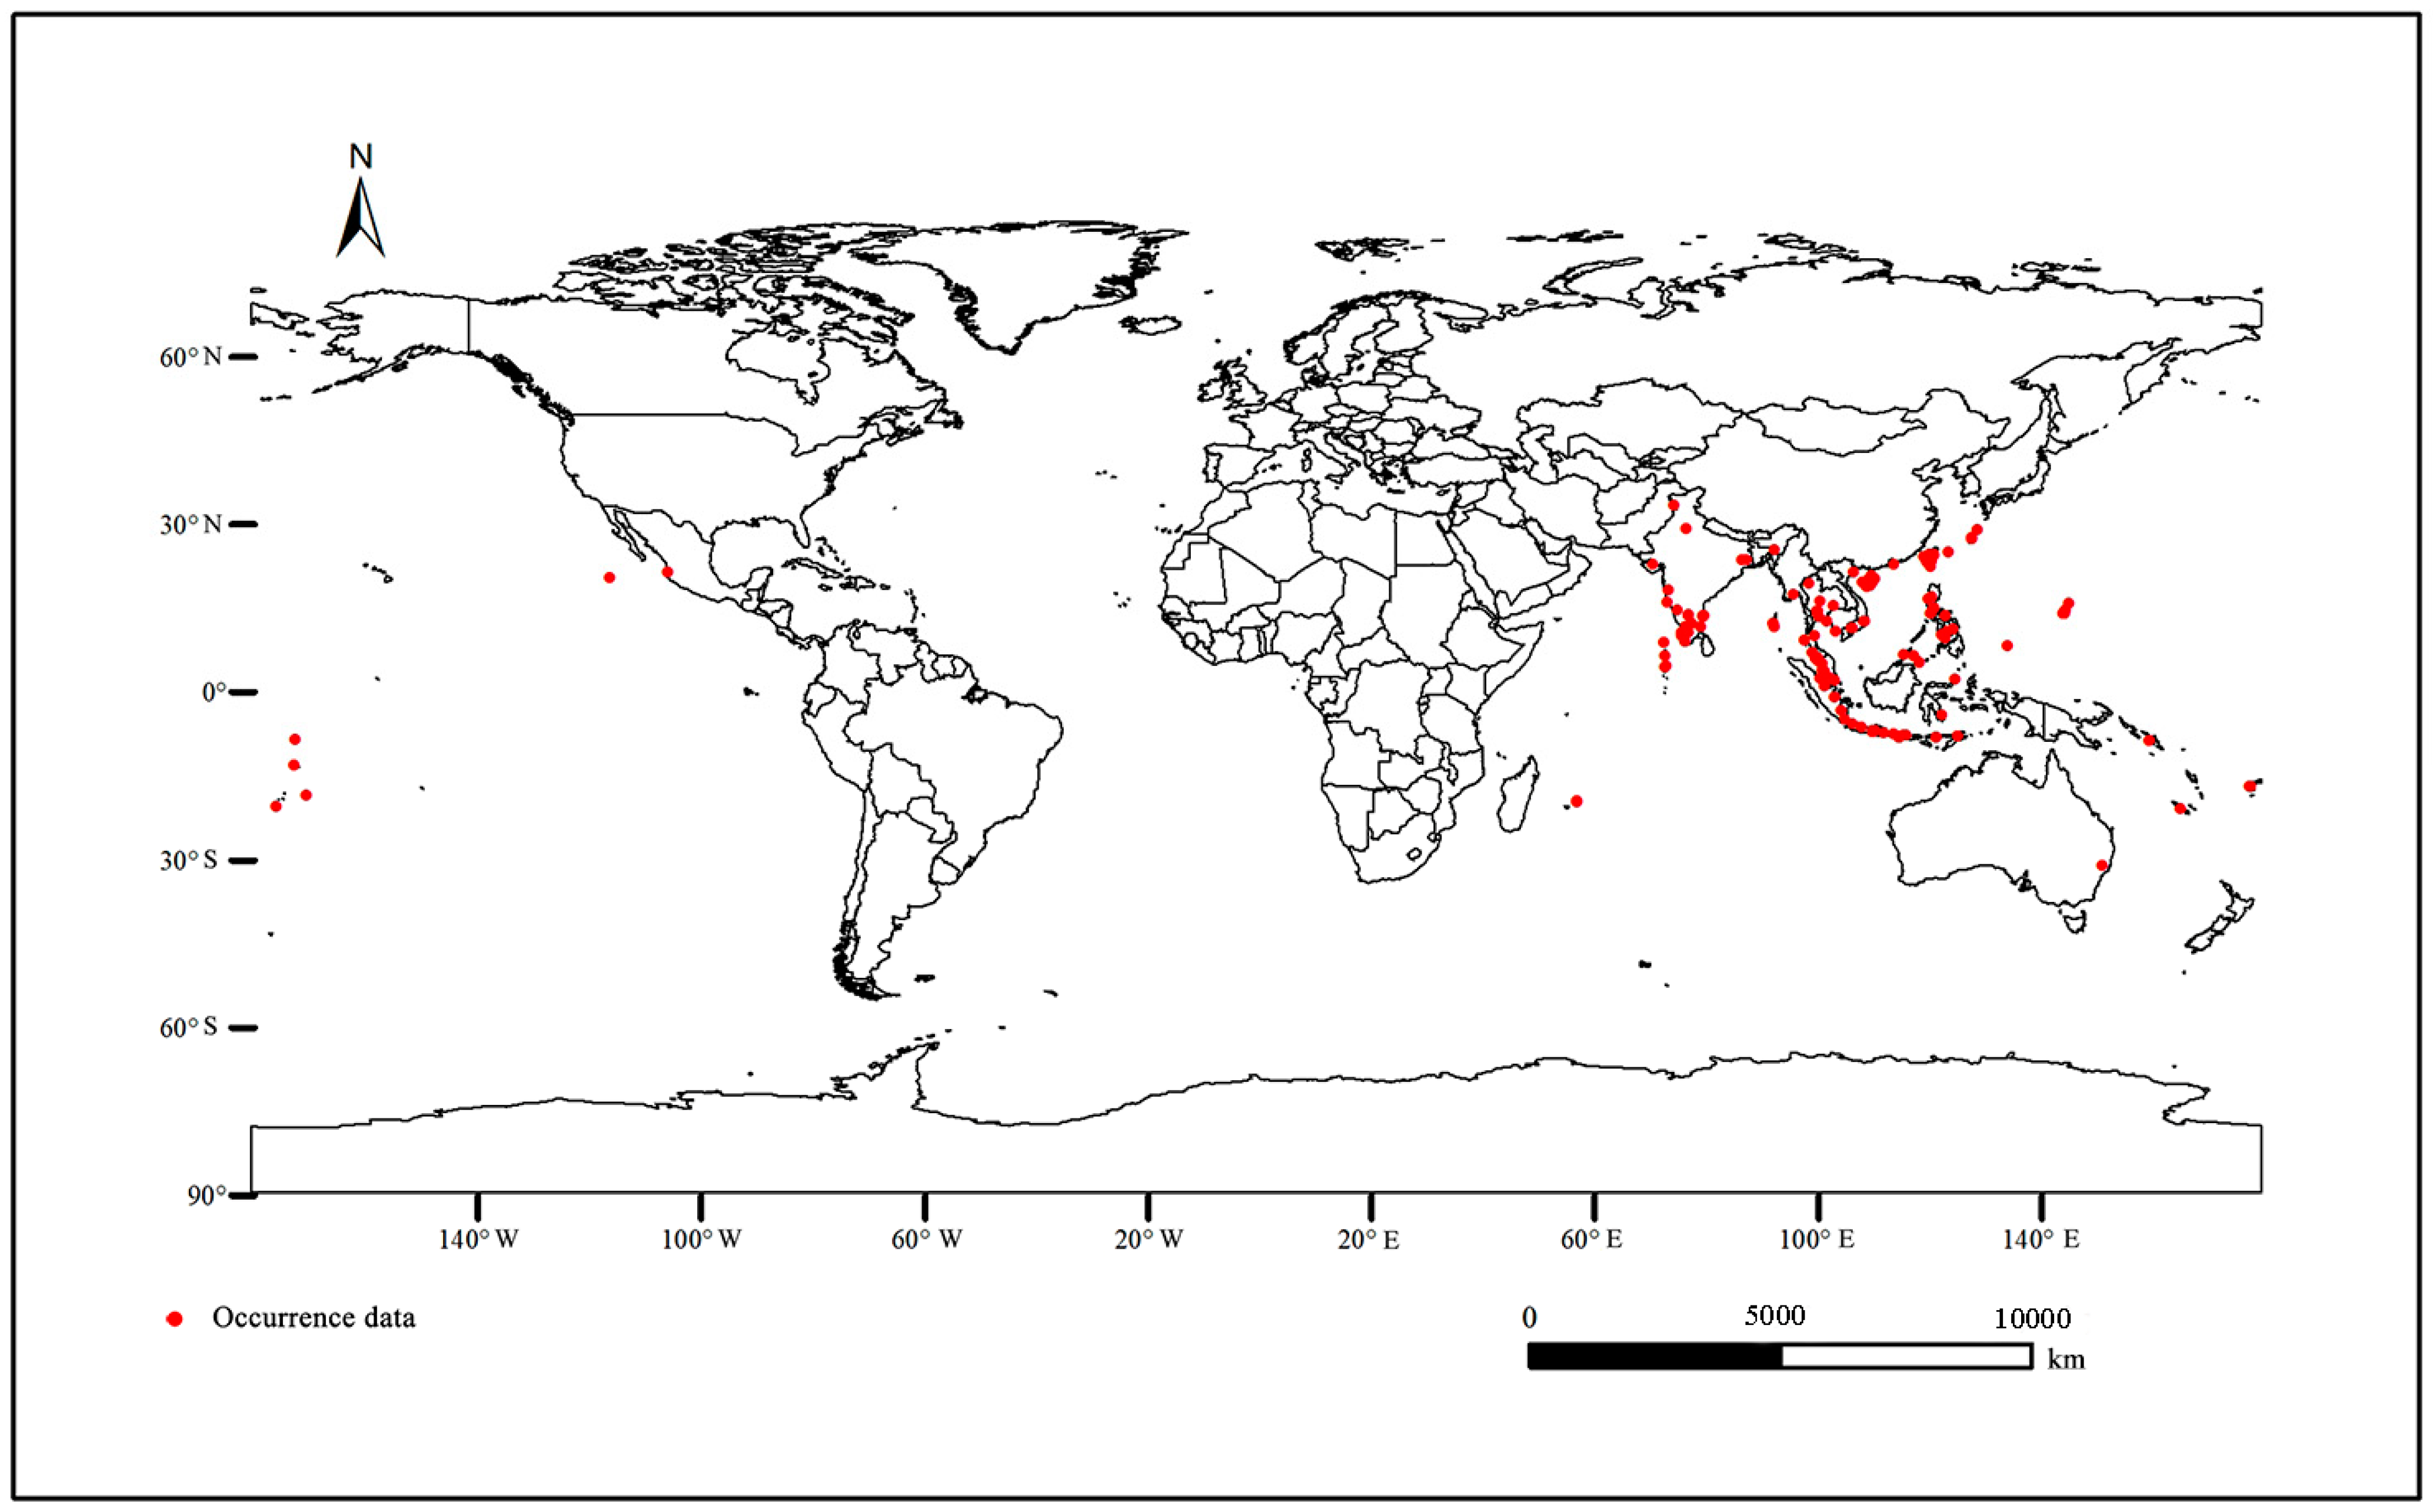
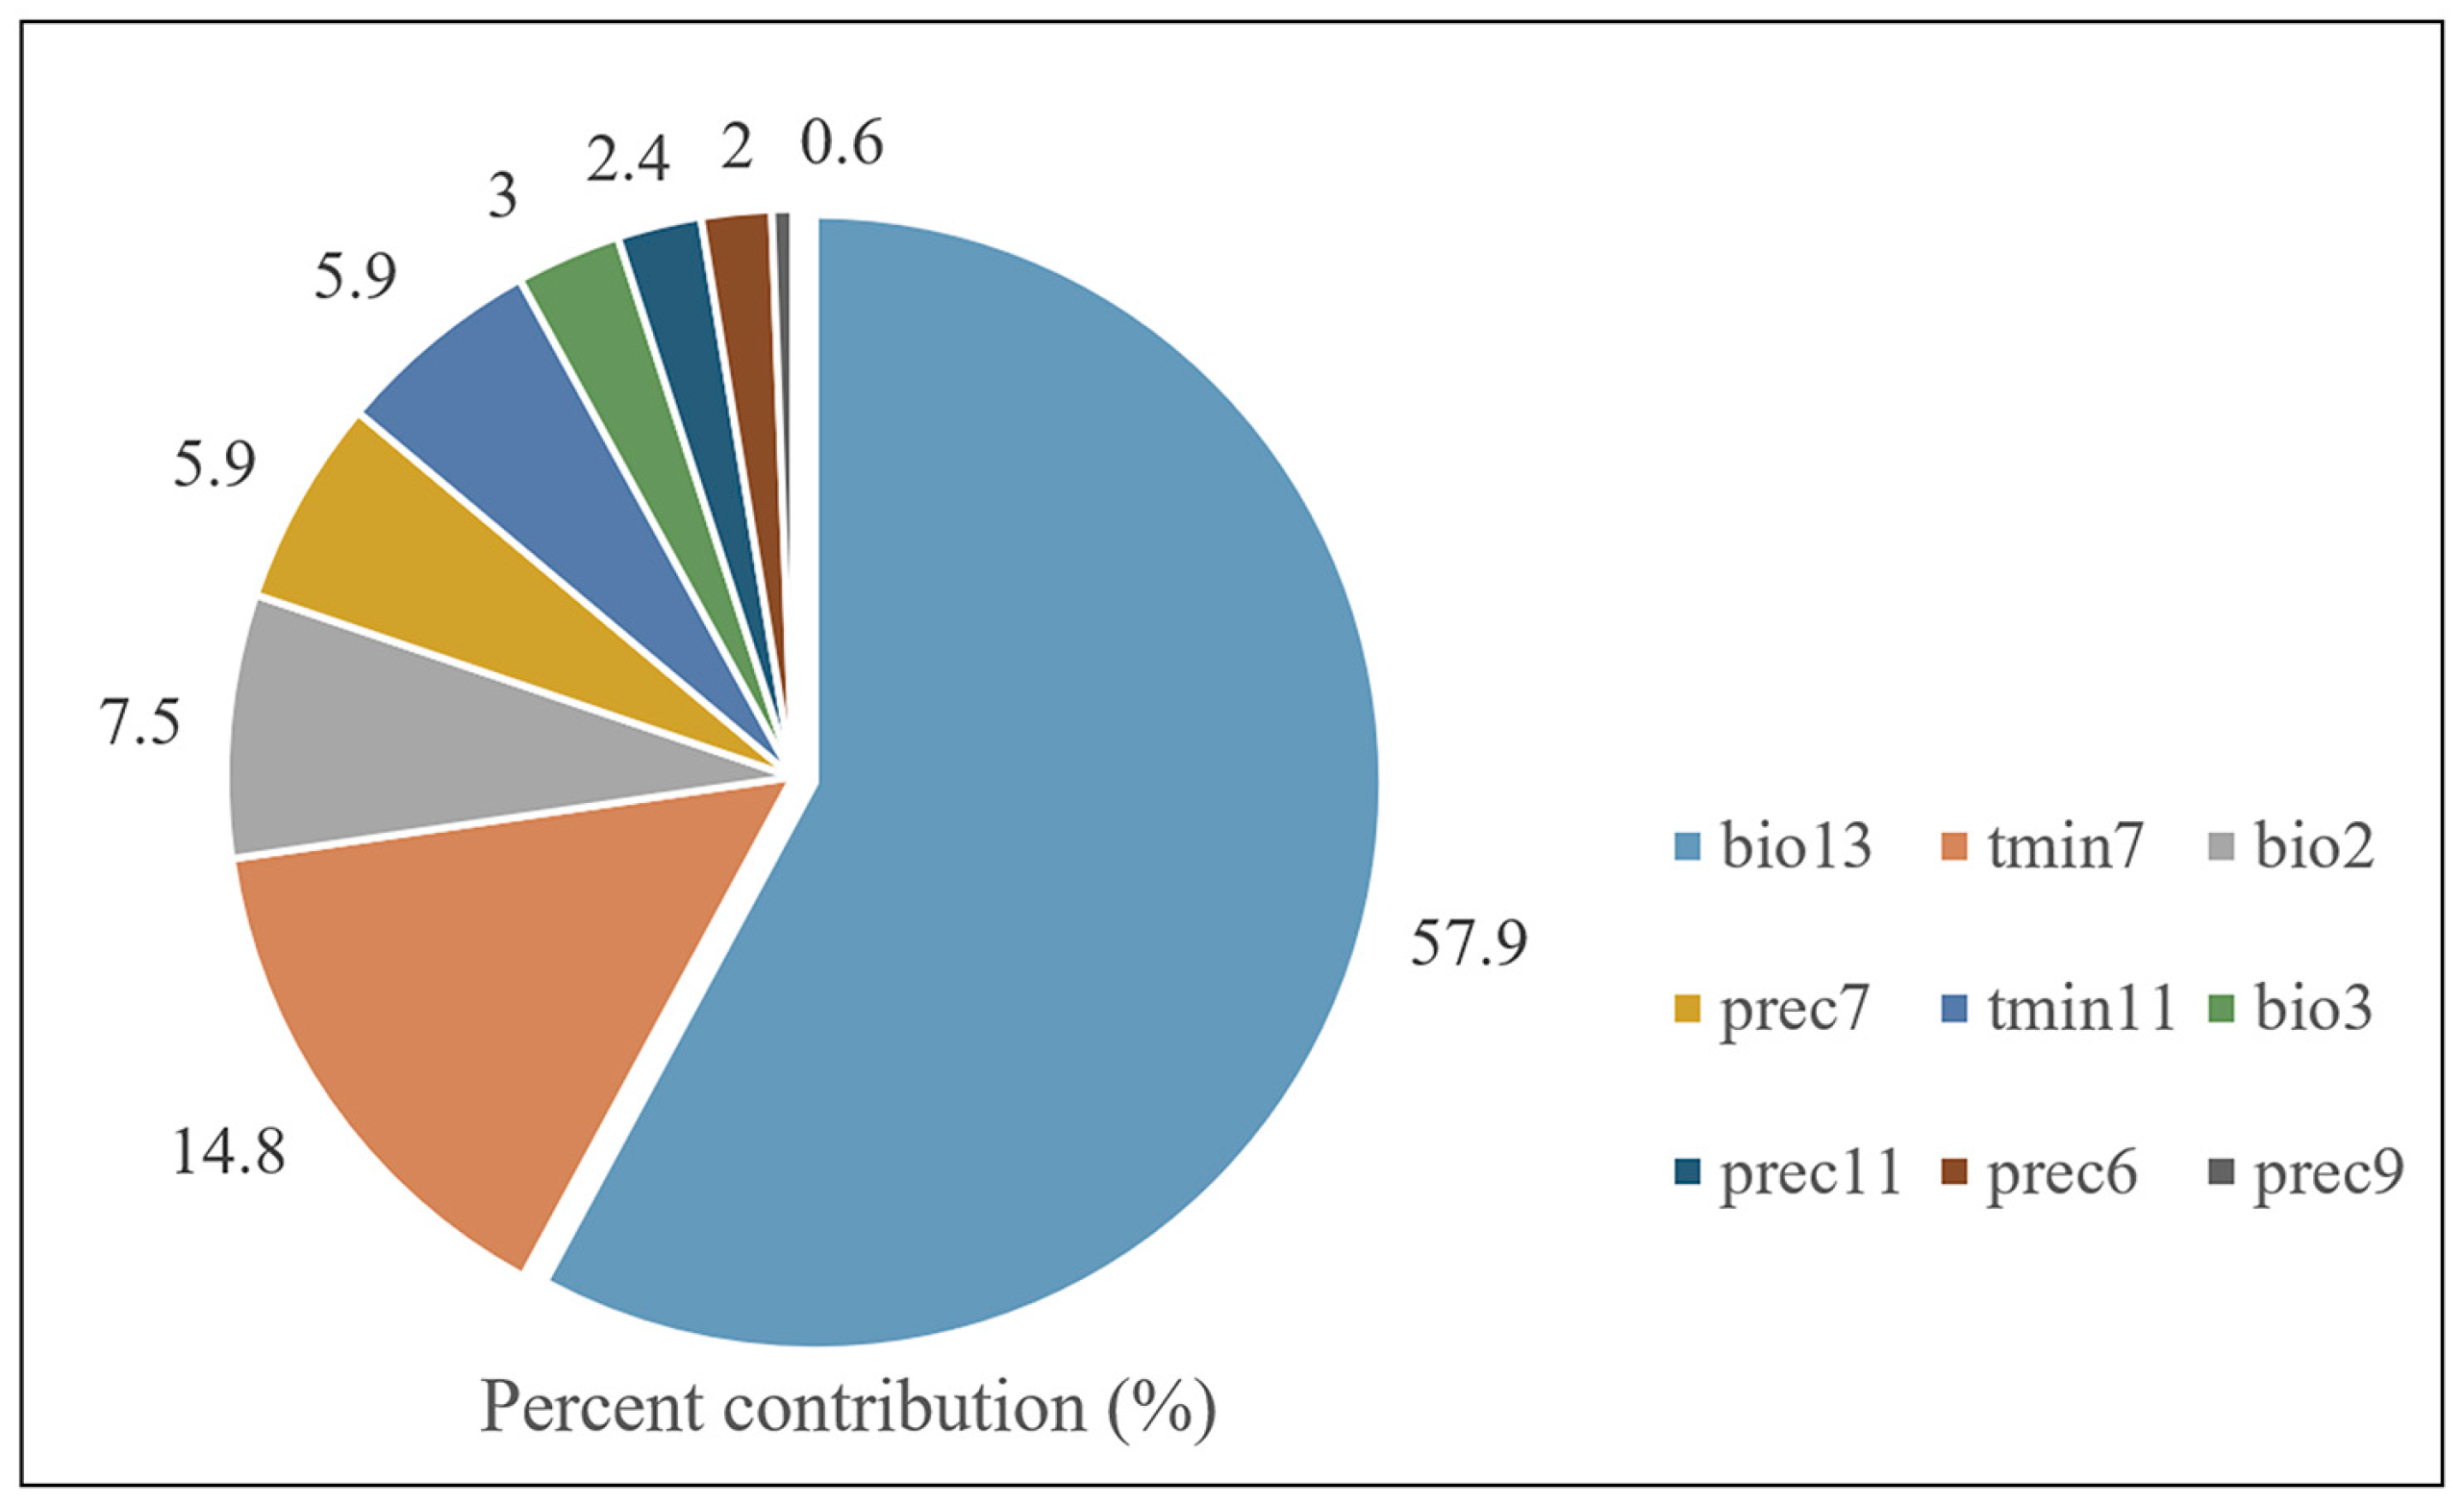
Climate is an important factor affecting species distribution [36]. Our study predicted the potential distribution area based on the occurrence point and environmental factors of O. rhinoceros (Figure 1). Combined with the Jackknife test and Pearson correlation coefficient, nine key environmental variables with high contribution rates and low correlation coefficients were screened out, including Mean Diurnal Range (bio2), Isothermality (bio3), Precipitation of Wettest Month (bio13), Precipitation of June (prec6), Precipitation of July (prec7), Precipitation of September (prec9), Precipitation of November (prec11), Minimum Temperature of July (tmin7), and Minimum Temperature of November (tmin11). Figure 2 shows the percent contribution of nine major climatic factors affecting the distribution of O. rhinoceros. The Pearson correlation coefficients of the above nine environmental variables are shown in Table 2. The results showed that these values were below 0.8. Based on the screened dominant climate factors, the distribution model of O. rhinoceros was reconstructed. As shown in Figure 3, the AUC value reached 0.984, and the accuracy of the simulation results reached an excellent standard, indicating that the constructed model can be used to predict the global suitable area of O. rhinoceros.
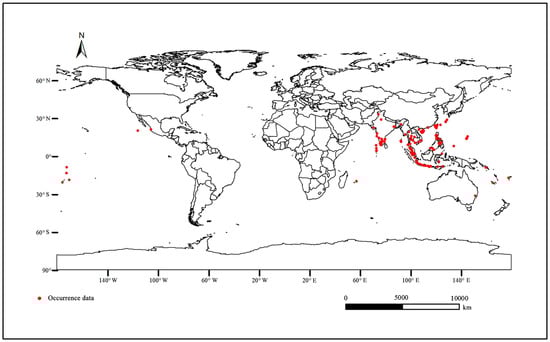
Figure 1.
The distribution point of O. rhinoceros in the world. Red points, occurrence data of O. rhinoceros.
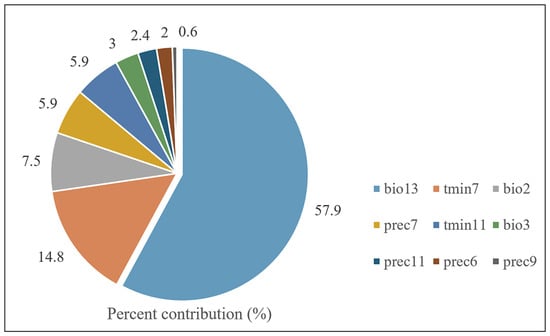
Figure 2.
The relative contributions of the environmental variables to the MaxEnt model.
Table 2.
Pearson correlation coefficients of crucial environmental factors.
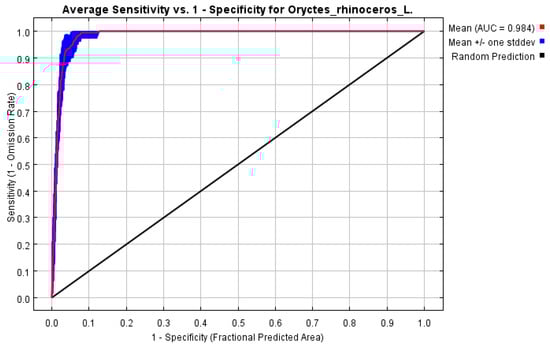
Figure 3.
ROC curve and AUC value for the model of O. rhinoceros.
3.2. Current Predicted Distribution Area
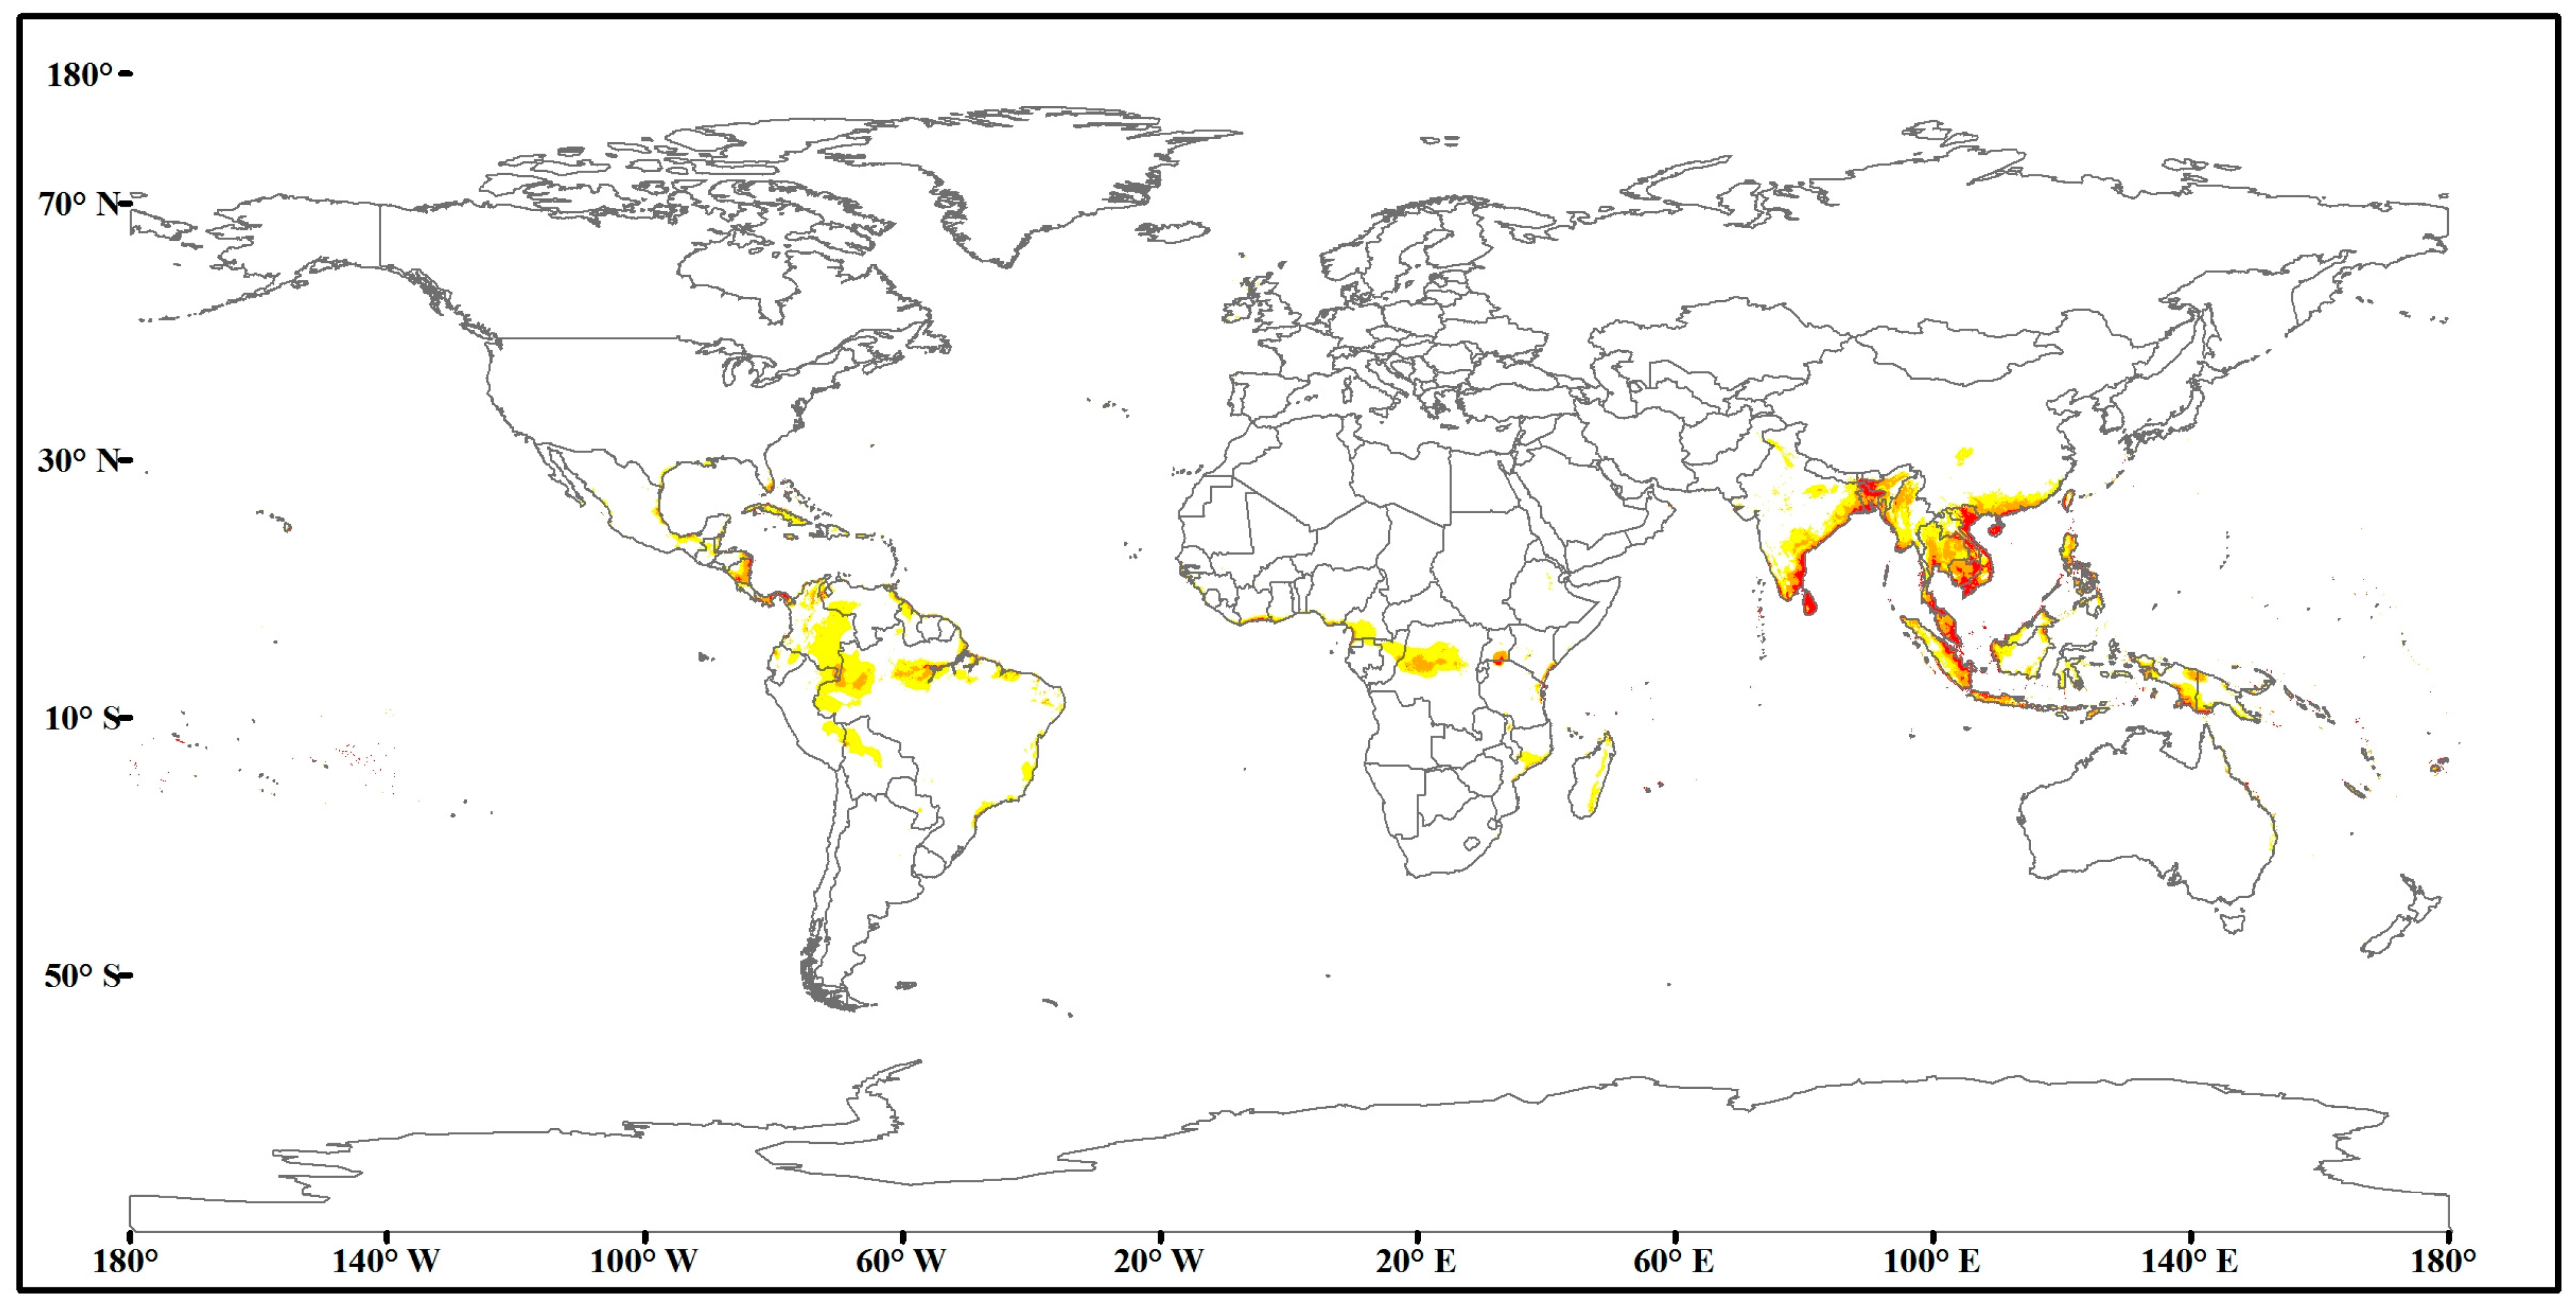
As shown in Figure 4, according to the simulation results of nine key environmental variables and the occurrence records of O. rhinoceros, the current predicted distribution area of O. rhinoceros was obtained, and the high, medium, and low suitability grades were distinguished by different colors. The results showed that the suitable areas for O. rhinoceros were mainly distributed between 30° N and 30° S, including the northern part of South America, the central and southeast coasts of Africa, South Asia, East Asia, and Southeast Asia, and the northern coast of Oceania. High-suitability areas were mainly concentrated in central Africa (India, Kenya, Tanzania, and the Ivory Coast), East and Southeast Asia (Bangladesh, Indonesia, Malaysia, Thailand, and Vietnam), and Northern South America (Brazil).
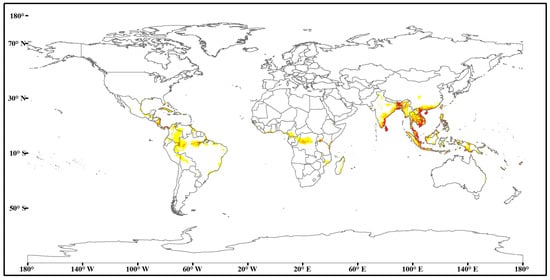
Figure 4.
Current suitable distribution of O. rhinoceros in the world. Red, high suitability area with the probability of 0.66–1. Orange, medium suitability area with the probability of 0.33–0.66. Yellow, low suitability area with the probability of 0.15–0.33. White, unsuitability areas with the probability of 0–0.15.
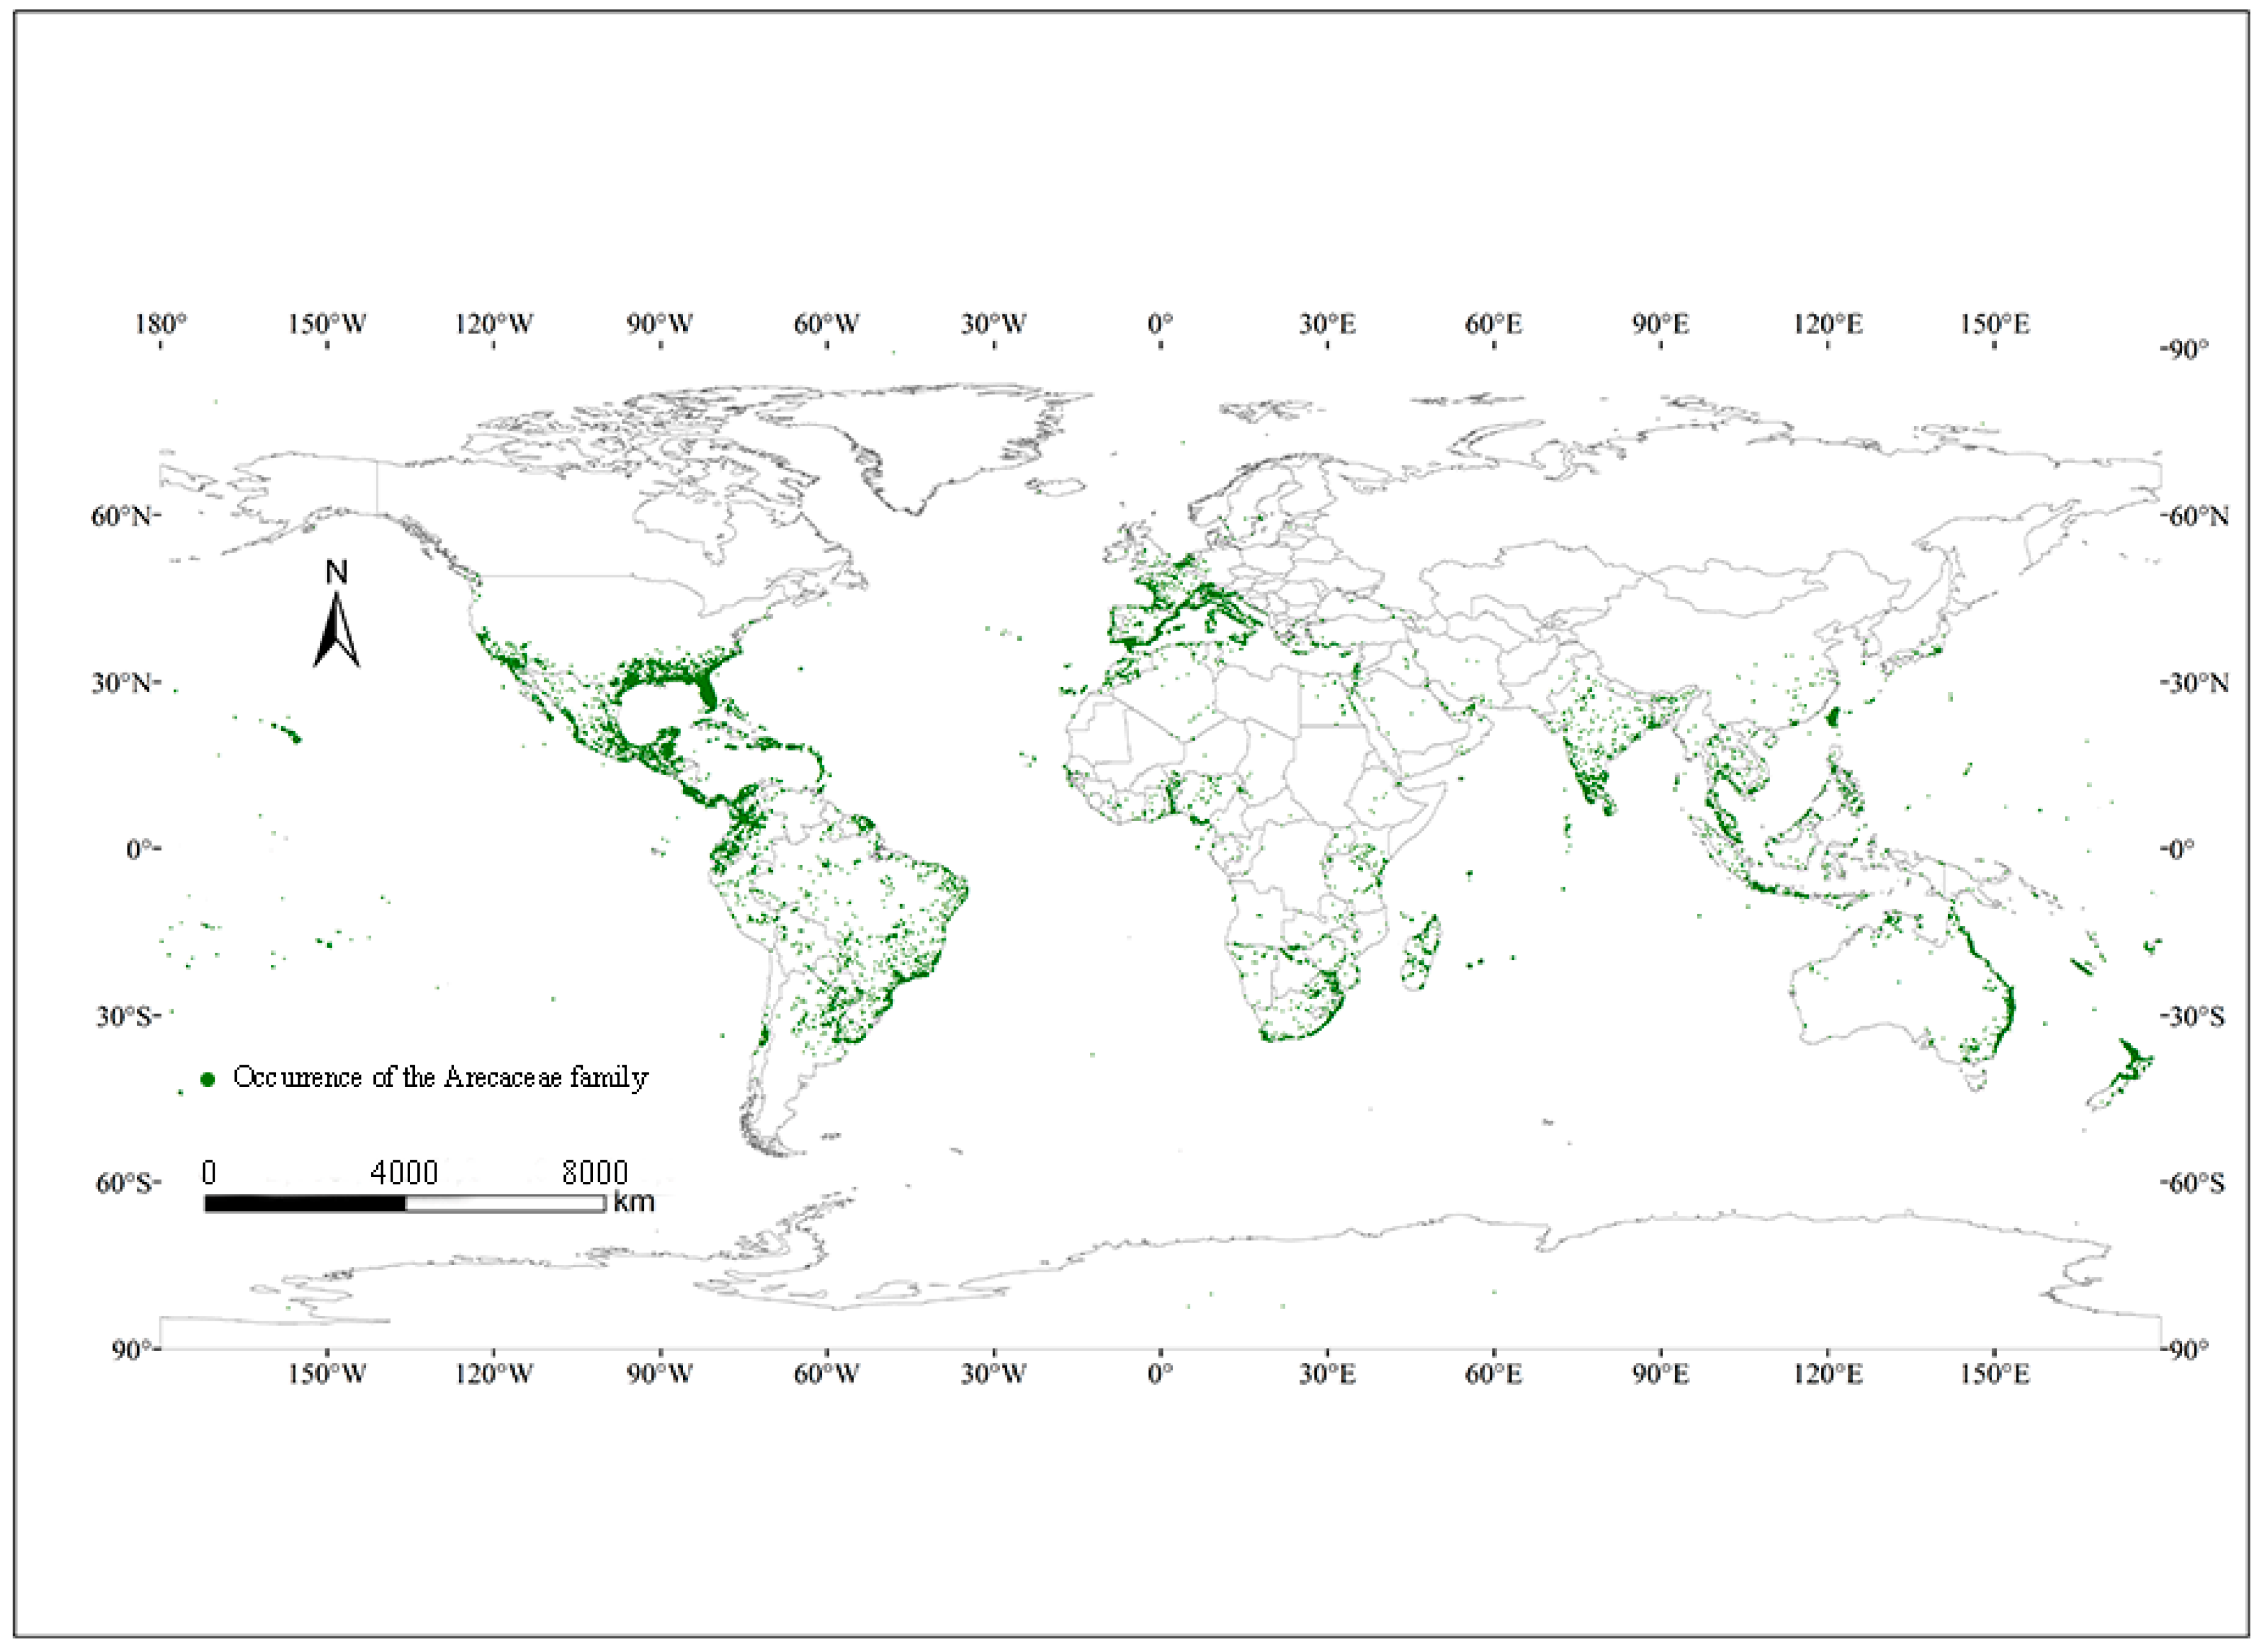
As illustrated in Table 3, the total suitable area for O. rhinoceros in the world is currently 7.71 × 10⁶ km2, accounting for 5.47% of the global continental area, of which Asia is the largest, followed by South America. The high-suitability area is the largest in Asia, at 6.98 × 10⁵ km2, accounting for 77.63% of the total high-suitability area. The host plants of O. rhinoceros are plants of the Arecaceae family. Compared to the global distribution loci of plants in the Arecaceae family, the current suitable distribution areas for O. rhinoceros are smaller than those of the Arecaceae, but all occur within the range where plants in the Arecaceae family occur (Figure 5).
Table 3.
Projections of the current suitable areas of O. rhinoceros (×104 km2).
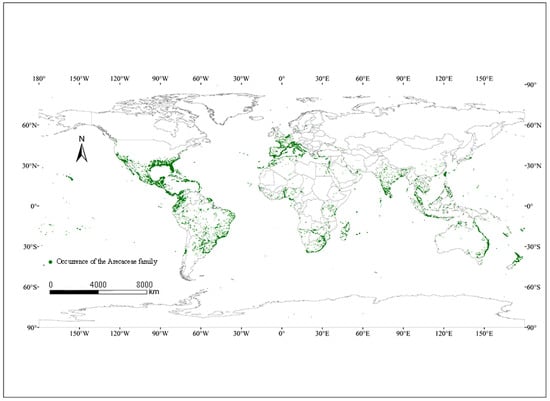
Figure 5.
Global distribution of plants in the family Arecaceae.
3.3. Potential Future Distribution of O. rhinoceros
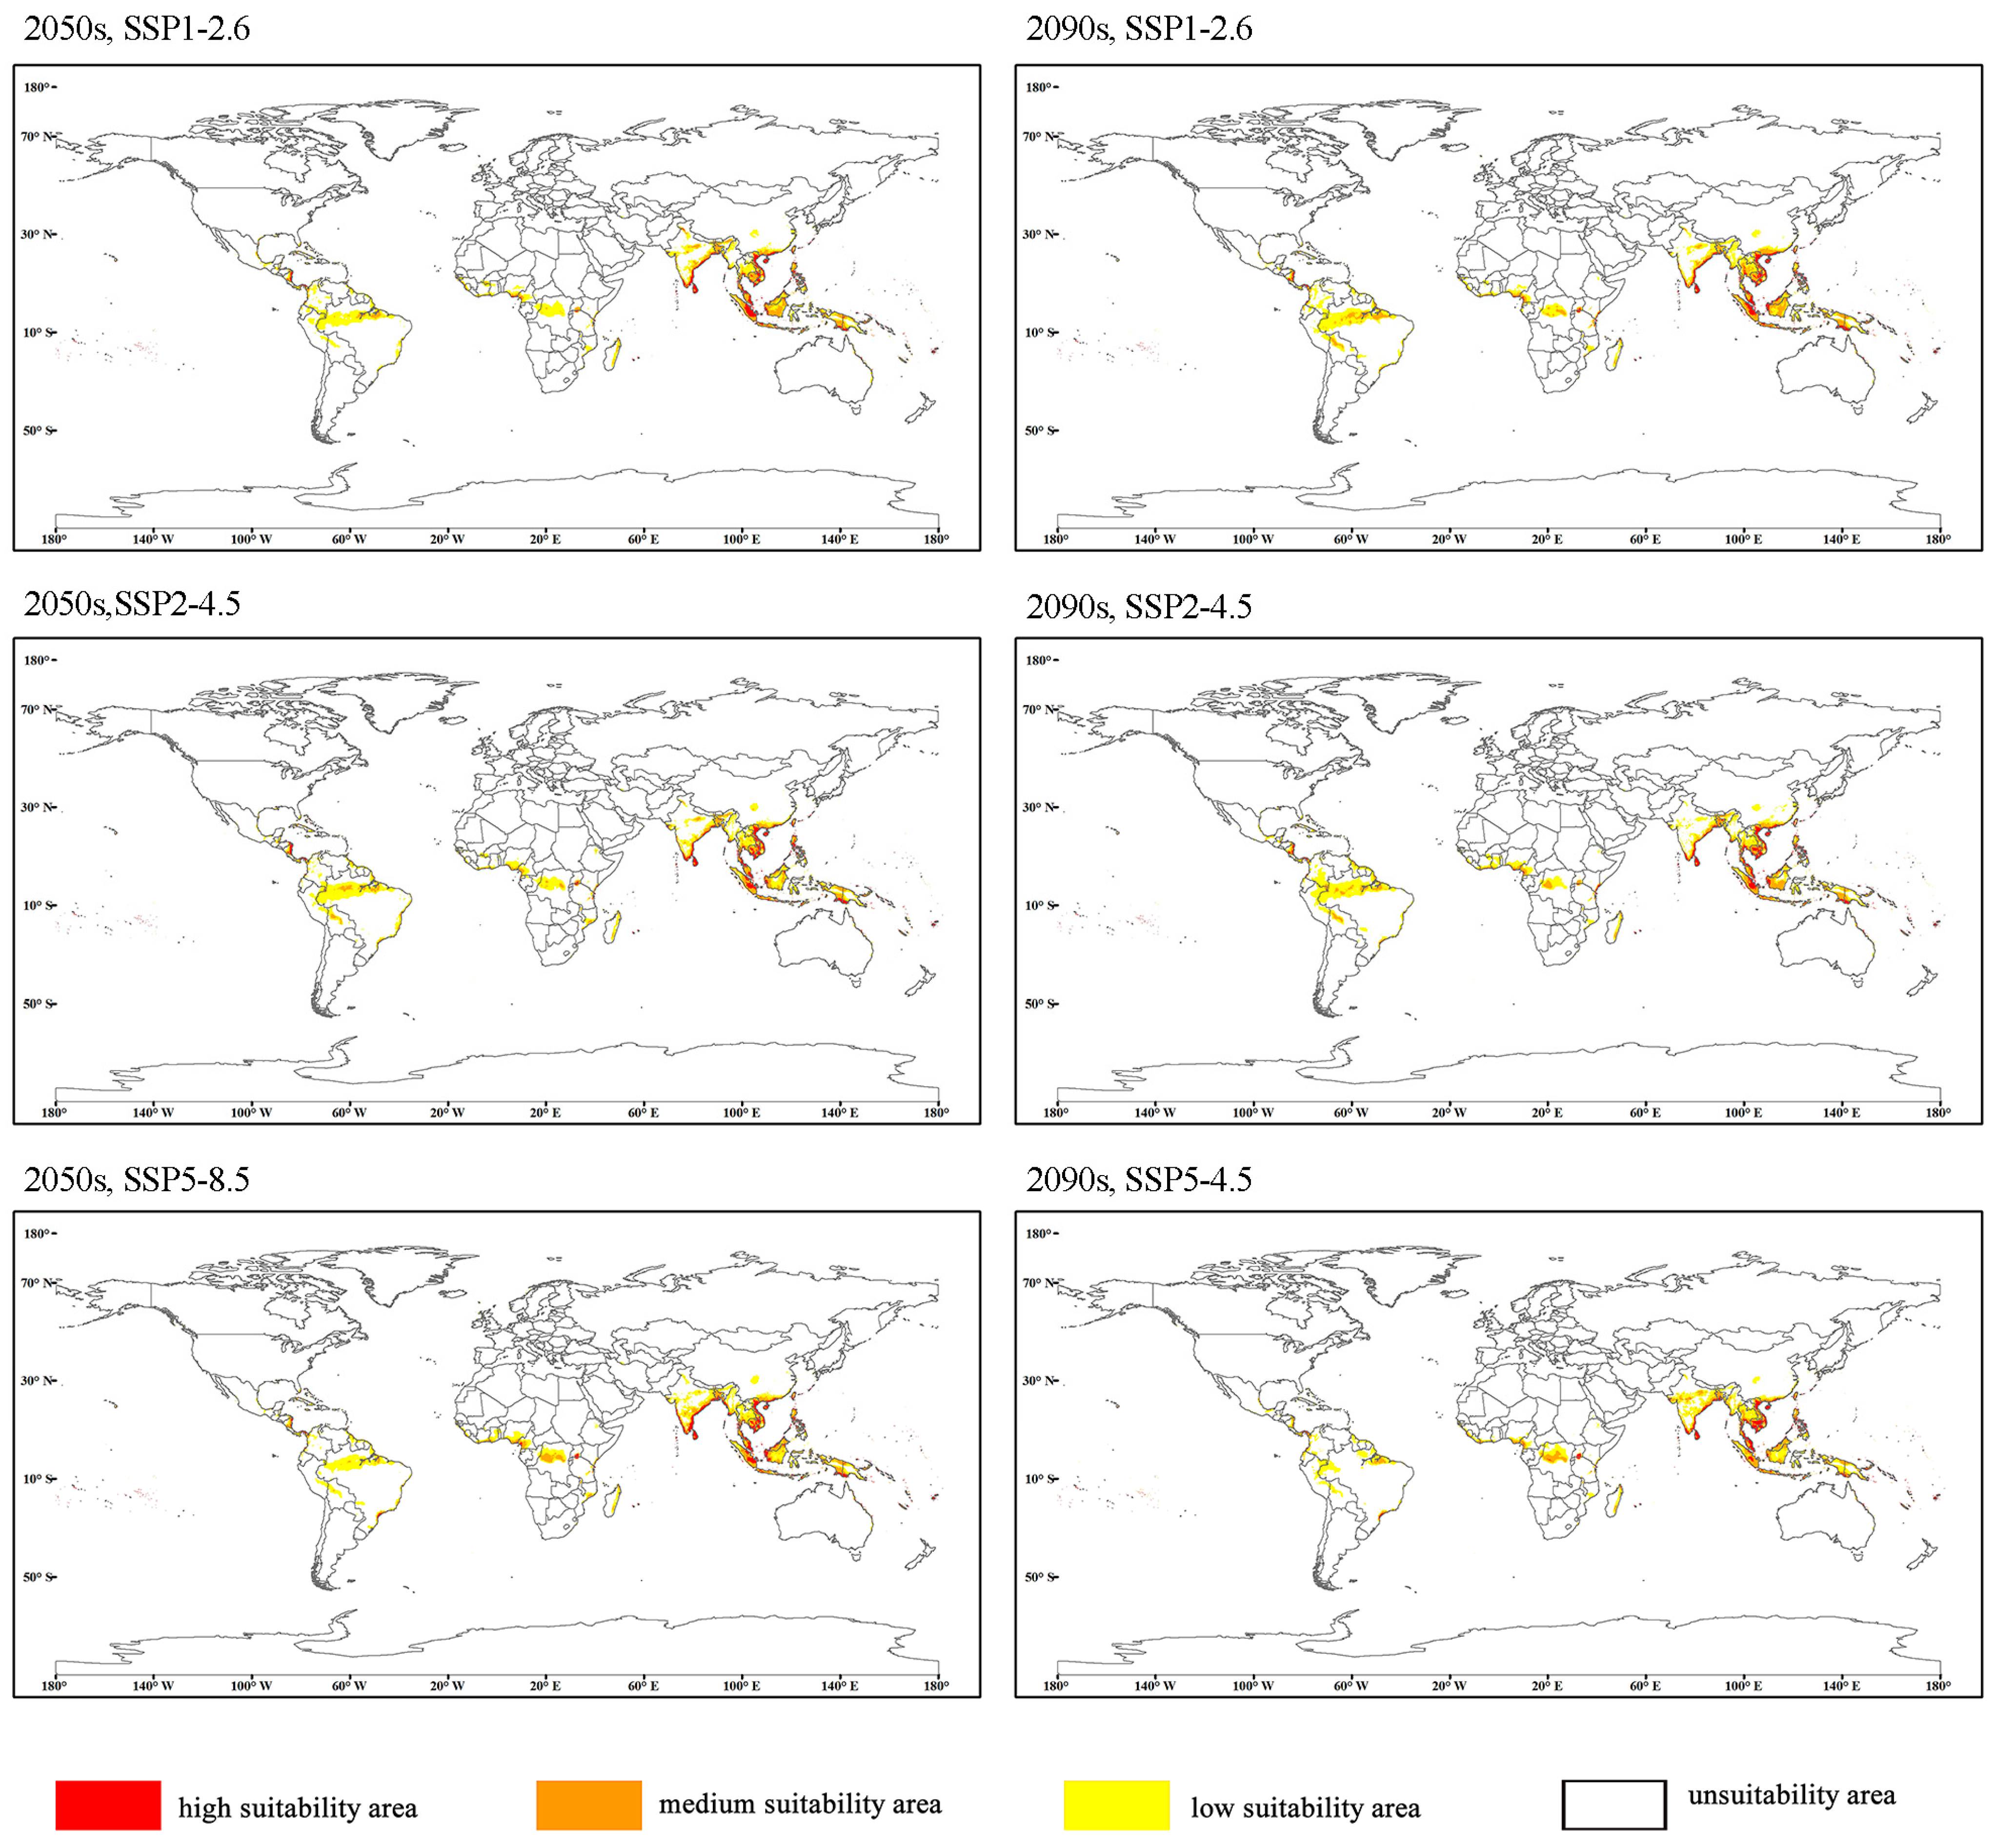
Figure 6 showed the global suitable habitat distribution of O. rhinoceros predicted by the MaxEnt model under the climate scenarios of SSP1-2.6, SSP2-4.5, and SSP5-8.5 in the 2050s and 2090s, respectively. Compared with the predicted results in the current climate, the predicted areas of high, medium, and low suitability changed significantly.
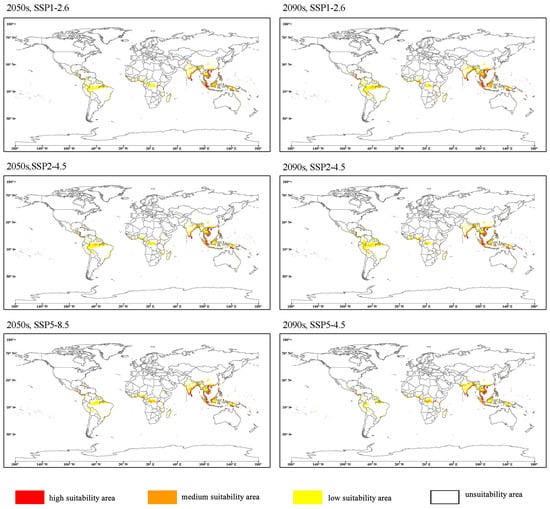
Figure 6.
Potential distribution of O. rhinoceros in future period (2050s, 2090s) under the SSP1-2.6, SSP2-4.5, and SSP5-8.5 climate change scenarios.
High, medium, and low suitability areas showed increases in all periods except for the period 2090s under SSP5-8.5, when the area of low suitability areas decreased compared to the current period (Table 4). Under the three scenarios of the 2050s, the increased range of the high and medium suitability areas is 4.87–25.02% and 12.09–14.66%, respectively. Among them, under the high emission scenario (SSP5-8.5), the high suitability area increased by 25.02%. The trends for high and medium suitability areas were reversed for the 2050s and 2090s. The largest increase in the area of high and medium suitability areas in 2050s was in the SSP5-8.5 scenario. The largest increase in the area of high and medium suitability areas in 2050s was in the SSP1-1.6 scenario, with increases of 14.54% and 32.67%, respectively.
Table 4.
The difference of suitable areas between current and future climatic conditions.
Compared with the current situation, there were obvious differences in the distribution of the total suitable area of each continent under different scenarios in the 2050s and 2090s. As shown in Table 5, the total suitable area in Africa expanded the most, the area in Oceania also showed an increasing trend, Europe showed an obvious shrinking trend, Asia showed an expanding trend under the SSP2-4.5 scenario in the 2090s, and South America and North America decreased under the SSP5-8.5 scenario (Table 5).
Table 5.
The current and future changes of total suitable area under different scenarios.
3.4. Environment Variables
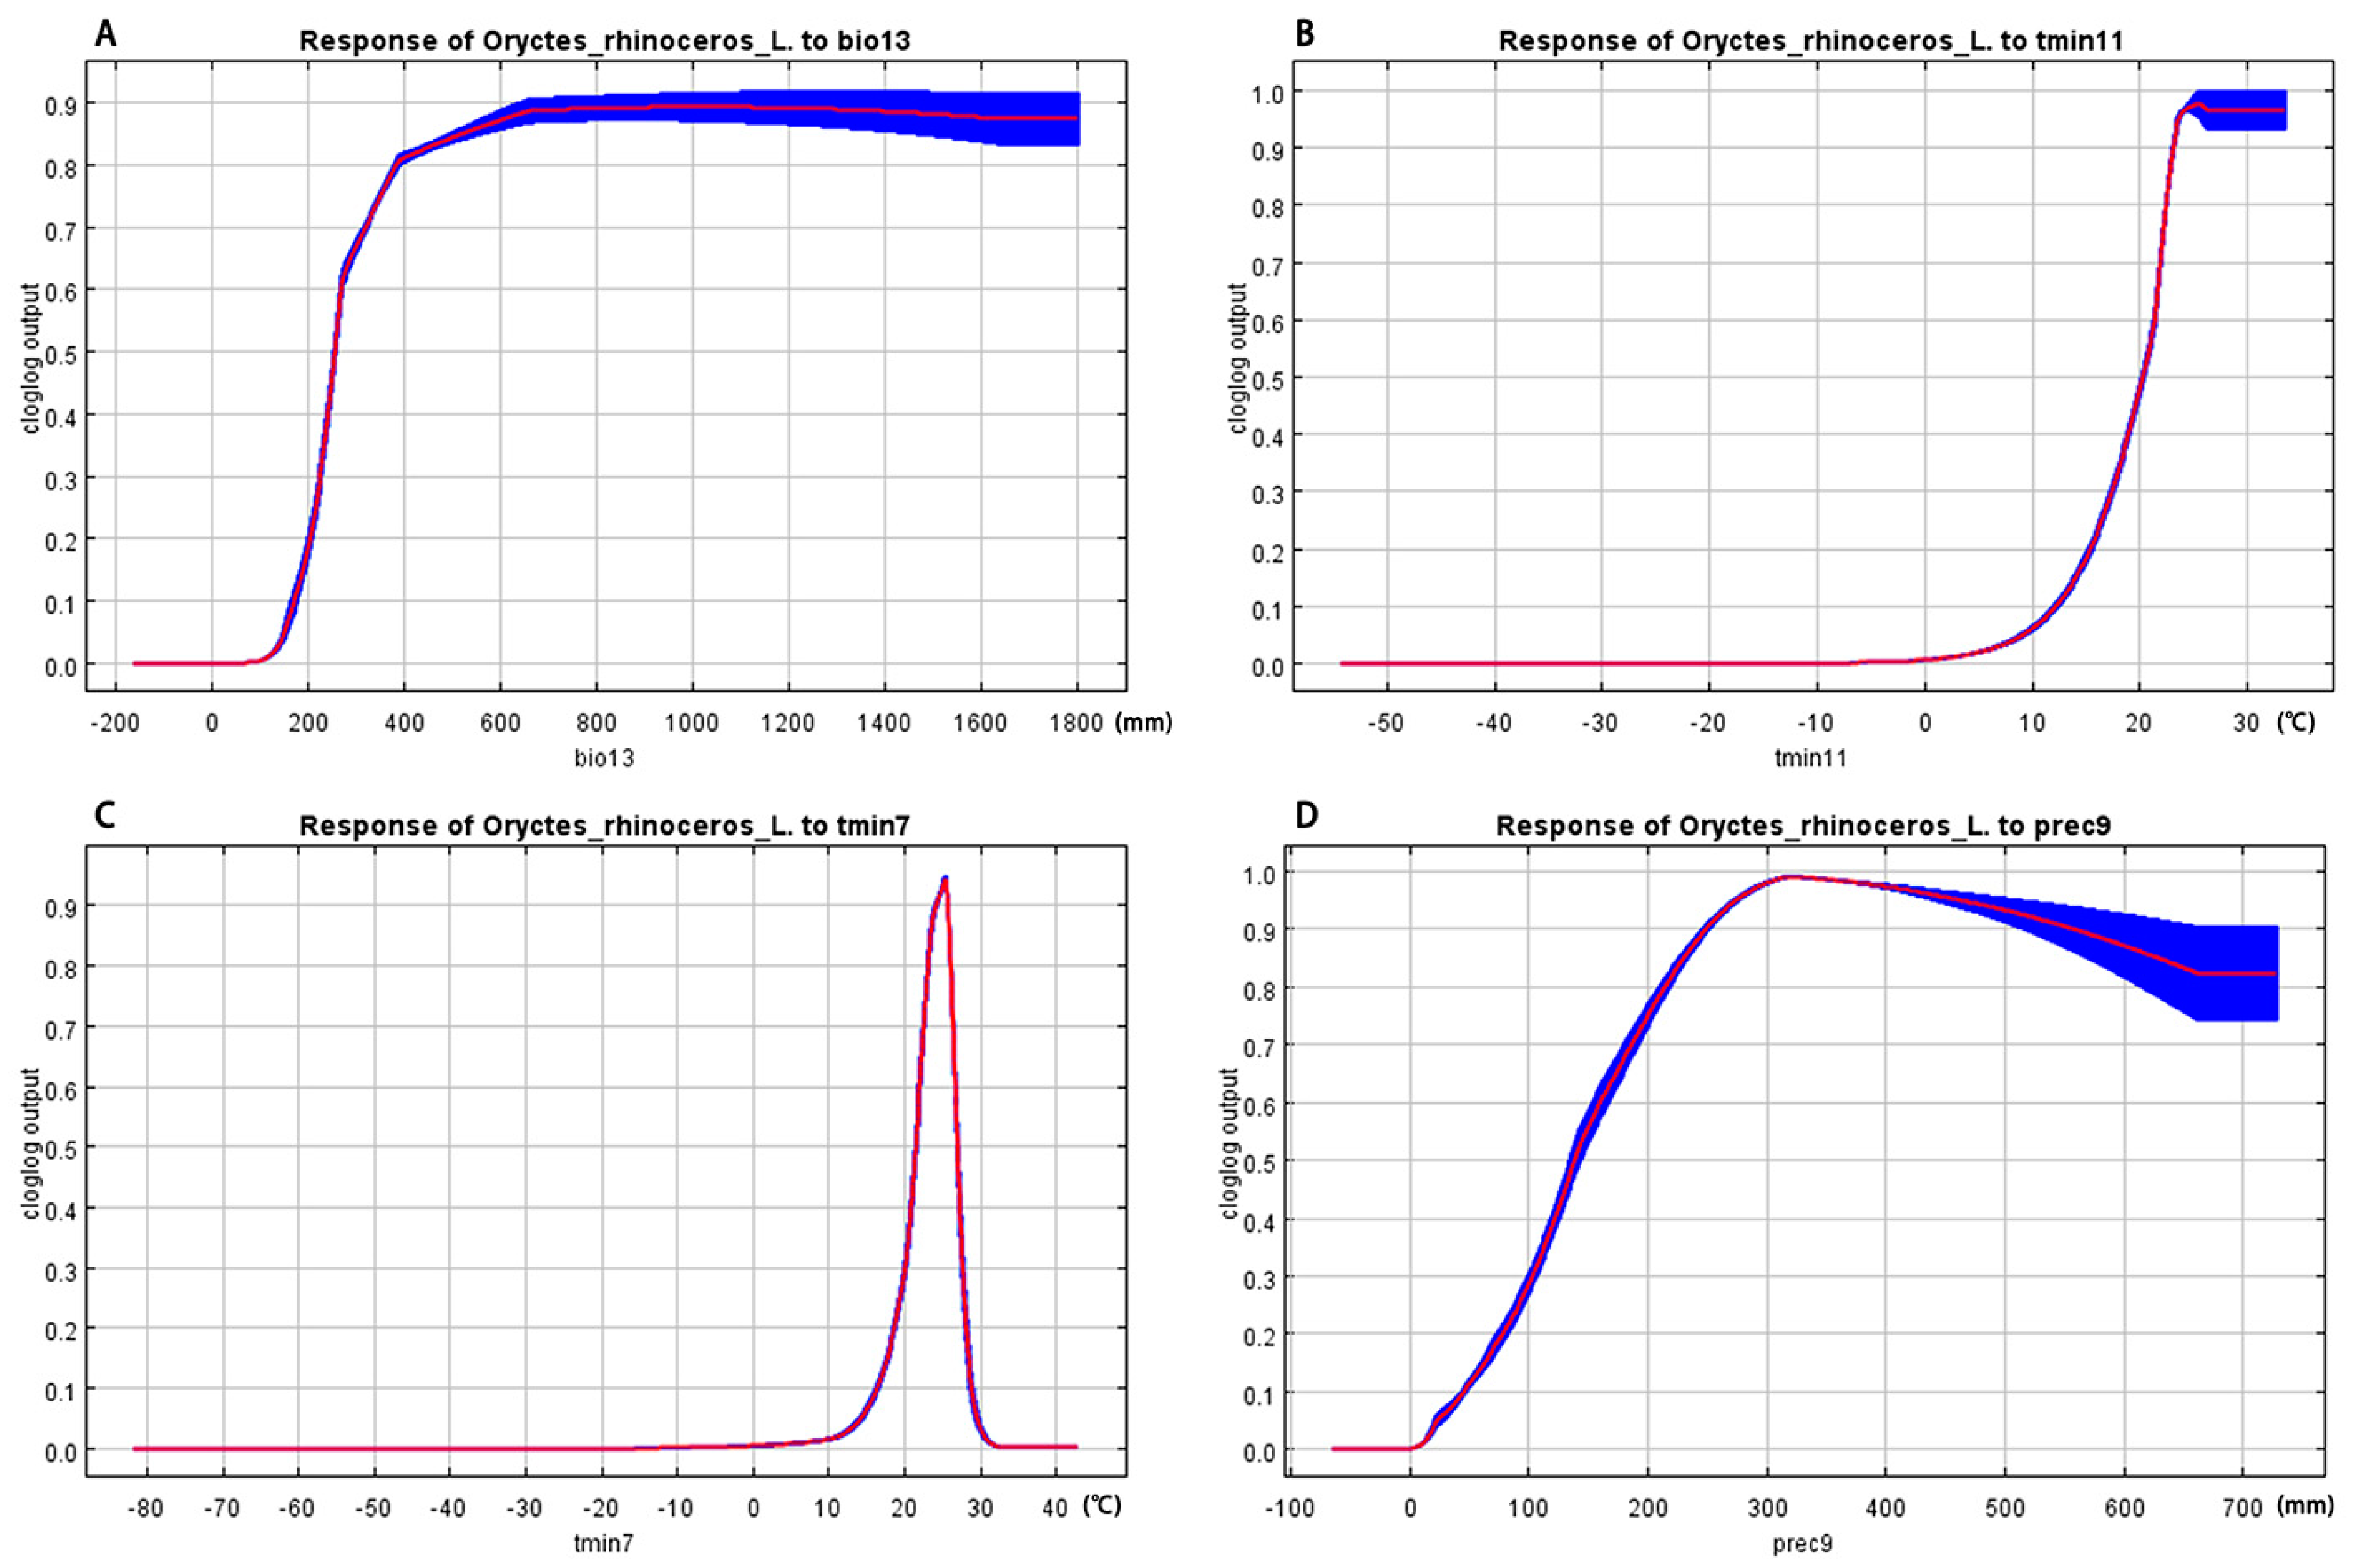
The Jackknife test method was used to analyze the environmental variables that have a significant impact on the distribution of O. rhinoceros. The results are shown in Figure 7. All predictors affected, to a certain extent, the current distribution of O. rhinoceros. The nine environmental variables indicated that temperature and rainfall played an important role in predicting suitable areas for O. rhinoceros, of which bio13 was the most important when used alone, followed by tmin11, tmin7, and prec9. Figure 8 showed how prediction suitability changed as the value of the selected variable increased. According to the classification method of the IPCC (IPCC, 2007), the range of suitable environmental variables for the distribution of O. rhinoceros was divided by a threshold of 0.33. Within the appropriate range, when the value of the environmental variable was lower than the optimal value, the distribution probability was positively correlated with the environmental variable; otherwise, it was negatively correlated.
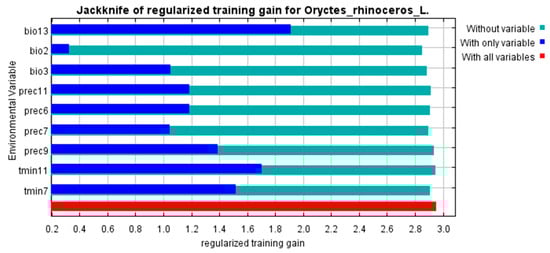
Figure 7.
Assessing the importance of environmental variables affecting the distribution of O. rhinoceros using the Jackknife test.
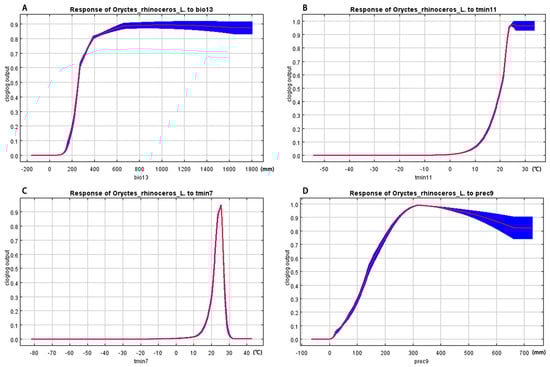
Figure 8.
Response curve between environmental variables and probability of existence. (A–D) are bio13, tmin11, tmin7, and prec9, respectively.
According to the response curve between environmental variables and species distribution probability in the MaxEnt model, the suitable range of environmental variables for the distribution of O. rhinoceros can be determined. When the value of Precipitation of Wettest Month was lower than 230.59 mm, the distribution probability of O. rhinoceros was lower than 0.33, the distribution probability gradually increased with the increase in precipitation, and the optimal value was 667.99 mm. When the value of Minimum Temperature of November was higher than 17.91 °C, it was suitable for the distribution of O. rhinoceros, and the most suitable temperature was 25.51 °C. When the value of the Minimum Temperature of July was in the range of 20.39–25.40 °C, with the increase in temperature, the predicted distribution probability of O. rhinoceros increased rapidly, and decreased rapidly when the temperature was higher than 25.40 °C; the suitable range was 20.39–27.47 °C. The value of the Precipitation of September was lower than 109.38 mm, and the distribution probability was lower than 0.33. When the value of the Precipitation of September increased to 322.76 mm, it reached the maximum suitable probability of 0.99.
4. Discussion
ENMs are important ecological research tools that are usually used to predict the impact of climate change on species distribution [37,38]. In the past 20 years, ENMs have developed rapidly. Currently, there are more than 33 niche models, and new algorithms are constantly being introduced in those models [39]. The MaxEnt model has the advantages of stable operation results and relatively convenient use [40]. It has low requirements in sample size and can fit complex models from small data sets, and the accuracy of the model will improve with the increase in sample size [21,41]. Elith et al. illustrated that when the prediction abilities of various niche models were compared, the Maxent model usually showed the best prediction performance [27]. Furthermore, numerous studies have declared that when comparing the prediction accuracy of commonly used niche models, the MaxEnt model has a better prediction effect [42,43,44]. At present, the MaxEnt model is widely used around the world [45]. Consequently, MaxEnt was typically chosen as one of the best simulation programs for species prediction. This study was based on the MaxEnt model to simulate the current and future potential global geographic distribution of O. rhinoceros. The performance and reliability of the MaxEnt model were evaluated by using the AUC method, which is currently a universal metric for evaluating diagnostic test results [46], and the results showed that the model could be used to simulate the potential distribution of O. rhinoceros.
Research has shown the impact of climate change on pest expansion [47]. As an invasive species, O. rhinoceros has now expanded to Oceania, the Americas, and the African continent [48]. The study predicted that the spread of O. rhinoceros will be more serious, which will undoubtedly cause greater losses to the ecological environment and forestry economy. Research on the potential distribution and range of pests caused by climate change is the key to scientific management and control decisions. The prediction results of the MaxEnt model declared that all continents except Antarctica were suitable for the growth of O. rhinoceros, mainly concentrated in tropical and subtropical countries where the climate was characterized by abundant precipitation, high temperature, and humidity. The high-suitability areas were mainly concentrated in South Asia, East Asia, Southeast Asia, and northern Oceania, and the high and middle suitability areas will show an obvious expansion trend in the future. This was consistent with previous related studies on this species [49]. However, when comparing the results of future changes in the suitable area, we found in our conclusion that the suitable area will expand in the future, but the results of Hao et al. showed a contraction. This may be related to the different contextual models we used. The SSP used in this paper is the latest released scenario, which is more informative. If certain areas are predicted to be highly suitable areas for O. rhinoceros and the beetles do occur, the agricultural departments should strengthen control work in these areas; if the region has not yet been simulated as a highly suitable area for the Asiatic rhinoceros beetle’s survival, the agricultural departments should focus on strengthening quarantine work to prevent its invasion.
The occurrence and spread of pests are strongly related to environmental factors, host factors, and agroecosystems. Other things being equal, climatic factors may be the key factor influencing the widespread distribution of pests [50,51]. In this study, the importance of the variables was determined using the Jackknife test method, and the most important environmental variables affecting O. rhinoceros mainly included bio13, tmin11, tmin7, and prec9. The response curves indicated that the probability of the presence of O. rhinoceros was extremely low when the Minimum Temperature of November was below 17.91 °C, indicating that low temperature was the key factor affecting the distribution of O. rhinoceros (Figure 8B). The range of suitable values for the Minimum Temperature of July was small (20.39–25.40 °C), which indicated that O. rhinoceros was highly sensitive to extreme temperature changes (Figure 8C). Bedford’s (1980) study showed that temperature affected the growth, reproduction, and distribution of O. rhinoceros, with a suitable range of 27–29 °C for larval development. Ainslie’s (1930) investigation found that O. rhinoceros was more sensitive to low temperatures than some insects. This is consistent with the results of our work (Figure 8B,C). Furthermore, lots of studies have shown that environmental humidity can affect the growth and development of insects [52,53,54]. The tolerance to humidity was relatively high, and O. rhinoceros can develop normally at a relative humidity of 85–95% [12], and the distribution of O. rhinoceros was positively correlated with humidity [55]. In addition, humidity was one of the important factors in the search for breeding sites for O. rhinoceros [56], and rainfall affected the foraging activity of adults at night [57]. The conclusion of this study pointed out that when the Precipitation of Wettest Month and Precipitation of September were higher than 230.59 mm and 109.38 mm, respectively, it was suitable for the distribution of O. rhinoceros (Figure 8A,D), which indicated that O. rhinoceros preferred to be distributed in environments with higher humidity within a certain range. This is consistent with the findings of some earlier studies. Overall, precipitation and temperature together limit the distribution pattern of O. rhinoceros.
The MaxEnt model has advantages in predicting the potential distribution of species, but there are still some limitations [34]. This study used limited occurrence data, only selected the corresponding environmental variables, and used the MaxEnt model to predict the global habitat of O. rhinoceros. The distribution of the species was not only limited by environmental conditions but also affected by other factors, such as interspecific relationships, human activities, altitude, and host plants [58]. Therefore, biotic and abiotic factors, such as human activities, hosts, etc., can be incorporated into the model when studying the suitable habitat of O. rhinoceros in the future, and further studies can be carried out in combination with more ENMs.
5. Conclusions
In this work, the MaxEnt model and ArcGIS technology were combined to simulate the global suitability area of the Asiatic rhinoceros beetle, Oryctes rhinoceros, by using distribution point information and climate factors. The results showed that the most important environmental variables driving the global distribution of O. rhinoceros were Precipitation of Wettest Month (bio13), Minimum Temperature of July (tmin7), Minimum Temperature of November (tmin11), and Precipitation of September (prec9). The suitable area was mainly distributed in 30° N–30° S, and the distribution range of O. rhinoceros in the middle and the high suitability areas showed a trend of further expansion. The relevant departments should take appropriate control measures to strengthen the sustainable management of invasive species. Our study will expand the understanding of the environmental drivers of the distribution of O. rhinoceros and provide a reference for the prevention and control of potential invasive areas of O. rhinoceros transmission or potential invasion.
Author Contributions
Conceptualization, C.F. and Q.Q.; methodology, X.D.; software, Z.Z.; validation, X.D. and Z.Z.; investigation, D.X.; data curation, D.X.; writing—original draft preparation, C.F., Q.Q. and X.D.; writing—review and editing, Z.Z. and D.X. All authors have read and agreed to the published version of the manuscript.
Funding
This research was funded by Sichuan Province Science and Technology Support Program (2022NSFSC0986), China West Normal University Support Program (20A007, 20E051, 21E040 and 22kA011).
Data Availability Statement
The data supporting the results are available in a public repository at: https://doi.org/10.5281/zenodo.5774066 (accessed on 12 January 2024).
Conflicts of Interest
The authors declare no conflict of interest.
References
- Aidoo, O.F.; Corcino Souza, P.G.; Da Silva, R.S.; Santana, P.A., Jr.; Picanco, M.C.; Kyerematen, R.; Setamou, M.; Ekesi, S.; Borgemeister, C. Climate-induced range shifts of invasive species (Diaphorina citri Kuwayama). Pest Manag. Sci. 2022, 78, 2534–2549. [Google Scholar] [CrossRef] [PubMed]
- Bedford, G. Advances in the control of rhinoceros beetle, Oryctes rhinoceros in oil palm. J. Oil Palm Res. 2014, 26, 183–194. [Google Scholar]
- Pradeep Kumar, R.; Dinesh Babu, K.V.; Evans, D.A. Isolation, characterization and mode of action of a larvicidal compound, 22-hydroxyhopane from Adiantum latifolium Lam. against Oryctes rhinoceros Linn. Pestic. Biochem. Phys. 2019, 153, 161–170. [Google Scholar] [CrossRef]
- Hao-jun, C.; Yong-sen, C.; Xiao-dong, S.; Quan-guang, Z.; Chun-tian, W.; He-shuai, L.I. A preliminary survey of Cocos nucifera diseases and insect pests in Guangxi Zhuang Autonomic Region and Guangdong province. Guangdong Agric. Sci. 2011, 38, 73–75. [Google Scholar] [CrossRef]
- Gopal, M.; Gupta, A.; Sathiamma, B.; Nair, C.P. Control of the coconut pest Oryctes rhinoceros L. using the Oryctes virus. Int. J. Trop Insect Sc. 2001, 21, 93–101. [Google Scholar] [CrossRef]
- Kumara, N.T.; Muniyappa, C.; Kandakoor, S.; Chakravarthy, A. Status and Management of Three Major Insect Pests of Coconut in the Tropics and Subtropics; Springer Link: Berlin, Germany, 2015; pp. 359–381. [Google Scholar] [CrossRef]
- Moore, A.; Jackson, T.; Quitugua, R.; Bassler, P.; Campbell, R. Coconut Rhinoceros Beetles (Coleoptera: Scarabaeidae) Develop in Arboreal Breeding Sites in Guam. Fla Entomol. 2015, 98, 1012–1014. [Google Scholar] [CrossRef]
- Lin, M.; Han, Y.; Li, W.; Liu, F.; Xu, W.; Ao, S.; Wang, X. Monitor and survey of pest insects and deseases of coconut trees in Hainan. Plant Quar. 2010, 24, 21–24. [Google Scholar] [CrossRef]
- Bedford, G. Biology and Management of Palm Dynastid Beetles: Recent Advances. Annu. Rev. Entomol. 2013, 58, 353–372. [Google Scholar] [CrossRef]
- Etebari, K.; Hereward, J.; Sailo, A.; Ahoafi, E.; Tautua, R.; Tsatsia, H.; Jackson, G.; Furlong, M. Genetic structure of the Coconut Rhinoceros Beetle (Oryctes rhinoceros) population and the incidence of its biocontrol agent (Oryctes rhinoceros nudivirus) in the South Pacific Islands. BioRxiv, 2020. [Google Scholar] [CrossRef]
- Etebari, K.; Parry, R.; Beltran, M.J.; Furlong, M. Transcription profile and genomic variation of Oryctes rhinoceros nudivirus (OrNV) in Coconut Rhinoceros Beetle. J. Virol. 2020, 94, 10–1128. [Google Scholar] [CrossRef]
- Bedford, G. Biology, Ecology, and Control of Palm Rhinoceros Beetles. Annu. Rev. Entomol. 1980, 25, 309–339. [Google Scholar] [CrossRef]
- Dhileepan, K. Incidence and intensity of Rhinoceros beetle infestation in the oil palm plantations in India. J. Plant. Crops 1988, 16, 126–129. [Google Scholar]
- Zhong, B.; Lv, C.; LI, H.; Wang, D.; Qin, W.; Wang, Z. Oviposition selection of Oryctes rhinoceros among different host stems. J. Environ. Entomol. 2013, 35, 13–17. [Google Scholar]
- Gopal, M.; Gupta, A.; Thomas, G.V. Prospects of using Metarhizium anisopliae to check the breeding of insect pest, Oryctes rhinoceros L. in coconut leaf vermicomposting sites. Bioresour. Technol. 2006, 97, 1801–1806. [Google Scholar] [CrossRef] [PubMed]
- Oehlschlager, C. Optimizing Trapping of Palm Weevils and Beetles. Acta Hort. 2007, 736, 347–368. [Google Scholar] [CrossRef]
- Widihastuty; Tobing, M.C.; Marheni; Kuswardani, R.A.; Fudholi, A. Biological aspects of Myopopone castanea on it’s prey Oryctes rhinoceros larvae. J. Insect. Physiol. 2020, 125, 104089. [Google Scholar] [CrossRef]
- Finch, D.M.; Butler, J.L.; Runyon, J.B.; Fettig, C.J.; Kilkenny, F.F.; Jose, S.; Frankel, S.J.; Cushman, S.A.; Cobb, R.C.; Dukes, J.S.; et al. Effects of Climate Change on Invasive Species. In Invasive Species in Forests and Rangelands of the United States: A Comprehensive Science Synthesis for the United States Forest Sector; Poland, T.M., Patel-Weynand, T., Finch, D.M., Miniat, C.F., Hayes, D.C., Lopez, V.M., Eds.; Springer International Publishing: Cham, Switzerland, 2021; pp. 57–83. [Google Scholar]
- Peterson, A.; Soberón, J.; Pearson, R.; Anderson, R.; Martínez-Meyer, E.; Nakamura, M.; Araújo, M. Ecological Niches and Geographic Distributions; Princeton University Press: Princeton, NJ, USA, 2011; Volume 49. [Google Scholar] [CrossRef]
- Zhu, G.; Guoqing, L.; Bu, W.; Yubao, G. Ecological niche modeling and its applications in biodiversity conservation. Biodivers. Sci. 2013, 21, 90–98. [Google Scholar] [CrossRef]
- Phillips, S.J.; Anderson, R.P.; Schapire, R.E. Maximum entropy modeling of species geographic distributions. Ecol. Model 2006, 190, 231–259. [Google Scholar] [CrossRef]
- Booth, T.; Nix, H.; Busby, J.; Hutchinson, M.F. BIOCLIM: The first species distribution modelling package, its early applications and relevance to most current MAXENT studies. Divers Distrib. 2014, 20, 1–9. [Google Scholar] [CrossRef]
- Stockwell, D.; Peters, D. The GARP modelling system: Problems and solutions to automated spatial prediction. Int. J. Geogr. Inf. Sci. 1999, 13, 143–158. [Google Scholar] [CrossRef]
- Sutherst, R.W.; Maywald, G.F. A computerised system for matching climates in ecology. Agric. Ecosyst. Environ. 1985, 13, 281–299. [Google Scholar] [CrossRef]
- Carpenter, G.; Gillison, A.; Winter, J. DOMAIN: A flexible modelling procedure for mapping potential distributions of plants and animals. Biodivers. Conserv. 1993, 2, 667–680. [Google Scholar] [CrossRef]
- Yunsheng, W. Application of ROC curve analysis in evaluating the performance of alien species’ potential distribution models. Biodivers. Sci. 2007, 15, 365. [Google Scholar] [CrossRef]
- Elith, J.; Graham, C.; Anderson, R.; Dudík, M.; Ferrier, S.; Guisan, A.; Hijmans, R.; Huettmann, F.; Leathwick, J.; Lehmann, A.; et al. Novel methods improve prediction of species’ distributions from occurence data. Ecography 2006, 29, 129–151. [Google Scholar] [CrossRef]
- Lv, C.; Zhong, B.; Qin, W.; Yan, W. Risk analysis and control strategy of Oryctes rhinoceros on Elaeis guineensis and Cocos nucifera. J. Biosaf. 2020, 29, 39–43. [Google Scholar]
- Tomie, T.; Ishibashi, J.; Furukawa, S.; Kobayashi, S.; Sawahata, R.; Asaoka, A.; Tagawa, M.; Yamakawa, M. Scarabaecin, a novel cysteine-containing antifungal peptide from the rhinoceros beetle, Oryctes rhinoceros. Biochem. Bioph. Res. Co. 2003, 307, 261–266. [Google Scholar] [CrossRef]
- Xu, D.; Zhuo, Z.; Li, X.; Wang, R. Distribution and invasion risk assessment of Oryctes rhinoceros (L.) in China under changing climate. J. Appl. Entomol. 2022, 146, 385–395. [Google Scholar] [CrossRef]
- Yan, H.; Feng, L.; Zhao, Y.; Feng, L.; Wu, D.; Zhu, C. Prediction of the spatial distribution of Alternanthera philoxeroides in China based on ArcGIS and MaxEnt. Glob. Ecol. Conserv. 2020, 21, e856. [Google Scholar] [CrossRef]
- Zhu, G.; Qiang, L.; Yubao, G. Improving ecological niche model transferability to predict the potential distribution of invasive exotic species. Biodivers. Sci. 2014, 22, 223. [Google Scholar] [CrossRef]
- Sillero, N. What does ecological modelling model? A proposed classification of ecological niche models based on their underlying methods. Ecol. Model 2011, 222, 1343–1346. [Google Scholar] [CrossRef]
- Xu, D.; Zhuo, Z.; Wang, R.; Ye, M.; Pu, B. Modeling the distribution of Zanthoxylum armatum in China with MaxEnt modeling. Glob. Ecol. Conserv. 2019, 19, e691. [Google Scholar] [CrossRef]
- Walden-Schreiner, C.; Leung, Y.; Kuhn, T.; Newburger, T.; Tsai, W. Environmental and managerial factors associated with pack stock distribution in high elevation meadows: Case study from Yosemite National Park. J. Environ. Manag. 2017, 193, 52–63. [Google Scholar] [CrossRef] [PubMed]
- Castex, V.; Beniston, M.; Calanca, P.; Fleury, D.; Moreau, J. Pest management under climate change: The importance of understanding tritrophic relations. Sci. Total Environ. 2018, 616–617, 397–407. [Google Scholar] [CrossRef]
- Booth, T.H. Species distribution modelling tools and databases to assist managing forests under climate change. For. Ecol. Manag. 2018, 430, 196–203. [Google Scholar] [CrossRef]
- Laeseke, P.; Martinez, B.; Mansilla, A.; Bischof, K. Correction to: Future range dynamics of the red alga Capreolia implexa in native and invaded regions: Contrasting predictions from species distribution models versus physiological knowledge. Biol. Invasions 2021, 23, 3279–3280. [Google Scholar] [CrossRef]
- Carlson, C.J. embarcadero: Species distribution modelling with Bayesian additive regression trees inr. Methods Ecol. Evol. 2020, 11, 850–858. [Google Scholar] [CrossRef]
- Ma, B.; Sun, J. Predicting the distribution of Stipa purpurea across the Tibetan Plateau via the MaxEnt model. BMC Ecol. 2018, 18, 10. [Google Scholar] [CrossRef]
- Yi, Y.; Cheng, X.; Yang, Z.; Wieprecht, S.; Zhang, S.; Wu, Y. Evaluating the ecological influence of hydraulic projects: A review of aquatic habitat suitability models. Renew. Sustain. Energy Rev. 2017, 68, 748–762. [Google Scholar] [CrossRef]
- Cao, X.; Qian, G.; Hu, B.; Liu, F. [Prediction of potential suitable distribution area of Flaveria bidentis in China based on niche models]. Ying Yong Sheng Tai Xue Bao = J. Appl. Ecol./Zhongguo Sheng Tai Xue Xue Hui Zhongguo Ke Xue Yuan Shenyang Ying Yong Sheng Tai Yan Jiu Suo Zhu Ban 2010, 21, 3063–3069. [Google Scholar]
- Li, B.; Wei, W.; Ma, J.; Zhang, R. Maximum entropy niche-based modeling (Maxent) of potential geographical distributions of fruit flies Dacus bivittatus, D. ciliatus and D. vertebrates (Diptera: Tephritidae). Acta Entomol. Sin. 2009, 52, 1122–1131. [Google Scholar]
- Zhang, H.; Luo, D.; Xidong, M.; Xu, M.; Wei, H.; Luo, J.; Zhang, J.; Hu, Y. Predicting the potential suitable distribution area of the apple snail Pomacea canaliculata in China based on multiple ecological niche models. Ying Yong Sheng Tai Xue Bao = J. Appl. Ecol. / Zhongguo Sheng Tai Xue Xue Hui Zhongguo Ke Xue Yuan Shenyang Ying Yong Sheng Tai Yan Jiu Suo Zhu Ban 2016, 27, 1277–1284. [Google Scholar] [CrossRef]
- Wang, R.; Wang, Y.; Chen, D.; Guo, X.; Li, Q.; Wang, M. Analysis of the potential distribution of the Asian citrus psyllid, Diaphorina citri Kuwayama in Southwest China using the MaxEnt model. Plant Prot. 2021, 47, 84–90. [Google Scholar]
- Mohammadi, S.; Ebrahimi, E.; Shahriari Moghadam, M.; Bosso, L. Modelling current and future potential distributions of two desert jerboas under climate change in Iran. Ecol. Inf. 2019, 52, 7–13. [Google Scholar] [CrossRef]
- Heya, H.; Khamis, F.; Onyambu, G.; Akutse, K.; Mohamed, S.; Kimathi, E.; Ombura, F.; Ekesi, S.; Dubois, T.; Subramanian, S.; et al. Characterization and risk assessment of the invasive papaya mealybug, Paracoccus marginatus, in Kenya under changing climate. J. Appl. Entomol. 2020, 144, 442–458. [Google Scholar] [CrossRef]
- Sunday, C.E.; Olowu, R.A.; Moronkola, B.A.; Tovide, O.O.; Denloye, A.A.; Awokoya, K.N.; Sunday, C.E.; Olujimi, O.O. Assessment of Proximate and Mineral Status of Rhinoceros Beetle Larva, Oryctes Rhinoceros Linnaeus (1758) (Coleoptera: Scarabaeidae) from Itokin, Lagos State, Nigeria. Res. J. Environ. Sci. 2012, 6, 118–124. [Google Scholar] [CrossRef]
- Hao, M.; Aidoo, O.F.; Qian, Y.; Wang, D.; Ding, F.; Ma, T.; Tettey, E.; Ninsin, K.D.; Osabutey, A.F.; Borgemeister, C. Global potential distribution of Oryctes rhinoceros, as predicted by Boosted Regression Tree model. Glob. Ecol. Conserv. 2022, 37, e2175. [Google Scholar] [CrossRef]
- Monteith, J.L. Agricultural Meteorology: Evolution and application. Agric. For. Meteorol. 2000, 103, 5–9. [Google Scholar] [CrossRef]
- Qin, J.; Yang, X.; Yang, Z.; Luo, J.; Lei, X. New technology for using meteorological information in forest insect pest forecast and warning systems. Pest Manag. Sci. 2017, 73, 2509–2518. [Google Scholar] [CrossRef]
- Chang, X.N.; Gao, H.J.; Chen, F.J.; Zhai, B.P. Effects of environmental moisture and precipitation on insects: A review. Chin. J. Ecol. 2008, 27, 619–625. [Google Scholar]
- Wang, L. Study on the Insect Diversity in Different Environment in Xiaowutai Mountain Natural Reserve Areas. Master’s Thesis, Hebei Agricultural University, Baoding, China, 2013. [Google Scholar]
- Xu, D.; Li, X.; Jin, Y.; Zhuo, Z.; Yang, H.; Hu, J.; Wang, R. Influence of climatic factors on the potential distribution of pest Heortia vitessoides Moore in China. Glob. Ecol. Conserv. 2020, 23, e1107. [Google Scholar] [CrossRef]
- Jacob, T.K.; Bhumannavar, B.S. The coconut rhinoceros beetle Oryctes rhinoceros L.–its incidence and extent of palm damage in the Andaman and Nicobar Islands (India). Trop. Pest Manag. 1991, 37, 80–84. [Google Scholar] [CrossRef]
- Kamarudin, N. Immigration and activity of Oryctes rhinoceros within a small oil palm replanting area. J. Oil Palm Res. 2004, 16, 64–77. [Google Scholar]
- Young, E.C. The rhinoceros beetle project: History and review of the research programme. Agric. Ecosyst. Environ. 1986, 15, 149–166. [Google Scholar] [CrossRef]
- Jalaeian, M.; Golizadeh, A.; Sarafrazi, A.; Naimi, B. Inferring climatic controls of rice stem borers’ spatial distributions using maximum entropy modelling. J. Appl. Entomol. 2018, 142, 388–396. [Google Scholar] [CrossRef]

Disclaimer/Publisher’s Note: The statements, opinions and data contained in all publications are solely those of the individual author(s) and contributor(s) and not of MDPI and/or the editor(s). MDPI and/or the editor(s) disclaim responsibility for any injury to people or property resulting from any ideas, methods, instructions or products referred to in the content. |
© 2024 by the authors. Licensee MDPI, Basel, Switzerland. This article is an open access article distributed under the terms and conditions of the Creative Commons Attribution (CC BY) license (https://creativecommons.org/licenses/by/4.0/).