
An Interspecific Assessment of Bergmann’s Rule in Tenebrionid Beetles (Coleoptera, Tenebrionidae) along an Elevation Gradient


Abstract
Simple Summary
Abstract
1. Introduction
2. Materials and Methods
3. Results
4. Discussion
5. Conclusions
Supplementary Materials
Funding
Data Availability Statement
Acknowledgments
Conflicts of Interest
References
- Bergmann, C. Über die Verhältnisse der Wärmeökonomie der Thiere zu ihrer Grösse. Göttinger Stud. 1847, 1, 595–708. [Google Scholar]
- Ashton, K.G. Are ecological and evolutionary rules being dismissed prematurely? Divers. Distrib. 2001, 7, 289–295. [Google Scholar] [CrossRef]
- Lomolino, M.V.; Riddle, B.R.; Whittaker, R.J.; Brown, J.H. Biogeography, 4th ed.; Sinauer Associates: Sunderland, MA, USA, 2010. [Google Scholar]
- McNab, B.K. On the ecological significance of Bergmann’s rule. Ecology 1971, 52, 845–854. [Google Scholar] [CrossRef]
- Meiri, S.; Dayan, T. On the validity of Bergmann’s rule. J. Biogeogr. 2003, 30, 331–351. [Google Scholar] [CrossRef]
- Meiri, S.; Thomas, G.H. The geography of body size–challenges of the interspecific approach. Glob. Ecol. Biogeogr. 2007, 16, 689–693. [Google Scholar] [CrossRef]
- Meiri, S. Bergmann’s Rule—What’s in a name? Glob. Ecol. Biogeogr. 2011, 20, 203–207. [Google Scholar] [CrossRef]
- Watt, C.; Mitchell, S.; Salewski, V. Bergmann’s rule; A concept cluster? Oikos 2010, 119, 89–100. [Google Scholar] [CrossRef]
- Olalla-Tárraga, M.Á. “Nullius in Bergmann” or the pluralistic approach to ecogeographical rules: A reply to Watt et al. (2010). Oikos 2011, 120, 1441–1444. [Google Scholar] [CrossRef]
- Watt, C.; Salewski, V. Bergmann’s rule encompasses mechanism: A reply to Olalla-Ta′rraga. Oikos 2011, 120, 1445–1447. [Google Scholar] [CrossRef]
- Bogin, B.; Hermanussen, M.; Scheffler, C. Bergmann’s rule is a “just-so” story of human body size. J. Physiol. Anthropol. 2022, 41, 15. [Google Scholar] [CrossRef]
- McQueen, A.; Klaassen, M.; Tattersall, G.J.; Atkinson, R.; Jessop, R.; Hassell, C.J.; Christie, M.; Victorian Wader Study Group; Australasian Wader Studies Group; Symonds MRE. Thermal adaptation best explains Bergmann’s and Allen’s rules across ecologically diverse shorebirds. Nat. Commun. 2022, 13, 4727. [Google Scholar] [CrossRef] [PubMed]
- He, J.; Tu, J.; Yu, J.; Jiang, H. A global assessment of Bergmann’s rule in mammals and birds. Glob. Change Biol. 2023, 29, 5199–5210. [Google Scholar] [CrossRef] [PubMed]
- Salewski, V.; Watt, C. Bergmann’s rule: A biophysiological rule examined in birds. Oikos 2017, 126, 161–172. [Google Scholar] [CrossRef]
- Mayr, E. Geographical character gradients and climatic adaptation. Evolution 1956, 10, 105–108. [Google Scholar] [CrossRef]
- James, F.C. Geographic size variation in birds and its relationship to climate. Ecology 1970, 51, 365–390. [Google Scholar] [CrossRef]
- Shelomi, M. Where are we now? Bergmann’s rule sensu lato in insects. Am. Nat. 2012, 180, 511–519. [Google Scholar] [CrossRef]
- Partridge, L.; Coyne, J.A. Bergmann’s rule in ectotherms: Is it adaptive? Evolution 1997, 51, 632–635. [Google Scholar] [CrossRef]
- Ashton, K.G.; Feldman, C.R. Bergmann’s rule in nonavian reptiles: Turtles follow it, lizards and snakes reverse it. Evolution 2003, 57, 1151–1163. [Google Scholar]
- Blanckenhorn, W.U.; Demont, M. Bergmann and converse Bergmann latitudinal clines in arthropods: Two ends of a continuum? Integr. Comp. Biol. 2004, 44, 413–424. [Google Scholar] [CrossRef]
- Vinarski, M. On the applicability of Bergmann’s rule to ectotherms: The state of the art. Biol. Bull. Rev. 2014, 4, 232–242. [Google Scholar] [CrossRef]
- Rivas, J.; Quiero, A.; Penna, M.; Velásquez, N.A. Body-size variation across environmental gradients in an ectothermic organism: An intraspecific approach to ecogeographic patterns. Herpetologica 2018, 74, 191–198. [Google Scholar] [CrossRef]
- Baranov, V.; Jourdan, J.; Hunter-Moffatt, B.; Noori, S.; Schölderle, S.; Haug, J.T. Global size pattern in a group of important ecological indicators (Diptera, Chironomidae) is driven by latitudinal temperature gradients. Insects 2022, 13, 34. [Google Scholar] [CrossRef] [PubMed]
- Lira, A.F.; Andrade, A.R.; Foerster, S.I. Latitudinal trends in scorpion assemblages of Brazilian Atlantic forest: Do the Rapoport’s and Bergmann’s rules apply? In Neotropical Gradients and Their Analysis; Springer: Berlin/Heidelberg, Germany, 2023; pp. 179–203. [Google Scholar]
- Rendoll-Cárcamo, J.; Gañán, M.; Madriz, R.; Convey, P.; Contador, T. Wing reduction and body size variation along a steep elevation gradient: A case study with Magellanic sub-Antarctic mayflies and stoneflies. Front. Ecol. Evol. 2023, 11, 1188889. [Google Scholar] [CrossRef]
- Ramírez-Delgado, V.H.; Sanabria-Urbán, S.; Serrano-Meneses, M.A.; Cueva del Castillo, R. The converse to Bergmann’s rule in bumblebees, a phylogenetic approach. Ecol. Evol. 2016, 6, 6160–6169. [Google Scholar] [CrossRef] [PubMed]
- Baranovská, E.; Knapp, M. Steep converse Bergmann’s cline in a carrion beetle: Between-and within-population variation in body size along an elevational gradient. J. Zool. 2018, 304, 243–251. [Google Scholar] [CrossRef]
- Pallarés, S.; Lai, M.; Abellán, P.; Ribera, I.; Sánchez-Fernández, D. An interspecific test of Bergmann’s rule reveals inconsistent body size patterns across several lineages of water beetles (Coleoptera: Dytiscidae). Ecol. Entomol. 2019, 44, 249–254. [Google Scholar] [CrossRef]
- Gérard, M.; Vanderplanck, M.; Franzen, M.; Kuhlmann, M.; Potts, S.G.; Rasmont, P.; Schweiger, O.; Michez, D. Patterns of size variation in bees at a continental scale: Does Bergmann’s rule apply? Oikos 2018, 127, 1095–1103. [Google Scholar] [CrossRef]
- Benítez, H.A.; Muñoz-Ramírez, C.; Correa, M.; Acuña-Rodríguez, I.S.; Villalobos-Leiva, A.; Contador, T.; Velásquez, N.A.; Suazo, M.J. Breaking the Law: Is it correct to use the converse Bergmann rule in Ceroglossus chilensis? An overview using geometric morphometrics. Insects 2024, 15, 97. [Google Scholar] [CrossRef]
- Mousseau, T.A. Ectotherms follow the converse to Bergmann’s rule. Evolution 1997, 51, 630–632. [Google Scholar] [CrossRef]
- Alcantara, M.J.M.; Fontanilla, A.M.; Ashton, L.A.; Burwell, C.J.; Cao, M.; Han, H.; Huang, H.; Kitching, R.L.; Reshchikov, A.; Shen, X.; et al. Bugs and Bergmann’s rule: A cross-taxon large-scale study reveals idiosyncratic altitudinal and latitudinal body size patterns for different insect taxa. Entomol. Gen. 2024, 44, 715–725. [Google Scholar] [CrossRef]
- Makarieva, A.M.; Gorshkov, V.G.; Li, B.-L. Temperature-associated upper limits to body size in terrestrial poikilotherms. Oikos 2005, 111, 425–436. [Google Scholar] [CrossRef]
- Winterhalter, W.E.; Mousseau, T.A. The strength of temperature-mediated selection on body size in a wild insect population. J. Orthoptera Res. 2008, 17, 347–351. [Google Scholar] [CrossRef]
- Leather, S.R.; Walters, K.F.A.; Bale, J.S. The Ecology of Insect Overwintering; Cambridge University Press: Cambridge, UK, 1993. [Google Scholar]
- Shelomi, M.; Zeuss, D. Bergmann’s and Allen’s rules in native European and Mediterranean Phasmatodea. Front. Ecol. Evol. 2017, 5, 25. [Google Scholar] [CrossRef]
- Fattorini, S.; Mantoni, C.; Di Biase, L.; Pace, L. Mountain biodiversity and sustainable development. In Encyclopedia of the UN Sustainable Development Goals. Life on Land; Leal Filho, W., Azul, A., Brandli, L., Özuyar, P., Wall, T., Eds.; Springer: Cham, Switzerland, 2020; pp. 1–21. [Google Scholar]
- Lee, M.A.; Burger, G.; Green, E.R.; Kooij, P.W. Relationships between resource availability and elevation vary between metrics creating gradients of nutritional complexity. Oecologia 2021, 195, 213–223. [Google Scholar] [CrossRef]
- Huston, M.A.; Wolverton, S. Regulation of animal size by eNPP, Bergmann’s rule, and related phenomena. Ecol. Monogr. 2011, 81, 349–405. [Google Scholar] [CrossRef]
- Blasi, C. Fitoclimatologia del Lazio; Università “La Sapienza”-Roma, Regione Lazio: Roma, Italy, 1994; pp. 1–58. [Google Scholar]
- Salvati, L.; Perini, L.; Bajocco, S.; Sabbi, A. Climate aridity and land use change: A regional-scale analysis. Geogr. Res. 2012, 50, 193–203. [Google Scholar] [CrossRef]
- Fattorini, S. The role of vegetation in elevational diversity patterns of tenebrionid beetles in Central Italy. Diversity 2024, 16, 110. [Google Scholar] [CrossRef]
- Fattorini, S. Regional insect inventories require long time, extensive spatial sampling and good will. PLoS ONE 2013, 8, e62118. [Google Scholar] [CrossRef]
- Fattorini, S. Disentangling the effects of available area, mid-domain constraints, and species environmental tolerance on the altitudinal distribution of tenebrionid beetles in a Mediterranean area. Biodivers. Conserv. 2014, 23, 2545–2560. [Google Scholar] [CrossRef]
- Fattorini, S.; Salvati, L. Tenebrionid beetles as proxy indicators of climate aridity in a Mediterranean area. Ecol. Indic. 2014, 38, 256–261. [Google Scholar] [CrossRef]
- Fattorini, S.; Mantoni, C.; Di Biase, L.; Strona, G.; Pace, L.; Biondi, M. Elevational patterns of generic diversity in the tenebrionid beetles (Coleoptera Tenebrionidae) of Latium (Central Italy). Diversity 2020, 12, 47. [Google Scholar] [CrossRef]
- Pons, J.; Bruvo, B.; Petitpierre, E.; Plohl, M.; Ugarkovic, D.; Juan, C. Complex structural features of satellite DNA sequences in the genus Pimelia (Coleoptera: Tenebrionidae): Random differential amplification from a common ‘satellite DNA library’. Heredity 2004, 9, 418–427. [Google Scholar] [CrossRef] [PubMed]
- Soldati, F.; Soldati, L. Species delimitation using morphological and molecular tools in the Asida (Polasida) jurinei Solier, 1836 species complex. Preliminary results. (Coleoptera: Tenebrionidae: Tentyrinae). Cah. Sci. Muséum Lyon 2006, 10, 111–116. [Google Scholar] [CrossRef]
- Trichas, A. The genus Dendarus Latreille, 1829 (Coleoptera, Tenebrionidae: Dendarini) in Greece (A systematic account of the genus with description of a new species and four new systematic combinations). In Advances in Arachnology and Developmental Biology; Makarov, S.E., Dimitrijević, R.N., Eds.; SASA, Belgrade and UNESCO MAB Serbia: Belgrade, Serbia, 2008; pp. 417–462. [Google Scholar]
- Ferrer, J. Contribución al conocimiento de los Asidini iberobaleares. Segunda nota. Las Alphasida (Glabrasida) del grupo Tricostatae Escalera 1922 (Coleoptera, Tenebrionidae, Pimeliinae). Boletín Soc. Entomológica Aragonesa 2008, 43, 61–73. [Google Scholar]
- Condamine, F.L.; Soldati, L.; Rasplus, J.Y.; Kergoat, G.J. New insights on systematics and phylogenetics of Mediterranean Blaps species (Coleoptera: Tenebrionidae: Blaptini), assessed through morphology and dense taxon sampling. Syst. Entomol. 2011, 36, 340–361. [Google Scholar] [CrossRef]
- Ferrer, J. Contribución al conocimiento del género Phylan Dejean, 1821, y descripción de una specie nueva del género Heliopates Dejean, 1834 (Coleoptera, Tenebrionidae, Pedinini). Boletín Soc. Entomológica Aragonesa 2011, 49, 75–82. [Google Scholar]
- Iwan, D.; Löbl, I. Catalogue of Palaearctic Coleoptera. Vol. 5. Revised and Updated Second Edition. Tenebrionoidea; Brill: Leiden, The Netherlands, 2020; pp. 1–946. [Google Scholar]
- Ferrer, J. Revisión del género Leptoderis Billberg, 1820 y comentarios sobre el origen, composición, anatomía y necrofagia de la tribu Elenophorini (Coleoptera, Tenebrionidae). Boletín Soc. Entomológica Aragonesa 2015, 57, 19–38. [Google Scholar]
- Ferrer, J. Contribución al conocimiento del género Pachychila Eschscholtz, 1831 y descripción de dos especies nuevas de la Península Ibérica y una de Italia (Coleoptera, Tenebrionidae, Pimeliinae). Boletín Soc. Entomológica Aragonesa 2018, 62, 35–54. [Google Scholar]
- Carpaneto, G.M.; Chiari, S.; Audisio, P.A.; Leo, P.; Liberto, A.; Jansson, N.; Zauli, A. Biological and distributional overview of the genus Eledonoprius (Coleoptera: Tenebrionidae): Rare fungus-feeding beetles of European old-growth forests. Eur. J. Entomol. 2013, 110, 173–176. [Google Scholar] [CrossRef]
- Chown, S.L.; Gaston, K.J. Body size variation in insects: A macroecological perspective. Biol. Rev. 2010, 85, 139–169. [Google Scholar] [CrossRef]
- Fattorini, S.; Lo Monaco, R.; Di Giulio, A.; Ulrich, W. Latitudinal trends in body length distributions of European darkling beetles (Tenebrionidae). Acta Oecol. 2013, 53, 88–94. [Google Scholar] [CrossRef]
- Fattorini, S. Darkling beetle communities in two geologically contrasting biotopes: Testing biodiversity patterns by microsite comparisons. Biol. J. Linn. Soc. 2009, 98, 787–793. [Google Scholar] [CrossRef]
- Hódar, J.A. The use of regression equations for estimation of arthropod biomass in ecological studies. Acta Oecol. 1996, 17, 421–433. [Google Scholar]
- Kuschka, V. Der Einfluss der Körpergestalt auf die Massen-Körperlängen-Relation von Arthropoden. Zool. Anz. 1994, 233, 265–281. [Google Scholar]
- Michon, G.P. Spheroids & Scalene Ellipsoids. Available online: https://www.numericana.com/answer/ellipsoid.htm#thomsen (accessed on 15 March 2024).
- R Core Team. R: A Language and Environment for Statistical Computing; R Foundation for Statistical Computing: Vienna, Austria, 2022; Available online: https://www.R-project.org/ (accessed on 15 March 2022).
- Wickham, H. Ggplot2: Elegant Graphics for Data Analysis; Springer: New York, NY, USA, 2016. [Google Scholar]
- Fattorini, S.; Lo Monaco, R.; Di Giulio, A.; Ulrich, W. Climatic correlates of body size in European tenebrionid beetles (Coleoptera: Tenebrionidae). Org. Divers. Evol. 2014, 14, 215–224. [Google Scholar] [CrossRef]
- Fattorini, S.; Sciotti, A.; Tratzi, P.; Di Giulio, A. Species distribution, ecology, abundance, body size and phylogeny originate interrelated rarity patterns at regional scale. J. Zool. Syst. Evol. Res. 2013, 51, 279–286. [Google Scholar] [CrossRef]
- Rosenzweig, M.L. The strategy of body size in mammalian carnivores. Am. Midl. Nat. 1968, 80, 299–315. [Google Scholar] [CrossRef]
- Geist, V. Bergmann’s rule is invalid. Can. J. Zool. 1987, 65, 1035–1038. [Google Scholar] [CrossRef]
- Dajoz, R. Les Insectes et la Forêt: Rôle et Diversité des Insectes dans le Milieu Forestier, 2nd ed.; Lavoisier: Paris, France, 2007; pp. 1–648. [Google Scholar]
- Vermunt, B.; Cuddington, K.; Sobek-Swant, S.; Crosthwaite, J.C.; Lyons, D.B.; Sinclair, B.J. Temperatures experienced by wood-boring beetles in the under-bark microclimate. For. Ecol. Manag. 2012, 269, 149–157. [Google Scholar] [CrossRef]
- Lindman, L.; Öckinger, E.; Ranius, T. Microclimate in hollow trees and how it affects an inhabiting beetle species, Osmoderma eremita. Ecol. Entomol. 2023, 48, 112–126. [Google Scholar] [CrossRef]
- Cushman, J.H.; Lawton, J.H.; Manly, B.F.J. Latitudinal patterns in European ant assemblages: Variation in species richness and body size. Oecologia 1993, 95, 30–37. [Google Scholar] [CrossRef]
- Rodríguez, M.Á.; Olalla-Tárraga, M.Á.; Hawkins, B.A. Bergmann’s rule and the geography of mammal body size in the Western Hemisphere. Glob. Ecol. Biogeogr. 2008, 17, 274–283. [Google Scholar] [CrossRef]
- Olson, V.A.; Davies, R.G.; Orme, C.D.L.; Thomas, G.H.; Meiri, S.; Blackburn, T.M.; Gaston, K.J.; Owens, I.P.F.; Bennett, P.M. Global biogeography and ecology of body size in birds. Ecol. Lett. 2009, 12, 249–259. [Google Scholar] [CrossRef] [PubMed]
- Adamczak, S.K.; Pabst, D.A.; McLellan, W.A.; Thorne, L.H. Do bigger bodies require bigger radiators? Insights into thermal ecology from closely related marine mammal species and implications for ecogeographic rules. J. Biogeogr. 2020, 47, 1193–1206. [Google Scholar] [CrossRef]


| Measure | Group | Intercept | Slope | R2 | F | p |
|---|---|---|---|---|---|---|
| Body length (mm) | All | 9.578 ± 0.159 | 0.0008 ± 0.0001 | 0.689 | 48.7 | 5.315 × 10⁻⁷ |
| Geophilous | 11.108 ± 0.309 | −0.0003 ± 0.0002 | 0.098 | 2.4 | 0.136 | |
| Geophilous (<1100 m) | 11.399 ± 0.471 | −0.0005 ± 0.0007 | 0.043 | 0.4 | 0.541 | |
| Geophilous (>1100 m) | 7.972 ± 0.396 | 0.0013 ± 0.0002 | 0.769 | 36.5 | 8.393 × 10⁻⁵ | |
| Xylophilous | 6.307 ± 0.468 | 0.0040 ± 0.0004 | 0.869 | 132.2 | 2.875 × 10⁻¹⁰ | |
| Body mass—fresh (mg) | All | 167.988 ± 8.109 | −0.038 ± 0.006 | 0.653 | 41.4 | 1.798 × 10⁻⁶ |
| Geophilous | 210.425 ± 16.665 | −0.078 ± 0.012 | 0.655 | 41.8 | 1.666 × 10⁻⁶ | |
| Geophilous (<1100 m) | 247.387 ± 26.337 | −0.130 ± 0.042 | 0.522 | 9.8 | 0.012 | |
| Geophilous (>1100 m) | 44.723 ± 5.610 | 0.013 ± 0.003 | 0.609 | 17.1 | 0.002 | |
| Xylophilous | 62.444 ± 15.261 | 0.086 ± 0.012 | 0.718 | 50.9 | 6.497 × 10⁻⁷ | |
| Body mass—dry (mg) | All | 47.550 ± 1.820 | −0.005 ± 0.001 | 0.443 | 17.5 | 0.0004 |
| Geophilous | 59.470 ± 3.952 | −0.016 ± 0.003 | 0.601 | 33.1 | 8.687 × 10⁻⁶ | |
| Geophilous (<1100 m) | 66.658 ± 6.174 | −0.025 ± 0.010 | 0.428 | 6.7 | 0.029 | |
| Geophilous (>1100 m) | 18.663 ± 2.153 | 0.006 ± 0.001 | 0.678 | 23.1 | 0.0005 | |
| Xylophilous | 18.038 ± 3.997 | 0.029 ± 0.003 | 0.810 | 85.3 | 1.181 × 10⁻⁸ | |
| Body volume (mm3) | All | 175.287 ± 9.735 | −0.019 ± 0.007 | 0.247 | 7.2 | 0.013 |
| Geophilous | 247.812 ± 18.539 | −0.063 ± 0.013 | 0.505 | 22.4 | 0.0001 | |
| Geophilous (<1100 m) | 281.646 ± 28.567 | −0.105 ± 0.045 | 0.376 | 5.4 | 0.045 | |
| Geophilous (>1100 m) | 55.261 ± 12.196 | 0.041 ± 0.007 | 0.770 | 36.9 | 8.054 × 10⁻⁵ | |
| Xylophilous | 62.561 ± 11.732 | 0.066 ± 0.009 | 0.719 | 51.2 | 6.275 × 10⁻⁷ |
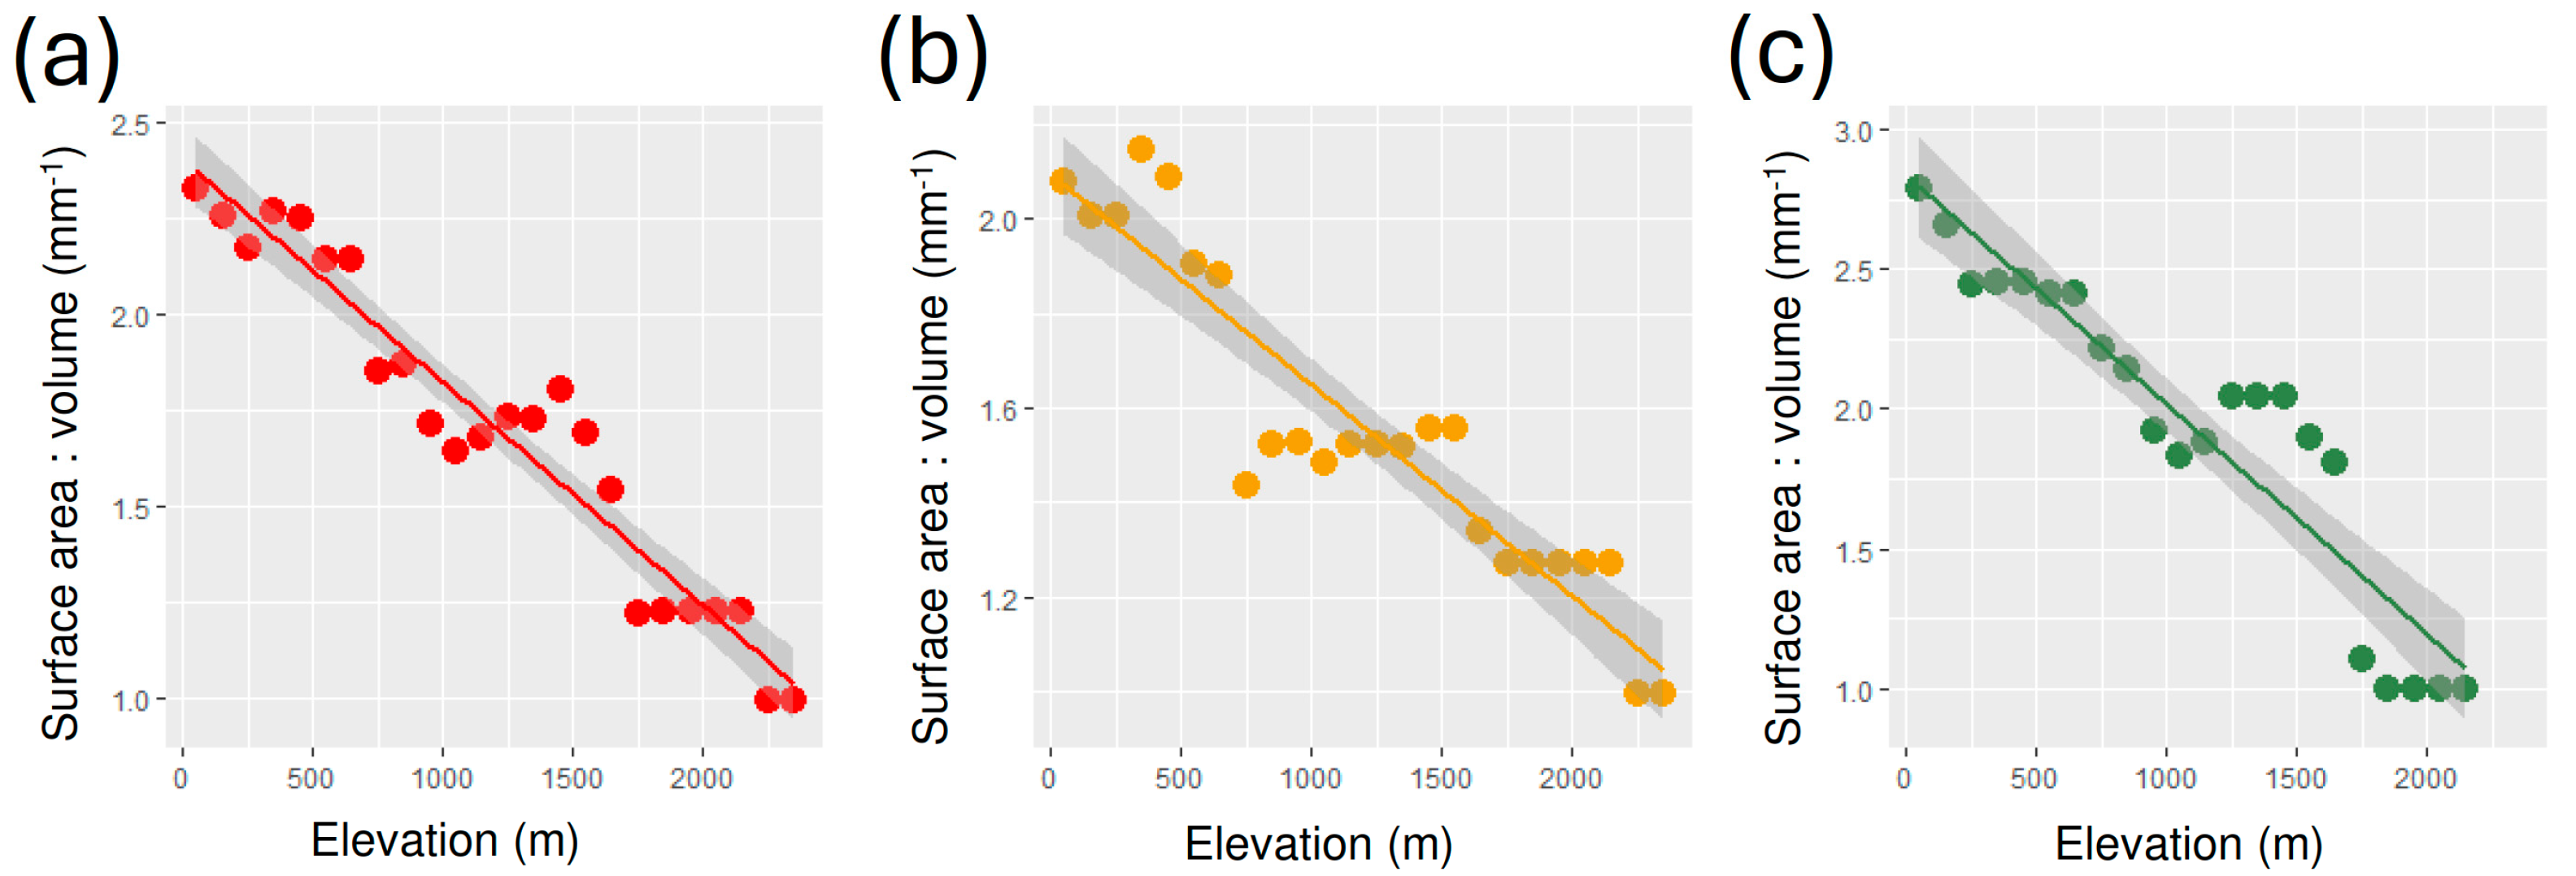
| Group | Intercept | Slope | R2 | F | p |
|---|---|---|---|---|---|
| All | 2.405 ± 0.046 | −5.821 × 10⁻⁴ ± 3.344 × 10⁻⁵ | 0.932 | 303.1 | 2.371 × 10⁻¹⁴ |
| Geophilous | 2.094 ± 0.052 | −4.455 × 10⁻⁴ ± 3.754 × 10⁻⁵ | 0.865 | 140.8 | 4.933 × 10⁻¹¹ |
| Xylohiplous | 2.840 ± 0.091 | −8.223 × 10⁻⁴ ± 7.146 × 10⁻⁵ | 0.869 | 132.4 | 2.837 × 10⁻¹⁰ |
Disclaimer/Publisher’s Note: The statements, opinions and data contained in all publications are solely those of the individual author(s) and contributor(s) and not of MDPI and/or the editor(s). MDPI and/or the editor(s) disclaim responsibility for any injury to people or property resulting from any ideas, methods, instructions or products referred to in the content. |
© 2024 by the author. Licensee MDPI, Basel, Switzerland. This article is an open access article distributed under the terms and conditions of the Creative Commons Attribution (CC BY) license (https://creativecommons.org/licenses/by/4.0/).
Share and Cite
Fattorini, S. An Interspecific Assessment of Bergmann’s Rule in Tenebrionid Beetles (Coleoptera, Tenebrionidae) along an Elevation Gradient. Insects 2024, 15, 673. https://doi.org/10.3390/insects15090673
Fattorini S. An Interspecific Assessment of Bergmann’s Rule in Tenebrionid Beetles (Coleoptera, Tenebrionidae) along an Elevation Gradient. Insects. 2024; 15(9):673. https://doi.org/10.3390/insects15090673
Chicago/Turabian StyleFattorini, Simone. 2024. "An Interspecific Assessment of Bergmann’s Rule in Tenebrionid Beetles (Coleoptera, Tenebrionidae) along an Elevation Gradient" Insects 15, no. 9: 673. https://doi.org/10.3390/insects15090673
APA StyleFattorini, S. (2024). An Interspecific Assessment of Bergmann’s Rule in Tenebrionid Beetles (Coleoptera, Tenebrionidae) along an Elevation Gradient. Insects, 15(9), 673. https://doi.org/10.3390/insects15090673