
Euedaphic Rather than Hemiedaphic or Epedaphic Collembola Are More Sensitive to Different Climate Conditions in the Black Soil Region of Northeast China


Simple Summary
Abstract
1. Introduction
2. Materials and Methods
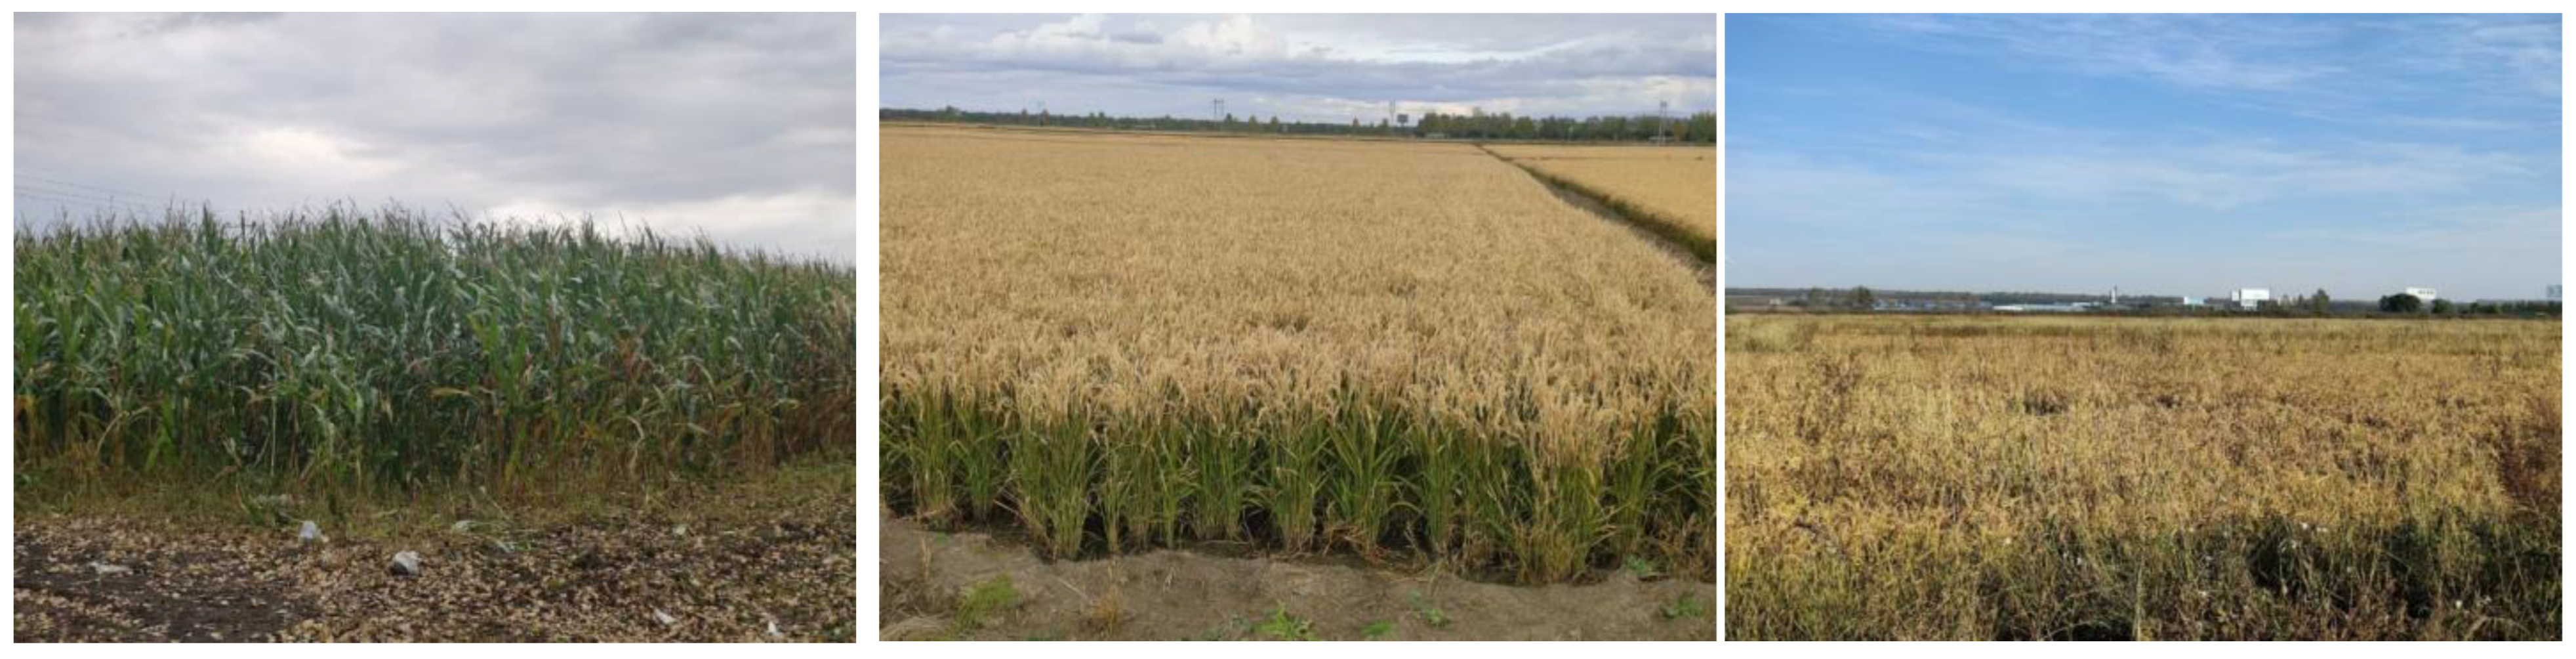
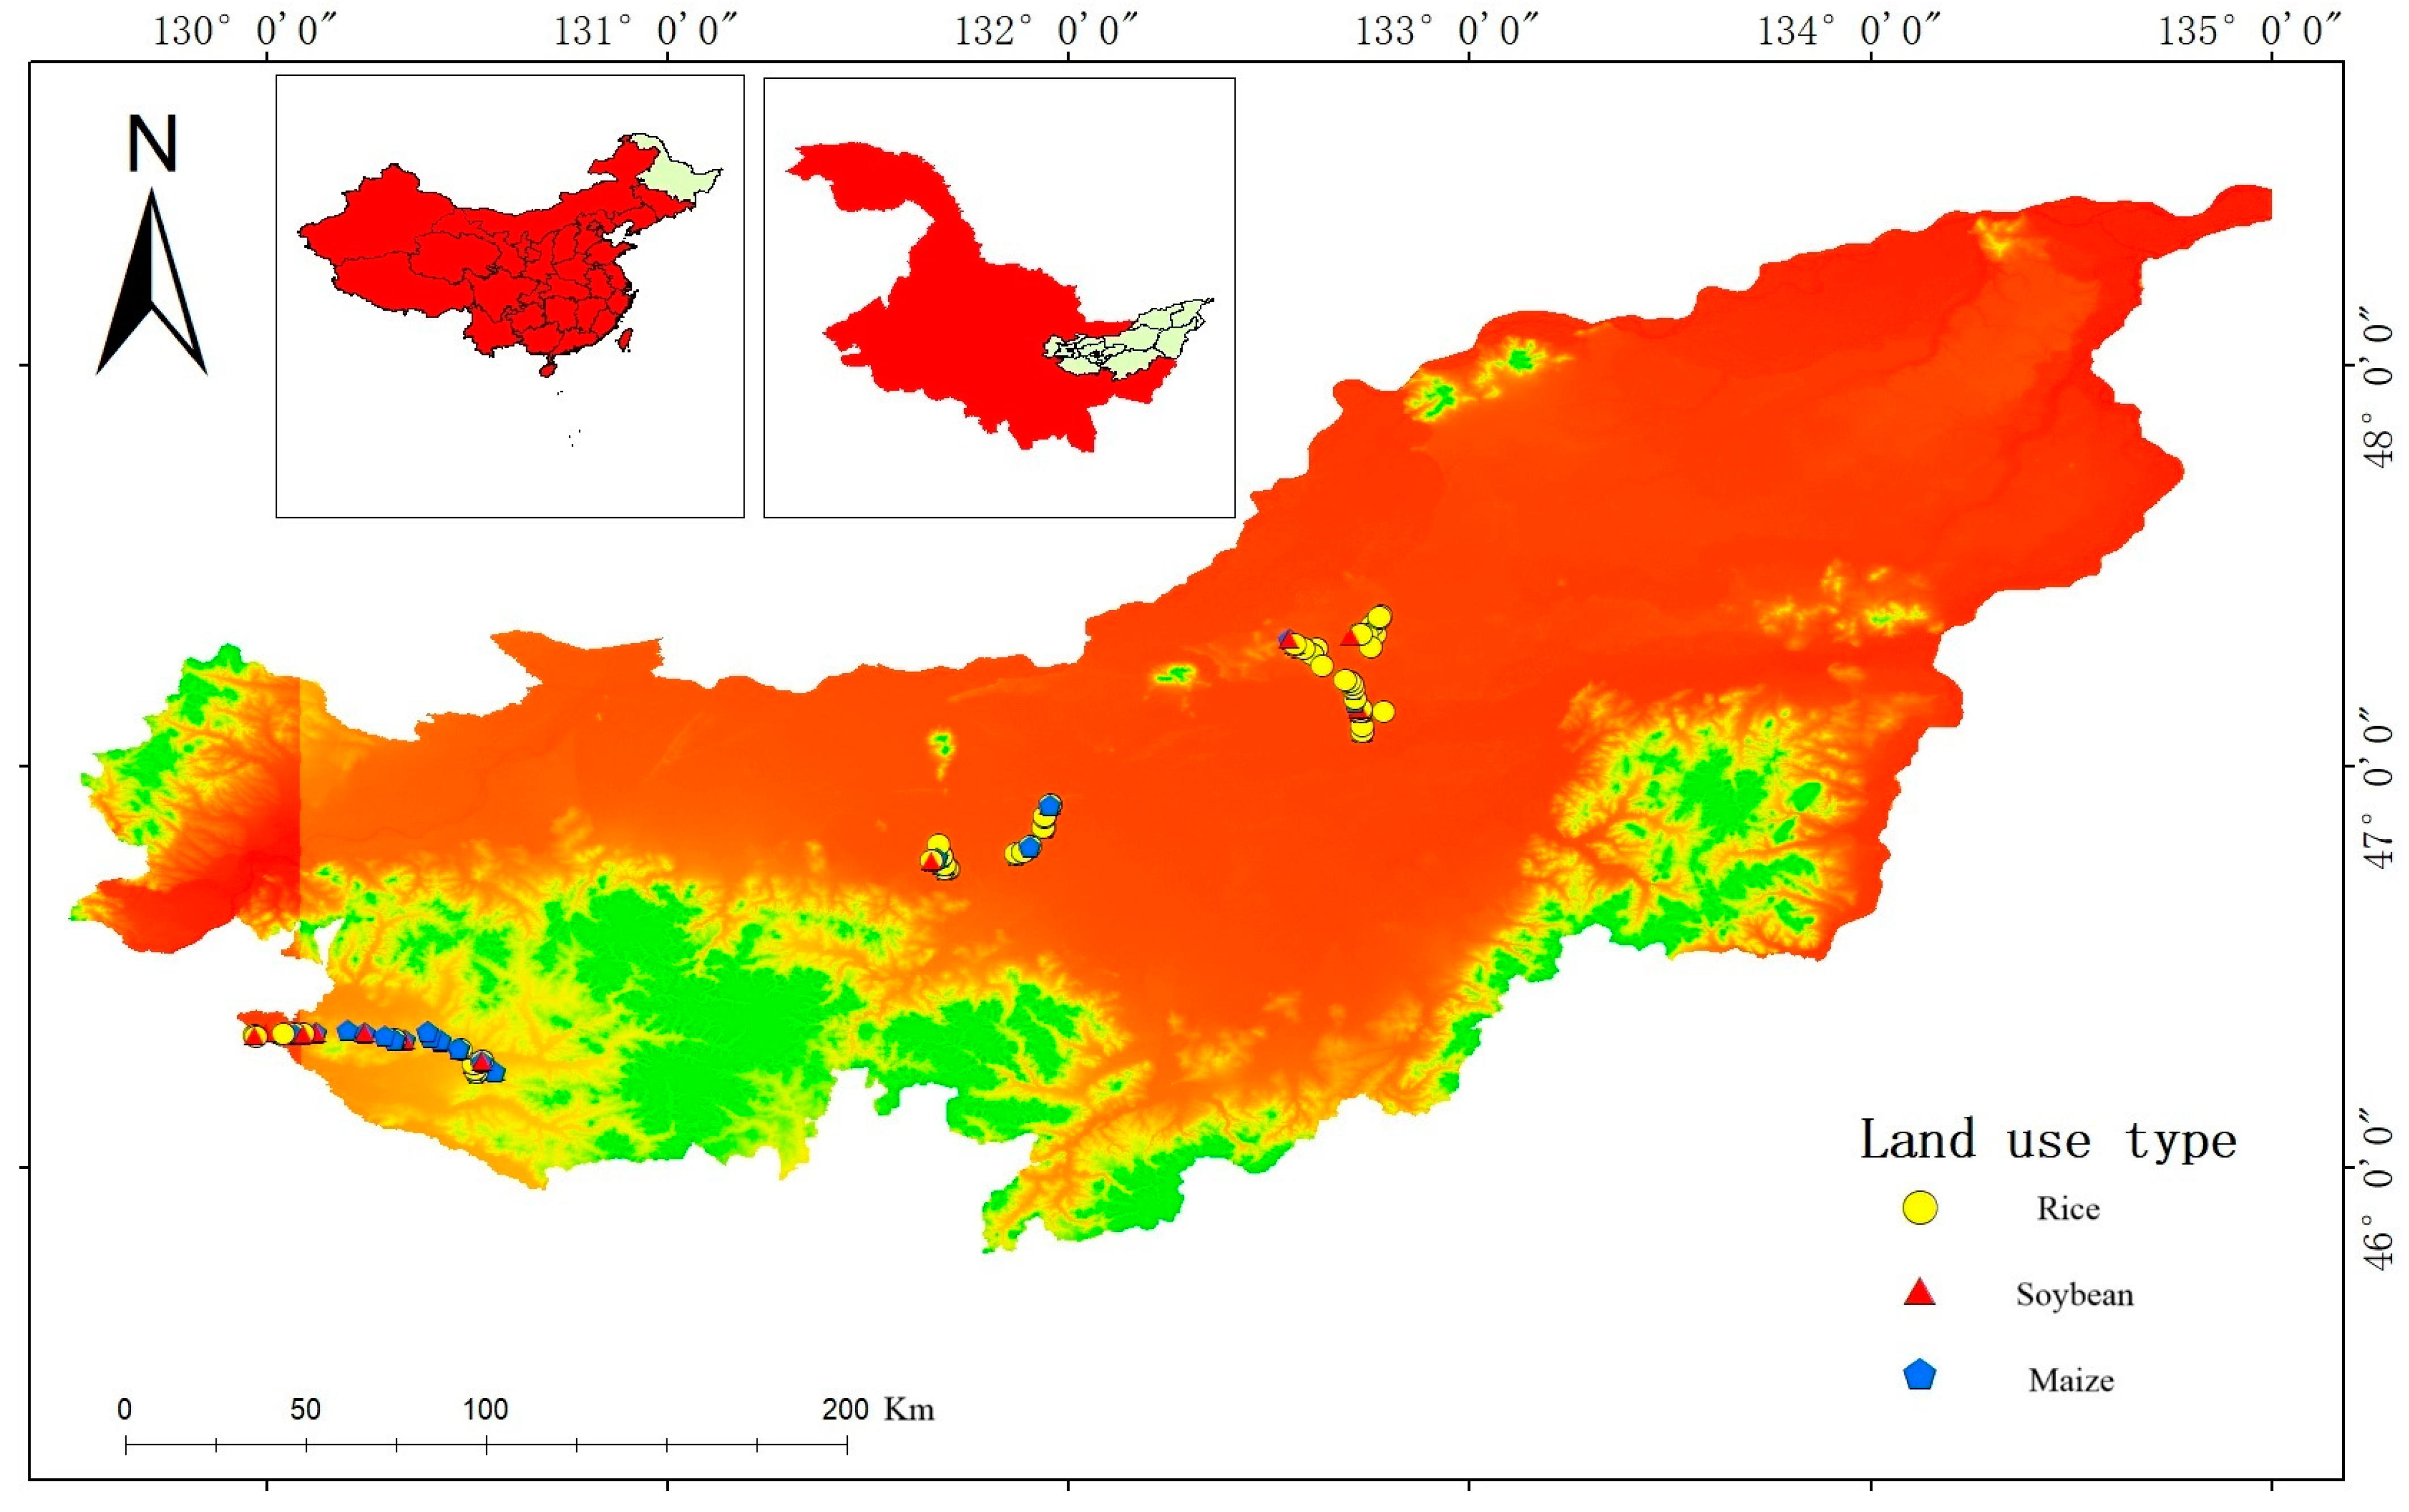
2.1. Study Area
- (1)
- Fujin County (CK) is located in the northeast of Heilongjiang Province, on the south bank of the lower reaches of the Songhua River, and the soil type is typical chernozem. Our sampling site is located between latitudes 47.0847°–47.3745° N and longitudes 132.5501°–132.7848° E. The mean annual temperature (MAT) between the sampling sites is 2.61 °C, and the mean annual precipitation (MAP) is 556 mm (detailed sample site information is listed in Table A1).
- (2)
- Huanan County (with a higher temperature and higher humidity than Fujin) is located in the eastern part of Heilongjiang Province, at the foot of Wanda Mountain, a remnant of the Changbai Mountains, and the soil type is typical chernozem. Our sampling site is located between latitudes 46.2357°–46.3396° N and longitudes 129.9683°–130.5665° E, with a MAT of 3.23 °C and MAP of 567 mm between sampling sites. Compared with Fujin, Huanan has a higher temperature and higher humidity, with a MAT increase of 0.62 °C and a MAP increase of 11 mm.
- (3)
- Youyi County (with a higher temperature and lower humidity than Fujin) belongs to Shuangyashan City, Heilongjiang Province, is located in the northeastern part of Heilongjiang Province, the soil type is typical chernozem, and our sampling site is located between latitudes 46.7425°–46.9028° N and longitudes 131.4236°–131.9535° E with a MAT of 3.58 °C and MAP of 532 mm between sampling sites. Compared with Fujin, Youyi has a higher temperature and lower humidity, with a MAT increase of 0.97 °C and a MAP decrease of 23 mm.
2.2. Experimental Design and Soil Sampling
2.3. Climate and Soil Factors
2.4. PLFA Analysis
2.5. Statistical Analysis
3. Results
3.1. Effects of Differences in Climate Conditions and Land Use Practices on Microorganisms
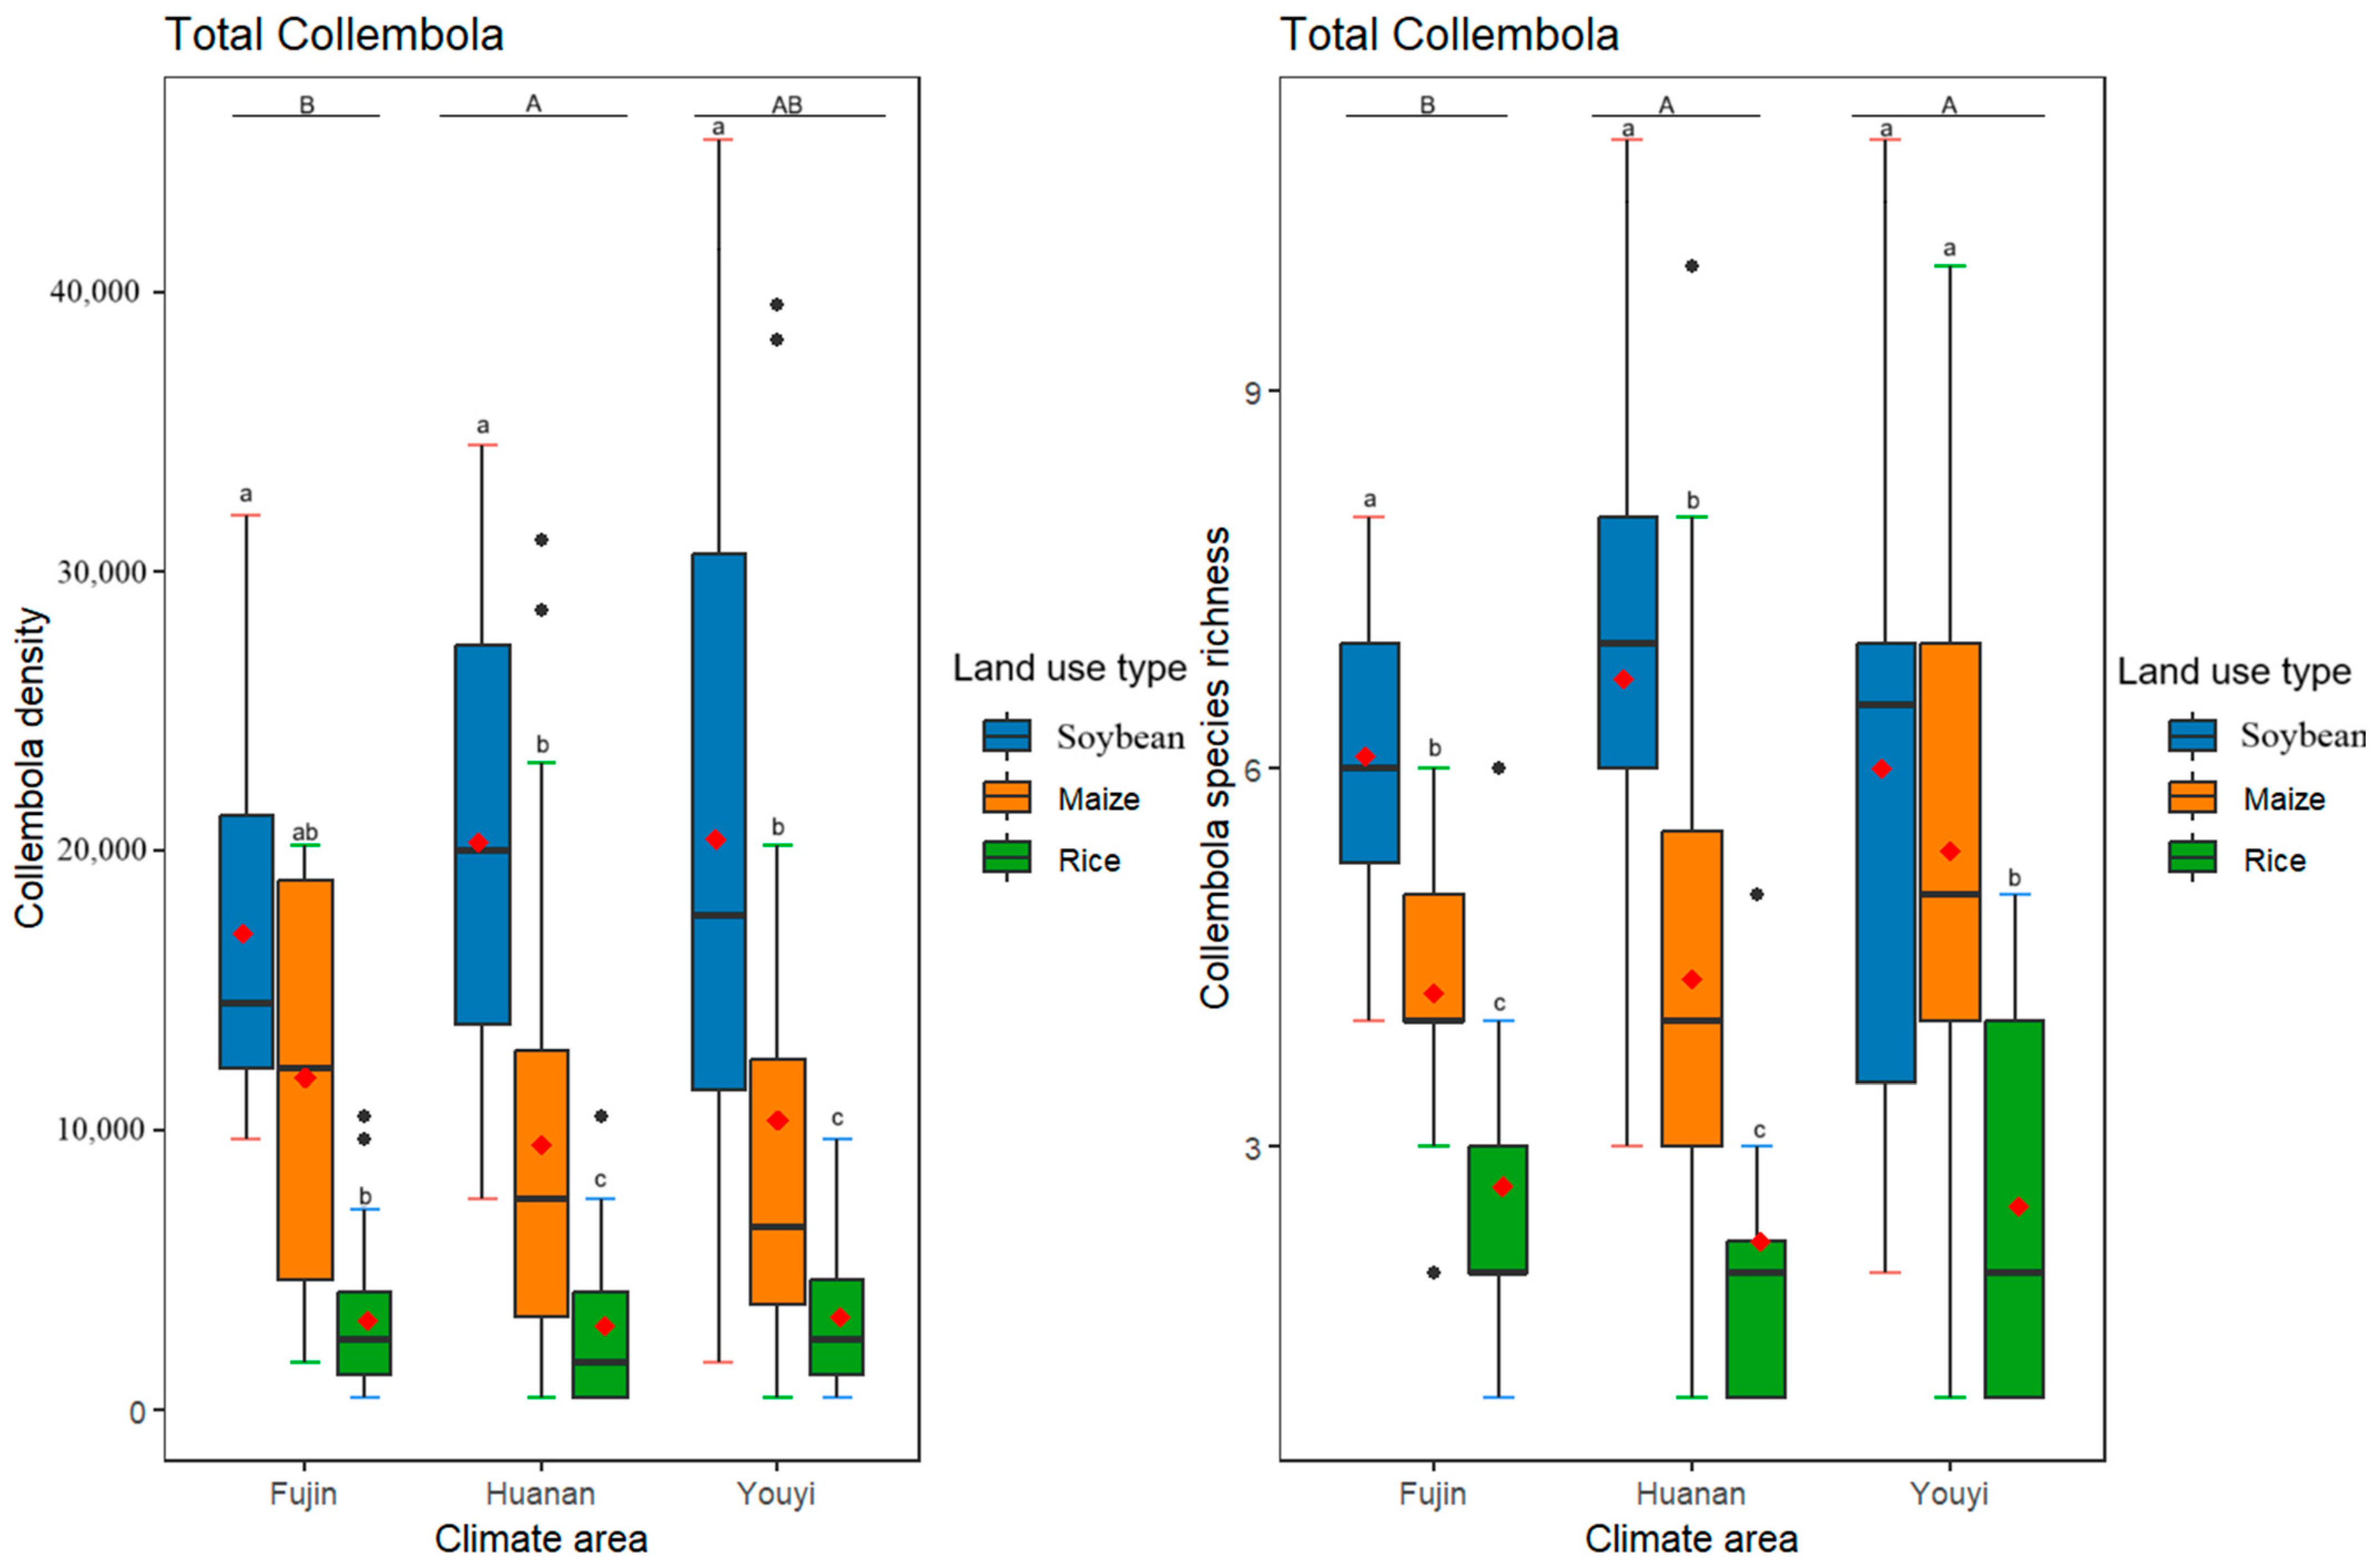
3.2. Effects of Differences in Climate Conditions and Land Use Practices on the Total Collembola Density and Species Richness
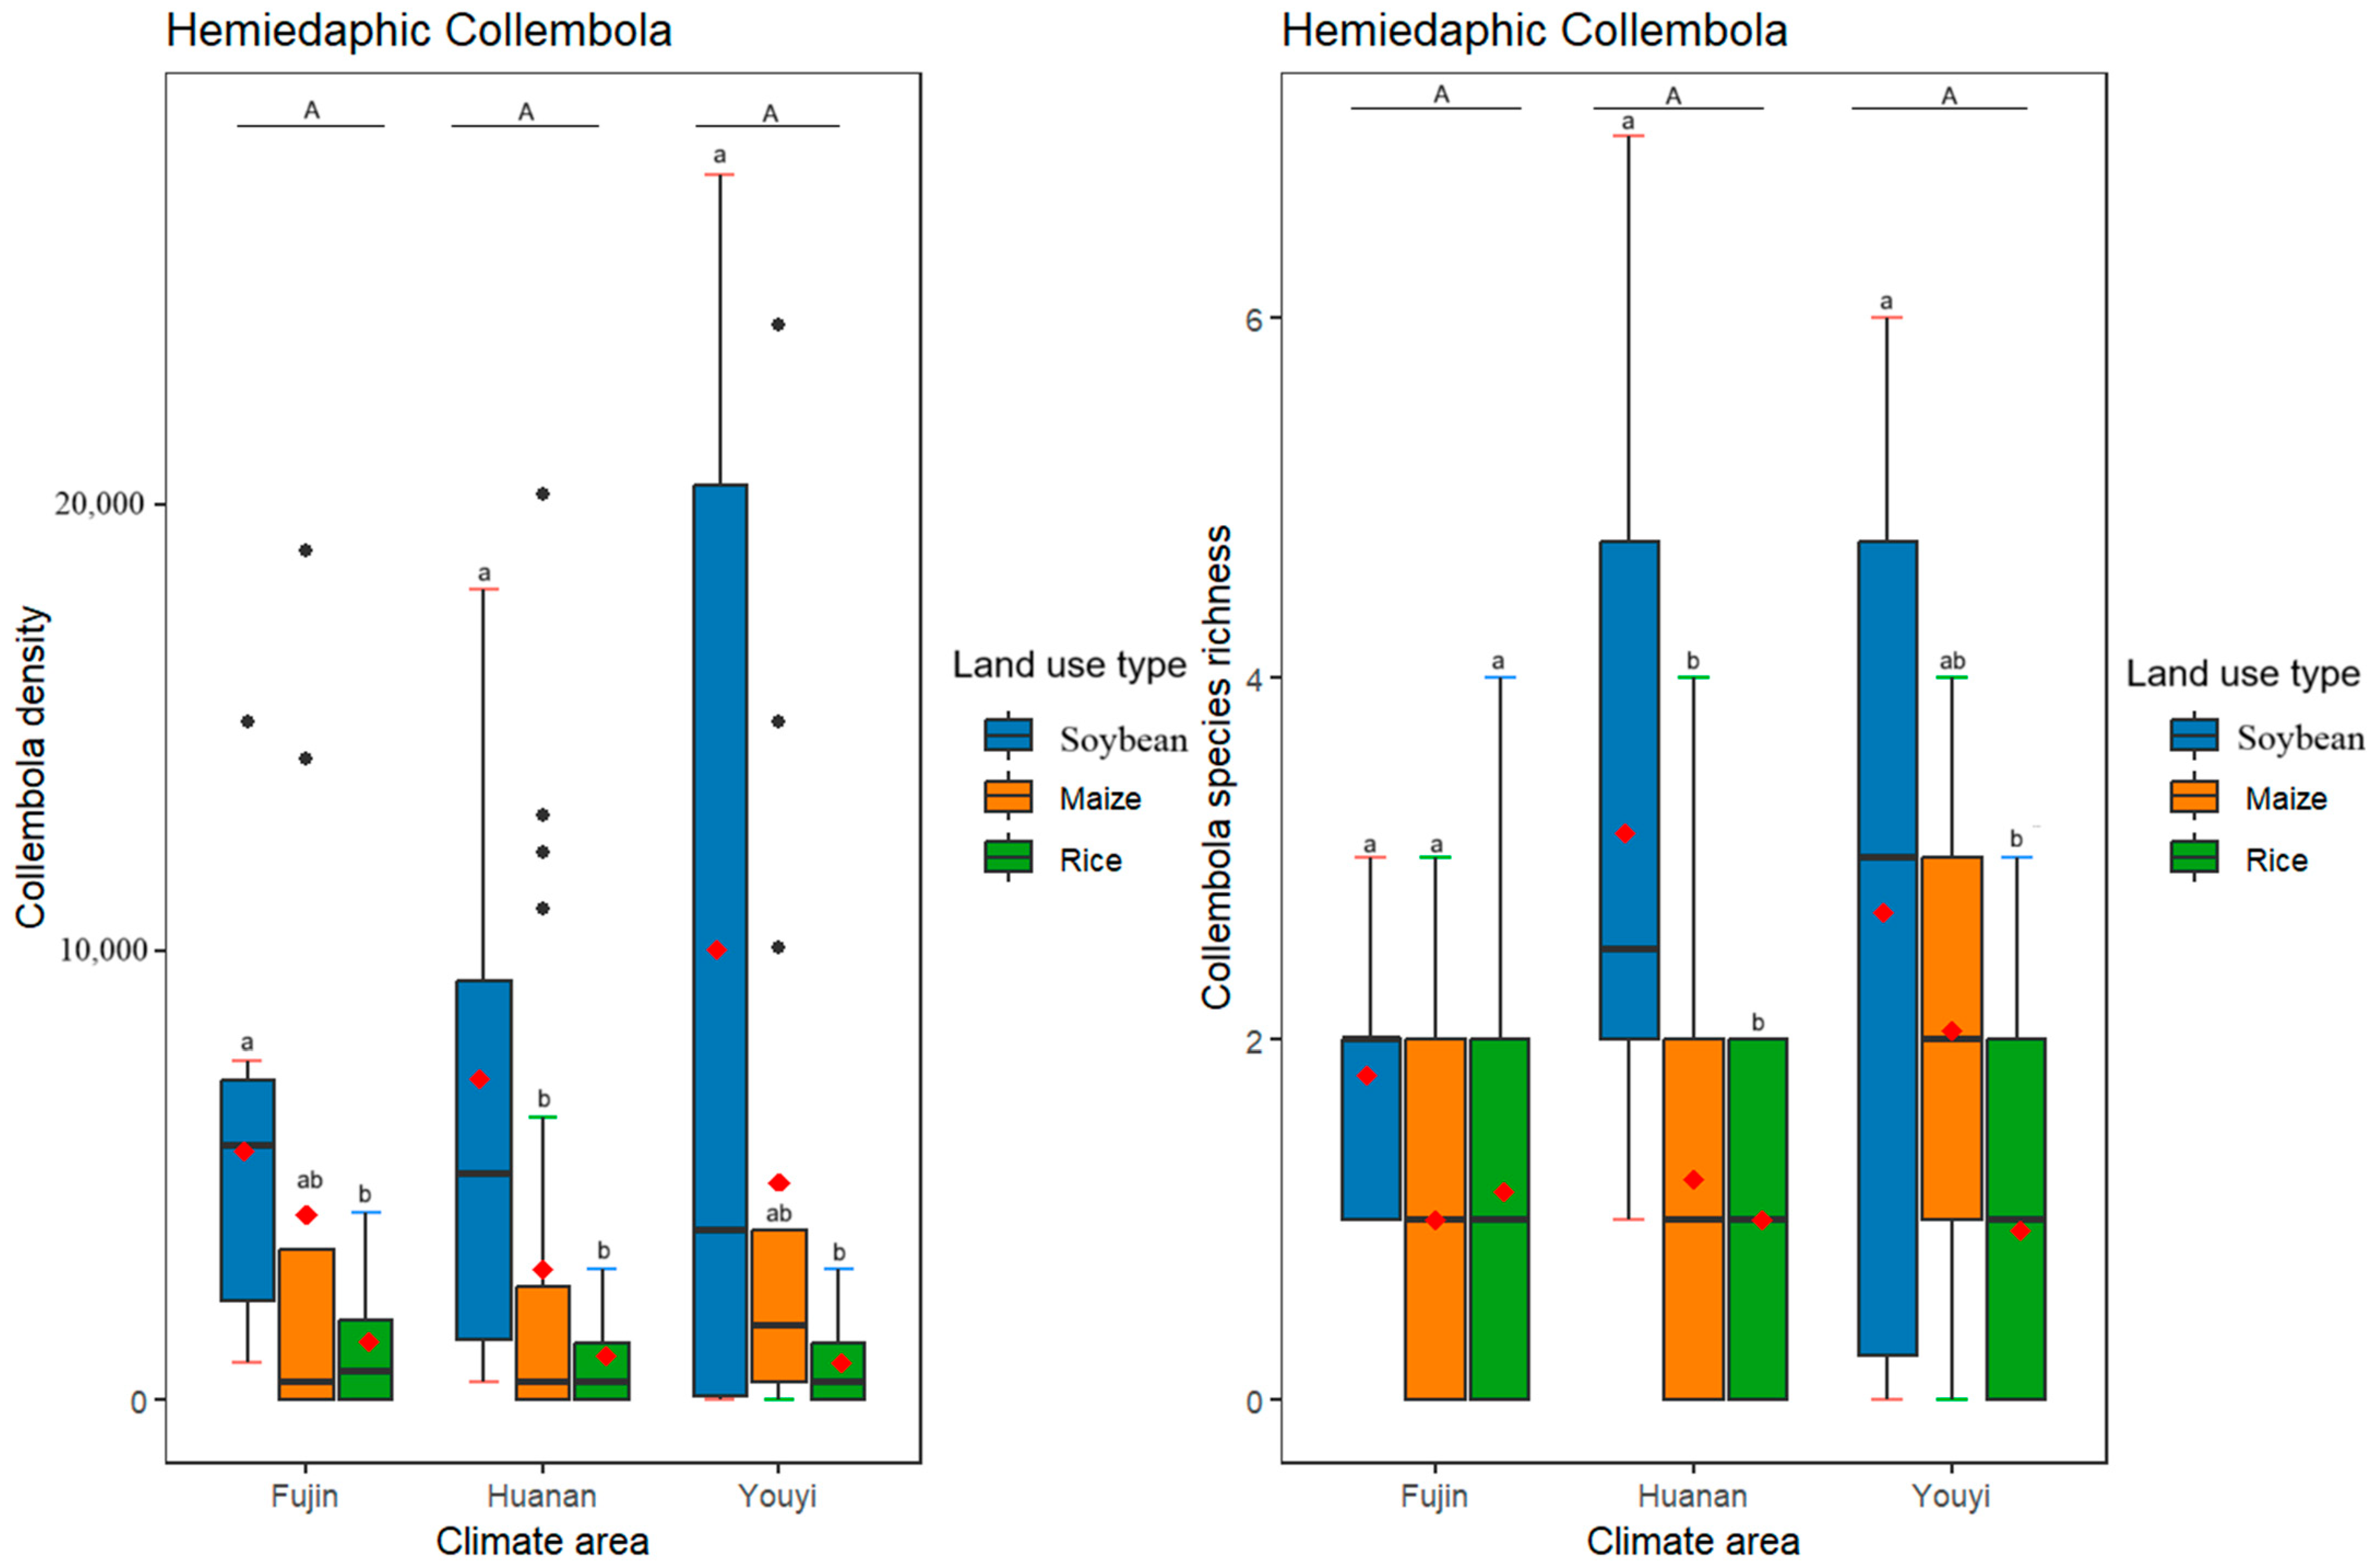
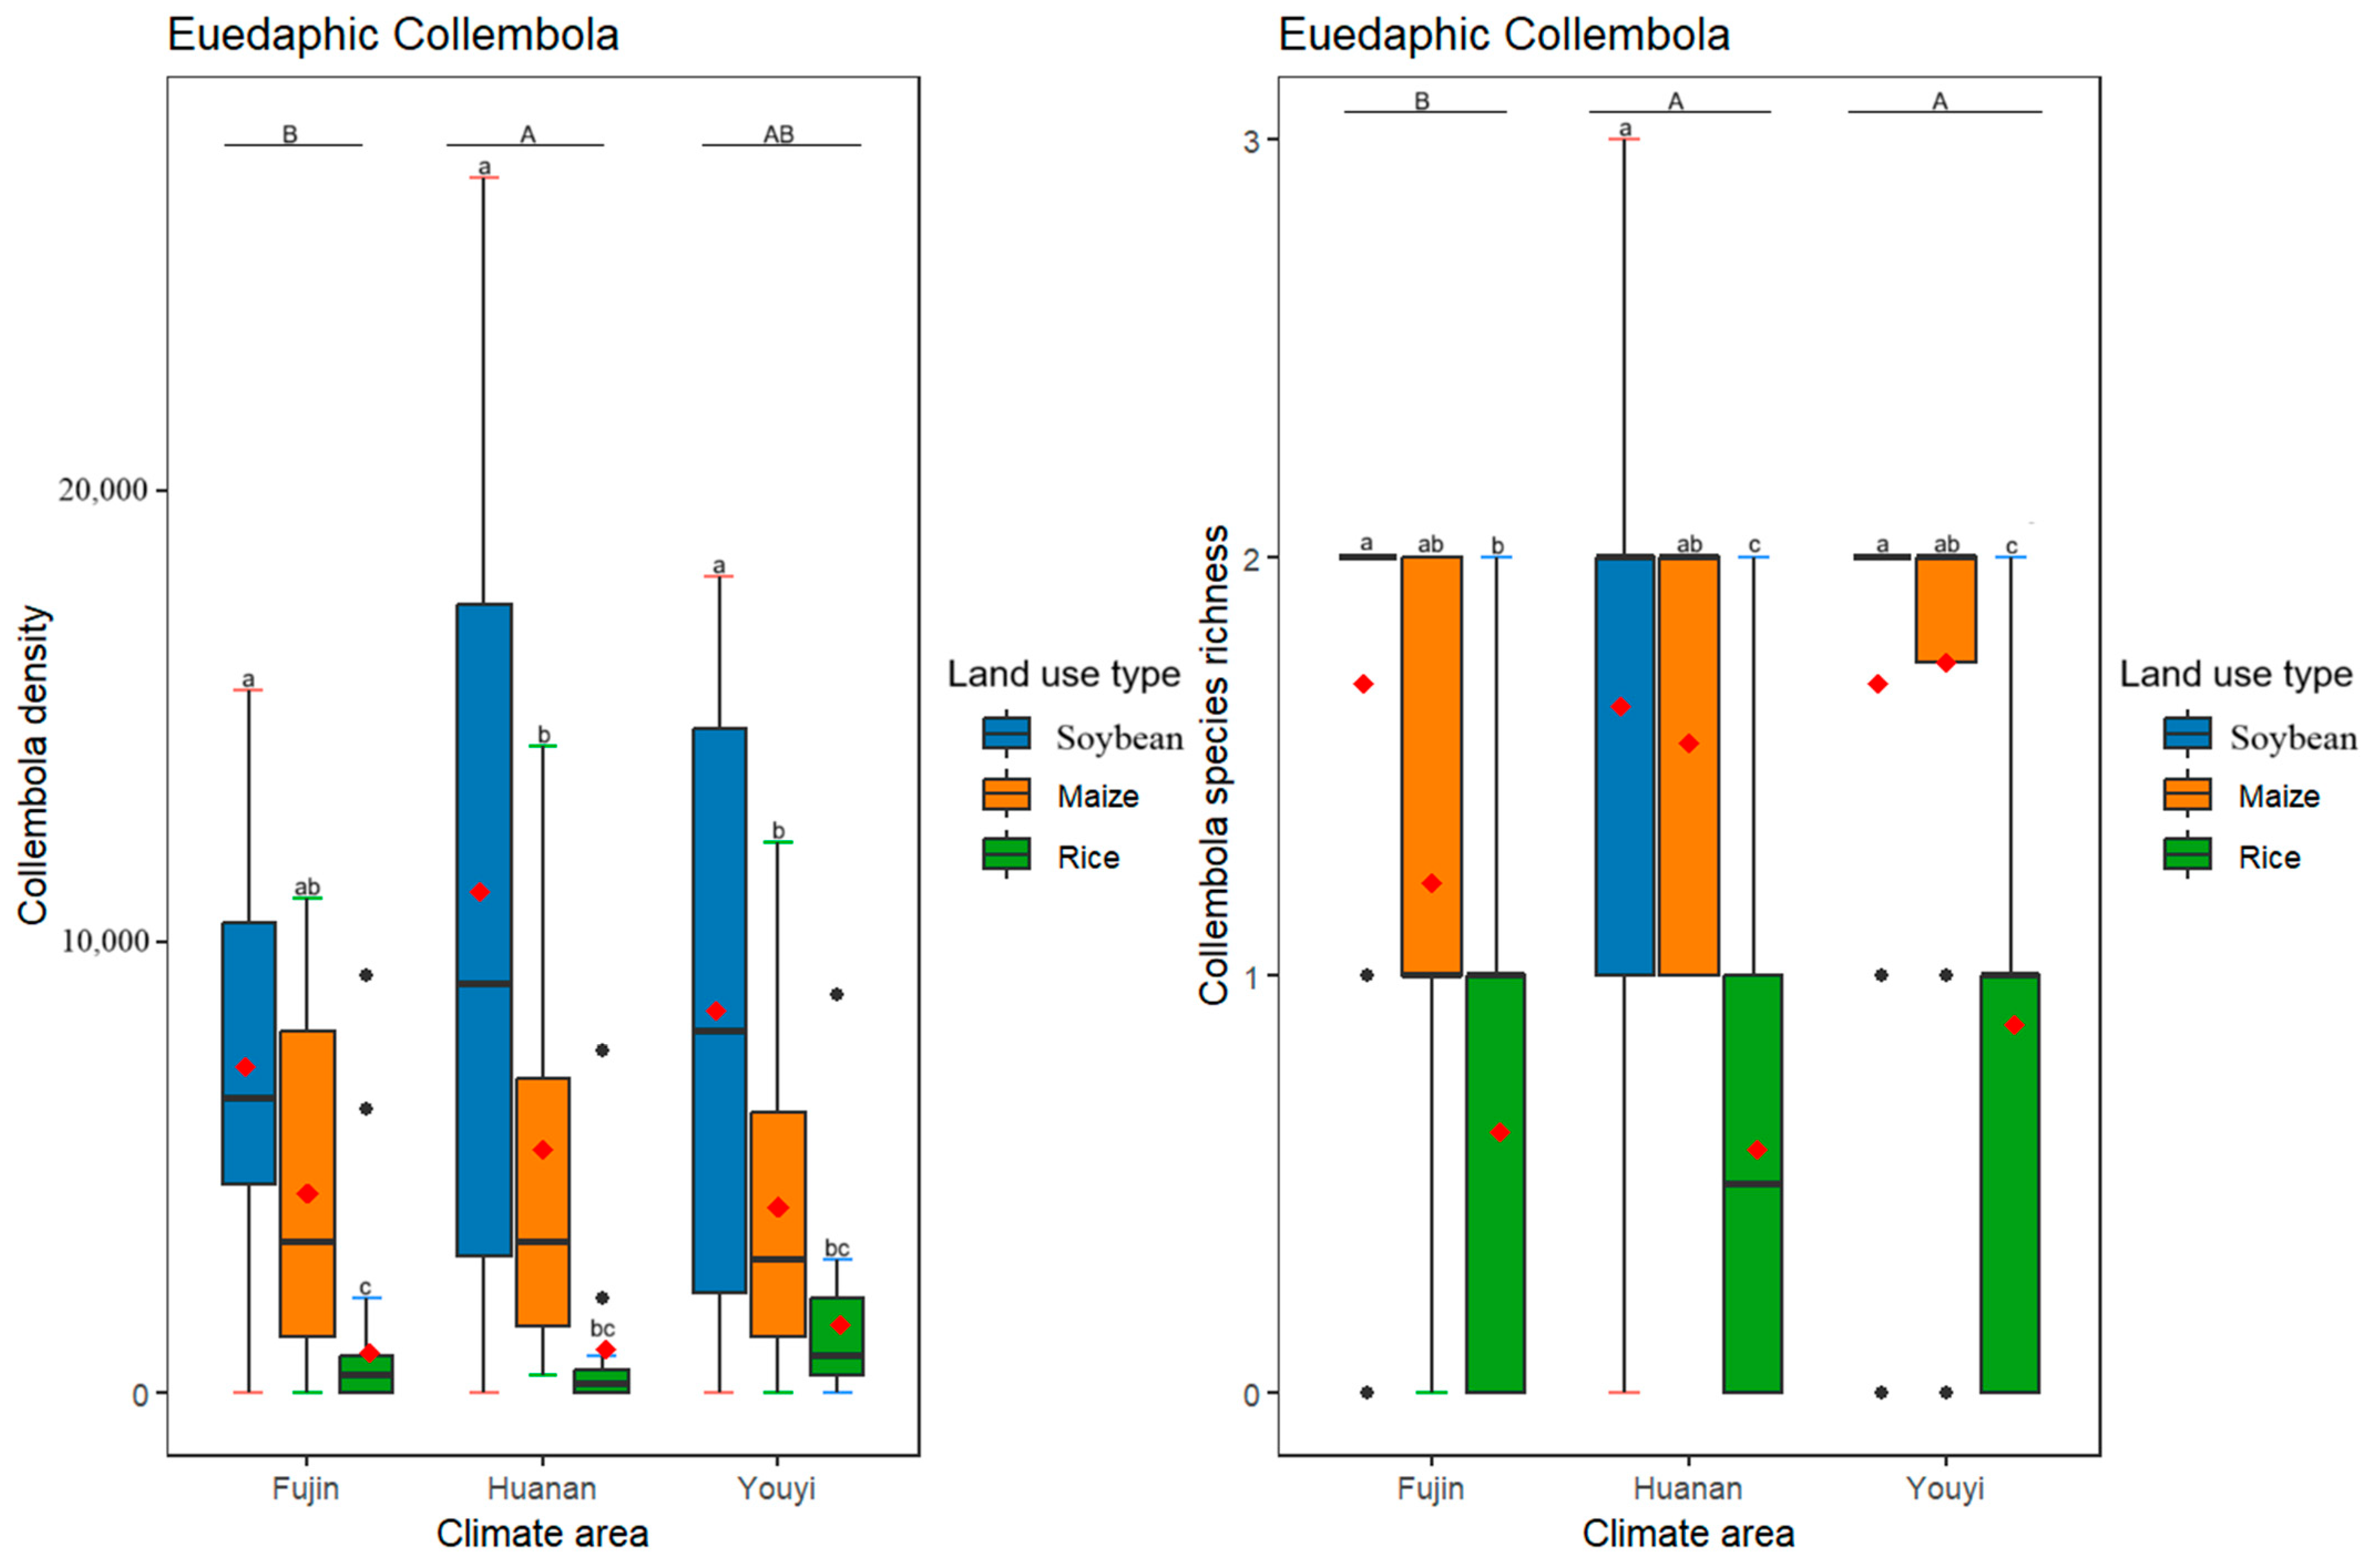
3.3. Effects of Differences in Climate Conditions and Land Use Practices on the Density and Species Richness of Epedaphic, Hemidaphic, and Euedaphic Collembola
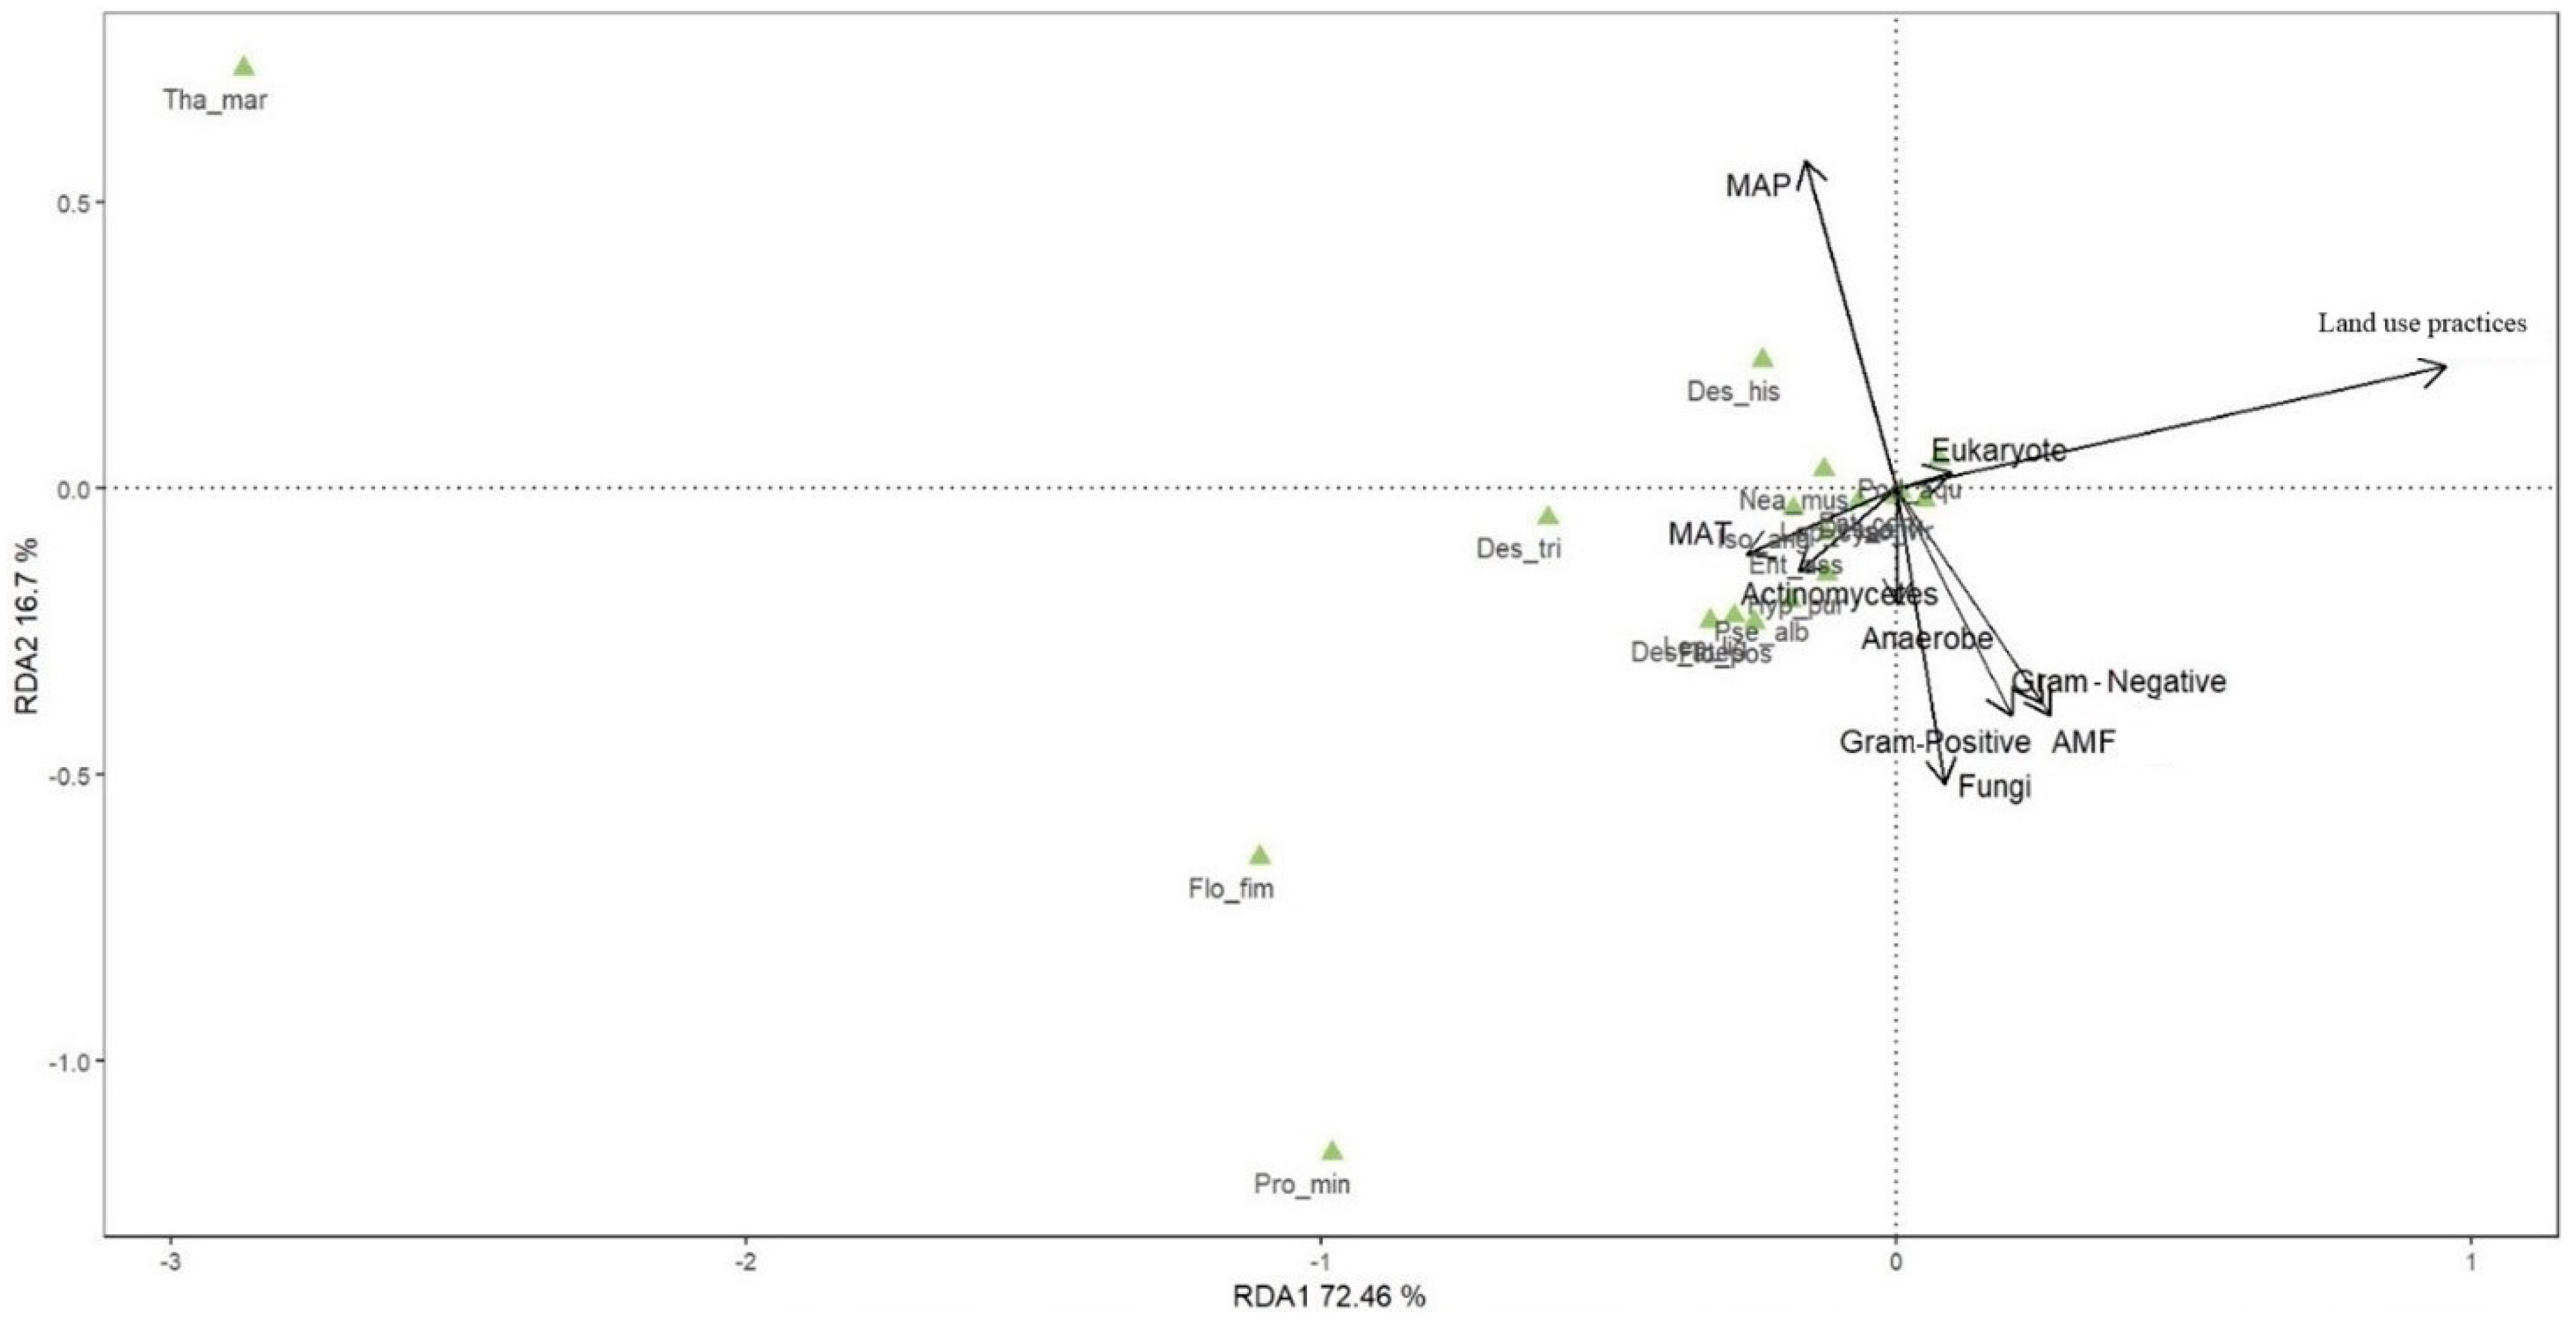
3.4. Effects of Environmental and Feeding Resources on Collembola Communities
4. Discussion
4.1. Effects of Differences in Climate Conditions and Land Use Practices on Collembola Communities
4.2. Effectss of Differences in Climate Conditions and Land Use Practices on Epedaphic, Hemidaphic, and Euedaphic Collembola Communities
4.3. Effects of Environmental and Feeding Resources on Collembola Communities
5. Conclusions
Author Contributions
Funding
Data Availability Statement
Acknowledgments
Conflicts of Interest
Appendix A

| Subject | Site | Land Type | Longitude | Latitude | MAT | MAP |
|---|---|---|---|---|---|---|
| 1 | Fujin | Bean | 132.5834 | 47.2924 | 2.58 | 556 |
| 2 | Fujin | Bean | 132.616 | 47.2940 | 2.58 | 556 |
| 3 | Fujin | Bean | 132.7323 | 47.0851 | 2.58 | 556 |
| 4 | Fujin | Bean | 132.7323 | 47.0851 | 2.58 | 556 |
| 5 | Fujin | Bean | 132.7278 | 47.1353 | 2.69 | 558 |
| 6 | Fujin | Bean | 132.7278 | 47.1353 | 2.69 | 558 |
| 7 | Fujin | Bean | 132.7242 | 47.1420 | 2.69 | 558 |
| 8 | Fujin | Bean | 132.7248 | 47.1415 | 2.69 | 558 |
| 9 | Fujin | Bean | 132.5651 | 47.3036 | 2.74 | 553 |
| 10 | Fujin | Bean | 132.5501 | 47.3179 | 2.74 | 553 |
| 11 | Fujin | Maize | 132.7323 | 47.0851 | 2.74 | 553 |
| 12 | Fujin | Maize | 132.7323 | 47.0851 | 2.74 | 553 |
| 13 | Fujin | Maize | 132.7288 | 47.1350 | 2.74 | 553 |
| 14 | Fujin | Maize | 132.7148 | 47.1628 | 2.74 | 553 |
| 15 | Fujin | Maize | 132.7148 | 47.1628 | 2.74 | 553 |
| 16 | Fujin | Maize | 132.7106 | 47.1941 | 2.72 | 554 |
| 17 | Fujin | Maize | 132.7017 | 47.3262 | 2.74 | 553 |
| 18 | Fujin | Maize | 132.5646 | 47.3039 | 2.72 | 554 |
| 19 | Fujin | Maize | 132.5503 | 47.3178 | 2.72 | 554 |
| 20 | Fujin | Rice | 132.6163 | 47.2939 | 2.69 | 565 |
| 21 | Fujin | Rice | 132.6156 | 47.2942 | 2.72 | 554 |
| 22 | Fujin | Rice | 132.6081 | 47.2778 | 2.72 | 554 |
| 23 | Fujin | Rice | 132.6081 | 47.2778 | 2.72 | 554 |
| 24 | Fujin | Rice | 132.6083 | 47.2776 | 2.72 | 554 |
| 25 | Fujin | Rice | 132.6078 | 47.2779 | 2.72 | 554 |
| 26 | Fujin | Rice | 132.7323 | 47.0851 | 2.72 | 554 |
| 27 | Fujin | Rice | 132.7319 | 47.0848 | 2.72 | 554 |
| 28 | Fujin | Rice | 132.7315 | 47.0851 | 2.72 | 554 |
| 29 | Fujin | Rice | 132.7331 | 47.0998 | 2.32 | 559 |
| 30 | Fujin | Rice | 132.7278 | 47.1353 | 2.32 | 559 |
| 31 | Fujin | Rice | 132.7278 | 47.1353 | 2.24 | 562 |
| 32 | Fujin | Rice | 132.7848 | 47.1353 | 2.24 | 562 |
| 33 | Fujin | Rice | 132.728 | 47.1346 | 2.24 | 562 |
| 34 | Fujin | Rice | 132.7266 | 47.1419 | 2.38 | 557 |
| 35 | Fujin | Rice | 132.6983 | 47.2112 | 2.32 | 559 |
| 36 | Fujin | Rice | 132.7529 | 47.2975 | 2.72 | 554 |
| 37 | Fujin | Rice | 132.7642 | 47.3302 | 2.67 | 557 |
| 38 | Fujin | Rice | 132.7765 | 47.3746 | 2.67 | 557 |
| 39 | Fujin | Rice | 132.7441 | 47.3288 | 2.73 | 555 |
| 40 | Fujin | Rice | 132.7536 | 47.2977 | 2.73 | 555 |
| 41 | Fujin | Rice | 132.713 | 47.1668 | 2.72 | 554 |
| 42 | Fujin | Rice | 132.7102 | 47.1937 | 2.38 | 557 |
| 43 | Fujin | Rice | 132.7063 | 47.2039 | 2.38 | 557 |
| 44 | Fujin | Rice | 132.7064 | 47.2036 | 2.38 | 557 |
| 45 | Fujin | Rice | 132.6987 | 47.2108 | 2.44 | 556 |
| 46 | Fujin | Rice | 132.7195 | 47.3276 | 2.70 | 561 |
| 47 | Fujin | Rice | 132.7274 | 47.3285 | 2.72 | 554 |
| 48 | Fujin | Rice | 132.6322 | 47.2513 | 2.24 | 562 |
| 49 | Fujin | Rice | 132.5852 | 47.2929 | 2.68 | 556 |
| 50 | Fujin | Rice | 132.5837 | 47.2921 | 2.68 | 556 |
| 51 | Fujin | Rice | 132.565 | 47.3037 | 2.68 | 556 |
| 52 | Huanan | Bean | 130.5665 | 46.2397 | 3.43 | 573 |
| 53 | Huanan | Bean | 130.5138 | 46.2580 | 3.43 | 573 |
| 54 | Huanan | Bean | 130.481 | 46.2948 | 3.42 | 565 |
| 55 | Huanan | Bean | 130.5355 | 46.2650 | 3.42 | 565 |
| 56 | Huanan | Bean | 130.343 | 46.3185 | 3.42 | 565 |
| 57 | Huanan | Bean | 130.2413 | 46.3371 | 3.42 | 565 |
| 58 | Huanan | Bean | 130.1223 | 46.3355 | 3.42 | 565 |
| 59 | Huanan | Bean | 130.0894 | 46.3348 | 3.42 | 565 |
| 60 | Huanan | Bean | 130.089 | 46.3328 | 3.31 | 565 |
| 61 | Huanan | Bean | 130.0899 | 46.3327 | 3.31 | 565 |
| 62 | Huanan | Bean | 130.0406 | 46.3313 | 3.31 | 565 |
| 63 | Huanan | Bean | 130.0405 | 46.3317 | 3.12 | 574 |
| 64 | Huanan | Bean | 129.9982 | 46.3379 | 3.12 | 574 |
| 65 | Huanan | Bean | 129.9683 | 46.3281 | 3.12 | 574 |
| 66 | Huanan | Maize | 130.5665 | 46.2397 | 3.12 | 574 |
| 67 | Huanan | Maize | 130.5232 | 46.2357 | 3.12 | 574 |
| 68 | Huanan | Maize | 130.5189 | 46.2432 | 3.07 | 572 |
| 69 | Huanan | Maize | 130.4798 | 46.2954 | 3.07 | 572 |
| 70 | Huanan | Maize | 130.4799 | 46.2954 | 3.12 | 570 |
| 71 | Huanan | Maize | 130.4799 | 46.2954 | 3.12 | 570 |
| 72 | Huanan | Maize | 130.4328 | 46.3163 | 3.11 | 564 |
| 73 | Huanan | Maize | 130.4071 | 46.3262 | 3.31 | 565 |
| 74 | Huanan | Maize | 130.4078 | 46.3264 | 3.31 | 565 |
| 75 | Huanan | Maize | 130.4016 | 46.3397 | 3.31 | 565 |
| 76 | Huanan | Maize | 130.4014 | 46.3395 | 3.31 | 565 |
| 77 | Huanan | Maize | 130.5359 | 46.2645 | 3.19 | 565 |
| 78 | Huanan | Maize | 130.3412 | 46.3187 | 3.19 | 565 |
| 79 | Huanan | Maize | 130.3414 | 46.3179 | 3.19 | 565 |
| 80 | Huanan | Maize | 130.3179 | 46.3196 | 3.27 | 559 |
| 81 | Huanan | Maize | 130.3176 | 46.3186 | 3.27 | 559 |
| 82 | Huanan | Maize | 130.3176 | 46.3197 | 3.27 | 559 |
| 83 | Huanan | Maize | 130.3176 | 46.3197 | 3.27 | 559 |
| 84 | Huanan | Maize | 130.2922 | 46.3280 | 3.27 | 559 |
| 85 | Huanan | Maize | 130.2415 | 46.3373 | 3.27 | 559 |
| 86 | Huanan | Maize | 130.2413 | 46.3371 | 3.16 | 566 |
| 87 | Huanan | Maize | 130.1984 | 46.3435 | 3.16 | 566 |
| 88 | Huanan | Maize | 130.1223 | 46.3345 | 3.16 | 566 |
| 89 | Huanan | Maize | 130.1228 | 46.3354 | 3.14 | 564 |
| 90 | Huanan | Maize | 130.0901 | 46.3328 | 3.18 | 569 |
| 91 | Huanan | Maize | 130.0686 | 46.3319 | 3.18 | 569 |
| 92 | Huanan | Maize | 130.0405 | 46.3317 | 3.18 | 569 |
| 93 | Huanan | Rice | 130.5232 | 46.2357 | 3.23 | 568 |
| 94 | Huanan | Rice | 130.5232 | 46.2357 | 3.18 | 569 |
| 95 | Huanan | Rice | 130.519 | 46.2432 | 3.23 | 568 |
| 96 | Huanan | Rice | 130.519 | 46.2432 | 3.23 | 568 |
| 97 | Huanan | Rice | 130.5139 | 46.2584 | 3.24 | 572 |
| 98 | Huanan | Rice | 130.5139 | 46.2584 | 3.24 | 572 |
| 99 | Huanan | Rice | 130.3176 | 46.3197 | 3.20 | 570 |
| 100 | Huanan | Rice | 130.0899 | 46.3327 | 3.20 | 570 |
| 101 | Huanan | Rice | 130.0402 | 46.3315 | 3.13 | 569 |
| 102 | Huanan | Rice | 130.0405 | 46.3317 | 3.15 | 568 |
| 103 | Huanan | Rice | 129.9687 | 46.3277 | 3.15 | 568 |
| 104 | Huanan | Rice | 129.9698 | 46.3272 | 3.15 | 568 |
| 105 | Youyi | Bean | 131.9369 | 46.8477 | 3.67 | 530 |
| 106 | Youyi | Bean | 131.9534 | 46.9029 | 3.67 | 530 |
| 107 | Youyi | Bean | 131.9534 | 46.9029 | 3.67 | 530 |
| 108 | Youyi | Bean | 131.9534 | 46.9029 | 3.61 | 529 |
| 109 | Youyi | Bean | 131.6871 | 46.7527 | 3.61 | 529 |
| 110 | Youyi | Bean | 131.6879 | 46.7523 | 3.61 | 529 |
| 111 | Youyi | Bean | 131.6879 | 46.7523 | 3.55 | 528 |
| 112 | Youyi | Bean | 131.6772 | 46.7871 | 3.70 | 543 |
| 113 | Youyi | Bean | 131.6754 | 46.7990 | 3.52 | 532 |
| 114 | Youyi | Bean | 131.6564 | 46.7636 | 3.52 | 532 |
| 115 | Youyi | Maize | 131.8671 | 46.7805 | 3.52 | 532 |
| 116 | Youyi | Maize | 131.905 | 46.7999 | 3.52 | 532 |
| 117 | Youyi | Maize | 131.9374 | 46.8477 | 3.52 | 532 |
| 118 | Youyi | Maize | 131.9534 | 46.9029 | 3.52 | 532 |
| 119 | Youyi | Maize | 131.9534 | 46.9029 | 3.52 | 532 |
| 120 | Youyi | Maize | 131.9534 | 46.9029 | 3.52 | 532 |
| 121 | Youyi | Maize | 131.6901 | 46.7427 | 3.47 | 533 |
| 122 | Youyi | Maize | 131.6878 | 46.7528 | 3.47 | 533 |
| 123 | Youyi | Maize | 131.6879 | 46.7523 | 3.47 | 533 |
| 124 | Youyi | Maize | 131.6879 | 46.7523 | 3.47 | 533 |
| 125 | Youyi | Maize | 131.6818 | 46.7753 | 3.47 | 533 |
| 126 | Youyi | Maize | 131.6811 | 46.7754 | 3.47 | 533 |
| 127 | Youyi | Maize | 131.6818 | 46.7748 | 3.47 | 533 |
| 128 | Youyi | Maize | 131.6762 | 46.7992 | 3.47 | 533 |
| 129 | Youyi | Maize | 131.6753 | 46.7991 | 3.47 | 533 |
| 130 | Youyi | Maize | 131.6754 | 46.7990 | 3.69 | 535 |
| 131 | Youyi | Maize | 131.6713 | 46.7708 | 3.69 | 535 |
| 132 | Youyi | Maize | 131.6714 | 46.7702 | 3.69 | 535 |
| 133 | Youyi | Maize | 131.6714 | 46.7702 | 3.69 | 535 |
| 134 | Youyi | Maize | 131.6564 | 46.7636 | 3.63 | 531 |
| 135 | Youyi | Rice | 131.8679 | 46.7804 | 3.63 | 531 |
| 136 | Youyi | Rice | 131.8837 | 46.7848 | 3.63 | 531 |
| 137 | Youyi | Rice | 131.8846 | 46.7851 | 3.63 | 531 |
| 138 | Youyi | Rice | 131.4236 | 46.8187 | 3.63 | 531 |
| 139 | Youyi | Rice | 131.9374 | 46.8477 | 3.63 | 531 |
| 140 | Youyi | Rice | 131.9352 | 46.8472 | 3.63 | 531 |
| 141 | Youyi | Rice | 131.9353 | 46.8472 | 3.63 | 531 |
| 142 | Youyi | Rice | 131.9374 | 46.8729 | 3.63 | 531 |
| 143 | Youyi | Rice | 131.9384 | 46.8737 | 3.63 | 531 |
| 144 | Youyi | Rice | 131.9384 | 46.8736 | 3.63 | 531 |
| 145 | Youyi | Rice | 131.9532 | 46.9028 | 3.58 | 535 |
| 146 | Youyi | Rice | 131.9535 | 46.9030 | 3.58 | 535 |
| 147 | Youyi | Rice | 131.9534 | 46.9029 | 3.58 | 535 |
| 148 | Youyi | Rice | 131.6981 | 46.7425 | 3.58 | 535 |
| 149 | Youyi | Rice | 131.6972 | 46.7425 | 3.63 | 531 |
| 150 | Youyi | Rice | 131.6906 | 46.7428 | 3.58 | 535 |
| 151 | Youyi | Rice | 131.6879 | 46.7523 | 3.63 | 531 |
| Family | Genus | Species | Life Form |
|---|---|---|---|
| Entomobryidae | Entomobrya | Entomobrya aino | 4 |
| Entomobryidae | Entomobrya | Entomobrya assuta | 4 |
| Entomobryidae | Entomobrya | Entomobrya bicincta | 4 |
| Entomobryidae | Entomobrya | Entomobrya comparata | 4 |
| Entomobryidae | Entomobrya | Entomobrya intermedia | 4 |
| Entomobryidae | Entomobrya | Entomobrya koreana | 4 |
| Entomobryidae | Entomobrya | Entomobrya quinquelineata | 4 |
| Entomobryidae | Sinella | Sinella transoculata | 2 |
| Entomobryidae | Sinella | Sinella umesaoi | 4 |
| Entomobryidae | Sinella | Sinella whitteni | 4 |
| Hypogastruridae | Hypogastrura | Hypogastrura purpurescens | 2 |
| Hypogastruridae | Hypogastrura | Hypogastrura sahlbergi | 2 |
| Isotomidae | Desoria | Desoria hissarica | 2 |
| Isotomidae | Isotomurus | Isotomurus antennalis | 4 |
| Isotomidae | Desoria | Desoria ater | 2 |
| Isotomidae | Desoria | Desoria tigrina | 2 |
| Isotomidae | Desoria | Desoria trispinata | 2 |
| Isotomidae | Folsomia | Folsomia fimetaria | 0 |
| Isotomidae | Folsomia | Folsomia postsensilis | 2 |
| Isotomidae | Isotoma | Isotoma anglicana | 2 |
| Isotomidae | Isotoma | Isotoma caerulea | 2 |
| Isotomidae | Isotoma | Isotoma viridis | 0 |
| Isotomidae | Parisotoma | Parisotoma notabilis | 2 |
| Isotomidae | Proisotoma | Proisotoma minuta | 2 |
| Isotomidae | Vertagopus | Vertagopus cinereus | 2 |
| Entomobryidae | Lepidocyrtus | Lepidocyrtus cyaneus | 4 |
| Entomobryidae | Lepidocyrtus | Lepidocyrtus lignorum | 4 |
| Entomobryidae | Lepidocyrtus | Lepidocyrtus sejmczanicus | 4 |
| Entomobryidae | Pseudosinella | Pseudosinella alba | 4 |
| Neanuridae | Neanura | Neanura magna | 2 |
| Neanuridae | Neanura | Neanura muscorum | 2 |
| Orchesellidae | Orchesellides | Orchesellides sinensis | 4 |
| Poduridae | Podura | Podura aquatica | 4 |
| Arrhopalites | Arrhopalites | Arrhopalites pukouensis | 0 |
| Bourletiella | Bourletiella | Bourletiella hortensis | 4 |
| Dicyrtomidae | Ptenothrix | Ptenothrix atra | 4 |
| Onychiuridae | Thalassaphorura | Thalassaphorura macrospinata | 0 |
| Site | Land Type | N (g/kg) | C (g/kg) | pH |
|---|---|---|---|---|
| Fujin | Soybean | 2.706 ± 0.292 | 23.31 ± 5.302 | 6.352 ± 0.131 |
| Maize | 2.952 ± 0.392 | 23.39 ± 5.177 | 6.572 ± 0.215 | |
| Rice | 2.788 ± 0.234 | 22.92 ± 4.32 | 6.37 ± 0.316 | |
| Huanan | Soybean | 3.094 ± 0.498 | 26.68 ± 4.651 | 6.202 ± 0.11 |
| Maize | 2.582 ± 0.463 | 21.55 ± 3.224 | 6.374 ± 0.154 | |
| Rice | 3.078 ± 0.354 | 24.64 ± 3.225 | 6.212 ± 0.193 | |
| Youyi | Soybean | 2.99 ± 0.373 | 25.17 ± 5.258 | 6.3 ± 0.087 |
| Maize | 3 ± 0.308 | 27.5 ± 4.441 | 6.57 ± 0.234 | |
| Rice | 2.95 ± 0.445 | 26.36 ± 5.894 | 6.32 ± 0.102 |
| Total Collembola | Epedaphic Collembola | Hemiedaphic Collembola | Euedaphic Collembola | |||||
|---|---|---|---|---|---|---|---|---|
| Density | Species Richness | Density | Species Richness | Density | Species Richness | Density | Species Richness | |
| Huanan–Fujin | 0.059 (*) | 0.055 (*) | 0.292 | 0.995 | 0.658 | 0.225 | 0.003 ** | 0.0051 (*) |
| Youyi–Fujin | 0.233 | 0.075 (*) | 0.307 | 0.737 | 0.236 | 0.112 | 0.352 | 0.0013 ** |
| Youyi–Huanan | 0.819 | 0.998 | 0.999 | 0.677 | 0.709 | 0.910 | 0.149 | 0.871 |
| Maize–Soybean | <0.001 *** | <0.001 *** | 0.126 | 0.269 | 0.005 ** | <0.001 *** | <0.001 *** | 0.494 |
| Rice–Soybean | <0.001 *** | <0.001 *** | 0.0011 ** | <0.001 *** | <0.001 *** | <0.001 *** | <0.001 *** | <0.001 *** |
| Rice–Maize | <0.001 *** | <0.001 *** | 0.142 | <0.001 *** | 0.076 (*) | 0.546 | 0.007 ** | <0.001 *** |
References
- Kim, H.; Lazurko, A.; Linney, G.; Maskell, L.; Díaz-General, E.; Březovská, R.J.; Keune, H.; Laspidou, C.; Malinen, H.; Oinonen, S.; et al. Understanding the role of biodiversity in the climate, food, water, energy, transport and health nexus in Europe. Sci. Total Environ. 2024, 925, 171692. [Google Scholar] [CrossRef] [PubMed]
- Hoogen, J.V.; Geisen, S.; Routh, D.; Ferris, H.; Traunspurger, W.; Wardle, D.A.; Goede, R.D.; Adams, B.J.; Ahmad, W.; Andriuzzi, W.S.; et al. Soil nematode abundance and functional group composition at a global scale. Nature 2019, 572, 194–198. [Google Scholar] [CrossRef]
- Phillips, H.R.; Guerra, C.A.; Bartz, M.L.; Briones, M.J.; Brown, G.G.; Ferlian, O.; Gongalsk, K.; Krebs, J.J.; Orgiazzi, A.; Schwarz, B.; et al. Global distribution of earthworm diversity. Science 2019, 366, 480–485. [Google Scholar] [CrossRef]
- Tariq, A.; Sardans, J.; Zeng, F.; Graciano, C.; Hughes, A.C.; Farré-Armengol, G.; Peñuelas, J. Impact of aridity rise and arid lands expansion on carbon-storing capacity, biodiversity loss, and ecosystem services. Glob. Change Biol. 2024, 30, e17292. [Google Scholar] [CrossRef] [PubMed]
- Coelho, M.T.P.; Barreto, E.; Rangel, T.F.; Diniz-Filho, J.A.F.; Wüest, R.O.; Bach, W.; Skeels, A.; McFadden, I.R.; Roberts, D.W.; Pellissier, L.; et al. The geography of climate and the global patterns of species diversity. Nature 2023, 622, 537–544. [Google Scholar] [CrossRef] [PubMed]
- Kardol, P.; Reynolds, W.N.; Norby, R.J.; Classen, A.T. Climate change effects on soil microarthropod abundance and community structure. Appl. Soil Ecol. 2011, 47, 37–44. [Google Scholar] [CrossRef]
- Mcgeoch, M.A.; Le Roux, P.C.; Hugo, E.A.; Chown, S.L. Species and community responses to short-term climate manipulation: Microarthropods in the sub-Antarctic. Austral Ecol. 2006, 31, 719–731. [Google Scholar] [CrossRef]
- Atkinson, J.; Brudvig, L.A.; Mallen-Cooper, M.; Nakagawa, S.; Moles, A.T.; Bonser, S.P. Terrestrial ecosystem restoration increases biodiversity and reduces its variability, but not to reference levels: A global meta-analysis. Ecol. Lett. 2022, 25, 1725–1737. [Google Scholar] [CrossRef]
- Dang, Y.P.; Moody, P.W.; Bell, M.J.; Seymour, N.P.; Dalal, R.C.; Freebairn, D.M.; Walker, S.R. Strategic tillage in no-till farming systems in Australia’s northern grains-growing regions: II. Implications for agronomy, soil and environment. Soil Tillage Res. 2015, 152, 115–123. [Google Scholar] [CrossRef]
- Hopkin, S.P. The Biology of the Collembola (Springtails): The Most Abundant Insects in the World; Oxford University Press: Oxford, UK, 1997. [Google Scholar]
- Tordoff, G.M.; Boddy, L.; Jones, T.H. Species-specific impacts of Collembola grazing on fungal foraging ecology. Soil Biol. Biochem. 2008, 40, 434–442. [Google Scholar] [CrossRef]
- Rusek, J. Biodiversity of Collembola and their functional role in the ecosystem. Biodivers. Conserv. 1998, 7, 1207–1219. [Google Scholar] [CrossRef]
- Filser, J. The role of Collembola in carbon and nitrogen cycling in soil. Pedobiologia 2002, 46, 234–245. [Google Scholar] [CrossRef]
- McCormack, S.A.; Ostle, N.; Bardgett, R.D.; Hopkins, D.W.; Vanbergen, A.J. Biochar in bioenergy cropping systems: Impacts on soil faunal communities and linked ecosystem processes. GCB Bioenergy 2013, 5, 81–95. [Google Scholar] [CrossRef]
- Potapov, A.M.; Bellini, B.C.; Chown, S.L.; Deharveng, L.; Janssens, F.; Kováč, L.; Kuznetsova, N.A.; Ponge, J.-F.; Potapov, M.; Querner, P.; et al. Towards a global synthesis of Collembola knowledge: Challenges and potential solutions. Soil Org. 2020, 92, 161–188. [Google Scholar]
- Loranger, G.; Bandyopadhyaya, I.; Razaka, B.; Ponge, J.F. Does soil acidity explain altitudinal sequences in Collembolan communities? Soil Biol. Biochem. 2001, 33, 381–393. [Google Scholar] [CrossRef]
- Cassagne, N.; Gers, C.; Gauquelin, T. Relationships between Collembola, soil chemistry and humus types in forest stands (France). Biol. Fertil. Soils 2003, 37, 355–361. [Google Scholar] [CrossRef]
- Gutiérrez-López, M.; Jesús, J.B.; Trigo, D.; Fernández, R.; Novo, M.; Díaz-Cosín, D.J. Relationships among spatial distribution of soil microarthropods, earthworm species and soil properties. Pedobiologia 2010, 53, 381–389. [Google Scholar] [CrossRef]
- Ponge, J.F.; Gillet, S.; Dubs, F.; Fedoroff, E.; Haese, L.; Sousa, J.P.; Lavelle, P. Collembolan communities as bioindicators of land use intensification. Soil Biol. Biochem. 2003, 35, 813–826. [Google Scholar] [CrossRef]
- Salmon, S.; Ponge, J.F.; Gachet, S.; Deharveng, L.; Lefebvre, N.; Delabrosse, F. Linking species, traits and habitat characteristics of Collembola at European scale. Soil Biol. Biochem. 2014, 75, 73–85. [Google Scholar] [CrossRef]
- Frampton, G.K. The potential of Collembola as indicators of pesticide usage: Evidence and methods from the UK arable ecosystem. Pedobiologia 1997, 41, 179–184. [Google Scholar] [CrossRef]
- Hågvar, S.; Klanderud, K. Effect of simulated environmental change on alpine soil arthropods. Glob. Change Biol. 2009, 15, 2972–2980. [Google Scholar] [CrossRef]
- Gisin, H. Okologie und Lebensgemeinschaften der Collembolen im schweizerischen Exkursionsgebiet Basels. Rev. Suisse Zool. 1943, 50, 131–224. [Google Scholar]
- Potapov, A.A.; Semenina, E.E.; Korotkevich, A.Y.; Kuznetsova, N.A.; Tiunov, A.V. Connecting taxonomy and ecology: Trophic niches of collembolans as related to taxonomic identity and life forms. Soil Biol. Biochem. 2016, 101, 20–31. [Google Scholar] [CrossRef]
- Korotkevich, A.Y.; Kuznetsova, N.A.; Goncharov, A.A. Effect of detrital subsidy on the Collembola community structure in winter wheat agroecosystems. Appl. Soil Ecol. 2024, 203, 105676. [Google Scholar] [CrossRef]
- Xie, Z.; Lux, J.; Wu, Y.; Sun, X.; Chen, T.; Zhu, J.; Zhang, J.; Wu, D.; Scheu, S. Intraspecific variability and species turnover drive variations in Collembola body size along a temperate-boreal elevation gradient. Geoderma 2024, 441, 116731. [Google Scholar] [CrossRef]
- Krab, E.J.; Oorsprong, H.; Berg, M.P.; Cornelissen, J.H.C. Turning northern peatlands upside down: Disentangling microclimate and substrate quality effects on vertical distribution of Collembola. Funct. Ecol. 2010, 24, 1362–1369. [Google Scholar] [CrossRef]
- Makkonen, M.; Berg, M.P.; van Hal, J.R.; Callaghan, T.V.; Press, M.C.; Aerts, R. Traits explain the responses of a sub-arctic Collembola community to climate manipulation. Soil Biol. Biochem. 2011, 43, 377–384. [Google Scholar] [CrossRef]
- van Dooremalen, C.; Berg, M.P.; Ellers, J. Acclimation responses to temperature vary with vertical stratification: Implications for vulnerability of soil-dwelling species to extreme temperature events. Glob. Change Biol. 2013, 19, 975–984. [Google Scholar] [CrossRef]
- Thakur, M.P.; Sigurðsson, B.D.; Sigurðsson, P.; Holmstrup, M. Warming shifts the biomass distribution of soil microarthropod communities. Soil Biol. Biochem. 2023, 177, 108894. [Google Scholar] [CrossRef]
- Ponge, J.F.; Dubs, F.; Gillet, S.; Sousa, J.P.; Lavelle, P. Decreased biodiversity in soil springtail communities: The importance of dispersal and landuse history in heterogeneous landscapes. Soil Biol. Biochem. 2006, 38, 1158–1161. [Google Scholar] [CrossRef]
- Silva, P.M.; Carvalho, F.; Dirilgen, T.; Stone, D.; Creamer, R.E.; Bolger, T.; Sousa, J.P. Traits of collembolan life-form indicate land use types and soil properties across an European transect. Appl. Soil Ecol. 2016, 97, 69–77. [Google Scholar] [CrossRef]
- Silva, N.R.; Fialho, J.S.; Primo, A.A.; Filho, J.F.; Rezende, C.F.; Campanha, M.M.; Barros, V.M.; de Oliveira, T.S. The diversity of soil-dwelling arthropods is significantly influenced by land use systems with tree cover in semiarid conditions. Eur. J. Soil Biol. 2024, 122, 103667. [Google Scholar] [CrossRef]
- North, G.C.; Frelich, L.E.; Guthmann, A. Soil macrofauna communities vary by land use type and environmental conditions in the Serengeti-Mara ecosystem. Appl. Soil Ecol. 2025, 206, 105897. [Google Scholar] [CrossRef]
- Lam, H.; Remais, J.V.; Fung, M.C.; Xu, L.; Sun, S.S. Food supply and food safety issues in China. Lancet 2013, 381, 2044–2053. [Google Scholar] [CrossRef] [PubMed]
- Sun, T.; Li, Z.Z. Alfalfa-corn rotation and row placement affects yield, water use, and economic returns in Northeast China. Field Crops Res. 2019, 241, 107558. [Google Scholar] [CrossRef]
- Lv, Y.; Wang, Y.; Wang, L.; Zhu, P. Straw Return with Reduced Nitrogen Fertilizer Maintained Maize High Yield in Northeast China. Agronomy 2019, 9, 229. [Google Scholar] [CrossRef]
- Chinese Academy of Sciences. Northeast China Black Soil White Paper; Chinese Academy of Sciences: Beijing, China, 2022. [Google Scholar]
- Wang, J.X. Characteristics of Temporal Changes in Air Temperature in the Northeast Black Soil Region from 1979 to 2020. Geogr. Sci. Res. 2024, 13, 337–342. [Google Scholar]
- Zhang, H.; Zhou, G.; Liu, L.; Wang, B.; Xiao, D.; He, L. Climate-associated rice yield change in the Northeast China Plain:A simulation analysis based on CMIP5multi-model ensemble projection. Sci. Total Environ. 2019, 666, 126–138. [Google Scholar] [CrossRef]
- Piao, J.; Chen, W.; Chen, S.; Gong, H.; Wang, L. Mean states and future projections of precipitation over the monsoon transitional zone in China in CMIP5 and CMIP6 models. Clim. Change 2021, 169, 35. [Google Scholar] [CrossRef]
- Zhang, Y.; Bian, Z.; Guo, X.; Wang, C.; Guan, D. Strategic land management for ecosystem Sustainability: Scenario insights from the Northeast black soil region. Ecol. Indic. 2024, 168, 112784. [Google Scholar] [CrossRef]
- Fang, H.M.; Zhang, R.F.; Zhou, L.L.; Wu, M.; Liu, Y.H. Impact of climate change on freeze-thaw function and freeze-thaw erosion in black soil region of Northeast China. J. Arid Land Resour. Environ. 2009, 23, 48–53. [Google Scholar]
- Lan, J.; Lei, X.; He, X.; Gao, W.; Guo, H. Multiple mechanisms drive biodiversity-ecosystem service multifunctionality but the dominant one depends on the level of multifunctionality for natural forests in northeast China. For. Ecol. Manag. 2023, 542, 121101. [Google Scholar] [CrossRef]
- Liu, Z.J.; Yang, X.G.; Wang, W.F.; Li, K.N.; Zhang, X.Y. Characteristics of agricultural climate resources in three provinces of Northeast China under global climate change. Chin. J. Appl. Ecol. 2009, 20, 2199–2206. [Google Scholar]
- Wang, F.; Zhao, Z.; Wang, P.; Zhong, L.; Yang, S.; Tang, J.; Hou, S.; Cao, Y.; Yang, R. Over 1/4 of China’s terrestrial area significantly contributed both to biodiversity conservation and carbon neutrality, requiring protection. Sci. Total Environ. 2023, 20, 169070. [Google Scholar] [CrossRef] [PubMed]
- Jing, L.; Ao, B.; Kakati, L.N.; Semy, K. Temporal Variations and the Impact of Regional Climate on Earthworm Fauna in Subtropical Forest Ecosystems. Glob. Ecol. Conserv. 2025, 58, e03442. [Google Scholar]
- Mamabolo, E.; Gaigher, R.; Pryke, J.S. Conventional agricultural management negatively affects soil fauna abundance, soil physicochemical quality and multifunctionality. Pedobiologia 2024, 104, 150961. [Google Scholar] [CrossRef]
- Yin, R.; Gruss, I.; Eisenhauer, N.; Kardol, P.; Thakur, M.P.; Schmidt, A.; Xu, Z.; Siebert, J.; Zhang, C.; Wu, G.; et al. Land use modulates the effects of climate change on density but not community composition of Collembola. Soil Biol. Biochem. 2019, 138, 107598. [Google Scholar] [CrossRef]
- Han, X.Z.; Na, L. Research Progress of Black Soil in Northeast China. Chin. Geogr. Sci. 2018, 38, 1032–1041. [Google Scholar]
- Dunger, W.; Schlitt, B. Synopses on palaearctic Collembola: Tullbergiidae. Soil Org. 2011, 83, 1–168. [Google Scholar]
- Fjellberg, A. The Collembola of Fennoscadia and Denmark—Part II: Entomobryomorpha and Symphypleona; Brill: Leiden, The Netherlands, 2007. [Google Scholar]
- Hopkin, S.P. A Key to the Collembola (Springtails) of Britain and Ireland; Field Studies Council (AIDGAP Project): Shropshire, UK, 2007; Volume 245. [Google Scholar]
- Pomorski, R.J. Onychiuridae of Poland (Collembola: Onychiuridae); Polskie Towarzystwo Taksonomiczne: Wrocław, Poland, 1998. [Google Scholar]
- Potapov, M.B. Synopses on Palaearctic Collembola, Volume 3, Isotomidae; Senckenberg Museum of Natural History Görlitz: Görlitz, Germany, 2001. [Google Scholar]
- Bivand, R.S.; Pebesma, E.J.; Gómez-Rubio, V. Applied Spatial Data Analysis with R, 2nd ed.; Use R! Springer: New York, NY, USA, 2008. [Google Scholar]
- Hijmans, R.J. Raster: Geographic Data Analysis and Modeling. 2024. Available online: https://cran.r-project.org/web/packages/raster/raster.pdf (accessed on 25 July 2024).
- Yang, J.H.; Wang, C.L.; Dai, H.L. Soil Agrochemical Analysis and Environmental Monitoring; China Earth Press: Beijing, China, 2008. [Google Scholar]
- Bossio, D.A.; Scow, K.M. Impacts of carbon and flooding on soil microbial communities: Phospholipid fatty acid profiles and substrate utilization patterns. Microb. Ecol. 1998, 35, 265–278. [Google Scholar] [CrossRef]
- Jia, S.X.; Liang, A.Z.; Zhang, S.X.; Chen, X.W.; McLaughlin, N.B.; Sun, B.J.; Zhang, X.P.; Wu, D.H. Effect of tillage system on soil CO2 flux, soil microbial community and maize (Zea mays L.) yield. Geoderma 2021, 384, 114813. [Google Scholar] [CrossRef]
- Zhang, S.X.; Chang, L.; McLaughlin, N.B.; Cui, S.Y.; Wu, H.T.; Wu, D.H.; Liang, W.J.; Liang, A.Z. Complex soil food web enhances the association between N mineralization and soybean yield—A model study from lonG-term application of a conservation tillage system in a black soil of Northeast China. Soil 2021, 7, 71–82. [Google Scholar] [CrossRef]
- Lüdecke, D.; Ben-Shachar, M.S.; Patil, I.; Waggoner, P.; Makowski, D. performance: An R package for assessment, comparison and testing of statistical models. J. Open Source Softw. 2021, 6, 3139. [Google Scholar] [CrossRef]
- Rao, C. The use and interpretation of principal component analysis in applied research. Sankhya Indian J. Stat. Ser. A 1964, 26, 329–358. [Google Scholar]
- van den Wollenberg, A.L. Redundancy analysis an alternative for canonical correlation analysis. Psychometrika 1977, 42, 207–219. [Google Scholar] [CrossRef]
- Oksanen, J.; Simpson, G.; Blanchet, F.; Kindt, R.; Legendre, P.; Minchin, P.; O’Hara, R.; Solymos, P.; Stevens, M.; Szoecs, E.; et al. Vegan: Community Ecology Package, 2025, R Package Version 2.610. Available online: https://cran.r-project.org/web/packages/vegan/index.html (accessed on 29 July 2024).
- Lepš, J.; Šmilauer, P. Multivariate Analysis of Ecological Data using CANOCO: Preface; Cambridge University Press: Cambridge, UK, 2003. [Google Scholar]
- Li, K.; Song, L.; Ran, Q.; Yuan, F.; Deng, C.; Liu, H. Global meta-analysis reveals differential effects of climate and litter quality on soil fauna-mediated litter decomposition across size classes. Geoderma 2024, 450, 117042. [Google Scholar] [CrossRef]
- Thakur, M.P.; Reich, P.B.; Hobbie, S.E.; Stefanski, A.; Rich, R.; Rice, K.E.; Eddy, W.C.; Eisenhauer, N. Reduced feeding activity of soil detritivores under warmer and drier conditions. Nat. Clim. Change 2018, 8, 75–78. [Google Scholar] [CrossRef] [PubMed]
- Chauvat, M.; Forey, E. Temperature modifies the magnitude of a plant response to Collembola presence. Appl. Soil Ecol. 2021, 158, 103814. [Google Scholar] [CrossRef]
- Meehan, M.L.; Barreto, C.; Turnbull, M.S.; Bradley, R.L.; Bellenger, J.P.; Darnajoux, R.; Lindo, Z. Response of soil fauna to simulated global change factors depends on ambient climate conditions. Pedobiologia 2020, 83, 150672. [Google Scholar] [CrossRef]
- Zhang, H.; Sun, X.; Liu, D.; Wu, H.; Chen, H. Air Warming and Drainage Influences Soil Microarthropod Communities. Front. Ecol. Evol. 2021, 9, 731735. [Google Scholar] [CrossRef]
- Saifutdinov, R.A.; Sabirov, R.M.; Zaitsev, A.S. Springtail (Hexapoda: Collembola) functional group composition varies between different biotopes in Russian rice growing systems. Eur. J. Soil Biol. 2020, 99, 103208. [Google Scholar] [CrossRef]
- Sławska, M. Collembola communities in Sphagnum basin bogs and their importance to biodiversity of pine forest. Pedobiologia 2000, 44, 413–420. [Google Scholar] [CrossRef]
- Chang, L.; Wu, H.; Wu, D.; Sun, X. Effect of tillage and farming management on Collembola in marsh soils. Appl. Soil Ecol. 2013, 64, 112–117. [Google Scholar] [CrossRef]
- Peddle, S.D.; Cando-Dumancela, C.; Krauss, S.L.; Liddicoat, C.; Sanders, A.; Breed, M.F. Agricultural land-use legacies affect soil bacterial communities following restoration in a global biodiversity hotspot. Biol. Conserv. 2024, 290, 110434. [Google Scholar] [CrossRef]
- Yang, P.; Shen, M.; Zhang, Y.; Wang, H.; Xue, Y.; Chen, B.; Bian, J.; Li, P.; Zhang, T.; Wang, L.; et al. Effects of land consolidation intensity on landscape pattern and biodiversity in paddy ecosystem. Agric. Ecosyst. Environ. 2025, 381, 109458. [Google Scholar] [CrossRef]
- Pérez-Roig, C.; Videla, M.; El Mujtar, V.; Tittonell, P.A.; Potapov, A.M. Soil food-web energy fluxes reveal diverse responses to smallholder land-use choices in temperate forests. Soil Biol. Biochem. 2025, 200, 109619. [Google Scholar] [CrossRef]
- Ponge, J.F. Move or change, an eco-evolutionary dilemma: The case of Collembola. Pedobiologia 2020, 79, 150625. [Google Scholar] [CrossRef]
- Ferrín, M.; Peñuelas, J.; Gargallo-Garriga, A.; Iribar, A.; Janssens, I.A.; Marañón-Jiménez, S.; Murienne, J.; Richter, A.; Sigurdsson, B.D.; Peguero, G. Responses of soil hexapod communities to warming are mediated by microbial carbon and nitrogen in a subarctic grassland. Eur. J. Soil Biol. 2023, 117, 103513. [Google Scholar] [CrossRef]
- Holmstrup, M.; Bayley, M. Protaphorura tricampata, a euedaphic and highly permeable springtail that can sustain activity by osmoregulation during extreme drought. J. Insect Physiol. 2013, 59, 1104–1110. [Google Scholar] [CrossRef]
- Zhou, W.; Lv, T.; Chen, Y.; Westby, A.P.; Ren, W. Soil Physicochemical and Biological Properties of Paddy-Upland Rotation: A Review. Sci. World J. 2014, 2014, 856352. [Google Scholar] [CrossRef]
- Larsen, T.; Schjønning, P.; Axelsen, J.A. The impact of soil compaction on euedaphic Collembola. Appl. Soil Ecol. 2004, 26, 273–281. [Google Scholar] [CrossRef]
- Cardinale, B.J.; Duffy, J.E.; Gonzalez, A.; Hooper, D.U.; Perrings, C.; Venail, P.A.; Narwani, A.; Mace, G.M.; Tilman, D.; Wardle, D.A.; et al. Biodiversity loss and its impact on humanity. Nature 2012, 486, 59–67. [Google Scholar] [CrossRef] [PubMed]
- Ehnes, R.B.; Rall, B.C.; Brose, U. Phylogenetic grouping, curvature and metabolic scaling in terrestrial invertebrates. Ecol. Lett. 2011, 14, 993–1000. [Google Scholar] [CrossRef] [PubMed]
- Gillooly, J.F.; Brown, J.H.; West, G.B.; Savage, V.M.; Charnov, E.L. Effects of size and temperature on metabolic rate. Science 2001, 293, 2248–2251. [Google Scholar] [CrossRef] [PubMed]
- Brown, J.H.; Gillooly, J.F.; Allen, A.P.; Savage, V.M.; West, G.B. Toward a metabolic theory of ecology. Ecology 2004, 85, 1771–1789. [Google Scholar] [CrossRef]
- Kutcherov, D.; Slotsbo, S.; Sigurdsson, B.D.; Leblans, N.I.W.; Berg, M.P.; Ellers, J.; Mariën, J.; Holmstrup, M. Temperature responses in a subarctic springtail from two geothermally warmed habitats. Pedobiologia 2020, 78, 150606. [Google Scholar] [CrossRef]

| Effects | Df | Microorganism | |||||||
|---|---|---|---|---|---|---|---|---|---|
| Actinomycete | Anaerobe | AMF | Eukaryote | Fungus | G+ | G− | |||
| Climate (C) | 2 | F | 15.937 | 5.048 | 10.789 | 0.647 | 1.22 | 1.920 | 11.754 |
| p | <0.001 *** | 0.008 ** | <0.001 *** | 0.525 | 0.295 | 0.150 | <0.001 *** | ||
| Land use (L) | 2 | F | 5.397 | 1.873 | 5.035 | 0.262 | 0.425 | 3.316 | 8.068 |
| p | 0.005 ** | 0.157 | 0.007 ** | 0.770 | 0.654 | 0.039 * | <0.001 *** | ||
| C × L | 4 | F | 0.414 | 0.874 | 5.906 | 0.137 | 2.026 | 1.444 | 1.728 |
| p | 0.798 | 0.481 | <0.001 *** | 0.968 | 0.0939 (*) | 0.223 | 0.147 | ||
| Effects | Df | Total Collembola | ||
|---|---|---|---|---|
| Collembola Density | Collembola Species Richness | |||
| Climate (C) | 2 | F | 2.812 | 3.425 |
| p | 0.063 (*) | 0.035 * | ||
| Land use (L) | 2 | F | 47.348 | 43.132 |
| p | <0.001 *** | <0.001 *** | ||
| C × L | 4 | F | 0.480 | 1.136 |
| p | 0.751 | 0.342 | ||
| Effects | Df | Epedaphic Collembola | ||
| Collembola Density | Collembola Species Richness | |||
| Climate (C) | 2 | F | 1.482 | 0.418 |
| p | 0.231 | 0.659 | ||
| Land use (L) | 2 | F | 7.125 | 15.364 |
| p | 0.002 ** | <0.001 *** | ||
| C × L | 4 | F | 1.700 | 0.417 |
| p | 0.153 | 0.796 | ||
| Effects | Df | Hemiedaphic Collembola | ||
| Collembola Density | Collembola Species Richness | |||
| Climate (C) | 2 | F | 1.331 | 2.320 |
| p | 0.267 | 0.102 | ||
| Land use (L) | 2 | F | 13.852 | 14.529 |
| p | <0.001 *** | <0.001 *** | ||
| C × L | 4 | F | 0.751 | 2.544 |
| p | 0.559 | 0.042 * | ||
| Effects | Df | Euedaphic Collembola | ||
| Collembola Density | Collembola Species Richness | |||
| Climate (C) | 2 | F | 5.630 | 7.724 |
| p | 0.003 ** | <0.001 *** | ||
| Land use (L) | 2 | F | 27.401 | 28.979 |
| p | <0.001 *** | <0.001 *** | ||
| C × L | 4 | F | 0.667 | 0.552 |
| p | 0.616 | 0.698 | ||
| Effect | R2 | p-Value |
|---|---|---|
| Land use practices | 0.401 | 0.001 |
| MAP | 0.061 | 0.007 |
| Fungi | 0.048 | 0.023 |
| AMF | 0.046 | 0.024 |
| G− | 0.041 | 0.033 |
| G+ | 0.036 | 0.058 |
| MAT | 0.033 | 0.084 |
| Actinomycetes | 0.018 | 0.207 |
| Anaerobe | 0.007 | 0.553 |
| Eukaryote | 0.004 | 0.714 |
| Axis | Df | Var | F | p |
|---|---|---|---|---|
| RDA1 | 1 | 43.02086 | 26.71935 | 0.001 |
| RDA2 | 1 | 9.913363 | 6.15698 | 0.128 |
| RDA3 | 1 | 2.61313 | 1.62296 | 0.988 |
| RDA4 | 1 | 1.335855 | 0.829672 | 1 |
| RDA5 | 1 | 1.078449 | 0.669802 | 1 |
| RDA6 | 1 | 0.722842 | 0.448942 | 1 |
| RDA7 | 1 | 0.377377 | 0.234381 | 1 |
| RDA8 | 1 | 0.153134 | 0.095108 | 1 |
| RDA9 | 1 | 0.109407 | 0.06795 | 1 |
| RDA10 | 1 | 0.047508 | 0.029506 | 1 |
Disclaimer/Publisher’s Note: The statements, opinions and data contained in all publications are solely those of the individual author(s) and contributor(s) and not of MDPI and/or the editor(s). MDPI and/or the editor(s) disclaim responsibility for any injury to people or property resulting from any ideas, methods, instructions or products referred to in the content. |
© 2025 by the authors. Licensee MDPI, Basel, Switzerland. This article is an open access article distributed under the terms and conditions of the Creative Commons Attribution (CC BY) license (https://creativecommons.org/licenses/by/4.0/).
Share and Cite
Li, C.; Zhang, S.; Wang, B.; Ai, Z.; Zhang, S.; Shao, Y.; Du, J.; Wang, C.; Wajid, S.; Wu, D.; et al. Euedaphic Rather than Hemiedaphic or Epedaphic Collembola Are More Sensitive to Different Climate Conditions in the Black Soil Region of Northeast China. Insects 2025, 16, 275. https://doi.org/10.3390/insects16030275
Li C, Zhang S, Wang B, Ai Z, Zhang S, Shao Y, Du J, Wang C, Wajid S, Wu D, et al. Euedaphic Rather than Hemiedaphic or Epedaphic Collembola Are More Sensitive to Different Climate Conditions in the Black Soil Region of Northeast China. Insects. 2025; 16(3):275. https://doi.org/10.3390/insects16030275
Chicago/Turabian StyleLi, Chunbo, Shaoqing Zhang, Baifeng Wang, Zihan Ai, Sha Zhang, Yongbo Shao, Jing Du, Chenxu Wang, Sidra Wajid, Donghui Wu, and et al. 2025. "Euedaphic Rather than Hemiedaphic or Epedaphic Collembola Are More Sensitive to Different Climate Conditions in the Black Soil Region of Northeast China" Insects 16, no. 3: 275. https://doi.org/10.3390/insects16030275
APA StyleLi, C., Zhang, S., Wang, B., Ai, Z., Zhang, S., Shao, Y., Du, J., Wang, C., Wajid, S., Wu, D., & Chang, L. (2025). Euedaphic Rather than Hemiedaphic or Epedaphic Collembola Are More Sensitive to Different Climate Conditions in the Black Soil Region of Northeast China. Insects, 16(3), 275. https://doi.org/10.3390/insects16030275