The Association of Serum Calprotectin with Fitness Indicators and Biochemical Markers in High-Level Athletes: A Continuous Dynamic Monitoring during One Competitive Season

 , , , and
Abstract
:1. Introduction
2. Materials and Methods
2.1. Subjects and Experimental Design
2.2. Blood Collection
2.3. Biochemical Marker Analysis
2.4. Test of Physical Fitness
2.4.1. Repetitive Strength
Maximum Sit-Ups in 60 Seconds (SU-MR60′)
Pull-Ups until Failure (PU-MR)
Bench Press with 70% of Own Body Weight (BP70%MR)
Squats to 90 Degrees in 60 Seconds (BSQ90°-60′)
2.4.2. Maximal Strength
One Maximal Repetition of Bench Press (BP-1RM)
One Squat with Maximal Load (BSQ-1RM)
One Wide Pull behind the Head (LPU-1RM)
2.4.3. Static Strength
Back Extension Test (BET)
2.4.4. Pain
2.5. Statistical Analysis
3. Results
3.1. Biochemical Parameters and Physical Activity Measurements in Four Phases during One Competitive Season
3.2. Correlation Analyses between Calprotectin and Other Biochemical Parameters during Different Phases
3.3. Correlation Coefficients of Biochemical Parameters with Fitness Indicators
4. Discussion
5. Conclusions
Author Contributions
Funding
Institutional Review Board Statement
Informed Consent Statement
Data Availability Statement
Acknowledgments
Conflicts of Interest
References
- Olympics. Olympic Games, Medals, Results & Latest News. Available online: https://olympics.com/en/ (accessed on 19 September 2023).
- Stromberg, J.D. Care of Water Polo Players. Curr. Sports Med. Rep. 2017, 16, 363–369. [Google Scholar] [CrossRef] [PubMed]
- Mountjoy, M.; Miller, J.; Junge, A. Analysis of Water Polo Injuries during 8904 Player Matches at FINA World Championships and Olympic Games to Make the Sport Safer. Br. J. Sports Med. 2019, 53, 25–31. [Google Scholar] [CrossRef] [PubMed]
- Prien, A.; Mountjoy, M.; Miller, J.; Boyd, K.; van den Hoogenband, C.; Gerrard, D.; Cherif, M.Y.; Lu, Y.; Nanousis, K.; Ortiz Liscano, E.I.; et al. Injury and Illness in Aquatic Sport: How High Is the Risk? A Comparison of Results from Three FINA World Championships. Br. J. Sports Med. 2017, 51, 277–282. [Google Scholar] [CrossRef] [PubMed]
- Bresciani, G.; Cuevas, M.J.; Molinero, O.; Almar, M.; Suay, F.; Salvador, A.; De Paz, J.A.; Marquez, S.; González-Gallego, J. Signs of Overload after an Intensified Training. Int. J. Sports Med. 2011, 32, 338–343. [Google Scholar] [CrossRef] [PubMed]
- Jürimäe, J.; Mäestu, J.; Jürimäe, T.; Mangus, B.; Von Duvillard, S.P. Peripheral Signals of Energy Homeostasis as Possible Markers of Training Stress in Athletes: A Review. Metabolism 2011, 60, 335–350. [Google Scholar] [CrossRef] [PubMed]
- Eliakim, A.; Portal, S.; Zadik, Z.; Rabinowitz, J.; Adler-Portal, D.; Cooper, D.M.; Zaldivar, F.; Nemet, D. The Effect of a Volleyball Practice on Anabolic Hormones and Inflammatory Markers in Elite Male and Female Adolescent Players. J. Strength Cond. Res. 2009, 23, 1553–1559. [Google Scholar] [CrossRef] [PubMed]
- Lee, E.C.; Fragala, M.S.; Kavouras, S.A.; Queen, R.M.; Pryor, J.L.; Casa, D.J. Biomarkers in Sports and Exercise: Tracking Health, Performance, and Recovery in Athletes. J. Strength Cond. Res. 2017, 31, 2920–2937. [Google Scholar] [CrossRef] [PubMed]
- MacKinnon, L.T. Special Feature for the Olympics: Effects of Exercise on the Immune System: Overtraining Effects on Immunity and Performance in Athletes. Immunol. Cell Biol. 2000, 78, 502–509. [Google Scholar] [CrossRef]
- Smith, L.L. Cytokine Hypothesis of Overtraining: A Physiological Adaptation to Excessive Stress? Med. Sci. Sports Exerc. 2000, 32, 317–331. [Google Scholar] [CrossRef]
- Sayers, S.P.; Clarkson, P.M. Short-Term Immobilization after Eccentric Exercise. Part II: Creatine Kinase and Myoglobin. Med. Sci. Sports Exerc. 2003, 35, 762–768. [Google Scholar] [CrossRef]
- Suzuki, K.; Totsuka, M.; Nakaji, S.; Yamada, M.; Kudoh, S.; Liu, Q.; Sugawara, K.; Yamaya, K.; Sato, K. Endurance Exercise Causes Interaction among Stress Hormones, Cytokines, Neutrophil Dynamics, and Muscle Damage. J. Appl. Physiol. 1999, 87, 1360–1367. [Google Scholar] [CrossRef] [PubMed]
- Koch, A.J.; Pereira, R.; Machado, M. The Creatine Kinase Response to Resistance Exercise. J. Musculoskelet. Neuronal Interact. 2014, 14, 68–77. [Google Scholar] [PubMed]
- Sorichter, S.; Mair, J.; Koller, A.; Gebert, W.; Rama, D.; Calzolari, C.; Artner-Dworzak, E.; Puschendorf, B. Skeletal Troponin I as a Marker of Exercise-Induced Muscle Damage. J. Appl. Physiol. 1997, 83, 1076–1082. [Google Scholar] [CrossRef] [PubMed]
- Gresslien, T.; Agewall, S. Troponin and Exercise. Int. J. Cardiol. 2016, 221, 609–621. [Google Scholar] [CrossRef] [PubMed]
- Shave, R.; Baggish, A.; George, K.; Wood, M.; Scharhag, J.; Whyte, G.; Gaze, D.; Thompson, P.D. Exercise-Induced Cardiac Troponin Elevation: Evidence, Mechanisms, and Implications. J. Am. Coll. Cardiol. 2010, 56, 169–176. [Google Scholar] [CrossRef] [PubMed]
- Fischer, C.P. Interleukin-6 in Acute Exercise and Training: What Is the Biological Relevance? Exerc. Immunol. Rev. 2006, 12, 6–33. [Google Scholar] [PubMed]
- Huh, J.Y. The Role of Exercise-Induced Myokines in Regulating Metabolism. Arch. Pharm. Res. 2018, 41, 14–29. [Google Scholar] [CrossRef] [PubMed]
- Panagiotakos, D.B.; Pitsavos, C.; Chrysohoou, C.; Kavouras, S.; Stefanadis, C. The Associations between Leisure-Time Physical Activity and Inflammatory and Coagulation Markers Related to Cardiovascular Disease: The ATTICA Study. Prev. Med. 2005, 40, 432–437. [Google Scholar] [CrossRef]
- Fedewa, M.V.; Hathaway, E.D.; Ward-Ritacco, C.L. Effect of Exercise Training on C Reactive Protein: A Systematic Review and Meta-Analysis of Randomised and Non-Randomised Controlled Trials. Br. J. Sports Med. 2017, 51, 670–676. [Google Scholar] [CrossRef]
- Schwanbeck, S.R.; Cornish, S.M.; Barss, T.; Chilibeck, P.D. Effects of Training with Free Weights Versus Machines on Muscle Mass, Strength, Free Testosterone, and Free Cortisol Levels. J. Strength Cond. Res. 2020, 34, 1851–1859. [Google Scholar] [CrossRef]
- Hill, E.E.; Zack, E.; Battaglini, C.; Viru, M.; Viru, A.; Hackney, A.C. Exercise and Circulating Cortisol Levels: The Intensity Threshold Effect. J. Endocrinol. Investig. 2008, 31, 587–591. [Google Scholar] [CrossRef] [PubMed]
- Mortensen, O.H.; Andersen, K.; Fischer, C.; Nielsen, A.R.; Nielsen, S.; Åkerström, T.; Aastrøm, M.B.; Borup, R.; Pedersen, B.K. Calprotectin Is Released from Human Skeletal Muscle Tissue during Exercise. J. Physiol. 2008, 586, 3551–3562. [Google Scholar] [CrossRef] [PubMed]
- Fagerhol, M.K.; Nielsen, H.G.; Vetlesen, A.; Sandvik, K.; Lyberg, T. Increase in Plasma Calprotectin during Long-Distance Running. Scand. J. Clin. Lab. Investig. 2005, 65, 211–220. [Google Scholar] [CrossRef] [PubMed]
- Fico, B.G.; Whitehurst, M.; Slusher, A.L.; Mock, J.T.; Maharaj, A.; Dodge, K.M.; Huang, C.J. The Comparison of Acute High-Intensity Interval Exercise vs. Continuous Moderate-Intensity Exercise on Plasma Calprotectin and Associated Inflammatory Mediators. Physiol. Behav. 2018, 183, 27–32. [Google Scholar] [CrossRef] [PubMed]
- Nikolac, N.; Šupak-Smolčić, V.; Šimundić, A.M.; Ćelap, I. Croatian Society of Medical Biochemistry and Laboratory Medicine: National Recommendations for Venous Blood Sampling. Biochem. Med. 2013, 23, 242–254. [Google Scholar] [CrossRef] [PubMed]
- Gleeson, M. Immune Function in Sport and Exercise. J. Appl. Physiol. 2007, 103, 693–699. [Google Scholar] [CrossRef] [PubMed]
- Coppalle, S.; Rave, G.; Ben Abderrahman, A.; Ali, A.; Salhi, I.; Zouita, S.; Zouita, A.; Brughelli, M.; Granacher, U.; Zouhal, H. Relationship of Pre-Season Training Load with in-Season Biochemical Markers, Injuries and Performance in Professional Soccer Players. Front. Physiol. 2019, 10, 409. [Google Scholar] [CrossRef]
- Silva, A.F.; González-Fernández, F.T.; Ceylan, H.I.; Silva, R.; Younesi, S.; Chen, Y.S.; Badicu, G.; Wolański, P.; Murawska-Ciałowicz, E.; Clemente, F.M. Relationships between Fitness Status and Blood Biomarkers in Professional Soccer Players. J. Healthc. Eng. 2022, 2022, 5135817. [Google Scholar] [CrossRef]
- Silva, J.R.; Rebelo, A.; Marques, F.; Pereira, L.; Seabra, A.; Ascensão, A.; Magalhães, J. Biochemical Impact of Soccer: An Analysis of Hormonal, Muscle Damage, and Redox Markers during the Season. Appl. Physiol. Nutr. Metab. 2014, 39, 432–438. [Google Scholar] [CrossRef]
- Brunelli, D.T.; Rodrigues, A.; Lopes, W.A.; Gáspari, A.F.; Bonganha, V.; Montagner, P.C.; Borin, J.P.; Cavaglieri, C.R. Monitoring of Immunological Parameters in Adolescent Basketball Athletes during and after a Sports Season. J. Sports Sci. 2014, 32, 1050–1059. [Google Scholar] [CrossRef]
- Kim, H.J.; Lee, H.C. The Effect of 13 Weeks Long-Distance Bicycle Riding on Inflammatory Response Indicators Related to Joint Cartilage and Muscle Damage. Int. J. Environ. Res. Public Health 2022, 19, 16314. [Google Scholar] [CrossRef]
- Concepcion-Huertas, M.; Chirosa, L.J.; de Haro, T.; Chirosa, I.J.; Romero, V.; Aguilar-Martinez, D.; Leonardo-Mendonça, R.C.; Doerrier, C.; Escames, G.; Acuña-Castroviejo, D. Changes in the Redox Status and Inflammatory Response in Handball Players during One-Year of Competition and Training. J. Sports Sci. 2013, 31, 1197–1207. [Google Scholar] [CrossRef] [PubMed]
- Nemet, D.; Pontello, A.M.; Rose-Gottron, C.; Cooper, D.M. Cytokines and Growth Factors during and after a Wrestling Season in Adolescent Boys. Med. Sci. Sports Exerc. 2004, 36, 794–800. [Google Scholar] [CrossRef] [PubMed]
- Schelling, X.; Calleja-González, J.; Torres-Ronda, L.; Terrados, N. Using Testosterone and Cortisol as Biomarker for Training Individualization in Elite Basketball: A 4-Year Follow-up Study. J. Strength Cond. Res. 2015, 29, 368–378. [Google Scholar] [CrossRef] [PubMed]
- Martínez, A.C.; Calvo, J.S.; Marí, J.A.T.; Inchaurregui, L.C.A.; Orella, E.E.; Biescas, A.P. Testosterone and Cortisol Changes in Professional Basketball Players through a Season Competition. J. Strength Cond. Res. 2010, 24, 1102–1108. [Google Scholar] [CrossRef] [PubMed]
- Kraemer, W.J.; Looney, D.P.; Martin, G.J.; Ratamess, N.A.; Vingren, J.L.; French, D.N.; Hatfield, D.L.; Fragala, M.S.; Spiering, B.A.; Howard, R.L.; et al. Changes in Creatine Kinase and Cortisol in National Collegiate Athletic Association Division i American Football Players during a Season. J. Strength Cond. Res. 2013, 27, 434–441. [Google Scholar] [CrossRef] [PubMed]
- Huggins, R.A.; Fortunati, A.R.; Curtis, R.M.; Looney, D.P.; West, C.A.; Lee, E.C.; Fragala, M.S.; Hall, M.L.; Casa, D.J. Monitoring Blood Biomarkers and Training Load Throughout a Collegiate Soccer Season. J. Strength Cond. Res. 2019, 33, 3065–3077. [Google Scholar] [CrossRef] [PubMed]
- Vecchio, M.; Currò, M.; Trimarchi, F.; Naccari, S.; Caccamo, D.; Ientile, R.; Barreca, D.; Di Mauro, D. The Oxidative Stress Response in Elite Water Polo Players: Effects of Genetic Background. Biomed. Res. Int. 2017, 2017, 7019694. [Google Scholar] [CrossRef]
- Hoffman, J.R.; Kang, J.; Ratamess, N.A.; Faigenbaum, A.D. Biochemical and Hormonal Responses during an Intercollegiate Football Season. Med. Sci. Sports Exerc. 2005, 37, 1237–1241. [Google Scholar] [CrossRef]


| Biochemical Marker | Median I (25th; 75th) | Median II (25th; 75th) | Median III (25th; 75th) | Median IV (25th; 75th) | p-Value |
|---|---|---|---|---|---|
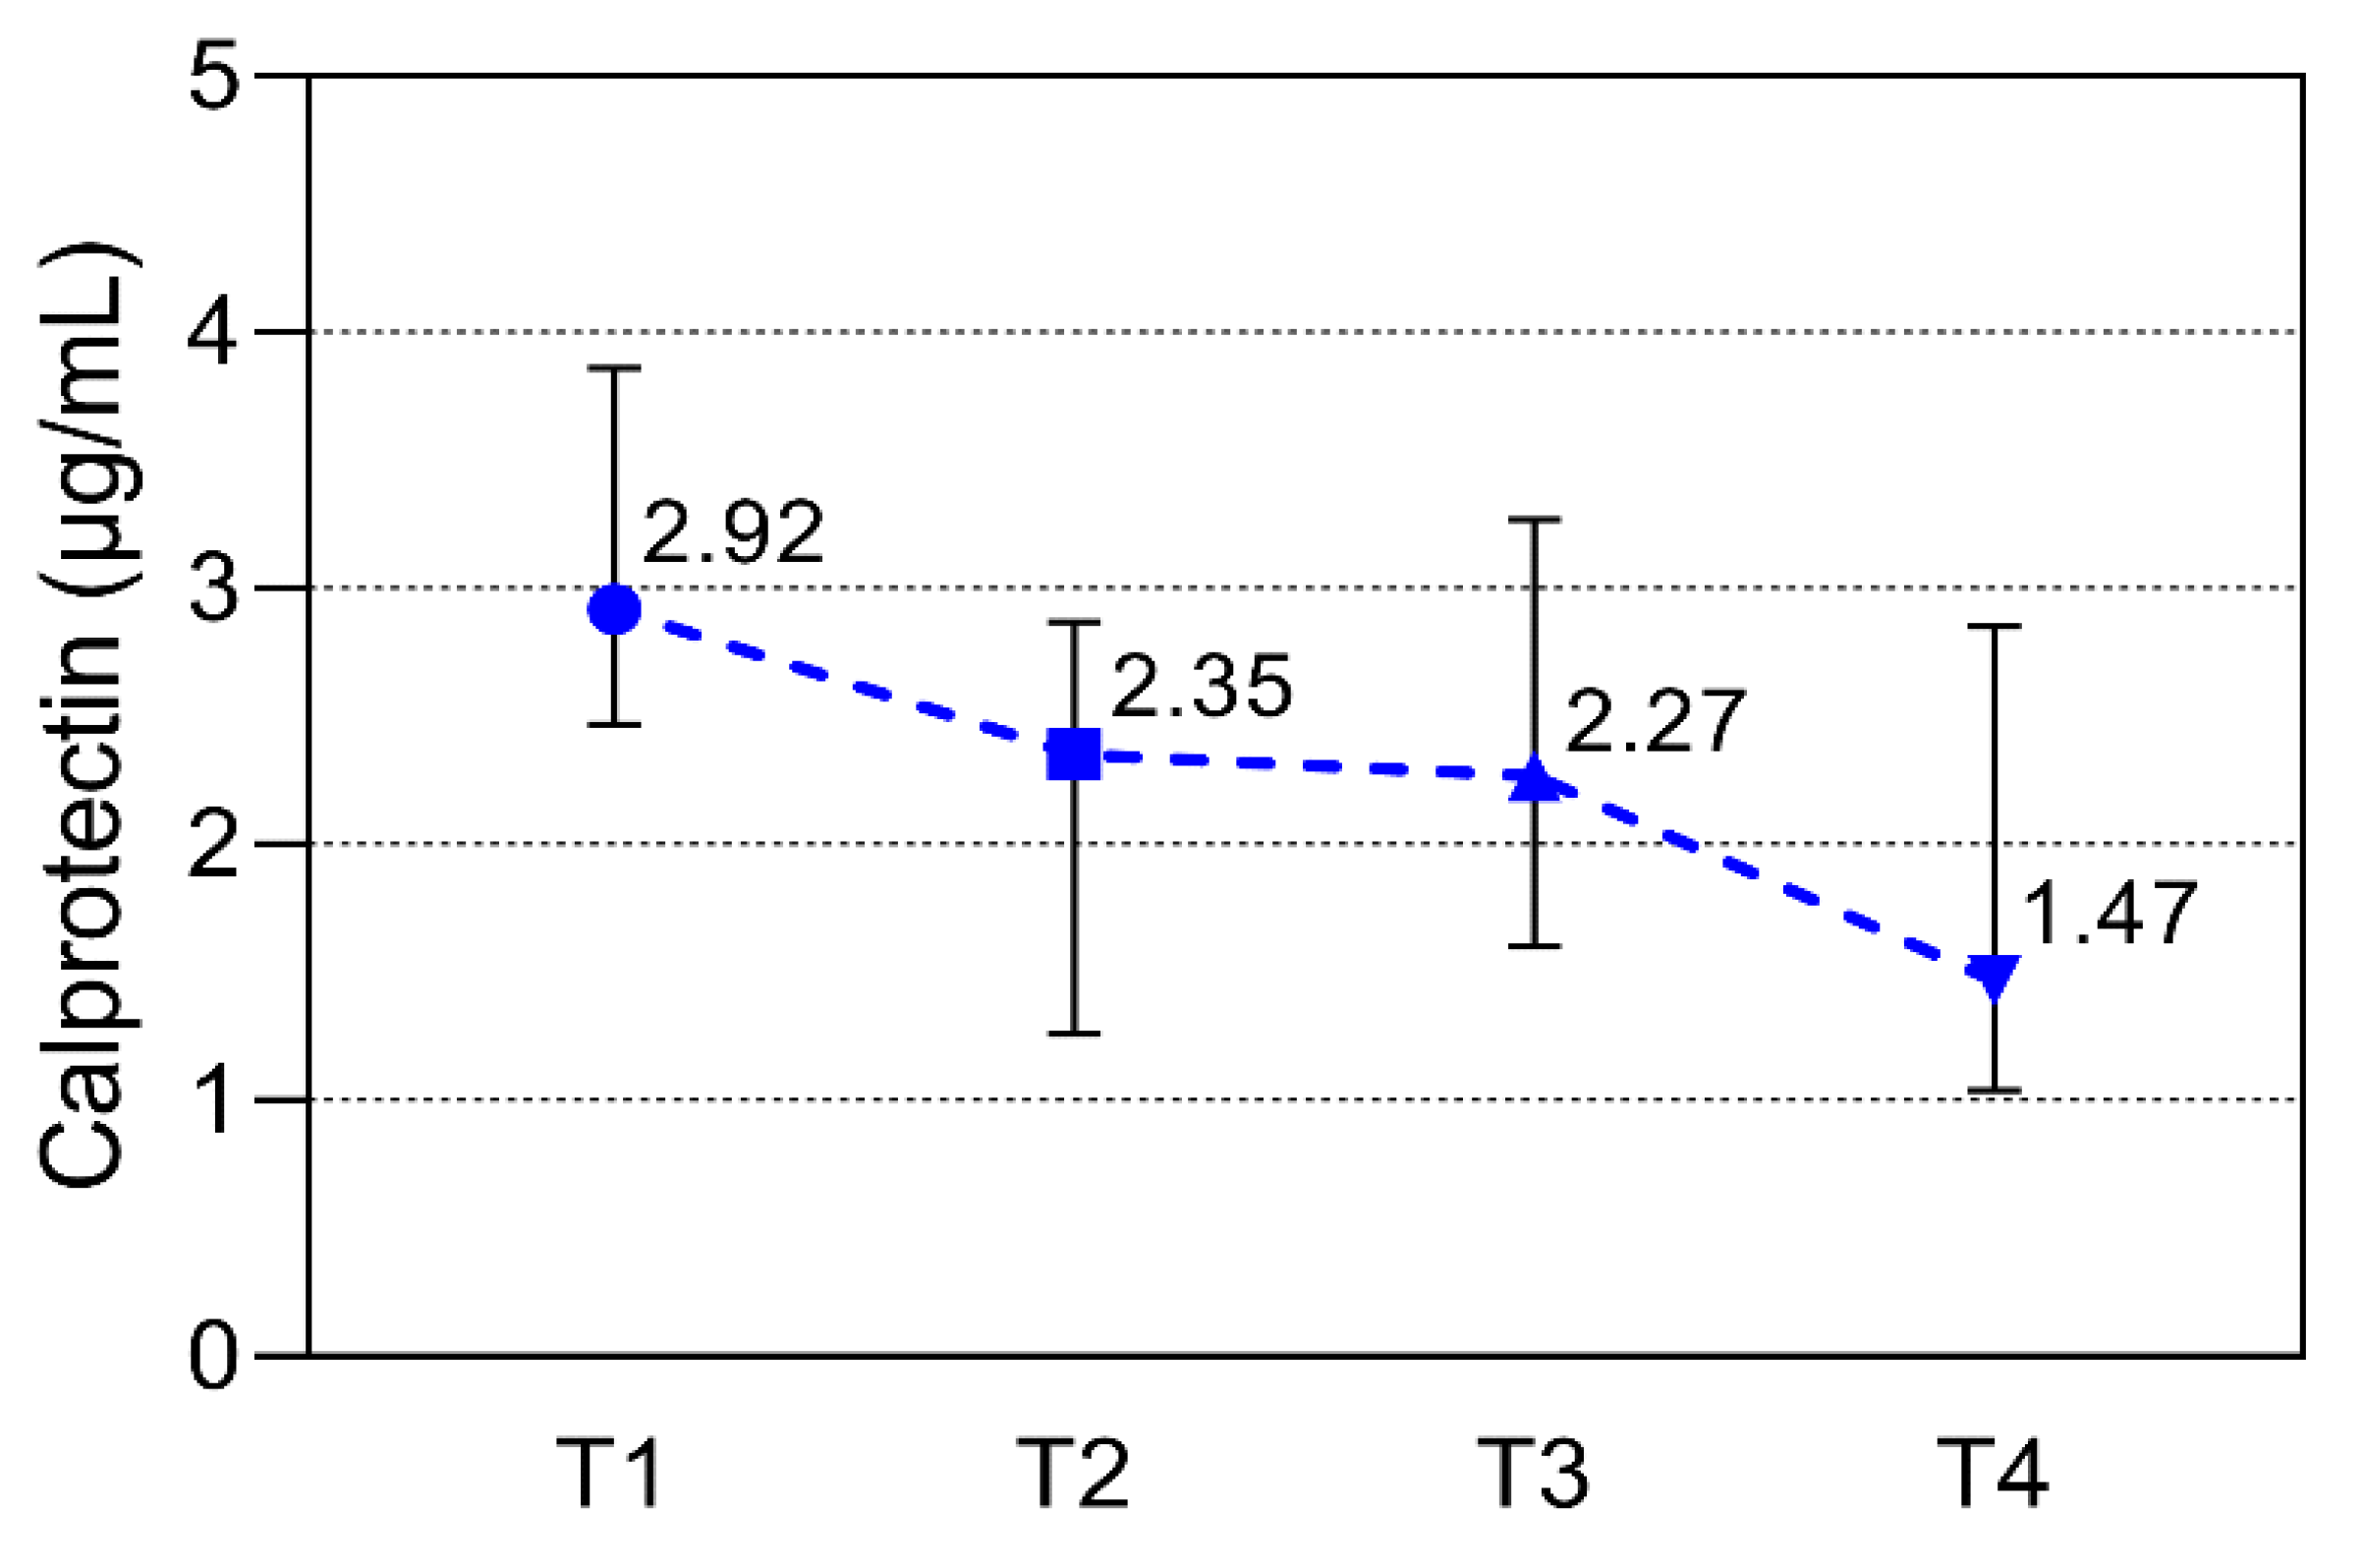
| Calprotectin (µg/mL) | 2.92 (2.47; 3.86) | 2.35 (1.26; 2.87) | 2.27 (1.60; 3.27) | 1.47 (1.04; 2.85) | 0.004 |
| Troponin I, (ng/L) | 5.00 (3.25; 9.75) | 5.00 (4.00; 8.50) | 4.00 (3.00; 8.75) | 4.00 (2.25; 10.5) | 0.671 |
| Cortisol (nmol/L) | 214 (118; 313) | 385 (201; 468) | 376 (218; 517) | 351 (209; 420) | 0.049 |
| hsCRP (mg/L) | 0.75 (0.32; 1.88) | 0.55 (0.29; 0.78) | 0.44 (0.26; 0.74) | 0.38 (0.31; 0.54) | 0.278 |
| hsIL-6 (pg/mL) | 1.87 (1.08; 3.48) | 1.34 (0.92; 2.59) | 1.96 (0.83; 3.15) | 1.51 (0.93; 3.29) | 0.513 |
| Creatine kinase (U/L) | 355 (254; 601) | 300 (162; 367) | 303 (163; 391) | 271 (160; 428) | 0.014 |
| Myoglobin (µg/L) | 139 (105; 167) | 136 (90; 157) | 87.0 (59.3; 172.3) | 98 (54; 200) | 0.173 |
| Pain (VAS) | 0 | 3.00 (2; 4) | 4 (2; 6) | 4 (2; 6) | <0.001 |
| SU-MR 60′ (N) | 63 (59; 84) | 57 (53; 78) | 49 (45; 70) | 46 (44; 66) | <0.001 |
| PU-MR60′ (N) | 11 (9; 15) | 9 (7; 13) | 7 (5; 11) | 6 (4; 9) | <0.001 |
| BP 70% MR | 38 (33; 42.3) | 34 (30; 38) | 29 (25; 33) | 26 (22; 32) | <0.001 |
| BSQ 90° 60′ | 55 (51; 62) | 48 (44; 55) | 41(37; 48) | 39 (35; 44) | <0.001 |
| BP-1RM | 100 (90; 115) | 95 (85; 110) | 89 (79; 104) | 86 (77; 100) | <0.001 |
| BSQ-1RM | 117 (101; 130) | 108 (92; 121) | 101 (84; 113) | 99 (84; 111) | <0.001 |
| LPU-1RM | 105 (95; 115) | 99 (89; 109) | 91 (81; 101) | 87 (77; 98) | <0.001 |
| BET | 86 (76; 104) | 77 (67; 95) | 64 (54; 82) | 63 (53; 80) | <0.001 |
| Phase | T1 | T2 | T3 | T4 |
|---|---|---|---|---|
| Calprotectin (µg/mL) | Calprotectin (µg/mL) | Calprotectin (µg/mL) | Calprotectin (µg/mL) | |
| Troponin I, (ng/L) | −0.18 | 0.18 | 0.37 | 0.41 |
| Cortisol (nmol/L) | 0.41 | 0.10 | 0.44 | 0.69 ** |
| hsCRP (mg/L) | 0.05 | 0.47 * | 0.18 | −0.27 |
| hsIL-6 (pg/mL) | 0.17 | 0.38 | 0.56 * | 0.22 |
| Creatine kinase (U/L) | 0.08 | 0.10 | 0.10 | 0.28 |
| Myoglobin (µg/L) | 0.02 | −0.09 | 0.58 ** | 0.84 ** |
| SU-MR 60′ (N) | PU MR (N) | BP70% MR (N) | BSQ90°-60′ (N) | BP-1RM | BSQ-1RM | LPU-1RM | BET | |
|---|---|---|---|---|---|---|---|---|
| Phase T1 | Correlation coefficients | |||||||
| Calprotectin (µg/mL) | −0.29 | −0.47 * | −0.08 | −0.47 * | −0.20 | −0.24 | −0.13 | −0.16 |
| Cortisol (nmol/L) | −0.19 | −0.37 | 0.40 | −0.05 | −0.10 | −0.12 | −0.18 | −0.21 |
| hsCRP (mg/L) | −0.13 | −0.03 | 0.28 | 0.23 | 0.26 | 0.53 * | 0.20 | −0.16 |
| hsIL-6 (pg/mL) | −0.24 | 0.01 | 0.05 | 0.09 | −0.11 | 0.01 | −0.05 | −0.30 |
| Myoglobin (µg/L) | 0.02 | 0.01 | −0.22 | −0.25 | 0.02 | −0.02 | −0.14 | −0.22 |
| Phase T2 | Correlation coefficients | |||||||
| Calprotectin (µg/mL) | −0.16 | −0.19 | 0.40 | −0.09 | 0.20 | 0.13 | 0.13 | −0.05 |
| Cortisol (nmol/L) | 0.61 ** | 0.52 * | 0.49 * | 0.46 * | 0.52 * | 0.40 | 0.41 | 0.31 |
| hsCRP (mg/L) | −0.11 | −0.16 | 0.45 * | 0.02 | 0.25 | 0.34 | 0.03 | −0.11 |
| hsIL-6 (pg/mL) | −0.03 | 0.21 | 0.37 | 0.23 | 0.34 | 0.29 | 0.26 | −0.01 |
| Myoglobin (µg/L) | 0.25 | 0.38 | 0.15 | 0.09 | 0.35 | 0.12 | 0.26 | 0.23 |
| Phase T3 | Correlation coefficients | |||||||
| Calprotectin (µg/mL) | 0.19 | 0.22 | 0.29 | 0.08 | 0.33 | 0.12 | 0.24 | 0.34 |
| Cortisol (nmol/L) | 0.59 ** | 0.41 | 0.36 | 0.15 | 0.61 ** | 0.42 | 0.44 * | 0.28 |
| hsCRP (mg/L) | −0.19 | −0.37 | 0.21 | −0.20 | 0.00 | 0.05 | 0.01 | −0.08 |
| hsIL-6 (pg/mL) | 0.33 | 0.43 | 0.07 | 0.09 | 0.57 * | 0.50 | 0.59 * | 0.23 |
| Myoglobin (µg/L) | 0.52 * | 0.56 * | 0.54 * | 0.33 | 0.74 ** | 0.50 * | 0.47 * | 0.37 |
| Phase T4 | Correlation coefficients | |||||||
| Calprotectin (µg/mL) | 0.49 * | 0.44 | 0.30 | 0.24 | 0.53 * | 0.18 | 0.33 | 0.45 * |
| Cortisol (nmol/L) | 0.64 ** | 0.59 ** | 0.43 | 0.56 ** | 0.64 ** | 0.38 | 0.43 | 0.42 |
| hsCRP (mg/L) | −0.19 | −0.19 | 0.44 | 0.00 | −0.11 | 0.08 | −0.04 | −0.18 |
| hsIL-6 (pg/mL) | 0.50 * | 0.48 | 0.19 | 0.51 * | 0.19 | 0.12 | 0.45 | 0.60 * |
| Myoglobin (µg/L) | 0.61 ** | 0.49 * | 0.39 | 0.35 | 0.58 ** | 0.33 | 0.42 | 0.53 * |
Disclaimer/Publisher’s Note: The statements, opinions and data contained in all publications are solely those of the individual author(s) and contributor(s) and not of MDPI and/or the editor(s). MDPI and/or the editor(s) disclaim responsibility for any injury to people or property resulting from any ideas, methods, instructions or products referred to in the content. |
© 2023 by the authors. Licensee MDPI, Basel, Switzerland. This article is an open access article distributed under the terms and conditions of the Creative Commons Attribution (CC BY) license (https://creativecommons.org/licenses/by/4.0/).
Share and Cite
Bukvić, F.; Ivković, A.; Čičak, H.; Dukić, L.; Šimundić, A.-M.; Marijančević, D.; Pašalić, D. The Association of Serum Calprotectin with Fitness Indicators and Biochemical Markers in High-Level Athletes: A Continuous Dynamic Monitoring during One Competitive Season. Sports 2023, 11, 243. https://doi.org/10.3390/sports11120243
Bukvić F, Ivković A, Čičak H, Dukić L, Šimundić A-M, Marijančević D, Pašalić D. The Association of Serum Calprotectin with Fitness Indicators and Biochemical Markers in High-Level Athletes: A Continuous Dynamic Monitoring during One Competitive Season. Sports. 2023; 11(12):243. https://doi.org/10.3390/sports11120243
Chicago/Turabian StyleBukvić, Frane, Alan Ivković, Helena Čičak, Lora Dukić, Ana-Maria Šimundić, Domagoj Marijančević, and Daria Pašalić. 2023. "The Association of Serum Calprotectin with Fitness Indicators and Biochemical Markers in High-Level Athletes: A Continuous Dynamic Monitoring during One Competitive Season" Sports 11, no. 12: 243. https://doi.org/10.3390/sports11120243
APA StyleBukvić, F., Ivković, A., Čičak, H., Dukić, L., Šimundić, A.-M., Marijančević, D., & Pašalić, D. (2023). The Association of Serum Calprotectin with Fitness Indicators and Biochemical Markers in High-Level Athletes: A Continuous Dynamic Monitoring during One Competitive Season. Sports, 11(12), 243. https://doi.org/10.3390/sports11120243