
Physiological Responses in Trail Runners during a Maximal Test with Different Weighted-Vest Loads

 ,
,  and
and
Abstract
:1. Introduction
2. Materials and Methods
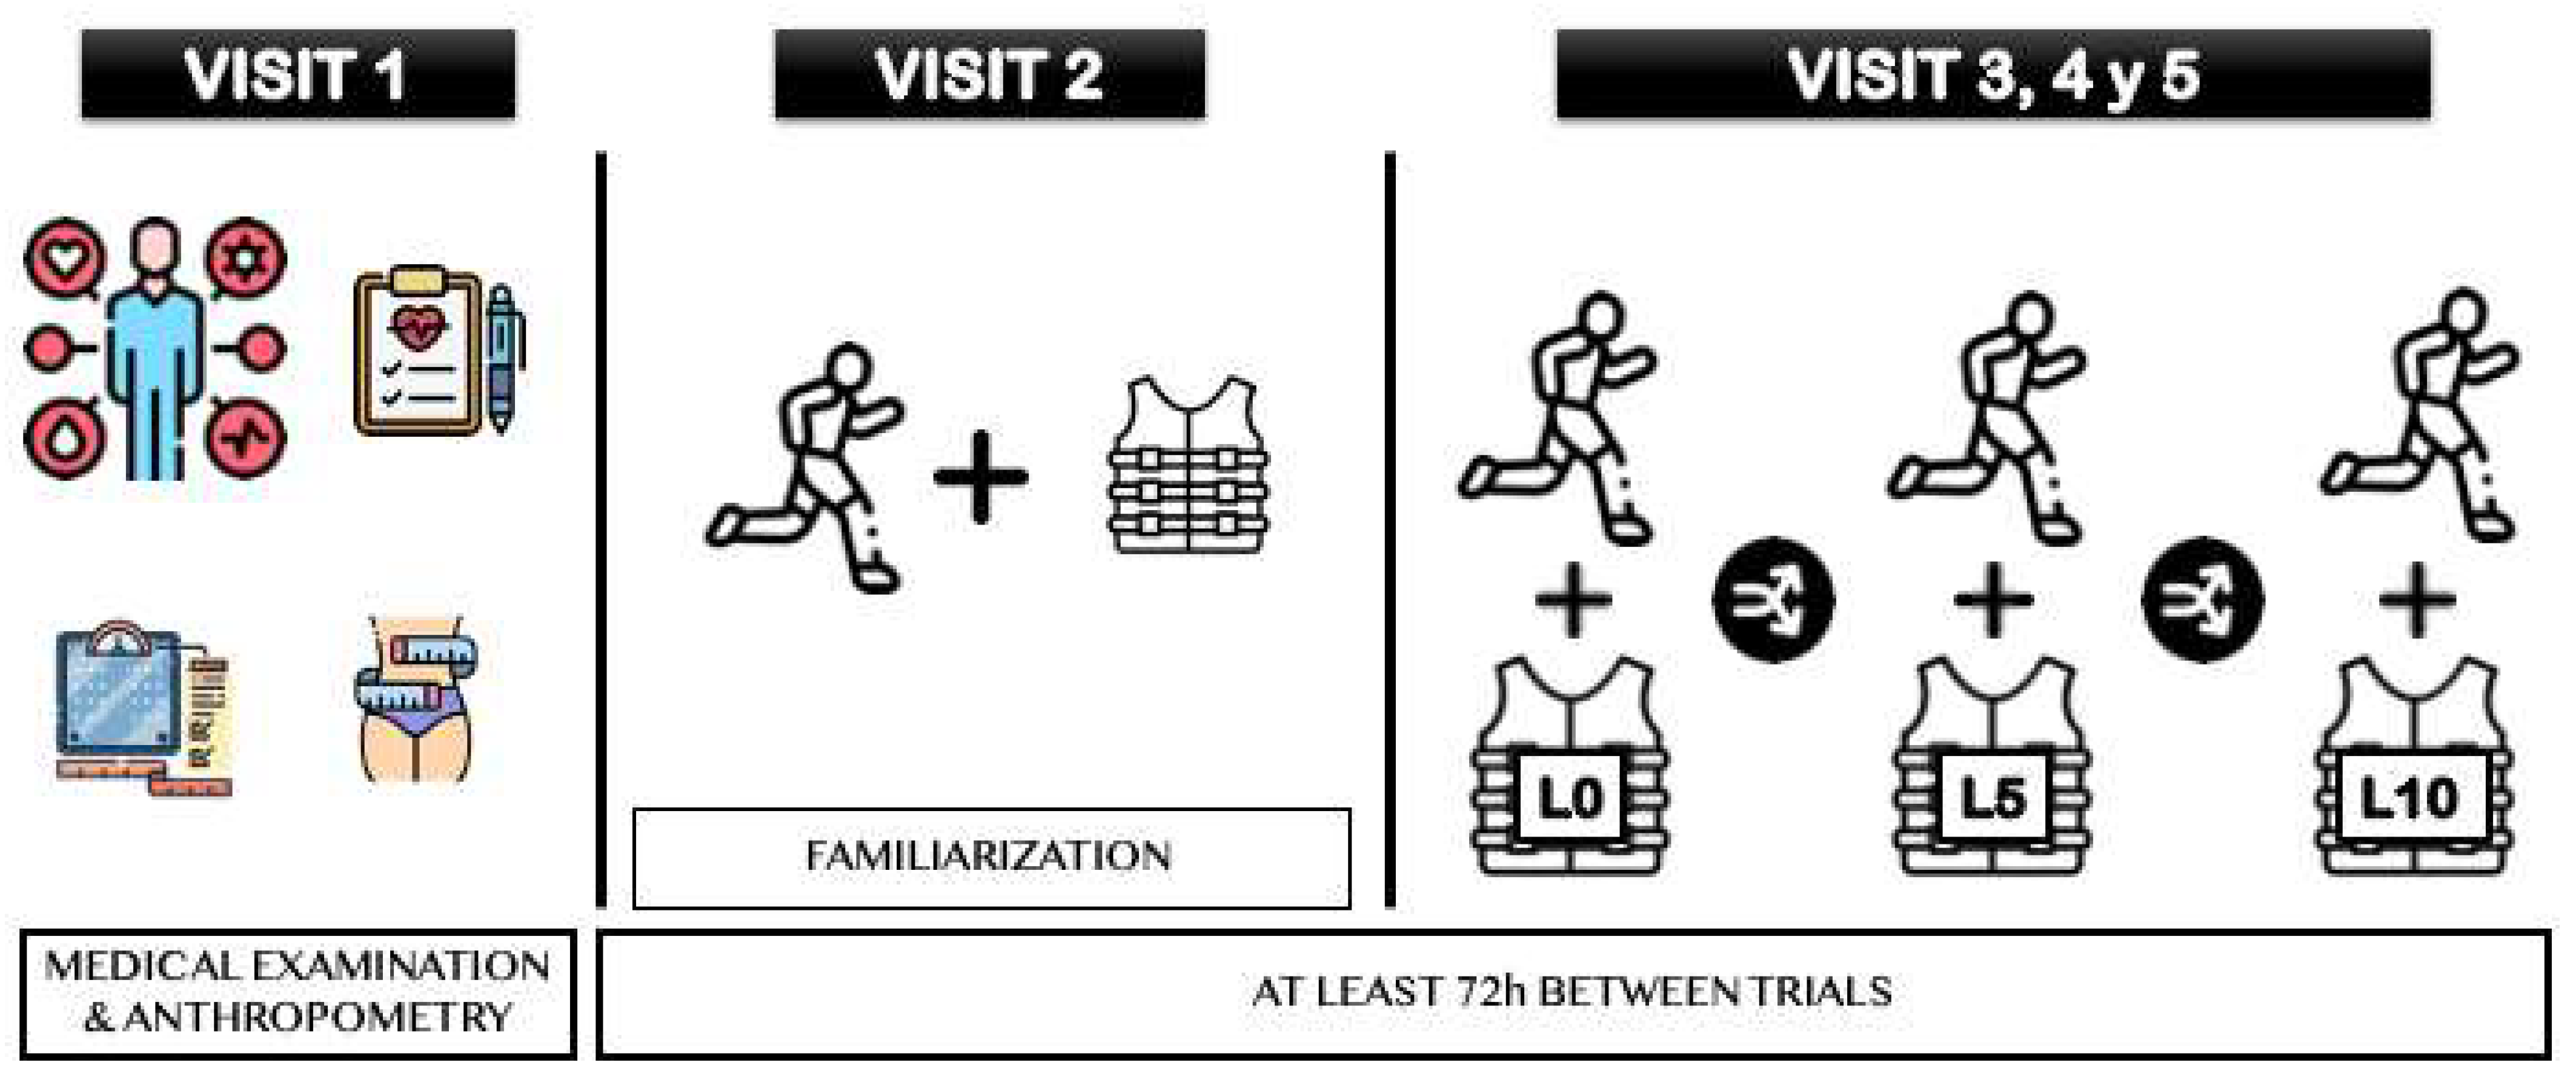
2.1. Experimental Design
2.2. Participants
2.3. Procedures
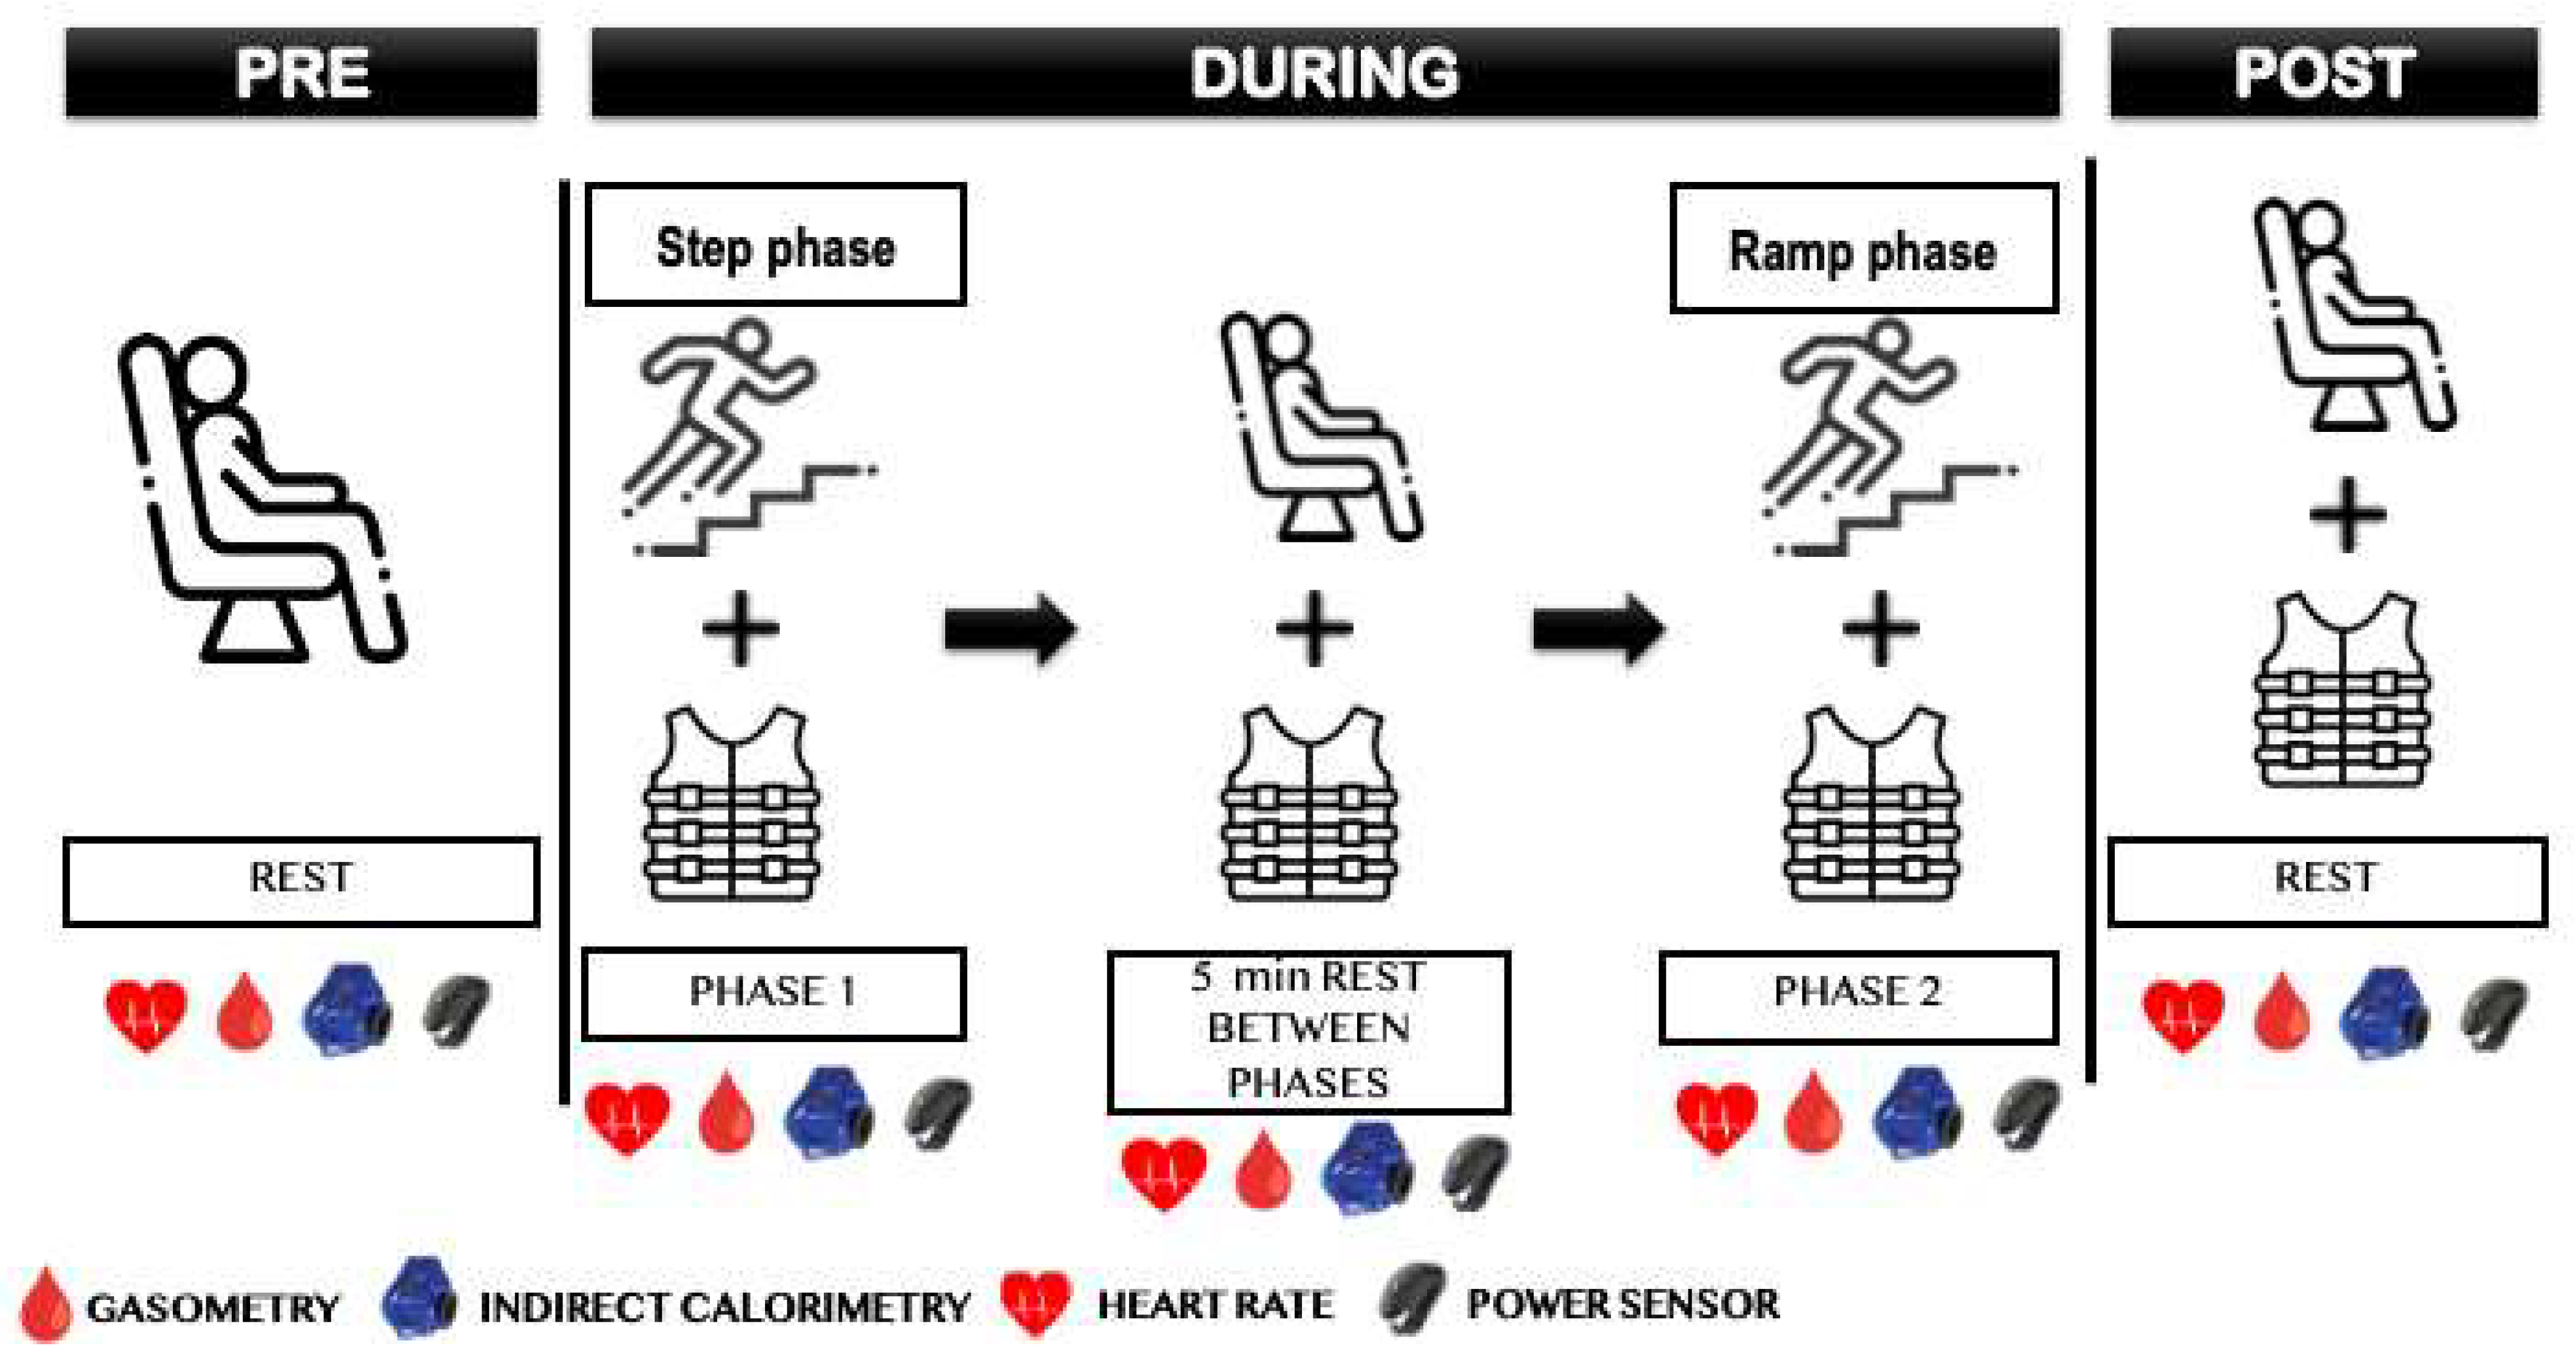
2.4. Tests
2.4.1. Incremental Test
2.4.2. Power Sensor and HR
2.4.3. Blood Gas Analysis
2.5. Statistical Analysis
3. Results
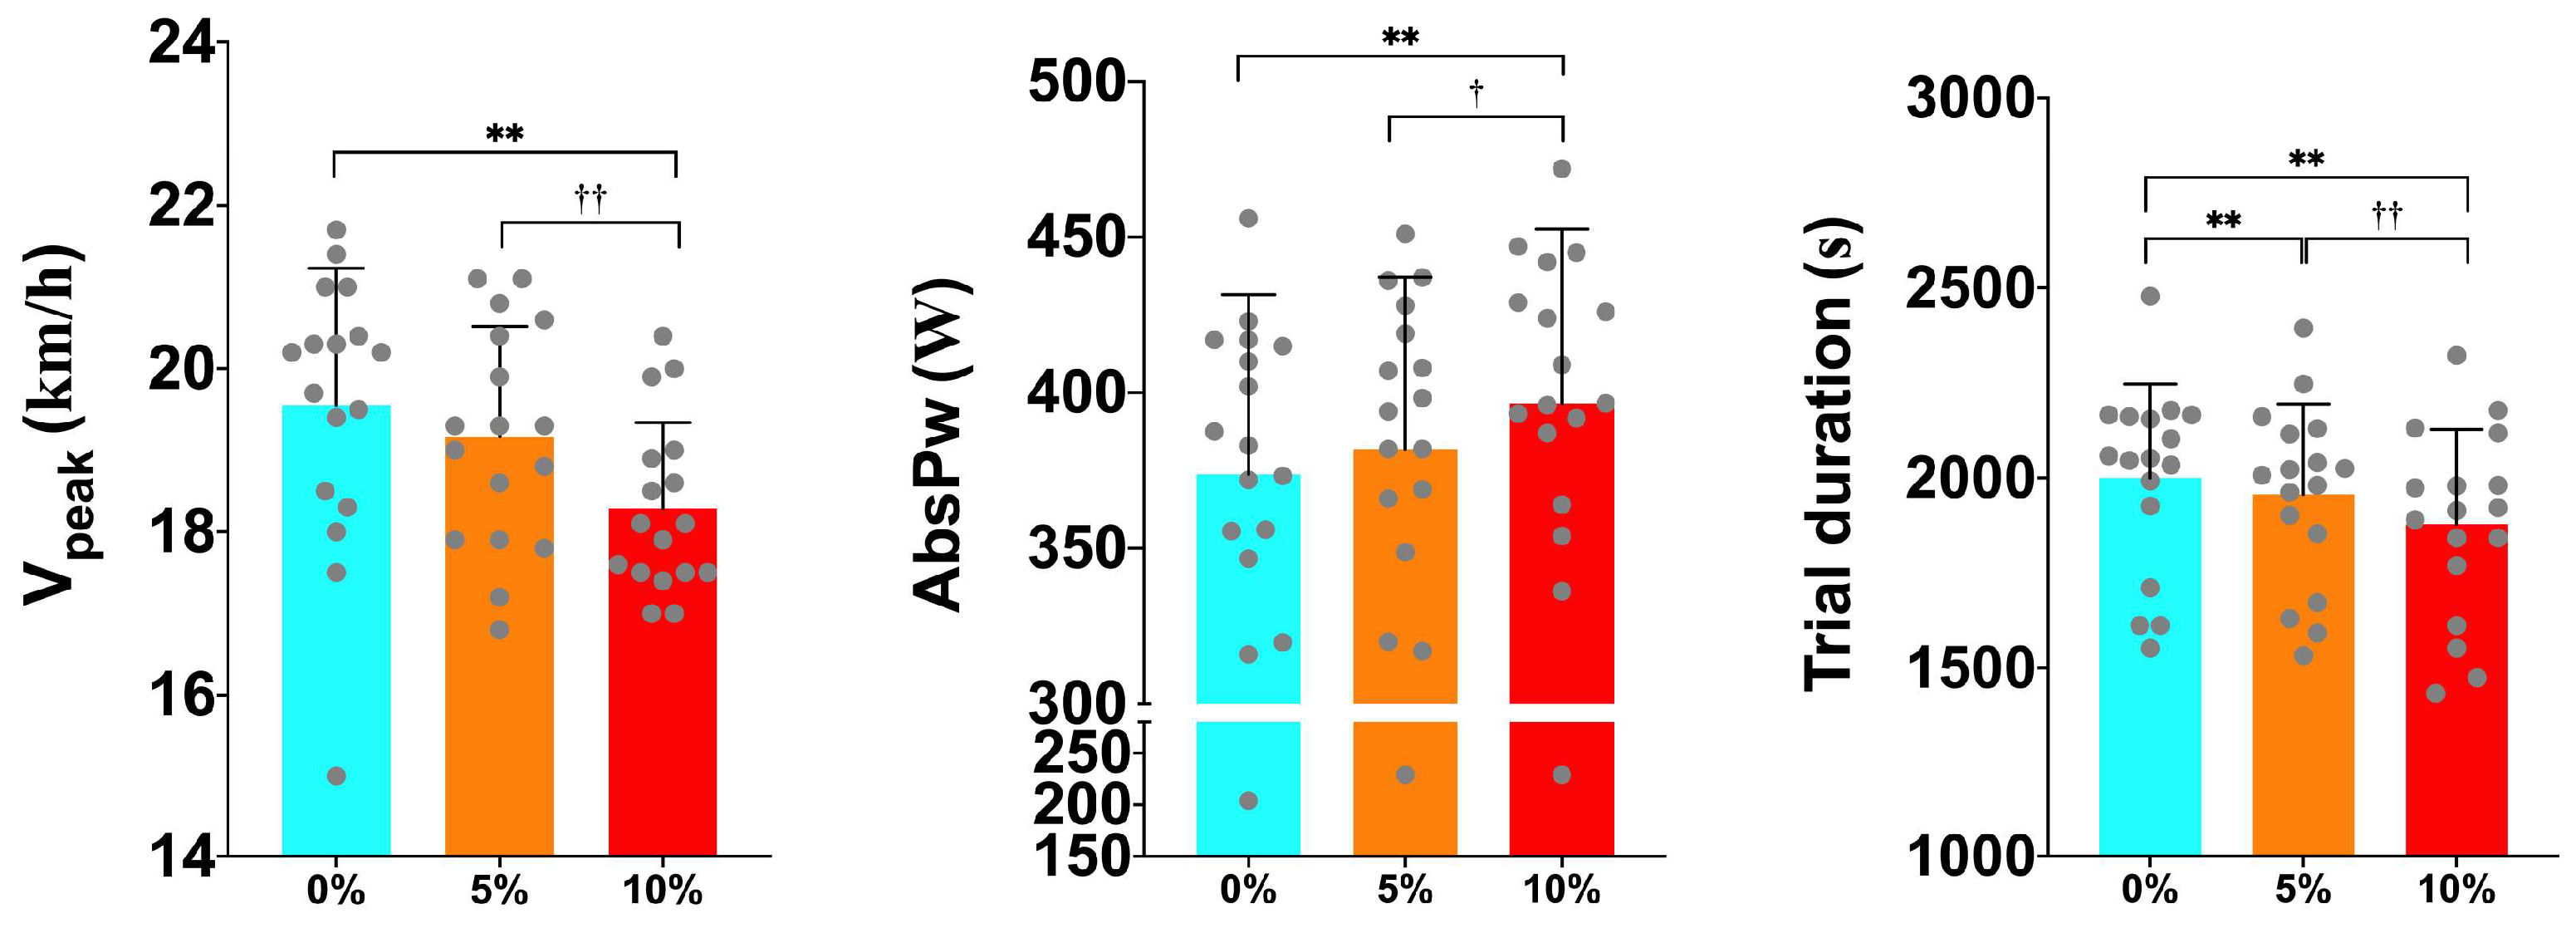
3.1. Peak Values
3.2. VT1
3.3. VT2
3.4. FatMax
3.5. Blood Lactate, pH, sO2, and RPE
4. Discussion
5. Conclusions
Author Contributions
Funding
Institutional Review Board Statement
Informed Consent Statement
Data Availability Statement
Conflicts of Interest
References
- Urbaneja, J.S.; Inés Farias, E. El trail running (carreras de o por montaña) en España. Inicios, evolución y (actual) estado de la situación (Trail running in Spain. Origin, evolution and current situation; natural áreas). Retos Nuevas Perspect. Educ. Fís. Deporte Recreación 2017, 33, 123–128. [Google Scholar]
- itra.run. WMTRC: World Mountain & Trail Running Championship 2022. Available online: https://itra.run/Races/RaceResults/World.Mountain...Trail.Running.Championship.Long.Trail.80K/2022/79126 (accessed on 1 July 2023).
- International Skyrunning Federatio General Assembly. International Skyrunning Federation Rules. Available online: https://www.skyrunning.com/rules/ (accessed on 1 July 2023).
- Lemire, M.; Hureau, T.J.; Favret, F.; Geny, B.; Kouassi, B.Y.L.; Boukhari, M.; Lonsdorfer, E.; Remetter, R.; Dufour, S.P. Physiological factors determining downhill vs. uphill running endurance performance. J. Sci. Med. Sport 2021, 24, 85–91. [Google Scholar] [CrossRef]
- Sabater-Pastor, F.; Tomazin, K.; Millet, G.P.; Verney, J.; Féasson, L.; Millet, G.Y. VO2max and Velocity at VO2max Play a Role in Ultradistance Trail-Running Performance. Int. J. Sports Physiol. Perform. 2023, 18, 300–305. [Google Scholar] [CrossRef]
- Scheer, V.; Vieluf, S.; Janssen, T.I.; Heitkamp, H. Predicting Competition Performance in Short Trail Running Races with Lactate Thresholds. J. Hum. Kinet. 2019, 69, 159–167. [Google Scholar] [CrossRef]
- Alvero-Cruz, J.R.; Parent Mathias, V.; Garcia Romero, J.; Carrillo De Albornoz-Gil, M.; Benítez-Porres, J.; Ordoñez, F.J.; Rosemann, T.; Nikolaidis, P.T.; Knechtle, B. Prediction of Performance in a Short Trail Running Race: The Role of Body Composition. Front. Physiol. 2019, 10, 1306. [Google Scholar] [CrossRef] [PubMed]
- Ehrström, S.; Tartaruga, M.P.; Easthope, C.S.; Brisswalter, J.; Morin, J.B.; Vercruyssen, F. Short Trail Running Race: Beyond the Classic Model for Endurance Running Performance. Med. Sci. Sports Exerc. 2018, 50, 580–588. [Google Scholar] [CrossRef]
- Lemire, M.; Falbriard, M.; Aminian, K.; Millet, G.P.; Meyer, F. Level, Uphill, and Downhill Running Economy Values Are Correlated Except on Steep Slopes. Front. Physiol. 2021, 12, 697315. [Google Scholar] [CrossRef]
- Balducci, P.; Clémençon, M.; Trama, R.; Blache, Y.; Hautier, C. Performance Factors in a Mountain Ultramarathon. Int. J. Sports Med. 2017, 38, 819–826. [Google Scholar] [CrossRef] [PubMed]
- Vernillo, G.; Giandolini, M.; Edwards, W.B.; Morin, J.B.; Samozino, P.; Horvais, N.; Millet, G.Y. Biomechanics and Physiology of Uphill and Downhill Running. Sports Med. 2017, 47, 615–629. [Google Scholar] [CrossRef]
- Giandolini, M.; Pavailler, S.; Samozino, P.; Morin, J.B.; Horvais, N. Foot strike pattern and impact continuous measurements during a trail running race: Proof of concept in a world-class athlete. Footwear Sci. 2015, 7, 127–137. [Google Scholar] [CrossRef]
- Giandolini, M.; Horvais, N.; Rossi, J.; Millet, G.Y.; Morin, J.B.; Samozino, P. Acute and delayed peripheral and central neuromuscular alterations induced by a short and intense downhill trail run: Fatigue after a downhill trail run. Scand. J. Med. Sci. Sports. 2016, 26, 1321–1333. [Google Scholar] [CrossRef] [PubMed]
- Easthope, C.S.; Hausswirth, C.; Louis, J.; Lepers, R.; Vercruyssen, F.; Brisswalter, J. Effects of a trail running competition on muscular performance and efficiency in well-trained young and master athletes. Eur. J. Appl. Physiol. 2010, 110, 1107–1116. [Google Scholar] [CrossRef] [PubMed]
- Varesco, G.; Coratella, G.; Rozand, V.; Cuinet, B.; Lombardi, G.; Mourot, L.; Vernillo, G. Downhill running affects the late but not the early phase of the rate of force development. Eur. J. Appl. Physiol. 2022, 122, 2049–2059. [Google Scholar] [CrossRef] [PubMed]
- Lemire, M.; Hureau, T.J.; Remetter, R.; Geny, B.; Kouassi, B.Y.L.; Lonsdorfer, E.; Horobeti, M.E.I.; Favret, F.; Dufour, S.P. Trail Runners Cannot Reach VO2max during a Maximal Incremental Downhill Test. Med. Sci. Sports Exerc. 2020, 52, 1135–1143. [Google Scholar] [CrossRef] [PubMed]
- Lemire, M.; Remetter, R.; Hureau, T.J.; Kouassi, B.Y.L.; Lonsdorfer, E.; Geny, B.; Horobeti, M.E.I.; Favret, F.; Dufour, S.P. High-intensity downhill running exacerbates heart rate and muscular fatigue in trail runners. J. Sports Sci. 2021, 39, 815–825. [Google Scholar] [CrossRef] [PubMed]
- Rojas-Valverde, D.; Sánchez-Ureña, B.; Pino-Ortega, J.; Gómez-Carmona, C.; Gutiérrez-Vargas, R.; Timón, R.; Olcina, G. External Workload Indicators of Muscle and Kidney Mechanical Injury in Endurance Trail Running. Int. J. Environ. Res. Public Health 2019, 16, 3909. [Google Scholar] [CrossRef] [PubMed] [PubMed Central]
- Gutiérrez-Vargas, R.; Martín-Rodríguez, S.; Sánchez-Ureña, B.; Rodríguez-Montero, A.; Salas-Cabrera, J.; Gutiérrez-Vargas, J.C.; Simunic, B.; Rojas-Valverde, D. Biochemical and Muscle Mechanical Postmarathon Changes in Hot and Humid Conditions. J. Strength Cond. Res. 2020, 34, 847–856. [Google Scholar] [CrossRef] [PubMed]
- Costa, R.J.S.; Knechtle, B.; Tarnopolsky, M.; Hoffman, M.D. Nutrition for Ultramarathon Running: Trail, Track, and Road. Int. J. Sport Nutr. Exerc. Metab. 2019, 29, 130–140. [Google Scholar] [CrossRef] [PubMed]
- Alcaraz, P.E.; Carlos-Vivas, J.; Oponjuru, B.O.; Martínez-Rodríguez, A. The Effectiveness of Resisted Sled Training (RST) for Sprint Performance: A Systematic Review and Meta-analysis. Sports Med. 2018, 48, 2143–2165. [Google Scholar] [CrossRef]
- Alcaraz, P.E.; Palao, J.M.; Elvira, J.L.L.; Linthorne, N.P. Effects of Three Types of Resisted Sprint Training Devices on the Kinematics of Sprinting at Maximum Velocity. J. Strength Cond. Res. 2008, 22, 890–897. [Google Scholar] [CrossRef]
- Carlos-Vivas, J.; Marín-Cascales, E.; Freitas, T.T.; Perez-Gomez, J.; Alcaraz, P.E. Force-Velocity-Power Profiling During Weighted-Vest Sprinting in Soccer. Int. J. Sports Physiol. Perform. 2019, 14, 747–756. [Google Scholar] [CrossRef] [PubMed]
- Clark, K.P.; Stearne, D.J.; Walts, C.T.; Miller, A.D. The Longitudinal Effects of Resisted Sprint Training Using Weighted Sleds vs. Weighted Vests. J. Strength Cond. Res. 2010, 24, 3287–3295. [Google Scholar] [CrossRef] [PubMed]
- Cross, M.R.; Brughelli, M.E.; Cronin, J.B. Effects of Vest Loading on Sprint Kinetics and Kinematics. J. Strength Cond. Res. 2014, 28, 1867–1874. [Google Scholar] [CrossRef] [PubMed]
- Carretero-Navarro, G.; Márquez, G.; Cherubini, D.; Taube, W. Effect of different loading conditions on running mechanics at different velocities. Eur. J. Sport Sci. 2019, 19, 595–602. [Google Scholar] [CrossRef] [PubMed]
- Gaffney, C.J.; Cunnington, J.; Rattley, K.; Wrench, E.; Dyche, C.; Bampouras, T.M. Weighted vests in CrossFit increase physiological stress during walking and running without changes in spatiotemporal gait parameters. Ergonomics 2022, 65, 147–158. [Google Scholar] [CrossRef] [PubMed]
- Moore, K.J.; Penry, J.T.; Gunter, K.B. Development of a Walking Aerobic Capacity Test for Structural Firefighters. J. Strength Cond. Res. 2014, 28, 2346–2352. [Google Scholar] [CrossRef] [PubMed]
- Klimek, A.T.; Klimek, A. The weighted walking test as an alternative method of assessing aerobic power. J. Sports Sci. 2007, 25, 143–148. [Google Scholar] [CrossRef]
- Purdom, T.M.; Mermier, C.; Dokladny, K.; Moriarty, T.; Lunsford, L.; Cole, N.; Johnson, K.; Kravitz, L. Predictors of Fat Oxidation and Caloric Expenditure With and Without Weighted Vest Running. J. Strength Cond. Res. 2019, 35, 1865–1872. [Google Scholar] [CrossRef] [PubMed]
- Puthoff, M.L.; Darter, B.J.; Nielsen, D.H.; Yack, H.J. The effect of weighted vest walking on metabolic responses and ground reaction forces. Med. Sci. Sports Exerc. 2006, 38, 746–752. [Google Scholar] [CrossRef]
- World Medical Association. World Medical Association Declaration of Helsinki: Ethical Principles for Medical Research Involving Human Subjects. JAMA 2013, 310, 2191. [Google Scholar] [CrossRef]
- Norton, K.I. Standards for Anthropometry Assessment. In Kinanthropometry and Exercise Physiology, 4th ed.; Norton, K., Eston, R., Eds.; Routledge: London, UK, 2018; pp. 68–137. Available online: https://www.taylorfrancis.com/books/9781315385655/chapters/10.4324/9781315385662-4 (accessed on 26 July 2023).
- Dimitrijevic, M.; Lalovic, D.; Milovanov, D. Correlation of Different Anthropometric Methods and Bioelectric Impedance in Assessing Body Fat Percentage of Professional Male Athletes. Serbian J. Exp. Clin. Res. 2021. [Google Scholar] [CrossRef]
- Urbaniak, G.C.; Plous, S. Research Randomizer, Version 4.0; Computer Software; Research Randomizer: Middletown, OH, USA, 2013. Available online: http://www.randomizer.org/(accessed on 22 June 2023).
- Zuniga, J.M.; Housh, T.J.; Camic, C.L.; Bergstrom, H.C.; Traylor, D.A.; Schmidt, R.J.; Johnson, G.O. Metabolic parameters for ramp versus step incremental cycle ergometer tests. Appl. Physiol. Nutr. Metab. 2012, 37, 1110–1117. [Google Scholar] [CrossRef] [PubMed]
- Larson, R.D.; Cantrell, G.S.; Ade, C.J.; Farrell, J.W., III; Lantis, D.J.; Barton, M.A.; Larson, D.J. Physiologic Responses to Two Distinct Maximal Cardiorespiratory Exercise Protocols. Int. J. Sports Exerc. Med. 2015, 1, 013. [Google Scholar] [CrossRef]
- Binder, R.K.; Wonisch, M.; Corra, U.; Cohen-Solal, A.; Vanhees, L.; Saner, H.; Schmid, J.-P. Methodological approach to the first and second lactate threshold in incremental cardiopulmonary exercise testing. Eur. J. Cardiovasc. Prev. Rehabil. 2008, 15, 726–734. [Google Scholar] [CrossRef] [PubMed]
- Scherr, J.; Wolfarth, B.; Christle, J.W.; Pressler, A.; Wagenpfeil, S.; Halle, M. Associations between Borg’s rating of perceived exertion and physiological measures of exercise intensity. Eur. J. Appl. Physiol. 2013, 113, 147–155. [Google Scholar] [CrossRef] [PubMed]
- Mier, C.M.; Alexander, R.P.; Mageean, A.L. Achievement of VO2max Criteria During a Continuous Graded Exercise Test and a Verification Stage Performed by College Athletes. J. Strength Cond. Res. 2012, 26, 2648–2654. Available online: https://journals.lww.com/nsca-jscr/fulltext/2012/10000/achievement_of_v_combining_dot_above_o2max.6.aspx (accessed on 1 July 2023). [CrossRef] [PubMed]
- Wasserman, K.; Whipp, B.J.; Koyl, S.N.; Beaver, W.L. Anaerobic threshold and respiratory gas exchange during exercise. J. Appl. Physiol. 1973, 35, 236–243. [Google Scholar] [CrossRef] [PubMed]
- Frayn, K.N. Calculation of substrate oxidation rates in vivo from gaseous exchange. J. Appl. Physiol. 1983, 55, 628–634. [Google Scholar] [CrossRef] [PubMed]
- Poole, D.C.; Wilkerson, D.P.; Jones, A.M. Validity of criteria for establishing maximal O2 uptake during ramp exercise tests. Eur. J. Appl. Physiol. 2008, 102, 403–410. [Google Scholar] [CrossRef]
- Cohen, J. Statistical Power Analysis for the Behavioral Sciences, 2nd ed.; Reprint; Psychology Press: New York, NY, USA, 2009; 567p. [Google Scholar]
- Barnes, K.R.; Hopkins, W.G.; McGuigan, M.R.; Kilding, A.E. Warm-up with a weighted vest improves running performance via leg stiffness and running economy. J. Sci. Med. Sport. 2015, 18, 103–108. [Google Scholar] [CrossRef]
- Cartón-Llorente, A.; Rubio-Peirotén, A.; Cardiel-Sánchez, S.; Roche-Seruendo, L.E.; Jaén-Carrillo, D. Training Specificity in Trail Running: A Single-Arm Trial on the Influence of Weighted Vest on Power and Kinematics in Trained Trail Runners. Sensors 2023, 23, 6411. [Google Scholar] [CrossRef] [PubMed]


| Age (Year) | Weight (kg) | Height (cm) | Distance/Week (kms) | Elevation Gain/Week | Fat Mass (%) |
|---|---|---|---|---|---|
| 31.08 (6.45) | 71.02 (9.95) | 178.77 (7.88) | 55.23 (22.44) | 1276.93 (683.31) | 7.48 (0.99) |
| Variables | L0 | L5 | L10 | p | ηp2 |
|---|---|---|---|---|---|
| HR (bpm) | 183.3 (9.3) | 186.08 (9.20) | 187.2 (9.7) | 0.800 | 0.027 |
| RER | 1.12 (0.50) | 1.11 (0.60) | 1.11 (0.50) | 0.599 | 0.031 |
| VO2Rpeak (mL·kg−1·min−1) | 63.3 (5.9) | 62.6 (6.8) | 62.2 (7.8) | 0.342 | 0.065 |
| VO2peak(L/min) | 4.3 (0.5) | 4.3 (0.4) | 4.2 (0.4) | 0.145 | 0.114 |
| Vpeak (km/h) | 19.6 (1.7) | 19.20 (1.35) | 18.3 (1.1) **, †† | <0.001 ## | 0.462 |
| AbsPw (W) | 373.8 (59.7) | 381.9 (59.1) | 396.6 (57.8) **, † | 0.003 ## | 0.468 |
| Pw/BM (W/kg) | 5.4 (0.4) | 5.3 (0.4) | 5.4 (0.5) | 0.149 | 0136 |
| Trial duration (s) | 2000.1 (247.0) | 1956.8 (237.8) ** | 1878.4 (249.3) **, †† | <0.001 ## | 0.644 |
| Zone | Variables | L0 | L5 | L10 | p | ηp2 |
|---|---|---|---|---|---|---|
| VT1 | HR (bpm) | 123.7 (11.7) | 129.0 (14.7) | 119.8 (16.4) | 0.301 | 0.139 |
| RER | 0.90 (0.04) | 0.90 (0.03) | 0.90 (0.04) | 0.972 | 0.002 | |
| % VO2peak | 54.5 (5.9) | 56.7 (5.0) | 54.8 (5.0) | 0.456 | 0.048 | |
| V (km/h) | 9.7 (1.3) | 9.3 (1.2) | 8.7 (1.4) ** | 0.015 ## | 0.230 | |
| AbsPw (W) | 195.0 (30.5) | 195.8 (45.8) | 198.9 (31.1) | 0.605 | 0.038 | |
| Pw/BM (W/kg) | 3.5 (0.7) | 3.86 (0.60) | 3.72 (0.50) | 0.135 | 0.153 | |
| RE (mL·kg−1·km−1) | 368.8 (50.7) | 399.1 (44.0) | 422.1 (65.9) ** | 0.009 ## | 0.253 | |
| VT2 | HR (bpm) | 169.0 (9.6) | 172.3 (9.7) | 173.4 (12.9) | 0.106 | 0.274 |
| % VO2peak | 82.2 (7.4) | 85.7 (6.3) | 84.7 (6.7) | 0.182 | 0.101 | |
| V (km/h) | 14.5 (1.3) | 14.5 (1.5) | 13.8 (1.3) *, †† | 0.041 ## | 0.180 | |
| AbsPw (W) | 280.4 (44.0) | 303.3 (54.5) | 306.7 (54.0) | 0.035 ## | 0.242 | |
| Pw/BM (W/kg) | 4.8 (0.9) | 5.0 (0.5) | 4.9 (0.5) | 0.224 | 0.109 | |
| RE (mL·kg−1·km−1) | 248.0 (27.9) | 250.9 (37.9) | 257.8 (33.5) | 0.352 | 0.063 |
| Variables | L0 | L5 | L10 | p | ηp2 |
|---|---|---|---|---|---|
| HR (bpm) | 98.1 (13.9) | 101.2 (17.3) | 99 (14.2) | 0.812 | 0.023 |
| RER | 0.82 (0.10) | 0.82 (0.10) | 0.83 (0.10) | 0.718 | 0.020 |
| % VO2peak | 38.4 (12.4) | 41.8 (14.2) | 37.9 (10.3) | 0.597 | 0.032 |
| V (km/h) | 6.8 (1.6) | 7.2 (1.9) | 6.5 (1.6) | 0.462 | 0.047 |
| AbsPw (W) | 125.9 (41.6) | 144.8 (70.3) | 132.8 (44.7) | 0.377 | 0.072 |
| Pw/BM (W/kg) | 2.4 (0.7) | 2.5 (0.7) | 2.4 (0.6) | 0.719 | 0.025 |
| RE (mL·kg−1·km−1) | 472.8 (197.7) | 450.6 (184.0) | 498.2 (18.8) | 0.389 | 0.057 |
| Variables | L0 | L5 | L10 | p | ηp2 |
|---|---|---|---|---|---|
| Lactate, pre (mmol/L) | 1.86 (0.50) | 2.01 (0.67) | 1.98 (0.65) | 0.309 | 0.071 |
| Lactate, post (mmol/L) | 11.48 (2.20) | 11.58 (1.60) | 10.99 (1.90) | ||
| pH, pre | 7.40 (0.02) | 7.40 (0.03) | 7.40 (0.02) | 0.083 # | 0.144 |
| pH, post | 7.24 (0.04) | 7.25 (0.05) | 7.26 (0.05) | ||
| SO2, pre (%) | 92.59 (2.90) | 93.30 (2.69) | 93.39 (1.59) | 0.785 | 0.015 |
| SO2, post (%) | 93.91 (1.26) | 94.10 (1.56) | 94.37 (1.56) | ||
| Step phase RPE | 7.35 (0.81) | 7.71 (1.02) | 7.91 (0.81) | 0.064 | 0.158 |
| Ramp phase RPE | 9.44 (0.58) | 9.47 (0.54) | 9.62 (0.42) | 0.267 | 0.079 |
Disclaimer/Publisher’s Note: The statements, opinions and data contained in all publications are solely those of the individual author(s) and contributor(s) and not of MDPI and/or the editor(s). MDPI and/or the editor(s) disclaim responsibility for any injury to people or property resulting from any ideas, methods, instructions or products referred to in the content. |
© 2024 by the authors. Licensee MDPI, Basel, Switzerland. This article is an open access article distributed under the terms and conditions of the Creative Commons Attribution (CC BY) license (https://creativecommons.org/licenses/by/4.0/).
Share and Cite
Jiménez-Redondo, G.; Castro-Frecha, B.; Martínez-Noguera, F.J.; Alcaraz, P.E.; Marín-Pagán, C. Physiological Responses in Trail Runners during a Maximal Test with Different Weighted-Vest Loads. Sports 2024, 12, 189. https://doi.org/10.3390/sports12070189
Jiménez-Redondo G, Castro-Frecha B, Martínez-Noguera FJ, Alcaraz PE, Marín-Pagán C. Physiological Responses in Trail Runners during a Maximal Test with Different Weighted-Vest Loads. Sports. 2024; 12(7):189. https://doi.org/10.3390/sports12070189
Chicago/Turabian StyleJiménez-Redondo, Germán, Bruno Castro-Frecha, Francisco Javier Martínez-Noguera, Pedro E. Alcaraz, and Cristian Marín-Pagán. 2024. "Physiological Responses in Trail Runners during a Maximal Test with Different Weighted-Vest Loads" Sports 12, no. 7: 189. https://doi.org/10.3390/sports12070189
APA StyleJiménez-Redondo, G., Castro-Frecha, B., Martínez-Noguera, F. J., Alcaraz, P. E., & Marín-Pagán, C. (2024). Physiological Responses in Trail Runners during a Maximal Test with Different Weighted-Vest Loads. Sports, 12(7), 189. https://doi.org/10.3390/sports12070189