

Methods for Capturing and Quantifying Contact Events in Collision Sports


Abstract
:1. Introduction
2. Tracking Systems with Inbuilt Inertial Sensors
2.1. Data Capture
2.2. Practical Applications
2.3. Limitations
3. Head Impact Telemetry Devices
3.1. Data Capture
3.2. Practical Application
3.3. Limitations
4. Video Analysis
4.1. Data Capture
Practical Application
4.2. Limitations
4.3. Data Integration
5. An Alternative to Quantifying Contact Intensity and Contact Volume
6. Conclusions
Author Contributions
Funding
Institutional Review Board Statement
Informed Consent Statement
Data Availability Statement
Acknowledgments
Conflicts of Interest
References
- West, S.W.; Clubb, J.; Torres-Ronda, L.; Howells, D.; Leng, E.; Vescovi, J.D.; Carmody, S.; Posthumus, M.; Dalen-Lorentsen, T.; Windt, J. More than a Metric: How Training Load is Used in Elite Sport for Athlete Management. Int. J. Sports Med. 2021, 42, 300–306. [Google Scholar] [CrossRef]
- West, S.; Shrier, I.; Impellizzeri, F.M.; Clubb, J.; Ward, P.; Bullock, G. Training-Load Management Ambiguities and Weak Logic: Creating Potential Consequences in Sport Training and Performance. Int. J. Sports Physiol. Perform. 2024, 20, 481–484. [Google Scholar] [CrossRef]
- Staunton, C.A.; Abt, G.; Weaving, D.; Wundersitz, D.W.T. Misuse of the term ‘load’ in sport and exercise science. J. Sci. Med. Sport. 2022, 25, 439–444. [Google Scholar] [CrossRef]
- Malone, J.J.; Lovell, R.; Varley, M.C.; Coutts, A.J. Unpacking the black box: Applications and considerations for using gps devices in sport. Int. J. Sports Physiol. Perform. 2017, 12, 18–26. [Google Scholar] [CrossRef] [PubMed]
- Aiello, F.; Di Claudio, C.; Fanchini, M.; Impellizzeri, F.M.; McCall, A.; Sharp, C.; Brown, S.J. Do non-contact injuries occur during high-speed running in elite football? Preliminary results from a novel GPS and video-based method. J. Sci. Med. Sport. 2023, 26, 465–470. [Google Scholar] [CrossRef] [PubMed]
- Buchheit, M.; Settembre, M.; Hader, K.; Mchugh, D. From High-Speed Running To Hobbling On Crutches: A Machine Learning Perspective On The Relationships Between Training Doses and Match Injury Trends. Sport Perform. Sci. Rep. 2024, 1, 1–11. [Google Scholar]
- Gualtieri, A.; Rampinini, E.; Dello Iacono, A.; Beato, M. High-speed running and sprinting in professional adult soccer: Current thresholds definition, match demands and training strategies. A systematic review. Front. Sports Act. Living 2023, 5, 1116293. [Google Scholar] [CrossRef]
- Delves, R.I.M.; Aughey, R.J.; Ball, K.; Duthie, G.M. The Quantification of Acceleration Events in Elite Team Sport: A Systematic Review. Sports Med. Open 2021, 7, 45. [Google Scholar] [CrossRef]
- van der Zwaard, S.; Otter, R.T.A.; Kempe, M.; Knobbe, A.; Stoter, I.K. Capturing the Complex Relationship Between Internal and External Training Load: A Data-Driven Approach. Int. J. Sports Physiol. Perform. 2023, 18, 634–642. [Google Scholar] [CrossRef]
- Rice, S.G.; Small, E.W.; McCambridge, T.M.; Benjamin, H.; Bernhardt, D.T.; Brenner, J.S.; Cappetta, C.; Congeni, J.A.; Gregory, A.J.; Griesemer, B.A.; et al. Medical Conditions Affecting Sports Participation. Pediatrics 2008, 121, 841–848. [Google Scholar] [CrossRef]
- Chambers, R.M.; Gabbett, T.J.; Gupta, R.; Josman, C.; Bown, R.; Stridgeon, P.; Cole, M.H. Automatic detection of one-on-one tackles and ruck events using microtechnology in rugby union. J. Sci. Med. Sport. 2019, 22, 827–832. [Google Scholar] [PubMed]
- Cerrito, A.; Milburn, P.; Alston-Knox, C.; Evans, K. Cervical spine kinematics during machine-based and live scrummaging. J. Sports Sci. 2019, 37, 1551–1559. [Google Scholar] [PubMed]
- Hendricks, S.; van Niekerk, T.; Sin, D.W.; Lambert, M.; den Hollander, S.; Brown, J.; Maree, W.; Treu, P.; Till, K.; Jones, B. Technical determinants of tackle and ruck performance in International rugby union. J. Sports Sci. 2018, 36, 522–528. [Google Scholar] [CrossRef]
- Gabler, L.; Patton, D.; Begonia, M.; Daniel, R.; Rezaei, A.; Huber, C.; Siegmund, G.; Rooks, T.; Wu, L. Consensus Head Acceleration Measurement Practices (CHAMP): Laboratory Validation of Wearable Head Kinematic Devices. Ann. Biomed. Eng. 2022, 50, 1356–1371. [Google Scholar]
- Powell, D.R.L.; Petrie, F.J.; Docherty, P.D.; Arora, H.; Williams, E.M.P. Development of a Head Acceleration Event Classification Algorithm for Female Rugby Union. Ann. Biomed. Eng. 2023, 51, 1322–1330. [Google Scholar] [CrossRef] [PubMed]
- Tooby, J.; Woodward, J.; Tucker, R.; Jones, B.; Falvey, É.; Salmon, D.; Bussey, M.D.; Starling, L.; Tierney, G. Instrumented Mouthguards in Elite-Level Men’s and Women’s Rugby Union: The Incidence and Propensity of Head Acceleration Events in Matches. Sports Med. 2024, 54, 1327–1338. [Google Scholar] [CrossRef]
- Paul, L.; Naughton, M.; Jones, B.; Davidow, D.; Patel, A.; Lambert, M.; Hendricks, S. Quantifying Collision Frequency and Intensity in Rugby Union and Rugby Sevens: A Systematic Review. Sports Med. Open 2022, 8, 12. [Google Scholar]
- Naughton, M.; Jones, B.; Hendricks, S.; King, D.; Murphy, A.; Cummins, C. Quantifying the Collision Dose in Rugby League: A Systematic Review, Meta-analysis, and Critical Analysis. Sports Med.-Open 2020, 6, 6. [Google Scholar]
- Aguiar, O.M.G.; Chow, T.R.; Chong, H.; Vakili, O.; Robinovitch, S.N. Associations between the circumstances and severity of head impacts in men’s university ice hockey. Sci. Rep. 2023, 13, 17402. [Google Scholar]
- Huber, C.M.; Patton, D.A.; Wofford, K.L.; Margulies, S.S.; Cullen, D.K.; Arbogast, K.B. Laboratory Assessment of a Headband-Mounted Sensor for Measurement of Head Impact Rotational Kinematics. J. Biomech. Eng. 2021, 143, 024502. [Google Scholar] [CrossRef]
- King, D.; Hume, P.; Gissane, C.; Cummins, C.; Clark, T.N. Measurement of Head Impacts in a Senior Amateur Rugby League Team with an Instrumented Patch: Exploratory Analysis. ARC J. Res. Sports Med. 2017, 2, 9–20. [Google Scholar]
- Tooby, J.; Till, K.; Gardner, A.; Stokes, K.; Tierney, G.; Weaving, D.; Rowson, S.; Ghajari, M.; Emery, C.; Bussey, M.D.; et al. When to Pull the Trigger: Conceptual Considerations for Approximating Head Acceleration Events Using Instrumented Mouthguards. Sports Med. 2024, 54, 1361–1369. [Google Scholar] [CrossRef] [PubMed]
- O’Connor, K.L.; Rowson, S.; Duma, S.M.; Broglio, S.P. Head-Impact–Measurement Devices: A Systematic Review. J. Athl. Train. 2017, 52, 206. [Google Scholar] [CrossRef]
- Patton, D.A.; Huber, C.M.; Jain, D.; Myers, R.K.; McDonald, C.C.; Margulies, S.S.; Master, C.L.; Arbogast, K.B. Head Impact Sensor Studies In Sports: A Systematic Review Of Exposure Confirmation Methods. Ann. Biomed. Eng. 2020, 48, 2497–2507. [Google Scholar] [CrossRef]
- Luke, N.; Woodhouse, M.; Bennett, J.; Tallent, S.; David, P.; Waldron, M.; Woodhouse, L.N.; Bennett, M.; Tallent, J.; Patterson, S.D. The relationship between physical characteristics and match collision performance among elite international female rugby union players. Eur. J. Sport. Sci. 2023, 23, 1849–1858. [Google Scholar]
- Clarke, A.C.; Anson, J.M.; Pyne, D.B. Proof of Concept of Automated Collision Detection Technology in Rugby Sevens. J. Strength. Cond. Res. 2017, 31, 1116–1120. [Google Scholar] [CrossRef] [PubMed]
- Gabbett, T.J. Relationship Between Accelerometer Load, Collisions, and Repeated High-Intensity Effort Activity in Rugby League Players. J. Strength. Cond. Res. 2015, 29, 3424–3431. [Google Scholar] [CrossRef]
- Reardon, C.; Tobin, D.P.; Tierney, P.; Delahunt, E. Collision count in rugby union: A comparison of micro-technology and video analysis methods. J. Sports Sci. 2017, 35, 2028–2034. [Google Scholar] [CrossRef]
- Cummins, C.; Orr, R.; O’Connor, H.; West, C. Global positioning systems (GPS) and microtechnology sensors in team sports: A systematic review. Sports Med. 2013, 43, 1025–1042. [Google Scholar] [CrossRef]
- Thornton, H.R.; Nelson, A.R.; Delaney, J.A.; Serpiello, F.R.; Duthie, G.M. Interunit reliability and effect of data-processing methods of global positioning systems. Int. J. Sports Physiol. Perform. 2019, 14, 432–438. [Google Scholar] [CrossRef]
- Russell, M.; Sparkes, W.; Northeast, J.; Cook, C.J.; Love, T.D.; Bracken, R.M.; Kilduff, L.P. Changes in acceleration and deceleration capacity throughout professional soccer match-play. J. Strength Cond. Res. 2016, 30, 2839–2844. [Google Scholar] [PubMed]
- Nolan, D.; Curran, O.; Brady, A.J.; Egan, B. Physical Match Demands of International Women’s Rugby Union: A Three-Year Longitudinal Analysis of a Team Competing in The Women’s Six Nations Championship. J. Funct. Morphol. Kinesiol. 2023, 8, 32. [Google Scholar] [CrossRef]
- Tierney, P.; Blake, C.; Delahunt, E. The relationship between collision metrics from micro-sensor technology and video-coded events in rugby union. Scand. J. Med. Sci. Sports 2020, 30, 2193–2204. [Google Scholar] [CrossRef]
- Peek, R.J.; Carey, D.L.; Middleton, K.J.; Gastin, P.B.; Clarke, A.C. Association Between Position-Specific Impact and Movement Characteristics of Professional Rugby Union Players During Game Play. J. Strength. Cond. Res. 2023, 37, 161–166. [Google Scholar] [PubMed]
- Suarez-Arrones, L.; Portillo, J.; Pareja-Blanco, F.; De Villareal, E.S.; Sánchez-Medina, L.; Munguía-Izquierdo, D. Match-play activity profile in elite women’s rugby union players. J. Strength. Cond. Res. 2014, 28, 452–458. [Google Scholar] [PubMed]
- Woodhouse, L.N.; Tallent, J.; Patterson, S.D.; Waldron, M. Elite international female rugby union physical match demands: A five-year longitudinal analysis by position and opposition quality. J. Sci. Med. Sport. 2021, 24, 1173–1179. [Google Scholar]
- MacLeod, S.J.; Hagan, C.; Egaña, M.; Davis, J.; Drake, D. The Use of Microtechnology to Monitor Collision Performance in Professional Rugby Union. Int. J. Sports Physiol. Perform. 2018, 13, 1075–1082. [Google Scholar]
- Gabbett, T.J. Quantifying the physical demands of collision sports: Does microsensor technology measure what it claims to measure? J. Strength Cond. Res. 2013, 27, 2319–2322. [Google Scholar] [CrossRef]
- Chambers, R.M.; Gabbett, T.J.; Cole, M.H. Validity of a Microsensor-Based Algorithm for Detecting Scrum Events in Rugby Union. Int. J. Sports Physiol. Perform. 2019, 14, 176–182. [Google Scholar]
- Menzies, F.A.; Walsh, J.; Boyd, A.J.; Turner, A.P. Assessment of contact involvements and scrums in international rugby union match-play using video analysis and microsensor technology methods. J. Sports Sci. 2023, 41, 2129–2137. [Google Scholar] [CrossRef]
- Okholm Kryger, K.; Thomson, A.; Tang, A.; Brown, N.; Bruinvels, G.; Rosenbloom, C.; Carmody, S.; Williamson, L.; Datson, N.; Jobson, E.; et al. Ten questions in sports engineering: Technology in elite women’s football. Sports Eng. 2022, 25, 25. [Google Scholar]
- Peek, R.J.; Carey, D.L.; Middleton, K.J.; Gastin, P.B.; Clarke, A.C. Peak movement and impact characteristics of different training methods in professional rugby union. J. Sports Sci. 2022, 40, 2760–2767. [Google Scholar] [CrossRef]
- Roe, G.; Halkier, M.; Beggs, C.; Till, K.; Jones, B. The Use of Accelerometers to Quantify Collisions and Running Demands of Rugby Union Match-Play. Int. J. Perform. Anal. Sport. 2016, 16, 590–601. [Google Scholar]
- Australian Institute of Sport. Concussion and Brain Health Position Statement 2023 [Internet]. Canberra (Australia). 2023. Available online: www.concussioninsport.gov.au/__data/assets/pdf_file/0006/1090680/concussion-and-brain-health-position-statement-2023.pdf (accessed on 9 October 2024).
- Wu, L.C.; Nangia, V.; Bui, K.; Hammoor, B.; Kurt, M.; Hernandez, F.; Kuo, C.; Camarillo, D.B. In Vivo Evaluation of Wearable Head Impact Sensors. Ann. Biomed. Eng. 2016, 44, 1234–1245. [Google Scholar] [CrossRef]
- Holcomb, T.D.; Marks, M.E.; Pritchard, N.S.; Miller, L.; Espeland, M.A.; Miles, C.M.; Moore, J.B.; Foley, K.L.; Stitzel, J.D.; Urban, J.E. Characterization of head acceleration exposure during youth football practice drills. J. Appl. Biomech. 2023, 39, 157–168. [Google Scholar] [CrossRef]
- Kuo, C.; Patton, D.; Rooks, T.; Tierney, G.; McIntosh, A.; Lynall, R.; Esquivel, A.; Daniel, R.; Kaminski, T.; Mihalik, J.; et al. On-Field Deployment and Validation for Wearable Devices. Ann. Biomed. Eng. 2022, 50, 1372–1388. [Google Scholar] [CrossRef] [PubMed]
- Mihalik, J.P.; Lynall, R.C.; Wasserman, E.B.; Guskiewicz, K.M.; Marshall, S.W. Evaluating the ‘Threshold Theory’: Can Head Impact Indicators Help? Med. Sci. Sports Exerc. 2017, 49, 247–253. [Google Scholar]
- Field, B.; Waddington, G.; McKune, A.; Goecke, R.; Gardner, A.J. Validation of an instrumented mouthguard in rugby union—A pilot study comparing impact sensor technology to video analysis. Front. Sports Act. Living 2023, 5, 1230202. [Google Scholar]
- Roe, G.; Whitehead, S.; Starling, L.; Allan, D.; Cross, M.; Falvey, É.; Kemp, S.; Owen, C.; Readhead, C.; Salmon, D.; et al. Embracing the impact from instrumented mouthguards (iMGs): A survey of iMG managers’ perceptions of staff and player interest into the technology, data and barriers to use. Eur. J. Sport. Sci. 2024, 24, 670–681. [Google Scholar] [CrossRef]
- Ross, A.; Gill, N.; Cronin, J.; Malcata, R. The relationship between physical characteristics and match performance in rugby sevens. Eur. J. Sport. Sci. 2015, 15, 565–571. [Google Scholar]
- Sewry, N.; Lambert, M.; Roode, B.; Matthews, B.; Hendricks, S. The Relationship between Playing Situation, Defence and Tackle Technique in Rugby Union. Int. J. Sports Sci. Coach. 2015, 10, 1115–1128. [Google Scholar] [CrossRef]
- Hendricks, S.; O’connor, S.; Lambert, M.; Brown, J.C.; Burger, N.; Fie, S.M.; Readhead, C.; Viljoen, W. Video analysis of concussion injury mechanism in under-18 rugby. BMJ Open Sport. Exerc. Med. 2016, 2, e000053. [Google Scholar] [CrossRef] [PubMed]
- Hendricks, S.; Micheal, L. Theoretical Model Describing the Relationship between the Number of Tackles in Which A Player Engages, Tackle Injury Risk and Tackle Performance. Br. J. Sports Med. 2014, 13, 715–717. [Google Scholar]
- Stevens, L.J.; Hopkins, W.G.; Chittenden, J.A.; Koper, B.Z.; Smith, T.B. Quantifying Offense and Defense Workloads in Professional Rugby Union. Int. J. Sports Physiol. Perform. 2024, 19, 307–314. [Google Scholar] [CrossRef]
- Hendricks, S.; Till, K.; Den Hollander, S.; Savage, T.N.; Roberts, S.P.; Tierney, G.; Burger, N.; Kerr, H.; Kemp, S.; Cross, M.; et al. Consensus on a video analysis framework of descriptors and definitions by the Rugby Union Video Analysis Consensus group. Br. J. Sports Med. 2020, 54, 566–572. [Google Scholar] [CrossRef] [PubMed]
- Cazzola, D.; Holsgrove, T.P.; Preatoni, E.; Gill, H.S.; Trewartha, G. Cervical Spine Injuries: A Whole-Body Musculoskeletal Model for the Analysis of Spinal Loading. PLoS ONE 2017, 12, e0169329. [Google Scholar] [CrossRef]
- Haralabidis, N.; Serrancolí, G.; Colyer, S.; Bezodis, I.; Salo, A.; Cazzola, D. Three-dimensional data-tracking simulations of sprinting using a direct collocation optimal control approach. PeerJ 2021, 9, e10975. [Google Scholar]

| Sensor | Function | Application |
|---|---|---|
| Accelerometer |
|
|
| Gyroscope |
|
|
| Magnetometer |
|
|
| Methodology | Advantages | Disadvantages |
|---|---|---|
 |
|
|
 |
|
|
 |
|
|
 |
|
|
 |
|
|
 |
|
|
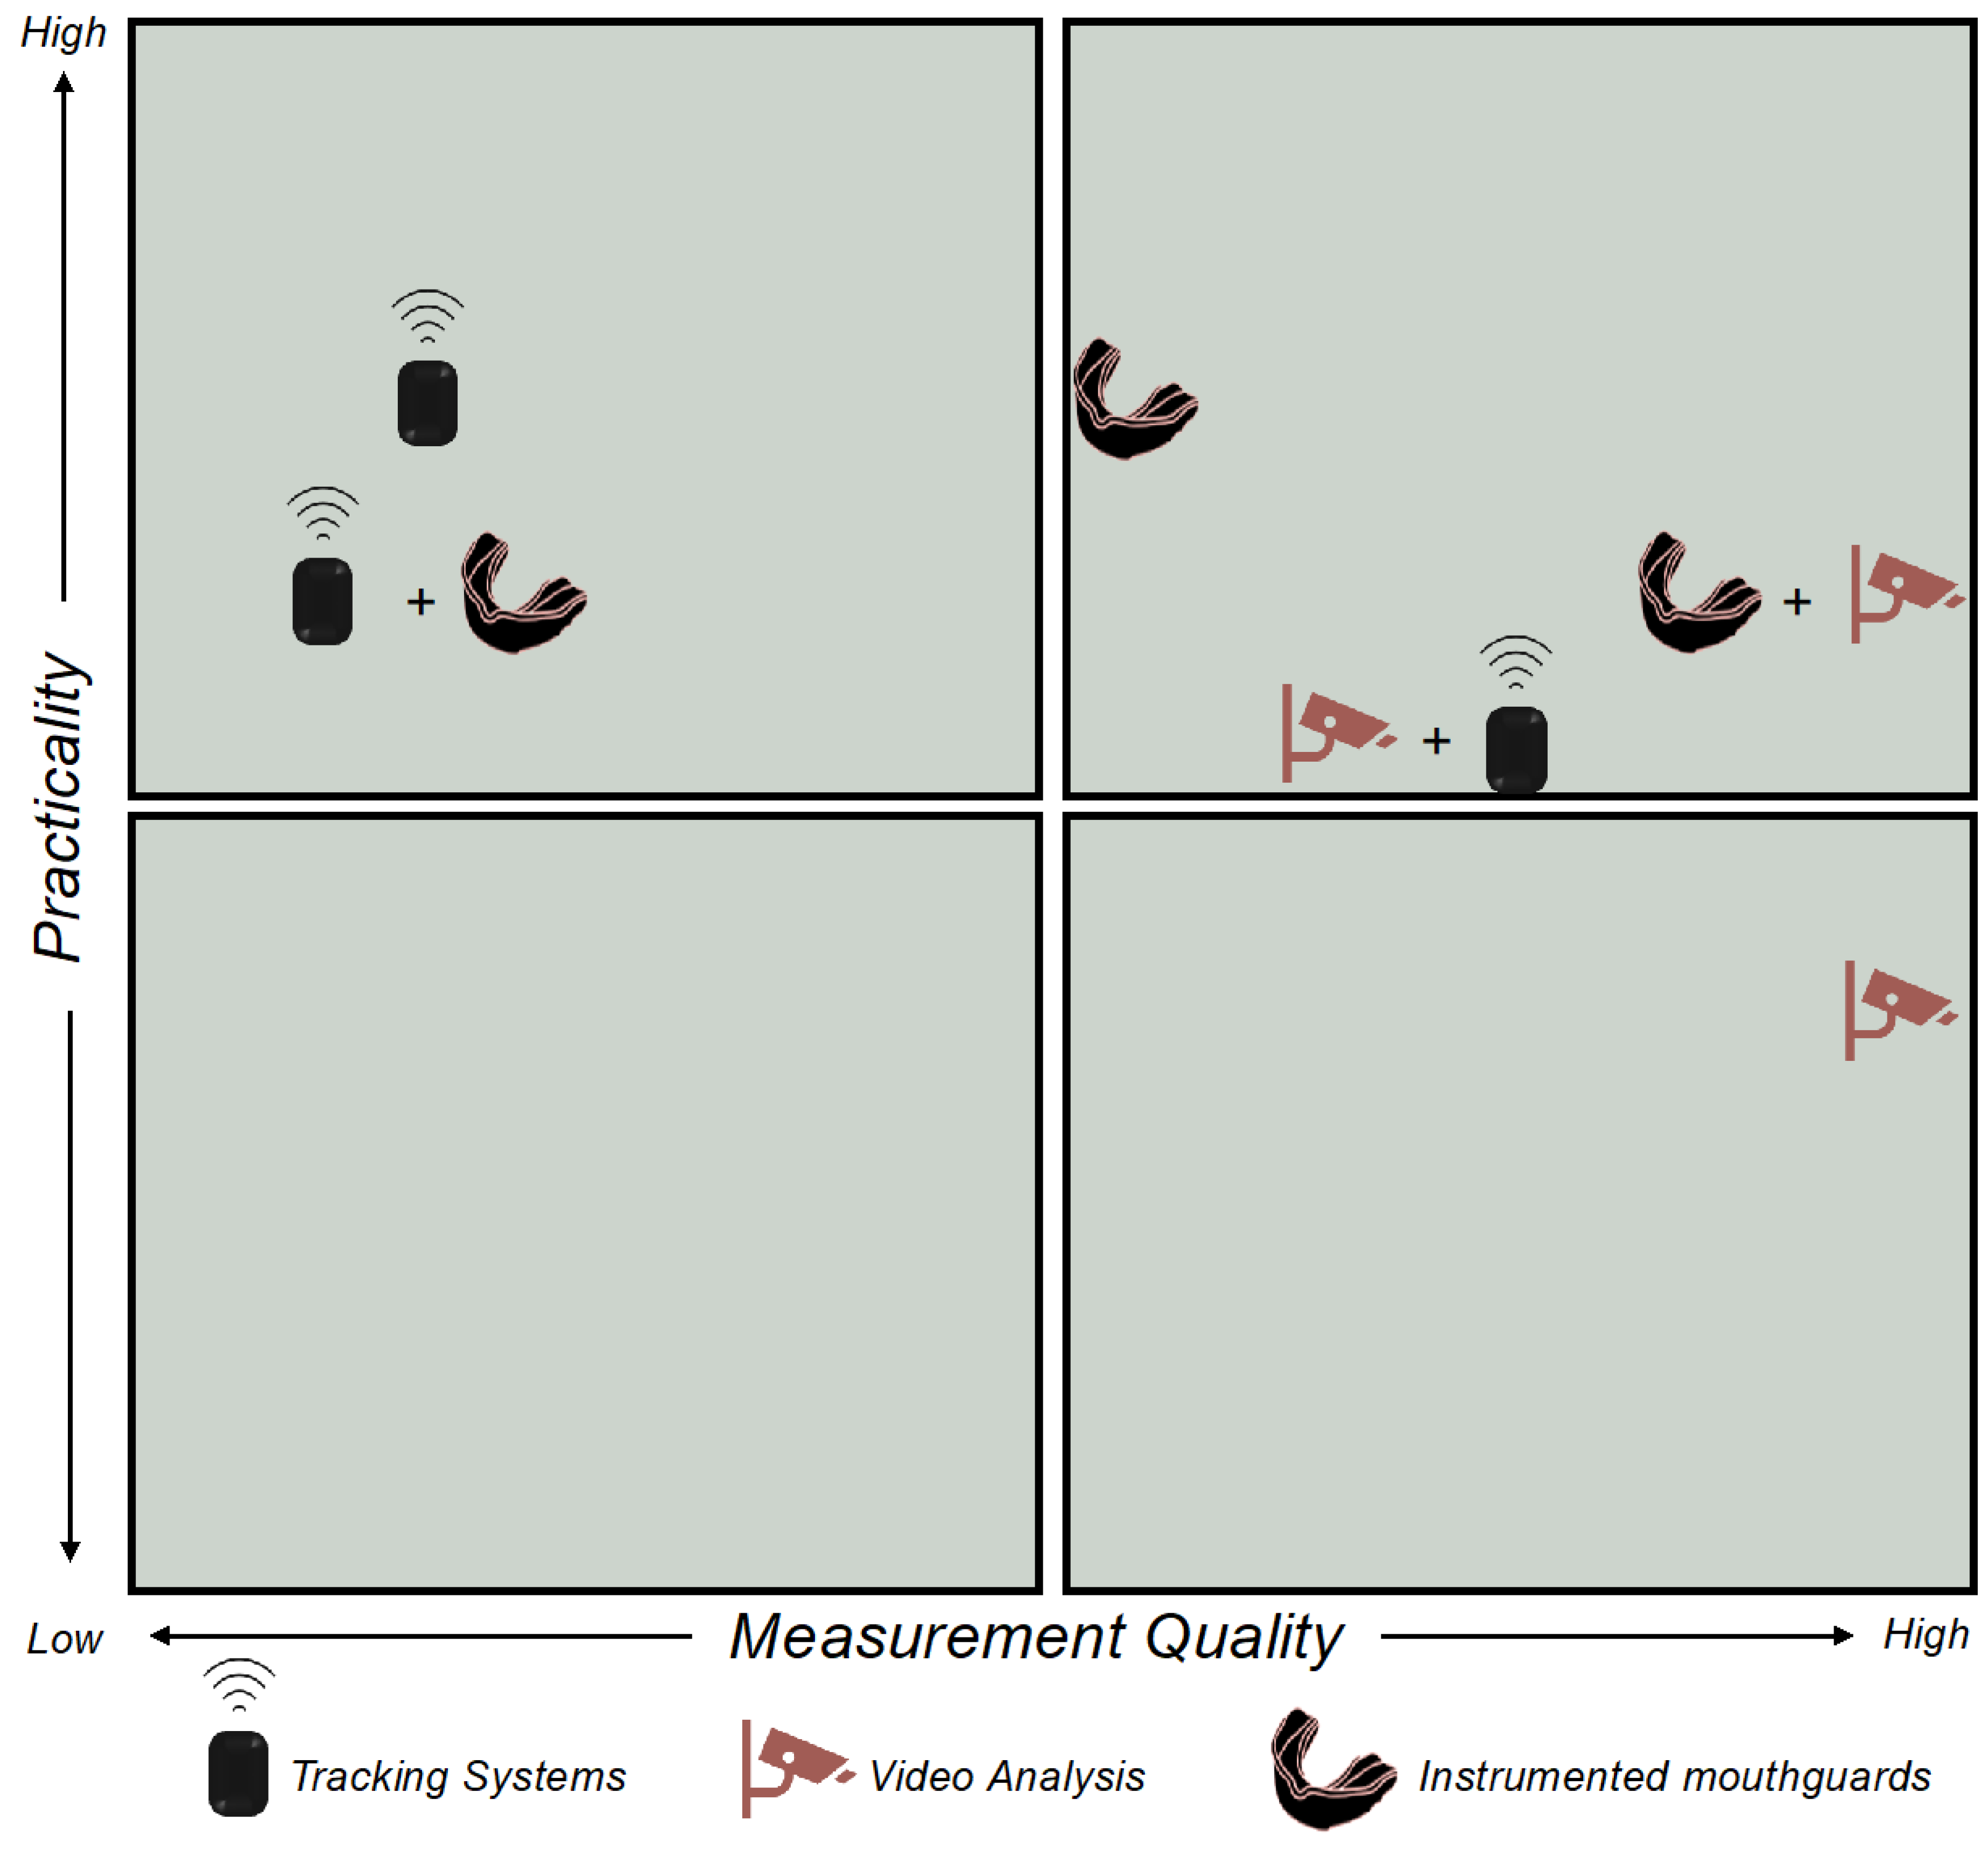
 : tracking systems;
  : instrumented mouthguard;
  : video analysis; HAEs: head acceleration events, iMG: instrumented mouthguard.
Disclaimer/Publisher’s Note: The statements, opinions and data contained in all publications are solely those of the individual author(s) and contributor(s) and not of MDPI and/or the editor(s). MDPI and/or the editor(s) disclaim responsibility for any injury to people or property resulting from any ideas, methods, instructions or products referred to in the content. |
© 2025 by the authors. Licensee MDPI, Basel, Switzerland. This article is an open access article distributed under the terms and conditions of the Creative Commons Attribution (CC BY) license (https://creativecommons.org/licenses/by/4.0/).
Share and Cite
Bolger, C.; Mara, J.; Field, B.; Pyne, D.B.; McKune, A.J. Methods for Capturing and Quantifying Contact Events in Collision Sports. Sports 2025, 13, 102. https://doi.org/10.3390/sports13040102
Bolger C, Mara J, Field B, Pyne DB, McKune AJ. Methods for Capturing and Quantifying Contact Events in Collision Sports. Sports. 2025; 13(4):102. https://doi.org/10.3390/sports13040102
Chicago/Turabian StyleBolger, Craig, Jocelyn Mara, Byron Field, David B. Pyne, and Andrew J. McKune. 2025. "Methods for Capturing and Quantifying Contact Events in Collision Sports" Sports 13, no. 4: 102. https://doi.org/10.3390/sports13040102
APA StyleBolger, C., Mara, J., Field, B., Pyne, D. B., & McKune, A. J. (2025). Methods for Capturing and Quantifying Contact Events in Collision Sports. Sports, 13(4), 102. https://doi.org/10.3390/sports13040102