Abstract
Technological developments have led to the increased use of carbon fiber and prosthetic lower-limbs in running events at the Paralympic Games. This study aims to exploit a series of statistical techniques in order to prepare a response to the vital question of whether utilizing prosthetic feet can affect an athletes ability when running competitively at the Paralympics Games by comparing both within and between different classifications. The study also considers the differences between running on biological limbs and prosthetic lower-limbs from a mechanical point of view. The results from the male 100 m, 200 m and 400 m at the 2012 London Paralympic Games have been the source of this investigation. The investigation provides statistical evidence to propose that the number of prosthetic limbs used and the structure of such limbs have a significant impact on the outcome of track events at the Paralympic Games.
1. Introduction
New technologies are increasingly used in order to enhance the human body and mind beyond the contemporary standards that categorizes human beings [1]. At the Paralympic Games, composite energy storage and return prosthetic lower-limbs are currently widely used by athletes. This in turn begs the question; does the use of prosthetic lower-limbs enhance an athletes running ability? On the other hand, there is the question of whether the use of prosthetic lower-limbs is an advantage or disadvantage? This study is aimed at providing answers to these questions with the aid of various statistical techniques. In order to achieve this aim, we consider two crucial parts of a running competition; (1) the starting point where athletes begin the race, and (2) the performance during the competition.
We begin by providing a concise insight into the problem. For the athletes who use blade sprosthetic lower-limbs, there is no contribution from the ankle motion and so, they cannot achieve the energy gained from flexing the ankle against the starting blocks and the powering off. In fact, there is a lack of energy generated by the strides at the starting point. Prosthetic lower-limbs store a proportion of a potential energy when it hits the ground, and this energy is released in a form of kinetic energy when the blade returns to its natural position. The lower-limb prostheses return about 90% of the energy generated by the runner’s stride, while an able-bodied leg and foot, can return as much as 240% [2]. Accordingly, a biological lower-limb has a better performance in comparison to a prosthetic equivalent. Recent studies indicate that running using lower limb sprinting prostheses is physiologically similar to intact-limb elite running (measured in mean gross metabolic cost of transport), but mechanically different (longer foot-ground contact, shorter aerial and swing times and lower stance averaged vertical forces) [3,4].
The IAAF (International Association of Athletics Federations) intended to determine whether the world record holder Oscar Pistorius prosthetic limbs gave him an advantage over able-bodied competitors. In their study, they had the bio-mechanical and physiological analysis of long sprint running by Pistorius, and the results were compared with five able-bodied athletes who are capable of similar levels of performance at 400 m. The experiment included a 400 m sprint, and the athletes used a mask in order to measure oxygen and carbon dioxide during inhalation and exhalation to test aerobic capacity, and ran on pressure plates to measure the force from prosthetic lower-limb and legs. The results of the IAAF study indicated that Pistorius used 25% less energy in comparison to able-bodied athletes [5].
It is also reported that the amount of energy returned to Pistorius is three times higher than the energy attainable with a human ankle joint during maximum sprinting. The energy loss in Pistorius’s prosthetics was measured at 9.3% while the average energy loss in an ankle joint of able-bodied athletes was measured at 41.4% and the oxygen uptake for Pistorius was 25% lower than able bodied athletes [5]. Lower oxygen uptake suggests lower exertion by the athlete and basically means the athlete is able to complete the task with a comparatively lower effort [6]. Thus, it was concluded that there is a 30% mechanical advantage for blade runners in comparison to able-bodied athletes. It was also concluded that running with energy storage and return prostheses leads to less mechanical work for lifting the body combined with less vertical motion. Therefore, a blade runner can run in a flatter manner when compared with able-bodied athletes and benefit from what is termed as a bio-mechanical advantage [5,7].
One of the key issues in a running competition is the limb repositioning time [8]. The average male sprinter moves his leg from back to front in 0.37 s. The five recent world record holders in 100 m competition record the average of 0.34 s. However, Pistorius swings his legs in 0.28 s, largely because his prosthetic lower-limb are lighter than a regular human leg. On average, his blade’s weigh 2.4 kg while natural lower-limbs weighs around 5.7 kg [9]. In [10] it was demonstrated that when a sinusoidal input with a frequency close to the natural frequency of an energy storing and returning (ESR) foot is applied to a system, it can make the ESR foot susceptible to resonance which if sustained can lead to a bouncing or a ‘trampoline effect’. They also demonstrated theoretically that if this impulse can be synchronised with the frequency of human effort, it can result in storage or recovery of substantial amount of energy in the system [10].
In order to explain how this bouncing effect can occur, it could be added that in a prosthetic foot, when the excitation frequency (athlete muscle pressure) is increased, the inertia force will also increase until it reaches a point at which the inertia force cancels the stiffness force of spring. In this situation the excitation force acts on the system without any resistance. This will result in oscillating of the mass at its natural frequency. In the absence of any damping, the amplitude of the resulting vibration will increase. This condition is called resonance. If the frequency is increased further, the inertia force will overcome stiffness force. The magnitude of oscillation will become small, until a point where the motion is controlled by the mass and then the system is said to be in isolation. In simplified terms, the athlete should apply an energy equal to the loss of energy in one cycle to maintain this advantage. For bilateral amputees this force is substantially less than for a normal foot due to the fact that residual energy is still in the mass and continually replenish [11].
The main focus with published research historically has focused on the physiological performance of lower-limb amputees but no study to date considers this issue from a statistical point of view. However, it should be stated that the purpose of this paper is not to consider the physiological, bio-mechanical or philosophical differences between running using lower-limb prostheses. The key purpose of this paper is the initial exploitation of relevant statistical techniques for identifying these differences from a statistically reliable point of view as opposed to a physiological point of view. We use the 2012 London Paralympic results as the source of data, and endeavor to extract vital information from this database by using statistical tools for identifying the differences between running on prostheses and natural lower-limbs. The number of prosthetic lower-limbs which athletes use in their competition, and the structure of the blade (whether it is below or above knee) are two key elements which can potentially have an effect on the outcome of a given event. Also of interest is the comparison between the running performances of uni-lateral and bilateral amputees during the running competition. This paper seeks to determine whether these elements can bring about an added advantage or create an undue disadvantage for the athletes. In the process, we attempt to clarify the differences between running on prosthetic lower-limb in terms of number (lateral and bilateral), classification (T42, T44) and performance, and finally combine the results from this paper with selected mechanical revisions from other papers to conclude which group of runners are taking advantage of their situation.
2. The Data
The data and subsequent analysis is derived from the amputee-based running results from the London 2012 Paralympic Games. At the Paralympic games, different athletes compete against each other in various categories. These classifications are created by the International Paralympic Committee (IPC) and have a root in the 2003 attempt to address the overall objective to support and co-ordinate the on-going development of accurate, reliable, consistent, and credible sport focused classification systems and their implementations [12]. All the data was retrieved via the official Paralympic Games website [13]. These data include the name of athletes, ranking, country and most importantly the time taken to complete the competition. The number of prosthetic limbs for each athlete was identified by accessing their respective biography’s. Following the evaluation of all different classifications, T42 and T44 were considered as the two main categories:
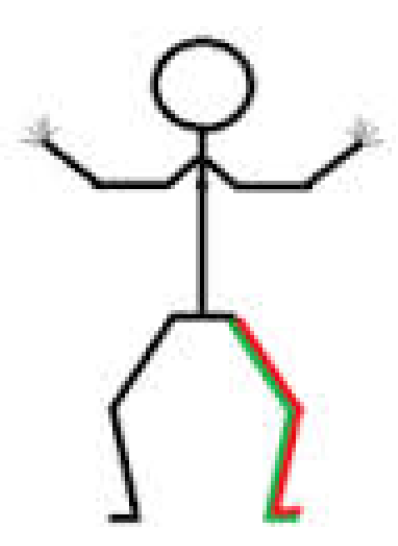
- T42: The IPC define this as: Single above knee amputees and athletes with other impairments that are comparable to a single above knee amputation [12] (see Figure 1).
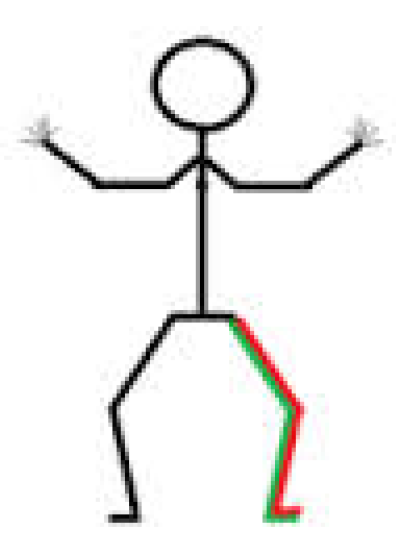
Figure 1.
T42 Classification.
Figure 1.
T42 Classification.
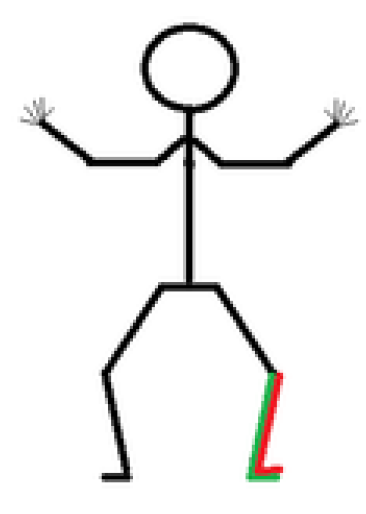
- T44: The IPC define this as: the class for any athlete with a lower limb impairment/s that meets minimum disability criteria for: lower limb deficiency; impaired lower limb; impaired lower limb muscle power; or leg length difference [14] (see Figure 2).
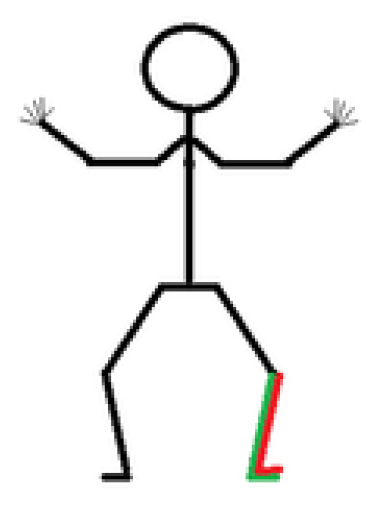
Figure 2.
T44 Classification.
Figure 2.
T44 Classification.
It should be noted that during the 2012 Paralympic Games, an additional category, the T43, was combined with the T44 category in the male running events investigated for this paper. This is due to the governing body proposing that a low level of athlete participation in one or more classifications can lead to a combined classification in some events.
- T43: The IPC defined this as: double below knee amputees and other athletes with impairments that are comparable to a double below knee amputation (see Figure 3).
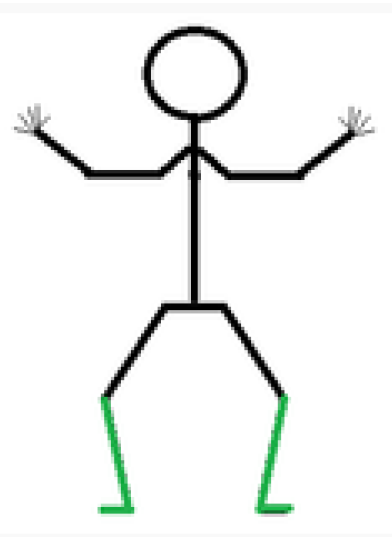
Figure 3.
T43 Classification.
Figure 3.
T43 Classification.
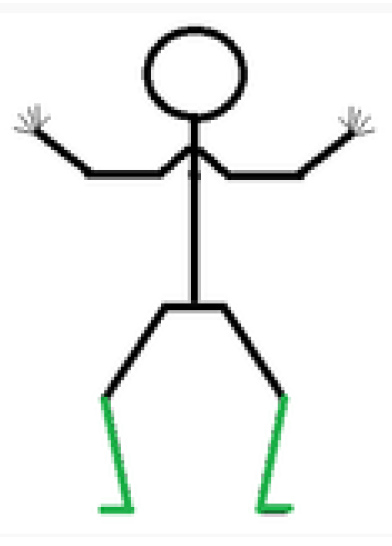
Table 1, Table 2 and Table 3 present some descriptive statistics for 100 m, 200 m and 400 m competitions. In these tables N stands for the number of competitors in each competition and the first number in parentheses indicates how many of them used two prosthetic limbs; the middle number indicates how many of them used just one prosthetic limb, and finally the last one indicates how many did not use any prosthetic limbs. For example, 6 (1,5,0) in the first row of Table 1 indicates that in T42/1st Round/Heat 1, six athletes competed against each other while one of them used two prosthetic lower-limb, five of them used only one prostheses and none of them used their natural limbs. Furthermore, s.d. stands for standard deviation, Min and Max indicate the minimum and maximum of running time. In this paper, the analysis of variance (ANOVA) test has been considered as the key statistical tool in identifying the differences between different groups. Note that one of the assumptions of using one way ANOVA is that the dependent variable should be approximately normally distributed for each category. Here, the Shapiro-Wilk (S-W) test of normality [15] is also performed.

Table 1.
Descriptive statistics for 100 m competition.
| Category | N | Mean | Median | s.d. | Min | Max | S-W |
|---|---|---|---|---|---|---|---|
| T42/1st Round/Heat 1 | 6 (1,5,0) | 13.73 | 13.07 | 1.55 | 12.43 | 15.76 | 0.78 |
| T42/1st Round/Heat 2 | 6 (1,4,0) | 12.92 | 12.73 | 0.49 | 12.53 | 13.77 | 0.84 |
| T42/Final | 8 (1,6,0) | 12.71 | 12.69 | 0.25 | 12.4 | 13.03 | 0.91 |
| T44/1st Round/Heat 1 | 7 (2,5,0) | 11.92 | 12.16 | 0.55 | 11.08 | 12.49 | 0.89 |
| T44/1st Round/Heat 2 | 7 (3,3,1) | 12.61 | 11.92 | 0.5 | 11.18 | 12.61 | 0.96 |
| T44/1st Round/Heat 3 | 6 (1,5,0) | 11.96 | 12.61 | 0.56 | 11.29 | 12.69 | 0.92 |
| T44/Final | 8 (3,4,1) | 11.37 | 11.23 | 0.36 | 11.03 | 11.97 | 0.82 |
** indicates significant levels at 5%.

Table 2.
Descriptive statistics for 200 m competition.
| Category | N | Mean | Median | s.d. | Min | Max | S-W |
|---|---|---|---|---|---|---|---|
| T42/Final | 9 (2,6,1) | 26.04 | 26.07 | 0.76 | 24.38 | 26.97 | 0.91 |
| T44/1st Round/Heat 1 | 6 (3,3,0) | 23.82 | 24.25 | 1.09 | 21.88 | 24.88 | 0.86 |
| T44/1st Round/Heat 2 | 6 (1,5,0) | 23.83 | 23.93 | 1.28 | 22.23 | 25.62 | 0.96 |
| T44/1st Round/Heat 3 | 6 (1,4,0) | 21.14 | 24.42 | 1.63 | 21.30 | 26.23 | 0.93 |
| T44/Final | 8 (3,5,0) | 23.39 | 23.03 | 2.14 | 21.45 | 28.19 | 0.79 |
** indicates significant levels at 5%.

Table 3.
Descriptive statistics for 400 m competition.
| Category | N | Mean | Median | s.d. | Min | Max | S-W |
|---|---|---|---|---|---|---|---|
| T44/ 1st Round/Heat 1 | 6 (2,3,1) | 55.01 | 55.35 | 3.09 | 50.63 | 59.79 | 0.97 |
| T44/ 1st Round/Heat 2 | 5 (3,2,0) | 51.87 | 52.29 | 2.22 | 48.31 | 53.86 | 0.89 |
| T44/ Final | 8 (5,2,1) | 51.9 | 51.62 | 2.93 | 46.68 | 55.91 | 0.96 |
3. Statistical Analysis
In this section, we try to answer the question of whether or not the usage of prosthetic limbs enhances an athlete’s ability in a running competition for different categories. In order to answer this question, three separate one-way ANOVA) tests were performed. The first test was run to assess the difference between performance of athletes in terms of running time and disability status (lateral and bilateral) or in other words, to evaluate the effect of number of prosthetic lower-limbs in a running competition. Table 4 presents the results. The results of the ANOVA test confirms that there are no significant differences for the effect of disability status or using any number of prosthetic lower-limbs, in all cases for 100 m competition as the p-value . Similarly, the results indicate that there are no significant differences for 200 m–T42. Note that, for 200 m-T42, (and in contrast to the previous results) the sample size is too small () and therefore it is difficult to discover a significant effect from the data. Statistical tests require a larger N to guarantee a representative distribution of the population or groups of individuals to whom results will be concluded. Interestingly and in contrast to the previous results, Table 4, reveals significant results for 200 m T44 at a 5% significance level and for 400 m T44 at a 10% significance level.

Table 4.
ANOVA results 100 m, 200 m and 400 m competitions.
| Category | N | p-value |
|---|---|---|
| 100 m | ||
| T42/1st Round/Heat 1-2 | 12 (2,9,1) | 0.656 |
| T42/All | 20 (3,15,2) | 0.354 |
| T44/1st Round/Heat 1-3 | 20 (6,13,1) | 0.667 |
| T44/All | 28 (9,17,2) | 0.922 |
| 200 m | ||
| T42/Final Round | 9 (2,6,1) | 0.925 |
| T44/1st Round/Heat 1-3 | 18 (5,12,1) | 0.003 |
| T44/All | 26 (8,17,1) | 0.009 |
| 400 m | ||
| T44/1st Round/Heat 1-2 | 11 (5,5,1) | 0.062 |
| T44/All | 19 (10,7,2) | 0.010 |
* and ** indicate significant levels at 10% and 5%, respectively.+ indicates the data in this group are not normal, but they have met the homogeneity factor.− indicates that data in this group are normal, but the homogeneity factor has not been met.
All results are tested for normality and homogeneity as these are the two key assumptions for an ANOVA test. When any of these two assumptions were not fulfilled, the result from the Kruskal–Wallis test was included instead of ANOVA. The results of this section indicates that as the length of the competition increases, the number of the prosthetic lower-limbs which athletes use can be considered as a factor. This has a significant effect on the outcome of the competition. However, during the 100 m competition, this factor was not identified as an element which can impact the final outcome of the event.
Next, we consider the effect of the blade’s structure in terms of classification (T42 or T44). Here, the aim is to compare the two categories of T42 (amputee above knee) and T44 (amputee below knee) to evaluate whether the performance differs for each type of prosthetic lower-limb or not. Table 5 represents the results. For example the first row of this table (T42/Final–T44/Final) indicates that 16 people in total competed against each other in the final round of the 100 m and then these 16 people were divided into two groups (T42 and T44) and as the data in these two groups were not normally distributed, the Kruskal–Wallis test was opted to ascertain whether there is any difference between the mean time of these two groups. The results of this test at the 5% significance level indicates that there is a statistically significant difference in the performance between the T42 and T44 groups. The same procedure was carried out in the second and third columns. These results indicate that whether an athlete is disabled, below or above knee can have some statistically significant effect on his running performance.

Table 5.
ANOVA results for 100 m and 200 m competitions considering the effect of classification.
| Category | N | p-value |
|---|---|---|
| 100 m | ||
| T42/Final–T44/Final | 16 (4,10,2) | 0.000 |
| T42/All–T44/All | 48 (12,32,4) | 0.000 |
| 200 m | ||
| T42/Final–T44/Final | 17 (5,11,1) | 0.009 |
** indicates significant levels at 5%.+ indicates the data in this group are not normal, but they have met the homogeneity factor.
One of the common justifications of athletes with two prosthetic limbs for their results is that their superior performance is not due to the effects of prosthetic lower-limb. Here we seek to find a definitive answer to this justification with the aid of an ANOVA test which can prove or disprove same. For this purpose, we consider all six athletes in the data set who participated in 100 m, 200 m and 400 m events. They all belonged to the T44 classification, use different prosthetic lower-limb and the individual results have been compared based on a Kruskal–Wallis test. The results of this test indicates that there is no significant difference at a 5% significance level between the performance of the six athletes. Therefore, there is not enough evidence to support the argument that at least one of them had a better performance in comparison to the other athletes. As such, we propose that any effect of using energy storage and return prostheses is not the predominant factor with respect to running performance when athletes use two prosthetic limbs. The detailed results of this test are reported in Table 6.

Table 6.
ANOVA results for performance.
| Category | N | p-value |
|---|---|---|
| Performance | 30 (27,3,0) | 0.5122 |
+ indicates the data in this group are not normal, but they have met the homogeneity factor.− indicates that data in this group are normal, but the homogeneity factor has not been met.
4. Conclusions
This paper finds evidence which indicates that the number of the prosthetic lower-limbs which an athlete uses in their competition and also the nature of the event (T42, T44) are two key elements which can affect the results of track running events to a degree. The results also confirm that as the length of competition increases, the number of the prosthetic lower-limbs which athletes use can make a significant difference in their competition time. Also, an amputees race category, can make a difference. The statistical results in this paper do not support the argument that any particular athlete with two prosthetic lower-limbs had results which are significantly different from others in the T44 category at the 2012 London Paralympic games.
Finally, it can be concluded that the athletes who use two prosthetic lower-limb do have an advantage in comparison to the others- especially in long run competitions. Also, the athletes who competed in T44 classification reported a better performance in comparison to T42. According to the results of this paper, the athletes who use two prosthetic lower-limbs with disabilities below their knee have an advantage in running competitions in comparison to other lower-limb amputee-based classifications.
Acknowledgments
The authors thank the reviewers for their thorough review and highly appreciate the comments and suggestions, which significantly contributed to improving the quality of the paper.
Conflicts of Interest
The authors declare no conflict of interest.
References
- Menuz, V.; Hurlimann, T.; Godard, B. Is human enhancement also a matter? Sci. Eng. Ethics 2011, 19, 161–177. [Google Scholar] [CrossRef] [PubMed]
- Simpson, J. No advantage to be an amputee, a defense of Oscar Pistoriuss prostheses. The Atlantic. Available online: http://www.theatlantic.com/entertainment/archive/2012/08/no-advantage-to-being-an-amputee-a-defense-of-oscar-pistoriuss-prostheses/260878 (accessed on 27 November 2013).
- Bruggeman, G.; Arampatzis, A.; Emrich, F.; Potthast, W. Biomechanics of double transtibial amputee sprinting using dedicated sprint prostheses. Sports Technol. 2009, 4, 220–227. [Google Scholar] [CrossRef]
- Weyand, P.; Bundle, M.; McGowan, C.; Grabowski, A.; Brown, M.; Kram, R.; Herr, H. The fastest runner on artificial legs: different limbs, similar function? J. Appl. Physiolb. 2009, 107, 903–911. [Google Scholar] [CrossRef] [PubMed]
- Zettler, P. Is it cheeting to use Cheetahs? The implications of technologically innovative prostheses for sports value and rules. Boston Univ. Int. Law J. 2009, 27, 367–409. [Google Scholar]
- Whaley, M.H.; Brubaker, P.H.; Otto, R.M.; Armstrong, L.E. ACSM’s Guidelines for Exercise Testing and Prescription; Lippincott Williams and Wilkins: Philadelphia, PA, USA, 2006; p. 287. [Google Scholar]
- Hilvoorde, I.; Landeweered, L. Enhancing disabilities: Transhumanism under the veil of inclusion. Disabil. Rehabil. 2010, 32, 2222–2227. [Google Scholar] [CrossRef] [PubMed]
- Nolan, L. Carbon fibre prostheses and running in amputees: A review. Foot Ankle Surg. 2008, 14, 125–129. [Google Scholar] [CrossRef] [PubMed]
- Eveleth, R. Should Oscar Pistoriuss Prosthetic Legs Disqualify Him from the Olympics? Scientific American. Available online: http://www.scientificamerican.com/article.cfm?id=scientists-debate-oscar-pistorius-prosthetic-legs-disqualify-him-olympics (accessed on 27 November 2013).
- Noroozi, S.; Sewell, P.; Abdul Rahman, A.G.; Vinney, J.; Chao, O.Z.; Dyer, B. Performance enhancement of bi-lateral lower-limb amputees in the latter phases of running events: An initial investigation. J. Sports Eng. Technol. 2013, 227, 105–115. [Google Scholar] [CrossRef]
- Noroozi, S.; Sewell, P.; Abdul Rahman, A.G.; Vinney, J.; Chao, O.Z.; Dyer, B. Modal analysis of composite prosthetic energy-storing-and-returning feet: An initial investigation. J. Sports Eng. Technol. 2013, 227, 39–48. [Google Scholar] [CrossRef]
- Wikipedia. T42 (Classification). Available online: http://en.wikipedia.org/wiki/T42- (classification) (accessed on 5 November 2014).
- Paralympic. Available online: http://www.paralympic.org (accessed on 5 November 2014).
- Wikipedia. T44 (Classification). Available online: http://en.wikipedia.org/wiki/T44- (classification) (accessed on 5 November 2014).
- Shapiro, S.S.; Wilk, M.B. An analysis of variance test for normality (complete samples). Biometrika 1965, 52, 591–611. [Google Scholar] [CrossRef]
© 2014 by the authors; licensee MDPI, Basel, Switzerland. This article is an open access article distributed under the terms and conditions of the Creative Commons Attribution license (http://creativecommons.org/licenses/by/4.0/).
