Abstract
Urban crime prevention remains a critical challenge intertwined with socioeconomic disparities. This study investigates the spatial nexus between urban deprivation and crime decline in Chicago from 2015 to 2022, addressing the question: How do changes in neighborhood deprivation relate to crime reduction patterns? Using comprehensive crime incident and census tract Area Deprivation Index (ADI) data, this study conducted exploratory spatial analysis, regression modeling, and local bivariate relationship analysis. The findings reveal persistent hotspots of concentrated deprivation on Chicago’s south and west sides, alongside a general citywide crime decline. However, the current research uncovered significant spatial heterogeneity in both deprivation patterns and crime reduction, challenging the achievement of equitable public safety outcomes. Surprisingly, while crime incidents in 2015 and 2022 significantly predicted crime change, ADI scores were not statistically significant predictors in our regression model. Local bivariate analysis exposed diverse relationships between ADI changes and crime rate changes across neighborhoods, with 72.2% of census tracts showing no statistically significant relationship. This underscores the complexity of urban crime dynamics and the importance of local context in understanding these patterns. Our research contributes a nuanced understanding of the intricate relationship between urban deprivation and crime patterns, providing valuable insights for policymakers, law enforcement agencies, and urban planners. These findings highlight the need for integrated, long-term strategies that address both crime prevention and socioeconomic disparities, ultimately fostering safer, more equitable urban environments and informing evidence-based interventions tailored to specific neighborhood contexts.
1. Introduction
Urban crime remains a critical challenge intertwined with socioeconomic disparities, impacting public safety, quality of life, and sustainable development in cities worldwide. Chicago, a major global city renowned for its diverse neighborhoods and vibrant cultural fabric, has grappled with persistent crime issues despite substantial prevention efforts over recent decades. Crime rates in Chicago have exhibited distinct geographic patterns, often concentrated in economically disadvantaged communities and reflecting broader socio-spatial inequalities [1,2].
The complex relationship between urban crime and socioeconomic factors has been a subject of extensive research. Previous studies have explored links between inequality, concentrated disadvantage, and criminal activity in urban areas [3,4,5,6]. However, comprehensive longitudinal analyses examining the nexus between crime prevention efforts and socioeconomic disparities remain limited, particularly in the context of rapidly evolving urban environments.
The Area Deprivation Index (ADI) provides a comprehensive measure to assess socioeconomic disadvantage at the neighborhood level. Developed by the University of Wisconsin-Madison, the ADI incorporates seventeen socioeconomic indicators derived from the American Community Survey (ACS) 5-year sample at the block group level [7]. These indicators cover various domains such as education, employment, income, housing, household composition, and household resources, offering a multidimensional view of deprivation within a geographic area.
Research on the ADI has highlighted its utility in capturing neighborhood-level disparities and its ability to predict various health and social outcomes. Studies have shown that areas with higher ADI scores are associated with increased risks of adverse health outcomes, including higher rates of chronic diseases, mortality, and poor mental health [7]. Additionally, the ADI has been linked to disparities in access to healthcare services, educational opportunities, and economic resources.
This study aims to address these knowledge gaps by investigating the longitudinal spatial relationships between urban deprivation levels and crime decline in Chicago from 2015 to 2022. It utilizes comprehensive datasets on census tract ADI ranks and geocoded crime incidents, combined with spatial analysis and hypothesis testing. Chicago provides an opportune case study for examining the socio-spatial dimensions of urban crime, given its complex social fabric, industrial past, and diverse neighborhoods [8,9].
Like many cities, Chicago grappled with rising violence in the late 20th century but has seen general crime rate improvements in recent decades, albeit unevenly distributed across communities [10]. However, persistent socio-spatial inequality poses challenges to sustainable urban development goals and spatial justice principles emphasizing equitable access to public safety and resources [11,12]. The disproportionate impacts of crime likely perpetuate marginalization cycles in disadvantaged neighborhoods [13,14,15,16,17].
The conceptual framework for this study draws on theories of spatial justice and environmental criminology. Spatial justice examines geographical inequalities in resource distribution and access to opportunities [12,18]. Environmental criminology, on the other hand, focuses on analyzing crime’s spatial patterns and environmental correlates [19]. By integrating these perspectives, the current study revealed how socioeconomic disparities and urban environments interact to influence crime patterns and prevention efforts.
Recent breakthroughs in geospatial technologies and big data analytics have transformed our capability to analyze and comprehend urban crime patterns on unprecedented scales and with remarkable detail [20,21]. These technological advances enable more detailed explorations of the intricate relationships between socioeconomic factors and criminal activities across various urban settings [22,23]. Additionally, the increasing emphasis on smart cities and data-driven urban management has introduced new possibilities for integrating crime prevention strategies with broader urban development plans [21,24]. This comprehensive approach acknowledges the interconnected nature of urban issues and aims to utilize synergies across different policy areas to build safer and more equitable cities. This holistic approach recognizes the interconnected nature of urban challenges and seeks to leverage synergies between various policy domains to create safer, more equitable cities.
To guide our investigation, this study focuses on two key research questions:
- How have crime patterns and neighborhood deprivation in Chicago evolved over time and space from 2015 to 2022, and what is the relationship between these spatial distributions?
- What are the implications of the observed spatial relationships between urban deprivation and crime patterns for developing evidence-based policies and interventions that promote spatial justice and foster safer, more equitable urban environments?
By addressing these questions, this study aims to generate valuable insights into the socio-spatial dynamics of urban crime and deprivation. The findings from this study have the potential to inform evidence-based policies and interventions that promote spatial justice, address the disproportionate impacts of crime on marginalized communities, and foster safer and more equitable urban environments.
This research contributes to the existing body of knowledge in several ways. First, it provides a comprehensive longitudinal analysis of the relationship between neighborhood deprivation and crime patterns in a major U.S. city, addressing a gap in the literature on long-term trends in these dynamics. Second, by utilizing advanced spatial analysis techniques and the multidimensional ADI measure, it offers a more nuanced understanding of the complex interplay between socioeconomic factors and crime across different urban contexts. Third, the study’s findings can inform targeted interventions and policy recommendations that account for the spatial heterogeneity of urban crime and deprivation.
Moreover, this research aligns with broader global efforts to create sustainable, inclusive cities as outlined in the United Nations Sustainable Development Goals, particularly Goal No. 11: Sustainable Cities and Communities. By examining the spatial dimensions of urban inequality and crime, the study contributes to the ongoing dialogue on how to build resilient urban environments that provide opportunities and security for all residents, regardless of their socioeconomic status or neighborhood.
2. Literature Review
The spatial dynamics of urban crime and its relationship to socioeconomic inequality have been extensively studied using various spatial analysis techniques. This research is grounded in the theoretical frameworks of spatial justice, which examines geographical inequalities, and environmental criminology, which analyzes crime’s spatial patterns and environmental correlates [12,18,25].
Empirical studies have consistently revealed concentrations of crime in socioeconomically disadvantaged neighborhoods across diverse urban settings. Cluster analyses in cities such as Miami, Cincinnati, and Coral Gables have demonstrated this pattern [4,26,27]. These findings underscore the importance of considering neighborhood-level socioeconomic factors when examining crime patterns. Racial segregation has also been identified as a predictor of spatial inequality and violence [28], although the specific relationships between concentrated disadvantage and crime can vary significantly by location.
Several studies have directly tested socio-spatial relationships between inequality and crime. In Chicago, income inequality and social disorganization were found to be predictors of homicide rates [29,30,31]. The COVID-19 pandemic further highlighted the spatial heterogeneity of crime trends, with different communities experiencing divergent patterns [5]. Research in Massachusetts showed that incarceration patterns mapped onto areas of disadvantage and specific demographic characteristics, providing evidence of multidimensional inequality [32]. Even when controlling for spatial factors, race and disadvantage remained associated with violence, emphasizing the importance of geospatial modeling in crime analysis [33].
Researchers have leveraged geospatial methods to model various aspects of urban environments and their relationship to crime. In Little Rock, a neighborhood violent crime predictor was developed, incorporating multiple dimensions of inequality and demonstrating predictive validity [6]. Studies in Los Angeles found that the presence of fringe lenders in poor areas was associated with increased crime rates [34]. In Miami, researchers discovered that neighborhood greenness predicted reduced youth violence, even when controlling for disadvantage [35].
Advanced geospatial techniques have further contributed to disentangling complex relationships between socioeconomic factors and crime. Spatial panel analyses of Chicago homicide rates revealed the temporal dynamics of social disorganization [36]. For southern county homicides, spatial regression techniques were used to isolate the effects of inequality [37]. In Brazil, modeling demonstrated the spatial spillover effects of neighborhood violence and poverty on local homicide rates [38]. Fixed effects spatial modeling in St. Louis revealed localized college spillover effects on violent crime [39].
The consistent correlation between socioeconomic disadvantage and crime rates across various urban settings underscores the necessity for targeted interventions in underprivileged neighborhoods [40]. The variation in crime trends across different areas, particularly during events like the COVID-19 pandemic, highlights the importance of localized crime prevention and analysis strategies [41,42].
Advanced geospatial methods, such as spatial panel analyses and fixed effects modeling, offer valuable insights into the intricate temporal and spatial dynamics between crime and socioeconomic factors [42]. Environmental elements, including neighborhood greenery and the presence of specific businesses, significantly influence local crime patterns, indicating a need for comprehensive urban planning approaches [20,43].
The enduring link between race, socioeconomic disadvantage, and crime, even when accounting for spatial factors, highlights the necessity of addressing systemic inequalities within crime prevention strategies [44,45,46].
Despite these advancements, gaps persist in the literature, particularly regarding longitudinal analyses specifically examining crime prevention and inequality. Additionally, the interplay between deprivation and crime reduction in Chicago requires targeted investigation through geospatial techniques. By addressing these gaps, future research can contribute to a more comprehensive understanding of the relationship between urban deprivation and crime patterns, informing evidence-based policies aimed at reducing inequality and promoting safety in urban environments.
3. Methodology
3.1. Data Sources
This study relies on two primary data sources to investigate the spatial nexus between urban deprivation evolution and crime decline in Chicago from 2015 to 2022:
- Chicago Urban Crime Data: A comprehensive dataset containing geocoded crime incidents in Chicago from 2015 to 2022, obtained from the Chicago Data Portal. This dataset includes detailed information on various crime types, their spatial coordinates (x, y), and temporal attributes (date and time of occurrence). The Chicago Police Department publishes these data periodically through the Chicago Data Portal. The spatial coordinates are measured using latitude and longitude. The dataset includes all reported incidents of crime that occurred in the City of Chicago, excluding data protected under the Illinois Sunshine Laws. As of our study period, it contained over 1 million records. The data are based on crimes reported to the Chicago Police Department, including both arrested and non-arrested incidents.
- Chicago Area Deprivation Index (ADI) data: Developed by the University of Wisconsin-Madison, the ADI incorporates seventeen socioeconomic indicators derived from the American Community Survey (ACS) 5-year sample at the block group level. These indicators cover domains such as education, employment, income, housing, household composition, and household resources. ADI rankings are determined by calculating a composite score based on these indicators, with each census block group receiving a state rank from 1 to 10, where 1 indicates the lowest level of disadvantage and 10 the highest. In Chicago, ADI rankings ranged from 1 to 10 in both 2015 and 2022, reflecting the city’s diverse socioeconomic landscape.
3.2. Data Preprocessing
3.2.1. Crime Data Cleaning
The crime dataset underwent rigorous cleaning to ensure data quality and accuracy. This process involved:
- Removing duplicate entries based on unique incident identifiers
- Handling missing or invalid spatial coordinates by excluding records with null or out-of-bounds coordinates
- Standardizing temporal information to a consistent date–time format
3.2.2. Crime Rate Change Calculation
Crime rate changes between 2015 and 2022 were calculated for each census tract using the following formula:
Crime Rate Change = ((Crime Count 2022/Population 2022) − (Crime Count 2015/Population 2015))/(Crime Count 2015/Population 2015) × 100
This calculation provides a percentage change in crime rates, accounting for population changes over the study period.
3.2.3. ADI Data Processing
ADI data from 2015 to 2022 were processed into a GIS-ready format using ArcGIS Pro 3.1. The block group level data were aggregated to the census tract level using population-weighted averages to ensure consistency with the crime data spatial unit.
3.3. Exploratory Spatial Analysis
3.3.1. Optimized Hotspot Analysis
This research conducted an optimized hotspot analysis using the Getis-Ord Gi* statistic to identify statistically significant clusters of high and low values for both crime rate changes and ADI changes. The Getis-Ord Gi* statistic is calculated as follows:
where:
- is the standardized statistic for tract I;
- is the crime rate in tract j;
- is the mean crime rate;
- s is the standard deviation of crime rates;
- wij is the spatial weight between tracts i and j;
- and n is the total number of tracts.
The optimal distance band for spatial relationships was determined using incremental spatial autocorrelation, which identifies the distance where spatial clustering is most pronounced:
3.3.2. OLS Regression
The current study employed Ordinary Least Squares (OLS) regression to model the relationship between crime changes (dependent variable) and various predictor variables, including ADI scores and crime incidents. The full regression equation is:
where:
Crime Change = β0 + β1(Crime2015) + β2(Crime2022) + β3(ADI2015) + β4(ADI2022) + ε
- β0 is the intercept;
- β1 to β4 are the coefficients for each predictor variable;
- ε is the error term.
The study checked for multicollinearity using Variance Inflation Factors (VIF) and assessed the normality of residuals using the Shapiro–Wilk test.
3.3.3. Local Bivariate Relationships Analysis
A local bivariate relationship analysis was conducted using Geographically Weighted Regression (GWR) to examine the spatial variability in the relationship between changes in Area Deprivation Index (ADI) rankings and crime change rates. The GWR model is expressed as follows:
where:
- represents the coordinates of the ith point in space;
- is the coefficient function for the kth variable at point I;
- are the explanatory variables at point I;
- is the error term.
Local relationships were categorized based on the sign and significance of the local coefficients, applying a 90% confidence level. An adaptive kernel with a minimum of 30 neighbors was used for bandwidth selection to ensure robust local estimates.
3.4. Statistical Analysis
Descriptive statistics (mean, median, standard deviation, minimum, and maximum) were calculated for key variables. This study tested for spatial autocorrelation in crime rates and ADI scores using Global Moran’s I. The significance level for all statistical tests was set at α = 0.05.
To address non-normality in the crime rate change distribution, this research applied a log transformation to this variable before inclusion in the OLS regression model.
3.5. Software and Tools
The following software packages were used for data processing and analysis:
- ArcGIS Pro 3.3.0 for spatial data processing, visualization, and hotspot analysis
- Python 3.8 with pandas and geopandas libraries for data manipulation and geocoding
This methodology combines advanced spatial analysis techniques with robust statistical methods to provide a comprehensive examination of the relationship between urban deprivation and crime patterns in Chicago. By employing both global and local analytical approaches, the current study aims to capture the complex spatial dynamics of these phenomena and provide insights that can inform targeted policy interventions.
4. Results
4.1. Exploratory Spatial Analysis
4.1.1. ADI and Crime Trends
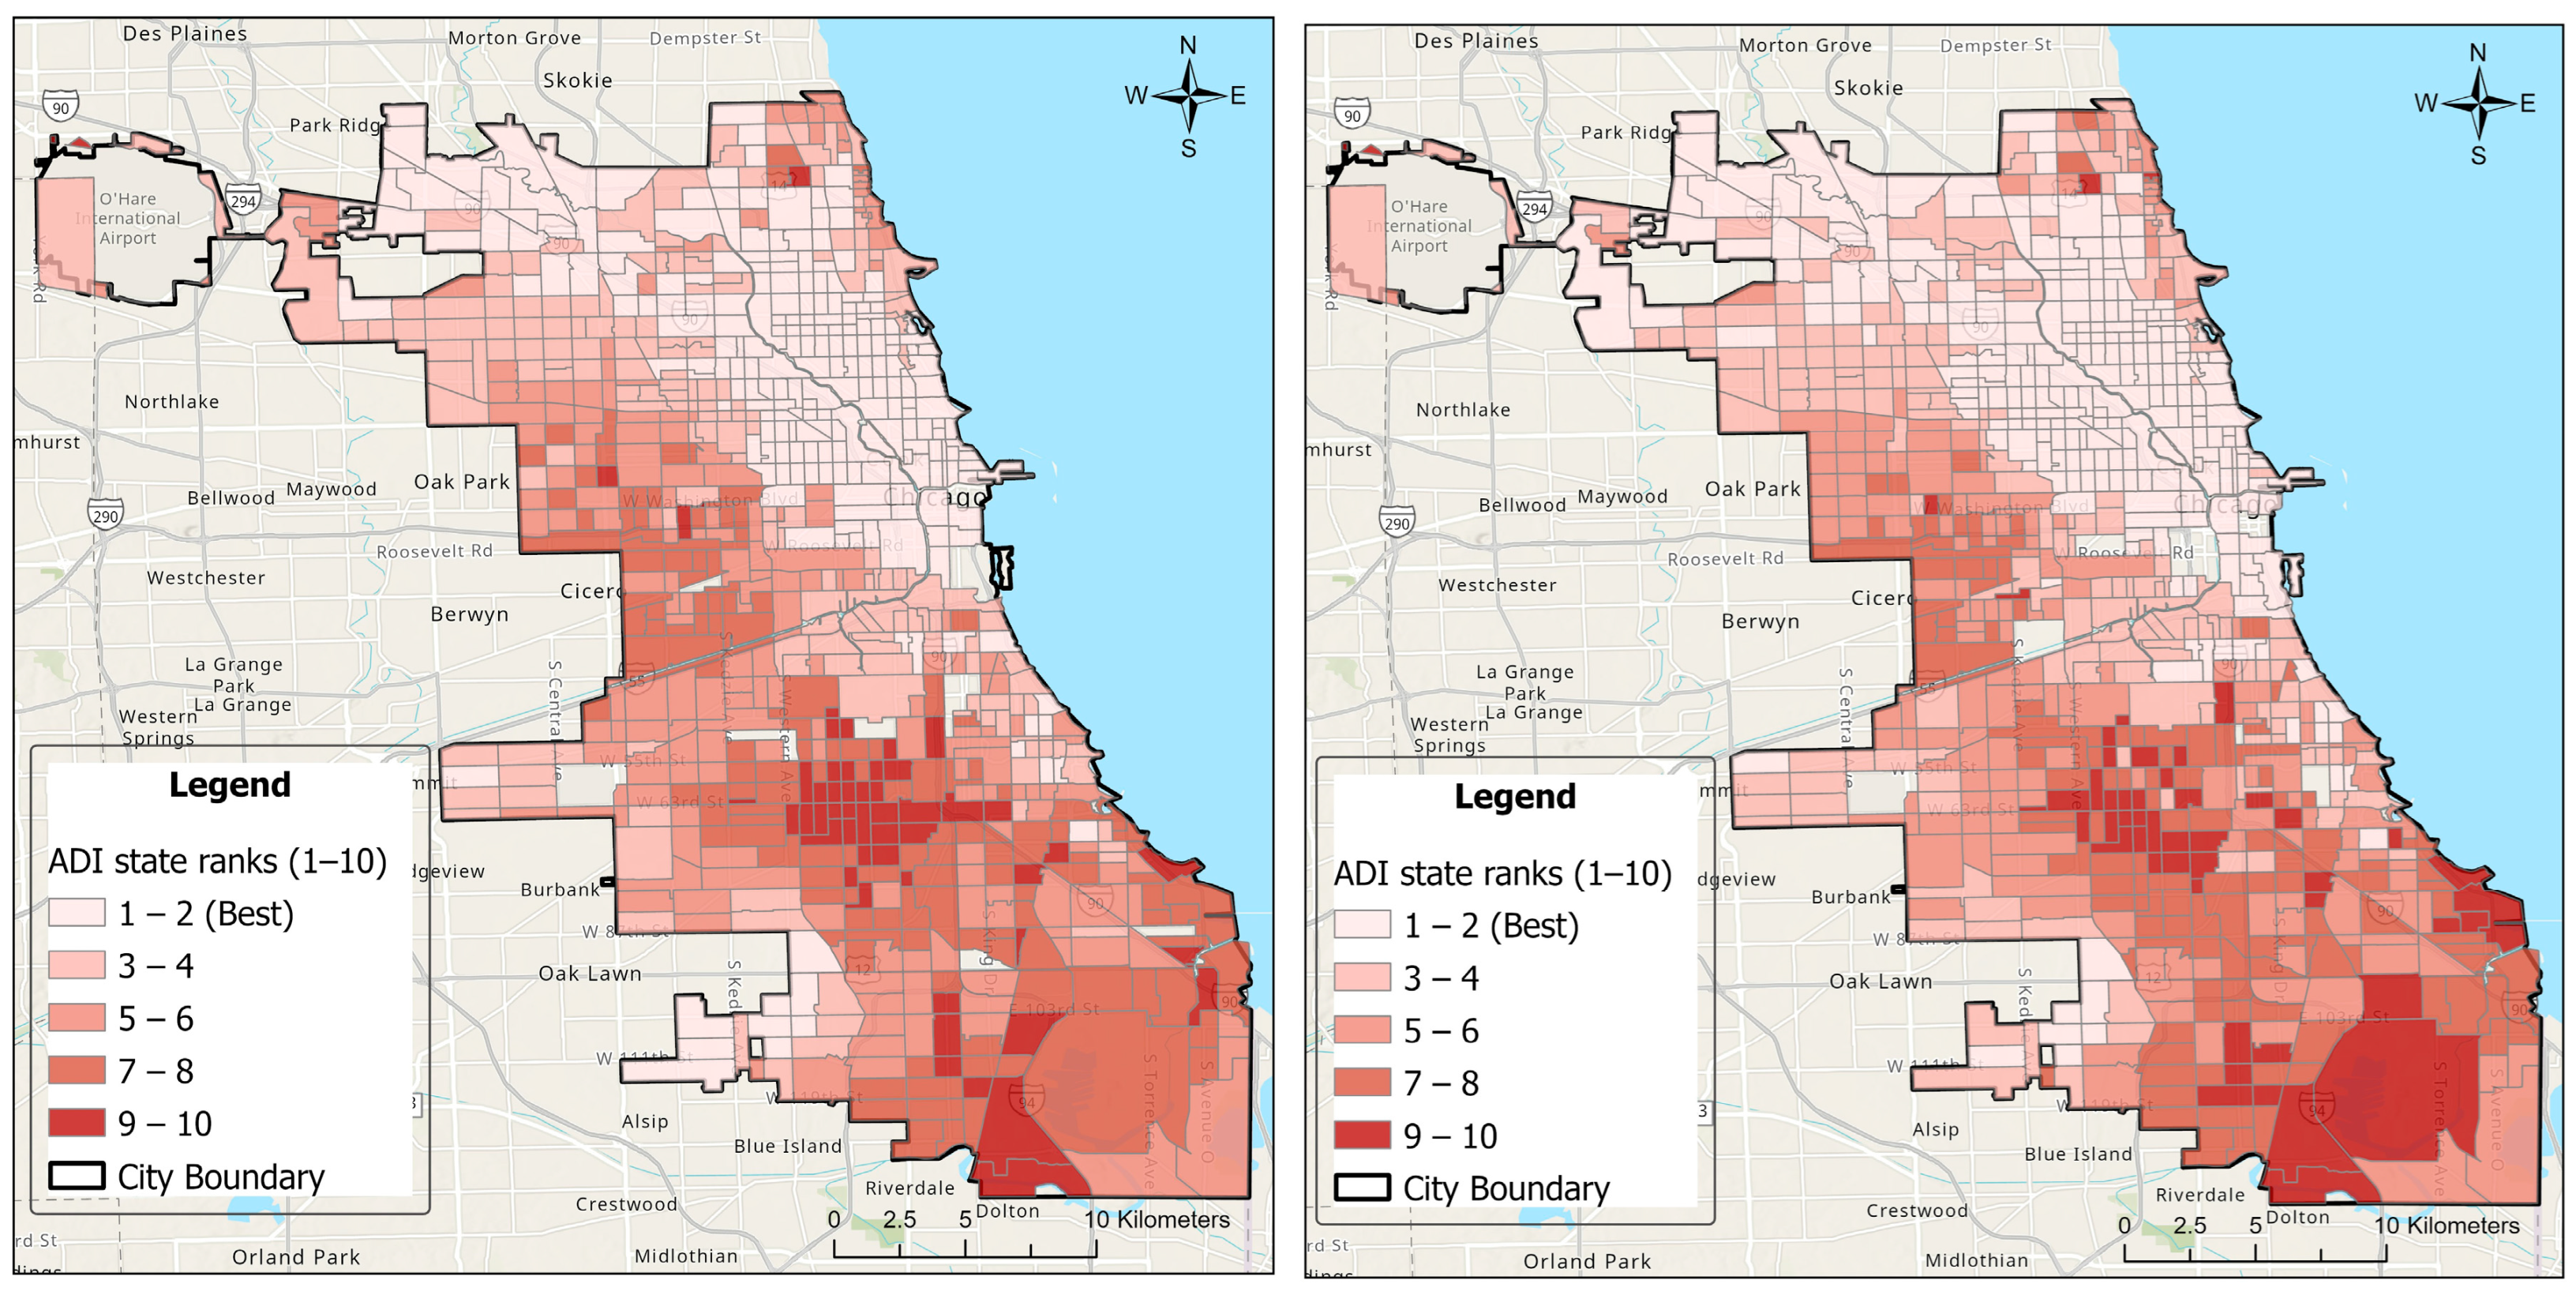
Our analysis of poverty dynamics from 2015 to 2022 revealed relatively stable deprivation patterns across Chicago’s census tracts, informing our subsequent findings. Figure 1 illustrates the spatial distribution of ADI state ranks in 2015 and 2022, highlighting persistent hotspots of concentrated deprivation, particularly on the city’s south and west sides.
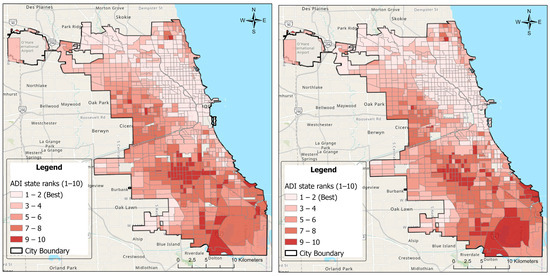
Figure 1.
ADI state rank in Chicago tracts: (Left) 2015, (Right) 2022.
The maps reveal a relatively stable pattern of socioeconomic deprivation over the seven-year period. Both maps exhibit similar spatial distributions of ADI ranks, with persistent hotspots of concentrated deprivation particularly evident on the city’s south and west sides. This stability in deprivation patterns suggests that socioeconomic disparities in Chicago are deeply entrenched and resistant to short-term changes. The consistency between the 2015 and 2022 maps underscores the need for long-term, sustained efforts to address urban inequality and improve socioeconomic conditions in the most disadvantaged neighborhoods.
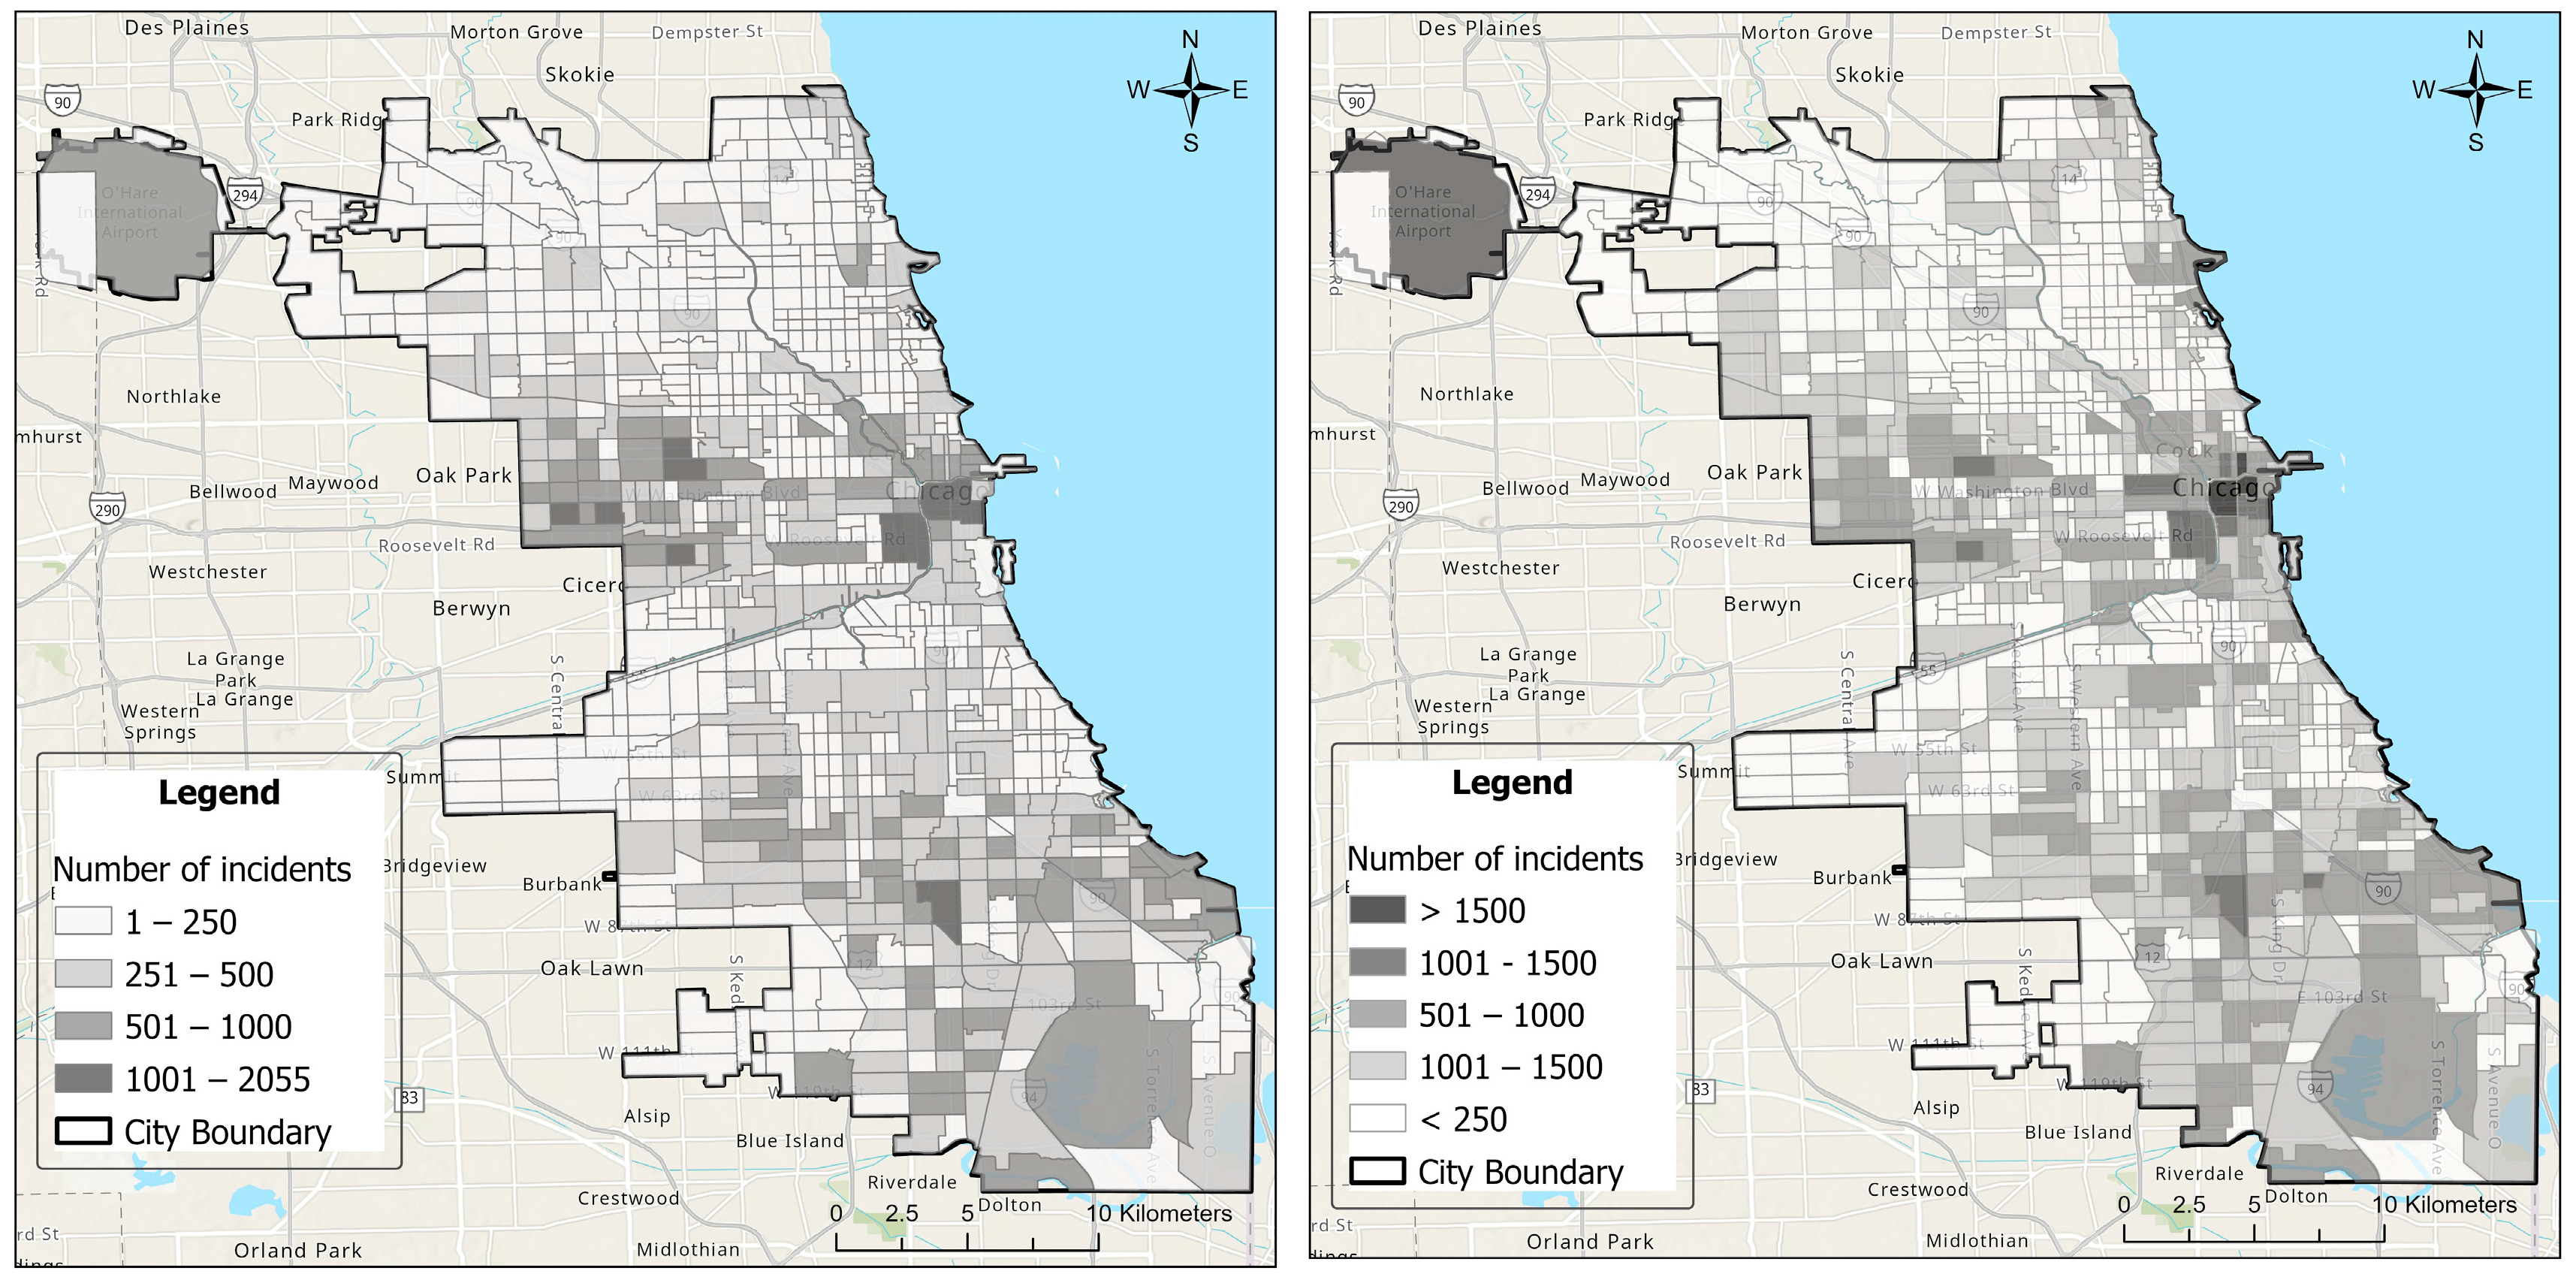
Figure 2 compares the spatial distribution of crime incidents in 2015 and 2022, revealing a general decline in crime rates across the city over the study period.
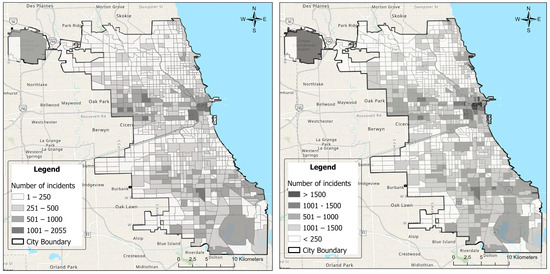
Figure 2.
Spatial distribution of crime incidents in Chicago: (Left) 2015, (Right) 2022.
As shown in Figure 2, the 2015 map shows a higher density and intensity of crime incidents across many areas of the city, particularly in the central and southern regions. In contrast, the 2022 map reveals a general reduction in crime density, with fewer areas exhibiting high concentrations of incidents. This overall decrease in crime incidents aligns with our findings of a general decline in crime rates across Chicago during the study period. However, the maps also highlight that crime reduction has not been uniform across all neighborhoods, with some areas still experiencing higher crime densities in 2022. This spatial variability in crime reduction emphasizes the importance of localized, context-specific approaches to crime prevention and public safety initiatives.
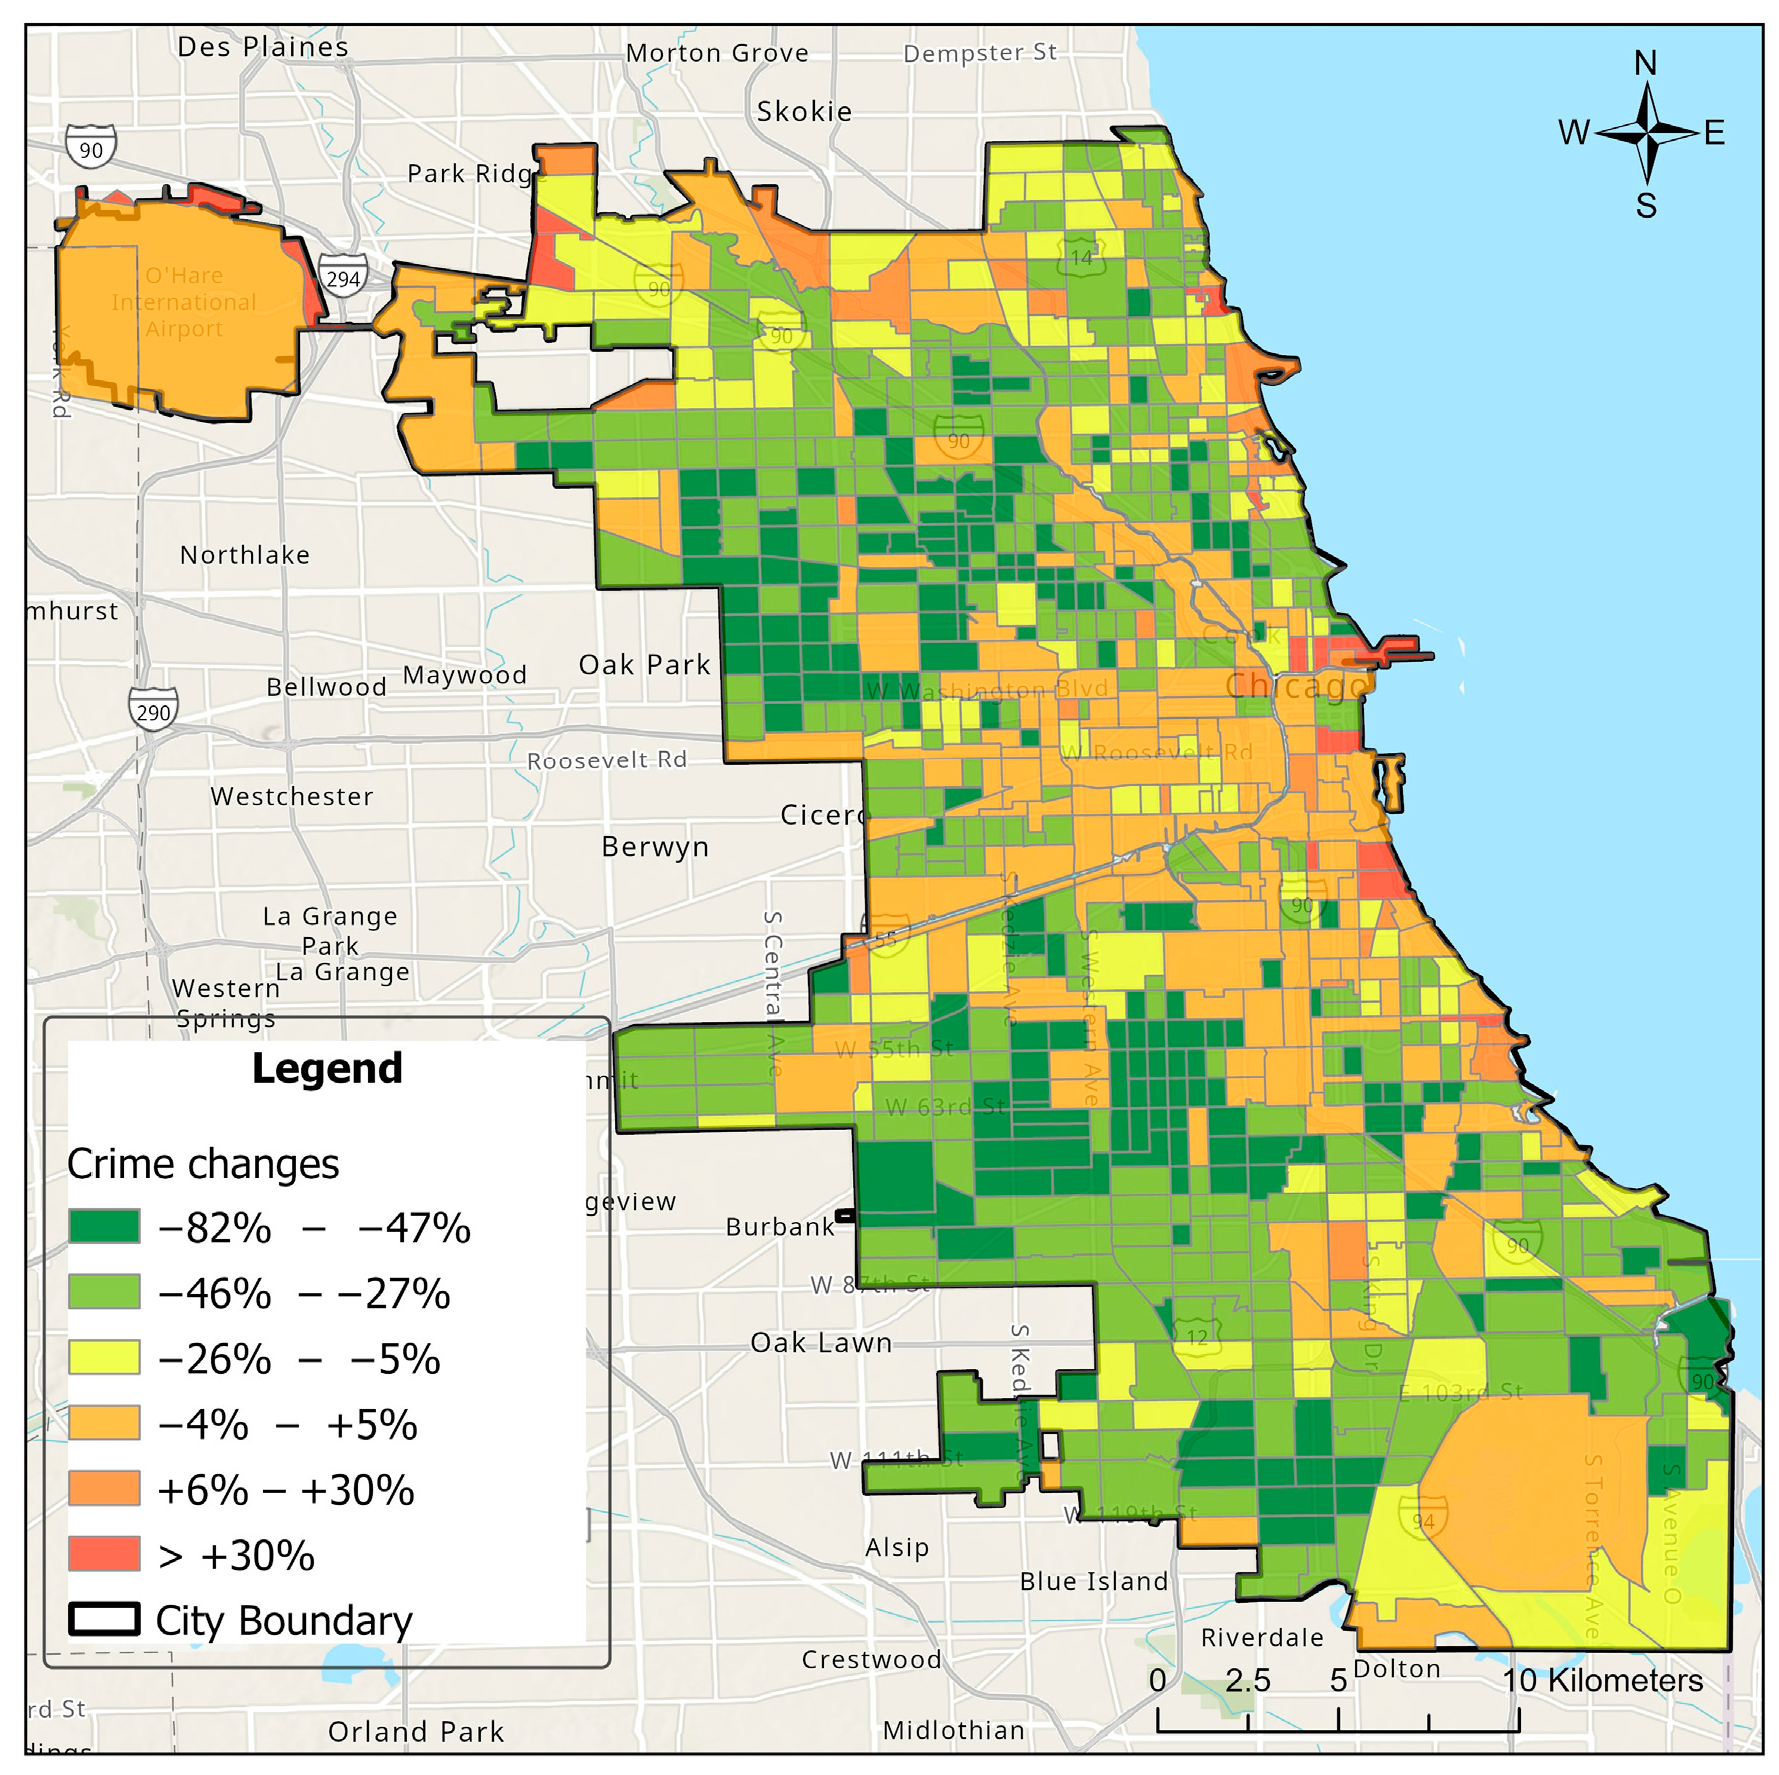
To further examine these trends, this study calculated changes in ADI state ranks (Figure 3) and percent changes in crime incidents (Figure 4) between 2015 and 2022. Figure 3 illustrates the changes in ADI state ranks between 2015 and 2022 across Chicago’s census tracts. The map reveals a complex pattern of socioeconomic shifts throughout the city. The areas in green indicate improvements in ADI ranking (decreasing deprivation), while the red areas represent declining ADI ranks (increasing deprivation). The spatial distribution shows that changes in deprivation levels are not uniform across the city, with some neighborhoods experiencing more significant shifts than others. This heterogeneity in ADI changes underscores the dynamic nature of urban socioeconomic conditions and highlights the importance of spatially targeted interventions to address evolving patterns of disadvantage.
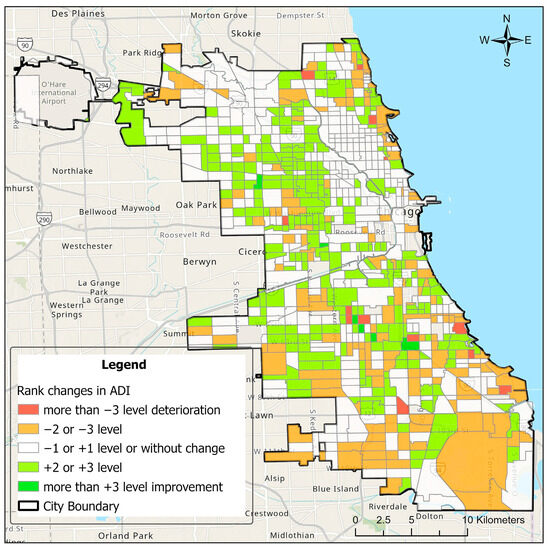
Figure 3.
ADI state rank changes between 2015 and 2022.

Figure 4.
Percent changes in the number of crime incidents between 2015 and 2022.
4.1.2. Hotspot Analysis
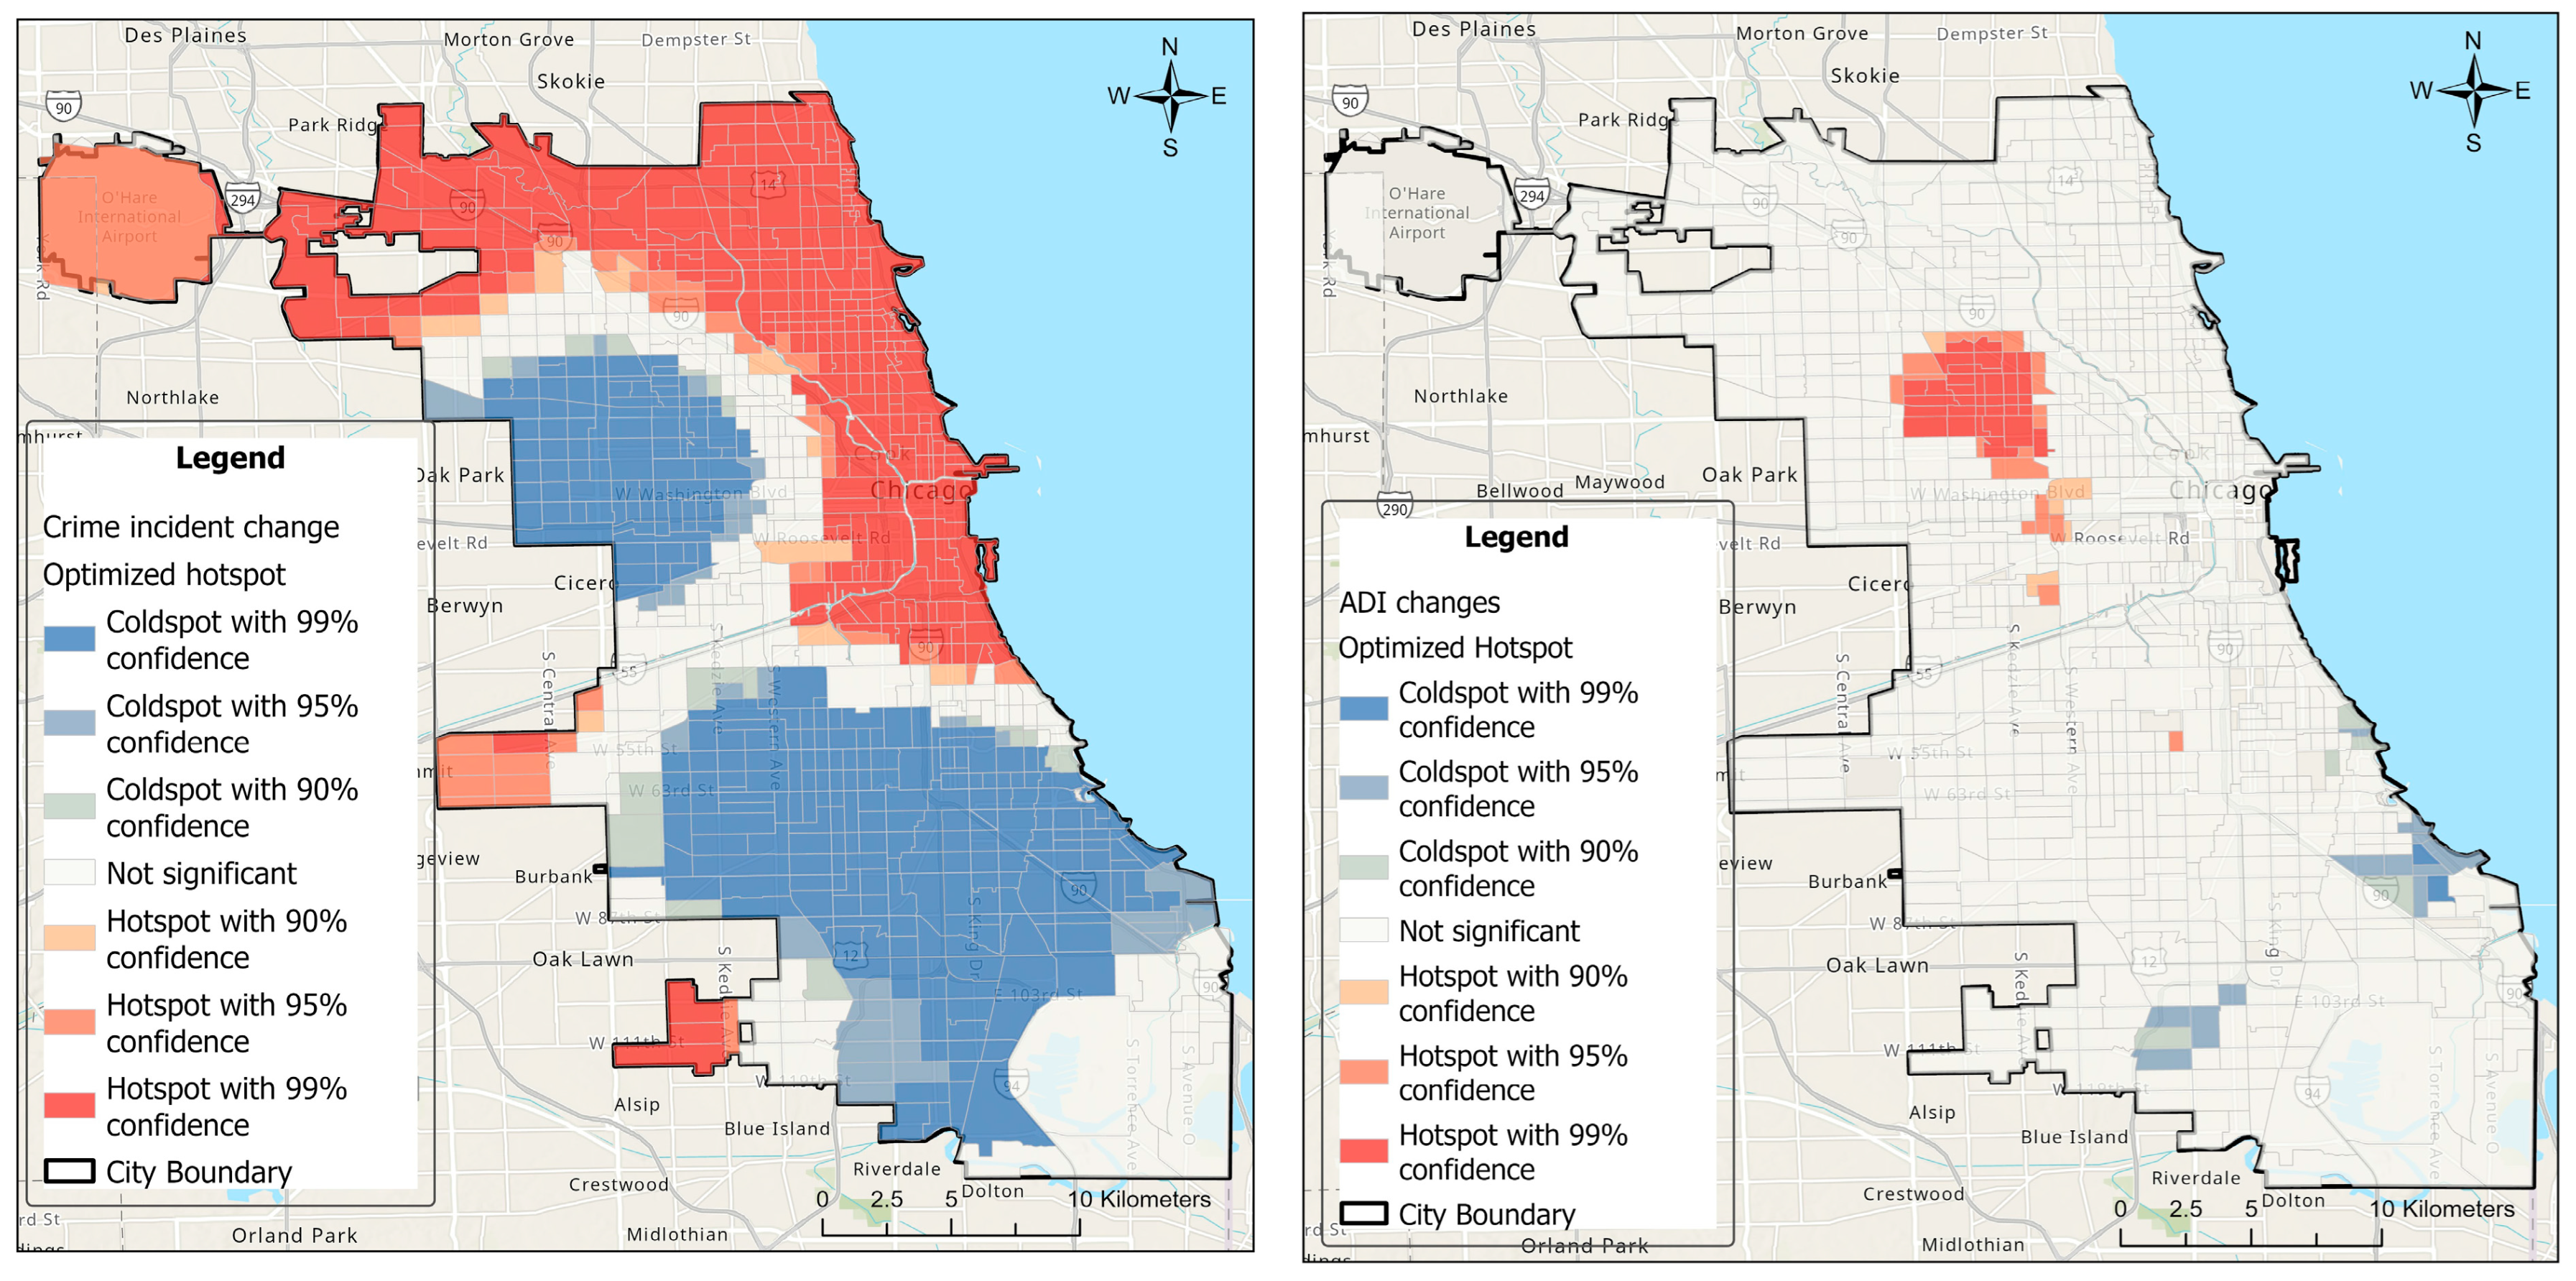
This study conducted optimized hotspot analyses for both crime incident changes and ADI changes between 2015 and 2022 (Figure 5). These maps reveal complex spatial patterns, with crime and ADI increases and decreases occurring in different neighborhoods.

Figure 5.
Crime change hotspot (Left) and ADI change hotspot map (Right) from 2015 to 2022.
Table 1 summarizes the key results from the optimized hotspot analysis.

Table 1.
Summary of the key optimized hotspot analysis results.
Key findings from the hotspot analysis include:
- Statistically significant hotspots and coldspots were identified for both crime rates and ADI changes.
- The optimal distance band for crime rates (7293.7 m) suggests a more dispersed pattern compared to ADI changes (2578.9875 m).
- Crime rate hotspots indicate areas with significant increases in crime, while coldspots represent substantial decreases.
- ADI change hotspots represent areas with increasing socioeconomic disadvantage, while coldspots indicate improving conditions.
- Both analyses highlight substantial variability in trends across Chicago’s neighborhoods.
4.2. OLS Regression Results
An Ordinary Least Squares (OLS) regression was conducted to model the relationship between crime changes and various predictor variables, including ADI scores and crime incidents. Table 2 summarizes the regression results:
Table 2.
Summary of OLS regression results.
Key findings from the OLS regression:
- Crime incidents in 2015 and 2022 were significant predictors of crime change (p < 0.05).
- ADI scores in 2015 and 2022 were not statistically significant predictors (p > 0.05).
- The model explains a relatively small proportion of the variance in crime change (R-squared: 0.069).
- Residual diagnostics suggest potential issues with non-normality and possible multicollinearity.
4.3. Local Bivariate Relationships Analysis
A local bivariate relationship analysis was conducted to explore the association between changes in ADI rankings and crime change rates from 2015 to 2022. In the analysis, various types of relationships between changes in the Area Deprivation Index (ADI) rankings and crime rate changes were identified. A positive linear relationship indicates that improvements in ADI ranking are associated with a decrease in crime rate. Conversely, a negative linear relationship shows that improvements in ADI ranking correlate with an increase in crime rate. Some areas displayed undefined complex dynamics between ADI and crime changes, highlighting intricate interactions. In many neighborhoods, there was no significant association between changes in ADI and crime rates, indicating no clear relationship between the two variables. These findings are summarized in Table 3, which provides detailed statistical insights into the different types of relationships observed in the study.
Table 3.
Local bivariate relationships analysis summary table.
Key findings include:
- 2.
- Out of 869 census tracts, 627 (72.2%) showed no statistically significant relationship between ADI changes and crime rate changes, as detailed in Table 4.
Table 4. Local relationship types and frequency.
- A total of 84 tracts (9.7%) exhibited a positive linear relationship, indicating that improved ADI rankings were associated with decreased crime rates.
- There were 34 tracts (3.9%) showing a negative linear relationship, where improved ADI rankings were associated with increased crime rates.
- Undefined complex relationships were displayed in 92 tracts (10.6%), suggesting more intricate dynamics between ADI and crime changes.
- The entropy results (Min: 0.1, Max: 0.9, Mean: 0.45, Median: 0.4) indicated moderate variability in the strength of local relationships.
- Applying False Discovery Rate (FDR) correction slightly reduced the number of statistically significant relationships detected (from 242 to 220).
These results underscore the complex and spatially heterogeneous nature of the relationship between socioeconomic conditions and crime dynamics in Chicago. The findings highlight the importance of considering local contextual factors when examining these relationships and developing targeted interventions for crime prevention and community development.
5. Discussion
This study investigated the spatial nexus between urban deprivation and crime decline in Chicago from 2015 to 2022, revealing a complex and nuanced relationship between socioeconomic disparities and crime patterns. Our findings highlight the importance of considering spatial dimensions when examining urban crime dynamics, aligning with the growing body of literature emphasizing the role of place in criminological research.
The exploratory spatial analysis revealed persistent hotspots of concentrated deprivation, particularly on Chicago’s south and west sides, corroborating previous research on the city’s socio-spatial inequalities [1]. This spatial clustering of disadvantage underscores the enduring nature of urban inequality and its potential impact on crime patterns. However, it is important to note that our study’s reliance on administrative boundaries (census tracts) may obscure finer-grained patterns of deprivation and crime, a limitation acknowledged in similar studies.
Our analysis showed a general decline in crime rates across Chicago from 2015 to 2022, but with significant spatial variability. This finding is consistent with broader trends of crime reduction in many U.S. cities over recent decades [47,48]. However, the uneven distribution of crime reduction across neighborhoods highlights the persistent challenges in achieving equitable public safety outcomes. This spatial heterogeneity aligns with the observations of Campedelli et al. [5] during the COVID-19 pandemic, suggesting that local contextual factors play a crucial role in shaping crime trends.
Interestingly, our OLS regression results showed that while crime incidents in 2015 and 2022 were significant predictors of crime change, ADI scores were not statistically significant predictors. This finding contrasts with some previous studies that have found strong links between socioeconomic factors and crime rates [29,30,31]. The relatively low explanatory power of our model (R-squared: 0.069) suggests that the relationship between deprivation and crime is more complex than can be captured by a simple linear model. This limitation points to the need for more sophisticated analytical approaches, such as those employed by Boessen et al. [39] using fixed effects spatial modeling.
The local bivariate relationship analysis provided a more nuanced understanding of the spatial variability in the association between ADI changes and crime rate changes. The finding that the majority of census tracts (72.2%) showed no statistically significant relationship between these variables highlights the importance of local context in understanding crime dynamics. This aligns with the principles of environmental criminology, which emphasizes the role of specific environmental factors in shaping crime patterns [19].
The identification of both positive and negative linear relationships between ADI improvements and crime rate changes in different neighborhoods underscores the complexity of these dynamics. In some areas, improvements in socioeconomic conditions were associated with decreased crime rates, supporting theories linking inequality reduction to crime prevention [4]. However, the presence of negative relationships in other areas suggests that the impact of socioeconomic changes on crime is not uniform and may be mediated by other factors not captured in our study, such as social cohesion or collective efficacy [28]. While our current dataset does not include direct measures of these factors, future research could incorporate indicators such as voter turnout rates, community organization participation, or neighborhood watch presence as proxies for social cohesion and collective efficacy, potentially helping to explain some of the unexpected findings in our analysis.
A significant limitation of our study is its reliance on official crime data, which may be subject to reporting biases and may not capture the full extent of criminal activity [49]. Future research could benefit from incorporating alternative data sources, such as victimization surveys, to provide a more comprehensive picture of crime patterns.
Additionally, while our use of the Area Deprivation Index provides a multidimensional measure of neighborhood disadvantage, it may not capture all relevant aspects of socioeconomic conditions that influence crime. Future studies could explore additional indicators or alternative measures of neighborhood disadvantage to provide a more nuanced understanding of these relationships.
Our study’s focus on a single city, while providing depth, limits the generalizability of our findings. Comparative studies across multiple urban contexts could help identify common patterns and city-specific factors influencing crime–deprivation dynamics.
Despite these limitations, our research contributes to the ongoing dialogue on spatial justice and equitable urban development [12]. The persistence of deprivation hotspots and their potential influence on crime patterns underscores the importance of addressing broader issues of resource distribution in urban environments. Future research and policy initiatives should aim to integrate crime prevention strategies with comprehensive approaches to urban inequality, recognizing the complex interplay between socioeconomic conditions, spatial dynamics, and criminal activity.
6. Conclusions
This study has provided a comprehensive spatiotemporal analysis of the relationship between urban deprivation and crime patterns in Chicago from 2015 to 2022. By leveraging extensive datasets on crime incidents and Area Deprivation Index (ADI) rankings, this study has uncovered complex and spatially heterogeneous relationships between socioeconomic disparities and crime dynamics across the city’s neighborhoods.
Our findings reveal persistent hotspots of concentrated deprivation, particularly on Chicago’s south and west sides, alongside a general decline in crime rates over the study period. However, the spatial variability in both deprivation patterns and crime reduction highlights the challenges in achieving equitable public safety outcomes across all communities. The complex relationships between ADI changes and crime rate changes, as demonstrated by our local bivariate analysis, underscore the importance of considering local context when examining urban crime dynamics.
These results have significant implications for urban policy and practice:
- Targeted Interventions: The identification of specific hotspots for both deprivation and crime changes provides valuable information for policymakers and law enforcement agencies. Resources and interventions should be tailored to address the unique challenges faced by different neighborhoods, rather than applying one-size-fits-all approaches. For example, Chicago’s Strategic Decision Support Centers (SDSCs), implemented in high-crime districts, have shown promising results in crime reduction. These centers combine real-time crime analysis, predictive policing, and community engagement. Additionally, the city’s Choose to Change program, which provides mentoring and therapy to at-risk youth in high-crime areas, has demonstrated success in reducing violent crime involvement. Such targeted, data-driven interventions exemplify the approach recommended by our findings.
- Integrated Approach: Given the complex relationships between socioeconomic factors and crime, efforts to improve public safety should be integrated with broader initiatives to address urban inequality. This may include investments in education, job training, affordable housing, and community development programs in areas of concentrated disadvantage.
- Spatial Justice: The persistence of deprivation hotspots underscores the need for a renewed focus on spatial justice in urban planning and policy. Efforts should be made to ensure more equitable distribution of resources and opportunities across all neighborhoods, with particular attention to historically marginalized areas.
- Data-Driven Decision Making: Our study demonstrates the value of fine-grained spatial analysis in understanding urban crime dynamics. Local governments and agencies should invest in robust data collection and analysis capabilities to inform evidence-based policymaking and resource allocation.
While our study provides valuable insights, it also highlights the need for continued research in this area. Future studies could explore additional socioeconomic indicators, examine potential mediating factors, and employ more advanced spatial modeling techniques to further unravel the complex relationships between urban deprivation and crime.
In conclusion, by unveiling the spatial nexus between urban deprivation and crime decline in Chicago, this research contributes to a more nuanced understanding of urban crime dynamics. It provides a foundation for evidence-based policies and interventions aimed at creating safer, more equitable urban environments. As cities continue to grapple with issues of crime and inequality, such spatially informed approaches will be crucial in fostering sustainable, inclusive urban futures.
Author Contributions
Conceptualization, O.M. and M.J.M.T.; methodology, M.J.M.T. and O.M.; software, O.M. and S.S.; validation, S.S., O.M. and E.S.; formal analysis, O.M., S.S. and M.J.M.T.; investigation, S.S., F.M. and E.S.; resources, S.S. and F.M.; data curation, S.S. and O.M.; writing—original draft preparation, O.M., M.J.M.T. and S.S.; writing—review and editing, O.M. and M.J.M.T.; visualization, S.S.; supervision, M.J.M.T.; project administration, O.M. and M.J.M.T.; funding acquisition, M.J.M.T. All authors have read and agreed to the published version of the manuscript.
Funding
This research was funded by the Malaysian Ministry of Higher Education through a Fundamental Research Grant Scheme (FRGS) Grant No. (FRGS/1/2021/SSI02/USM/02/5).
Institutional Review Board Statement
Not applicable.
Informed Consent Statement
Not applicable.
Data Availability Statement
The data presented in this study are available on request from the first author.
Conflicts of Interest
The authors declare no conflicts of interest.
References
- Schnell, C.; DeWitt, S.E.; Spencer, M.D. The Role of Neighborhoods in the Age of Crime Hot Spots: A Multi-Level Theory of the Spatial Distribution of Robbery in Chicago. Crime Delinq. 2022, 00111287221140836. [Google Scholar] [CrossRef]
- Ahmadi, R.; Ghahremani, S.; Kivi, S.B.; Bayat, F.; Zareh, N.; Rohani, A.; Hamidi, R.; Hamidi, N.; Ghamisi, K.; Janianpour, P. Investigating social factors of residential satisfaction and the impact on housing price in spontaneous settlements in tehran fringe. Open Access Libr. J. 2022, 9, 1–21. [Google Scholar] [CrossRef]
- Bevilacqua, C.; Sohrabi, P.; Hamdy, N.; Mangiulli, F. Mapping connections between neighborhoods in response to community-based social needs. Sustainability 2023, 15, 4898. [Google Scholar] [CrossRef]
- Bunting, R.J.; Chang, O.Y.; Cowen, C.; Hankins, R.; Langston, S.; Warner, A.; Yang, X.; Louderback, E.R.; Roy, S.S. Spatial patterns of larceny and aggravated assault in Miami–Dade County, 2007–2015. Prof. Geogr. 2018, 70, 34–46. [Google Scholar] [CrossRef]
- Campedelli, G.M.; Favarin, S.; Aziani, A.; Piquero, A.R. Disentangling community-level changes in crime trends during the COVID-19 pandemic in Chicago. Crime Sci. 2020, 9, 1–18. [Google Scholar] [CrossRef]
- Drawve, G.; Thomas, S.A.; Walker, J.T. Bringing the physical environment back into neighborhood research: The utility of RTM for developing an aggregate neighborhood risk of crime measure. J. Crim. Justice 2016, 44, 21–29. [Google Scholar] [CrossRef]
- University of Wisconsin School of Medicine Public Health. 2015 Area Deprivation Index v2.0. 2015. Available online: https://journals.sagepub.com/doi/abs/10.1177/00111287221140836 (accessed on 3 July 2024).
- Koudela, P. A Chicago-szimbólum története. Polymatheia Művelődés-És Nev. Folyóirat 2020, 17, 53–70. [Google Scholar] [CrossRef]
- Djon, D.; Jhawar, J.; Drumm, K.; Tran, V. A Comparative Analysis of Multiple Methods for Predicting a Specific Type of Crime in the City of Chicago. arXiv 2023, arXiv:2304.13464. [Google Scholar]
- Schreck, C.J.; McGloin, J.M.; Kirk, D.S. On the origins of the violent neighborhood: A study of the nature and predictors of crime-type differentiation across Chicago neighborhoods. Justice Q. 2009, 26, 771–794. [Google Scholar] [CrossRef]
- Galina, G.; Revekka, V. Modern city safety as a complex problem. Boпpocы Гocyдapcтвeннoгo И Мyниципaльнoгo Yпpaвлeния 2017, 83–100. [Google Scholar] [CrossRef]
- Madanipour, A.; Shucksmith, M.; Brooks, E. The concept of spatial justice and the European Union’s territorial cohesion. Eur. Plan. Stud. 2022, 30, 807–824. [Google Scholar] [CrossRef]
- Baker, R.M.; Ahmed, M.; Bertotti, M.; Cassidy, J.; Chipuriro, R.; Clewett, E.; Donaldson, C.; Elders, A.; Fenge, L.A.; Fox, J.; et al. Protocol: Common health assets protocol: A mixed-methods, realist evaluation and economic appraisal of how community-led organisations (CLOs) impact on the health and well-being of people living in deprived areas. BMJ Open 2023, 13, e069979. [Google Scholar] [CrossRef]
- Mansourihanis, O.; Tilaki, M.J.M.; Yousefian, S.; Zaroujtaghi, A. A Computational Geospatial Approach to Assessing Land-Use Compatibility in Urban Planning. Land 2023, 12, 2083. [Google Scholar] [CrossRef]
- Slocum, L.A.; Rengifo, A.F.; Choi, T.; Herrmann, C.R. The elusive relationship between community organizations and crime: An assessment across disadvantaged areas of the South Bronx. Criminology 2013, 51, 167–216. [Google Scholar] [CrossRef]
- Abdullah, A.; Marzbali, M.H.; Tilaki, M.J.M.; Bahauddin, A. Territorial features, disorder and fear of crime in residential neighbourhoods in Malaysia: Testing for multigroup invariance. Glob. Crime 2015, 16, 197–218. [Google Scholar] [CrossRef]
- Abdullah, A.; Marzbali, M.H.; Ramayah, T.; Bahauddin, A.; Tilaki, M.J.M. Territorial functioning and fear of crime: Testing for mediation in structural equation modeling. Secur. J. 2016, 29, 461–484. [Google Scholar] [CrossRef]
- Philippopoulos-Mihalopoulos, A. Spatial justice in the lawscape. In Urban Interstices: The Aesthetics and the Politics of the In-Between; Routledge: London, UK, 2016; pp. 87–102. [Google Scholar]
- Ranaweera, K. An Ecological Bridge for a Criminological Gap: Eight Stages of the Origin and Evolution of Environmental Criminology (from 1800 to 1900). Int. J. Res. Innov. Soc. Sci. 2023, 7, 1295–1305. [Google Scholar] [CrossRef]
- Yu, D.; Fang, C. Urban remote sensing with spatial big data: A review and renewed perspective of urban studies in recent decades. Remote Sens. 2023, 15, 1307. [Google Scholar] [CrossRef]
- Luca, M.; Campedelli, G.M.; Centellegher, S.; Tizzoni, M.; Lepri, B. Crime, inequality and public health: A survey of emerging trends in urban data science. Front. Big Data 2023, 6, 1124526. [Google Scholar] [CrossRef]
- Onyeneke, C.C.; Karam, A.H. An exploratory study of crime: Examining lived experiences of crime through socioeconomic, demographic, and physical characteristics. Urban Sci. 2022, 6, 43. [Google Scholar] [CrossRef]
- De Nadai, M.; Xu, Y.; Letouzé, E.; González, M.C.; Lepri, B. Socio-economic, built environment, and mobility conditions associated with crime: A study of multiple cities. Sci. Rep. 2020, 10, 13871. [Google Scholar] [CrossRef]
- Minardi, R.; Villani, M.L.; De Nicola, A. Semantic reasoning for geolocalized assessment of crime risk in smart cities. Smart Cities 2023, 6, 179–195. [Google Scholar] [CrossRef]
- Wang, S.; Huang, X.; Liu, P.; Zhang, M.; Biljecki, F.; Hu, T.; Fu, X.; Liu, L.; Liu, X.; Wang, R.; et al. Mapping the landscape and roadmap of geospatial artificial intelligence (GeoAI) in quantitative human geography: An extensive systematic review. Int. J. Appl. Earth Obs. Geoinf. 2024, 128, 103734. [Google Scholar] [CrossRef]
- Carter, J.; Louderback, E.R.; Vildosola, D.; Roy, S.S. Crime in an affluent city: Spatial patterns of property crime in Coral Gables, Florida. Eur. J. Crim. Policy Res. 2020, 26, 547–570. [Google Scholar] [CrossRef]
- Choi, J.I.; Lee, J.; Yeh, A.B.; Lan, Q.; Kang, H. Spatial clustering of heroin-related overdose incidents: A case study in Cincinnati, Ohio. BMC Public Health 2022, 22, 1–12. [Google Scholar] [CrossRef]
- Morenoff, J.D.; Sampson, R.J. Violent crime and the spatial dynamics of neighborhood transition: Chicago, 1970–1990. Soc. Forces 1997, 76, 31–64. [Google Scholar] [CrossRef]
- Sacra, S. Domestic Stalking, Violation of Protective Orders, and Homicide in Chicago: The Influence of Social Disorganization and Gender Inequality. 2018. Available online: https://stars.library.ucf.edu/etd/5853?utm_source=stars.library.ucf.edu%2Fetd%2F5853&utm_medium=PDF&utm_campaign=PDFCoverPages (accessed on 3 July 2024).
- Morgan, R.E.; Jasinski, J.L. Tracking violence: Using structural-level characteristics in the analysis of domestic violence in Chicago and the state of Illinois. Crime Delinq. 2017, 63, 391–411. [Google Scholar] [CrossRef]
- Derziotis, I. Critically examine the idea that neighbourhoods characterized by higher levels of ‘social disorganization’are more prone to crime. J. Forensic Sci. Crim. Investig. 2017, 1, 1–5. [Google Scholar]
- Simes, J.T. Place and punishment: The spatial context of mass incarceration. J. Quant. Criminol. 2018, 34, 513–533. [Google Scholar] [CrossRef]
- Light, M.T.; Harris, C.T. Race, space, and violence: Exploring spatial dependence in structural covariates of white and black violent crime in US counties. J. Quant. Criminol. 2012, 28, 559–586. [Google Scholar] [CrossRef]
- Kubrin, C.E.; Hipp, J.R. Do fringe banks create fringe neighborhoods? Examining the spatial relationship between fringe banking and neighborhood crime rates. Justice Q. 2016, 33, 755–784. [Google Scholar] [CrossRef]
- Moise, I.K. Youth and weapons: Patterns, individual and neighborhood correlates of violent crime arrests in Miami-Dade County, Florida. Health Place 2020, 65, 102407. [Google Scholar] [CrossRef]
- Ye, X.; Wu, L. Analyzing the dynamics of homicide patterns in Chicago: ESDA and spatial panel approaches. Appl. Geogr. 2011, 31, 800–807. [Google Scholar] [CrossRef]
- Mencken, F.C.; Barnett, C. Murder, nonnegligent manslaughter, and spatial autocorrelation in mid-south counties. J. Quant. Criminol. 1999, 15, 407–422. [Google Scholar] [CrossRef]
- Ingram, M.C.; Marchesini da Costa, M. A spatial analysis of homicide across Brazil’s municipalities. Homicide Stud. 2017, 21, 87–110. [Google Scholar] [CrossRef]
- Boessen, A.; Omori, M.; Greene, C. Long-Term Dynamics of Neighborhoods and Crime: The Role of Education over 40 Years. J. Quant. Criminol. 2021, 1–63. [Google Scholar] [CrossRef]
- Qin, X. Correlation between fine-grained neighborhood socioeconomic status distribution and crime rates in New York city based on machine learning. In Proceedings of the 3rd International Conference on Signal Processing and Machine Learning, Oxford, UK, 25 February 2023; EWA Publishing: Oxford, UK; Volume 31. [Google Scholar]
- Zhang, W.; Ning, K. Spatiotemporal heterogeneities in the causal effects of mobility intervention policies during the COVID-19 outbreak: A spatially interrupted time-series (SITS) analysis. Ann. Am. Assoc. Geogr. 2023, 113, 1112–1134. [Google Scholar] [CrossRef]
- Jiang, X.; Zheng, Z.; Zheng, Y.; Mao, Z. Spatiotemporal distribution and influencing factors of theft during the pre-COVID-19 and COVID-19 periods: A case study of Haining City, Zhejiang, China. ISPRS Int. J. Geo-Inf. 2023, 12, 189. [Google Scholar] [CrossRef]
- Sun, L.; Zhang, G.; Zhao, D.; Ji, L.; Gu, H.; Sun, L.; Li, X. Explore the correlation between environmental factors and the spatial distribution of property crime. ISPRS Int. J. Geo-Inf. 2022, 11, 428. [Google Scholar] [CrossRef]
- Biglan, A.; Prinz, R.J.; Fishbein, D. Prevention science and health equity: A comprehensive framework for preventing health inequities and disparities associated with race, ethnicity, and social class. Prev. Sci. 2023, 24, 602–612. [Google Scholar] [CrossRef] [PubMed]
- Gobaud, A.N.; Mehranbod, C.A.; Dong, B.; Dodington, J.; Morrison, C.N. Absolute versus relative socioeconomic disadvantage and homicide: A spatial ecological case–control study of US zip codes. Inj. Epidemiol. 2022, 9, 7. [Google Scholar] [CrossRef]
- Korotchenko, S.; Semukhina, O. Crime, space, and race: A spatial analysis of assaults with victim race and residence as predictors. Crime Delinq. 2023. [Google Scholar] [CrossRef]
- Rosenfeld, R. Trends in Street Crime and the Crime Drop. Emerg. Trends Soc. Behav. Sci. Interdiscip. Searchable Linkable Resour. 2015, 1–9. [Google Scholar] [CrossRef]
- Tcherni-Buzzeo, M. The “great American crime decline”: Possible explanations. In Handbook on Crime and Deviance; Springer: New York, NY, USA, 2019; pp. 309–335. [Google Scholar]
- Sohoni, T.W.; Ousey, G.C.; Bower, E.; Mehdi, A. Understanding the gap in self-reported offending by race: A meta-analysis. Am. J. Crim. Justice 2021, 46, 770–792. [Google Scholar] [CrossRef]

Disclaimer/Publisher’s Note: The statements, opinions and data contained in all publications are solely those of the individual author(s) and contributor(s) and not of MDPI and/or the editor(s). MDPI and/or the editor(s) disclaim responsibility for any injury to people or property resulting from any ideas, methods, instructions or products referred to in the content. |
© 2024 by the authors. Licensee MDPI, Basel, Switzerland. This article is an open access article distributed under the terms and conditions of the Creative Commons Attribution (CC BY) license (https://creativecommons.org/licenses/by/4.0/).