1. Introduction
Several materials have been used as a biomaterial, and among these, titanium alloys stand out because they have an excellent mechanical strength/density ratio, good corrosion resistance and biocompatibility [
1]. The mechanical and resistance properties of corrosion and wear of material are dictated mainly by the microstructure [
2]. Titanium alloys are privileged, while a broad spectrum of microstructures can be obtained, depending on chemical composition and processing [
3]. These characteristics make titanium alloys advantageous because they allow obtaining the desired microstructure for specific requirements [
4].
Some elements called β-stabilizers such as niobium, molybdenum, iron, vanadium, nickel, among others, when added to titanium forming alloys, cause a decrease in the β-transus temperature (transition from α phase to β phase), being able to stabilize this phase at room temperature [
5]. The β-transus temperature plays a central role in the evolution of the microstructure. Therefore, it is of great technological importance to determine the type of processing and heat treatments, which also include doping with oxygen or nitrogen, as these elements present in the crystalline lattice can significantly affect their properties [
6].
The nickel element presents several adverse reactions in the body, such as carcinogenic, genotoxic, mutagenic, cytotoxic, and allergic, among others [
7]. However, alloyed to titanium, these problems are minimized [
8]. In a paper on biocorrosion in Hank’s solution at 37 °C with Ti alloys containing 18, 25 and 28.4 wt% Ni, it was concluded that considering a 1 cm
2 screw in area, and the daily nickel release would be hundreds of times lower than that contained in water ingestion. Moreover, the microhardness of these alloys is similar to enamel (310–390 HV), being suitable for use in dental screws [
9]. In another study, on biocompatibility and corrosion of the Ti-Ni-shaped memory alloy with 50.7 at% nickel in Ringer’s solution and 0.9% NaCl solution, the results showed that nickel release in both solutions was negligible compared to daily ingestion. Biocompatibility tests performed with rats’ fibroblast cells showed growth and development of these cells, measured at different times, showing the non-toxic character of this alloy in these environments [
10]. In vivo tests performed on Ti-Ni implants in rabbit, tendons showed biocompatibility like the control material. The membrane that encapsulates the Ti-Ni material presented thickness 35–89 μm and a thickness between 20.3 and 28.7 μm would already be acceptable under these conditions [
11].
The presence of atoms occupying interstitial positions, such as nitrogen and oxygen, strongly influence some properties of the material, such as increased mechanical strength and decreased ductility, besides being stabilizers of the titanium α and α’ phases, reduce the temperature of β-transus [
12,
13]. In the case of the oxygen element, the analysis of the Ti-O system binary phase diagram, it can be observed that the solubility of oxygen in titanium is high at room temperature [
14]. This solution limit means that the formation of oxides in bulk is not foreseen at low concentrations. In a study on Ti-Ni reactions with oxygen where Ti-Ni powders underwent thermal treatments in an oxygen atmosphere, the resulting phases consist of Ti
4Ni
2O, Ni
3Ti, NiTi and the TiO
2 surface [
15]. Ti
4Ni
2O is called the η phase and has a lattice parameter a = 1.13 nm, slightly larger than the Ti
2Ni lattice parameter (1.12 nm). The Ti-Ni-O phase diagram considered in this paper brings an isothermal section at 900 °C and indicates that the η phase (Ti
4Ni
2O) is a solid solution of oxygen in Ti
2Ni [
16]. It also suggests that Ti-Ni alloys have a homogeneous region and about 2.0 at% nickel and can dissolve about 4.0 at% oxygen. In the Ti
2Ni region, the interstitial sites of this compound can dissolve about 14 at% oxygen, where its density grows about 5–6%, and the lattice parameter changes little. In a study on heat treatments of Ti-50, 2Ni (at%) thin films performed in a vacuum of 5 × 10
−3 Pa, the results of X-ray diffraction analyses showed the primary phase B2 (TiNi), in addition to two peaks of precipitate detected, one of them is Ni
3Ti, and the other is Ti
2Ni or Ti
4Ni
2O, in which they present the same diffraction pattern [
17].
Such a precipitate is considered as Ti
4Ni
2O because it reacts quickly with oxygen and whose amount increases according to the increase in temperature that is done in the heat treatment. In treatments made at lower temperatures (550 and 650 °C), both precipitates are dispersed inside the grain and are indistinguishable. In a heat treatment at 750 °C, precipitates are distributed separately. Ti
4Ni
2O particles form along the grain boundaries, and Ni
3Ti are distributed within the grain. This particle distribution is explained as follows: the Ni
3Ti phase forms first in the nickel-rich part of the TiNi matrix (B2) during heat treatment. The formation of Ni
3Ti enriches the titanium content in the TiNi matrix and thus leads to the formation of the Ti
2Ni phase, which reacts quickly with oxygen producing Ti
4Ni
2O [
17]. With the increase in the temperature of the treatment, the diffusion of oxygen in the grain boundaries is higher than inside, and thus the precipitates of Ti
4Ni
2O form along the grain boundaries. The crystal structures of Ti2Ni and Ti4Ni2O phases have been determined from powder specimens. Both unit cells are large face-centered cubic with 96 atoms, and the space group is Fd3m [
18].
In this paper, Ti alloys with different Ni content (5, 10, 15 and 20 wt%) were exposed to an oxygen atmosphere at high temperature for analyzing the influence of interstitial and substitutional oxygen atoms on the structure, microstructure and selected mechanical properties of the Ti-Ni alloys. The alloys present predominantly the α and intermetallic Ti2Ni phases, and the amount of it increases according to the nickel concentration. In the Ti-15Ni and Ti-20Ni alloys, this intermetallic reacted with oxygen forming Ti4Ni2O trioxide. The microstructures varied according to the processing, as well as the microhardness values. Elastic modulus values are slightly above titanium due to the formation of a new intermetallic phase but have not varied significantly with processing and doping with oxygen.
3. Results and Discussion
Table 2 presents the values of the chemical analysis for the determination of the impurities content in the samples obtained by melting titanium and nickel. The quantity of interstitial oxygen in all processing conditions is shown in
Table 3. The solubility limit for oxygen in Nb-Ti alloys has been estimated to be 0.5 wt% [
25].
It is verified that the obtained ingots have adequate nickel proposed stoichiometry and low impurities amount, probably from the precursor metals, because they were not 100% pure. In the Ti-5Ni#1 sample, which suffered the homogenization heat treatment, there is a high amount of oxygen, and this can be attributed to the oxygen present in the inter-grain region, and that may have migrated into the grains. Additionally, at the temperature of 1000 °C, the beta phase, with the bcc crystalline structure, has a smaller packaging factor, facilitating the absorption of oxygen in the interstitial positions [
24]. The results show a large amount of this element in the case of the Ti-10Ni alloy, unlike the Ti-5Ni alloy, obtained in previous processing, whose amount in the samples is negligible [
25]. There are no direct relations between the oxygen and nitrogen quantities, with the temperatures or the oxygen pressures in which doping was performed. The inaccuracy of the measurements may be associated with the fact that the interstitial elements can be accommodated in defects in the crystalline lattice as grain boundaries since the interstitial positions in the crystalline lattice of the alpha phase at room temperature are lower concerning the alpha phase. Another factor is that the Ti
2Ni intermetallic phase reacts quickly with oxygen and can accumulate mainly in the Ti
4Ni
2O phase [
15], as well as nitrogen, resulting in Ti
2NiN
x [
26]. Such concentrations are below the limits of oxygen and nitrogen solubility in titanium and Ti-Ni alloys [
27,
28]. As will be seen in the X-ray diffractograms and micrographs, there is no evidence of TiO
x and Ti
xN formation, with nitrogen and oxygen in solid solution in the alloys.
Figure 1 shows the X-ray diffractograms of all Ti-Ni alloys after the homogenization heat treatment and hot-rolling conformation process, used in this study. In
Figure 2, it can be found the X-ray diffractograms for the Ti-5Ni (part a), Ti-10Ni (part b), Ti-15Ni (part c) and Ti-20Ni (part d) alloys, in the other processing conditions.
Analyzing the X-ray diffractograms for the samples after the homogenization heat treatment, it was observed that the addition of at least 10% in weight of nickel caused the emergence of other phases besides the alpha phase of titanium. There is the appearance of the intermetallic Ti
2Ni or Ti
4Ni
2O phases, which have the same diffraction pattern [
17] and perhaps a small amount of the beta phase since nickel is a beta stabilizing element. However, it cannot be stated with absolute certainty. It is also observed that the higher the amount of nickel is, the amount of the intermetallic Ti
2Ni and/or Ti
4Ni
2O is higher too, seen by the increase in the intensity of the peaks, which are following the phase diagram of this system, applying the lever rule [
26]. Peak displacements can also be observed, which indicates changes in the lattice (a, b and c) and angular (α, β and γ) parameters and differences in their formats, whose asymmetry indicates distortions in the crystalline lattice, due to the different amounts of the substitutable and interstitial elements.
It was comparing the X-ray patterns presented in
Figure 2, the appearance of a small peak referring to the intermetallic Ti
2Ni is observed [
27] due to cooling practically in equilibrium conditions in the condition #1 and persisting in the condition #2, where there was a rapid cooling from a temperature below the eutectoid transformation [
28]. Due to the similarities between the diffractograms, which contain the same peaks and intensity of these, it is concluded that, in the case of alloy with 10% weight by nickel, there were no significant changes in the phases, because the number of interstitial elements may not be enough to provoke them, in the relation of the substitutional element, in the case, nickel. For the samples with 15 wt% of nickel, it is observed that in the case of conditions #2 and #3, there were no significant changes in the phases, because rapid cooling in these cases occurred from 700 °C, the temperature below the transition β + Ti
2Ni → α + Ti
2Ni, which occurs at 765 °C [
28]. However, the conditions #4 and #5 present a lower amount of the intermetallic Ti
2Ni because the rapid cooling occurred from 800 °C, above the transition temperature, not allowing the full occurrence of the β + Ti
2Ni → α + Ti
2Ni reaction, thus, in the β + Ti
2Ni field, the proportion of Ti
2Ni is lower than in the α + Ti
2Ni field [
28]. It can be observed in
Figure 2d, referring to the Ti-20Ni alloy, that occurred the same phenomenology as the Ti-15Ni alloy, under the conditions #2 and #3, there were no significant changes in the phases. Still, in the conditions #4 and #5, there was a decrease in the intermetallic Ti
2Ni and/or Ti
4Ni
2O, for the same reasons presented above.
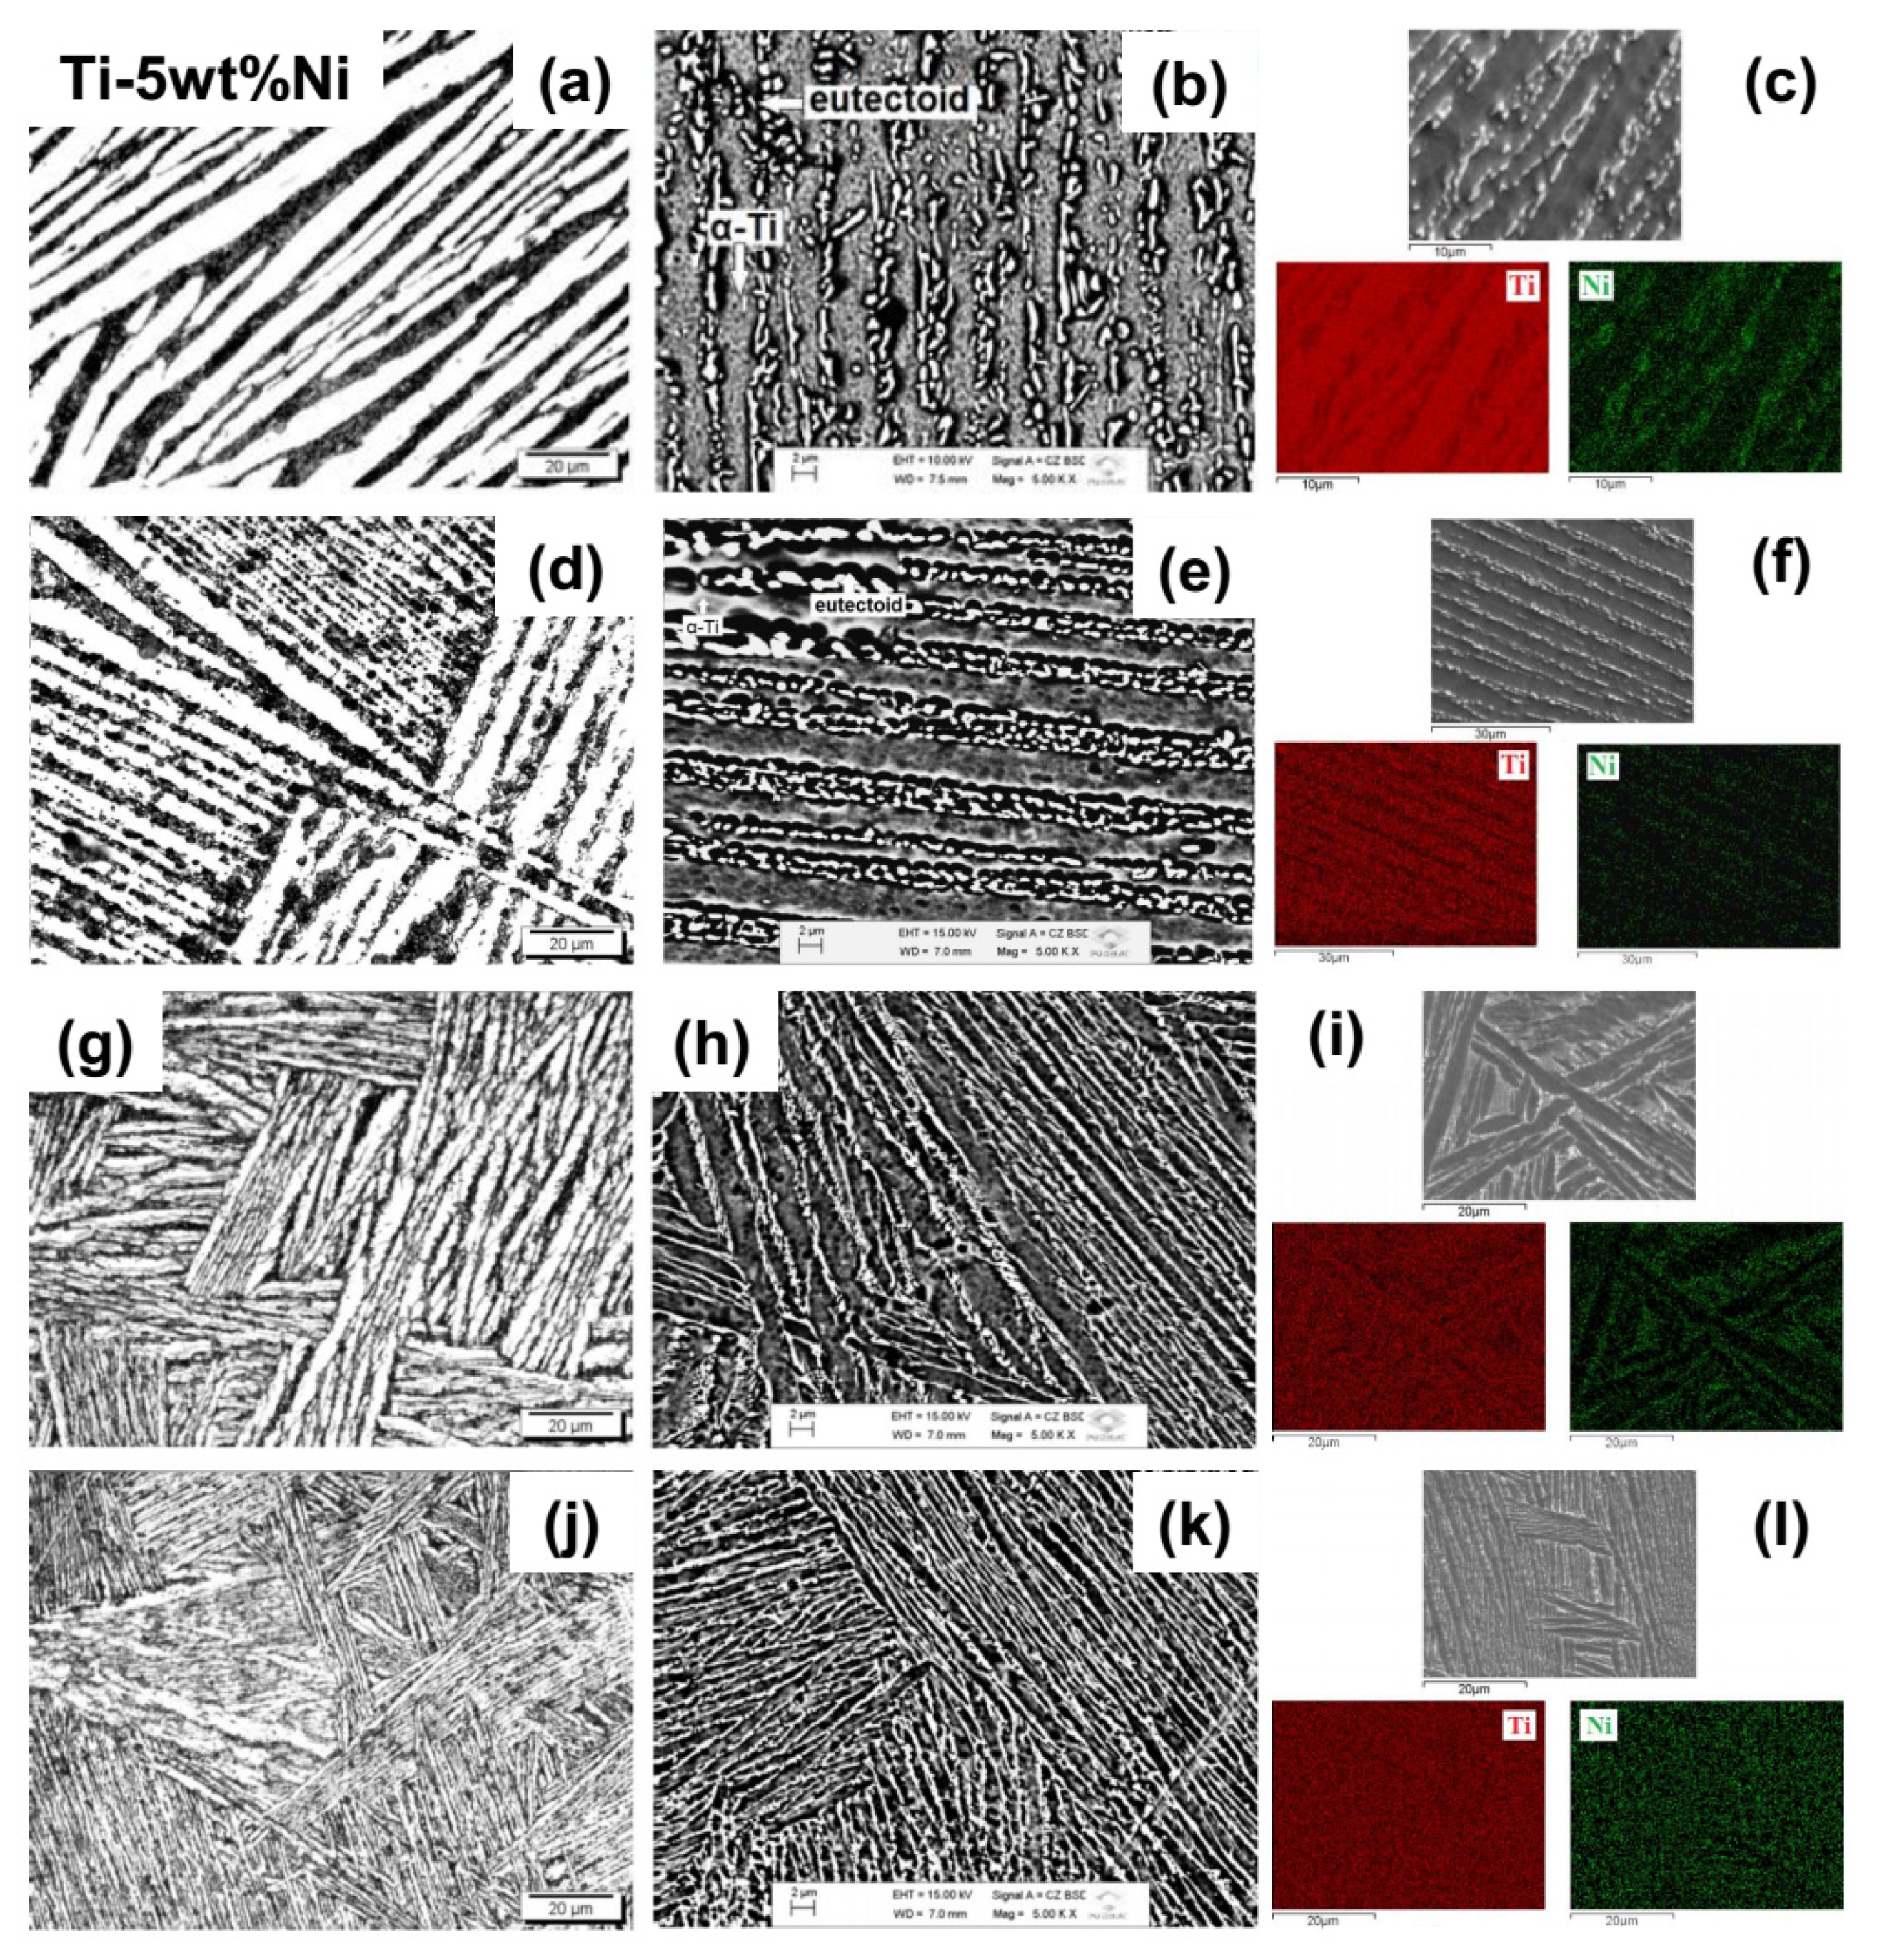
Figure 3 presents optical and scanning electron (backscattered and secondary electrons) micrographs, and EDS mapping, for Ti-5Ni alloy samples, after homogenization heat treatment and after three heat treatments in an oxygen atmosphere, with different values of partial gas pressure, aiming to vary its content in the samples.
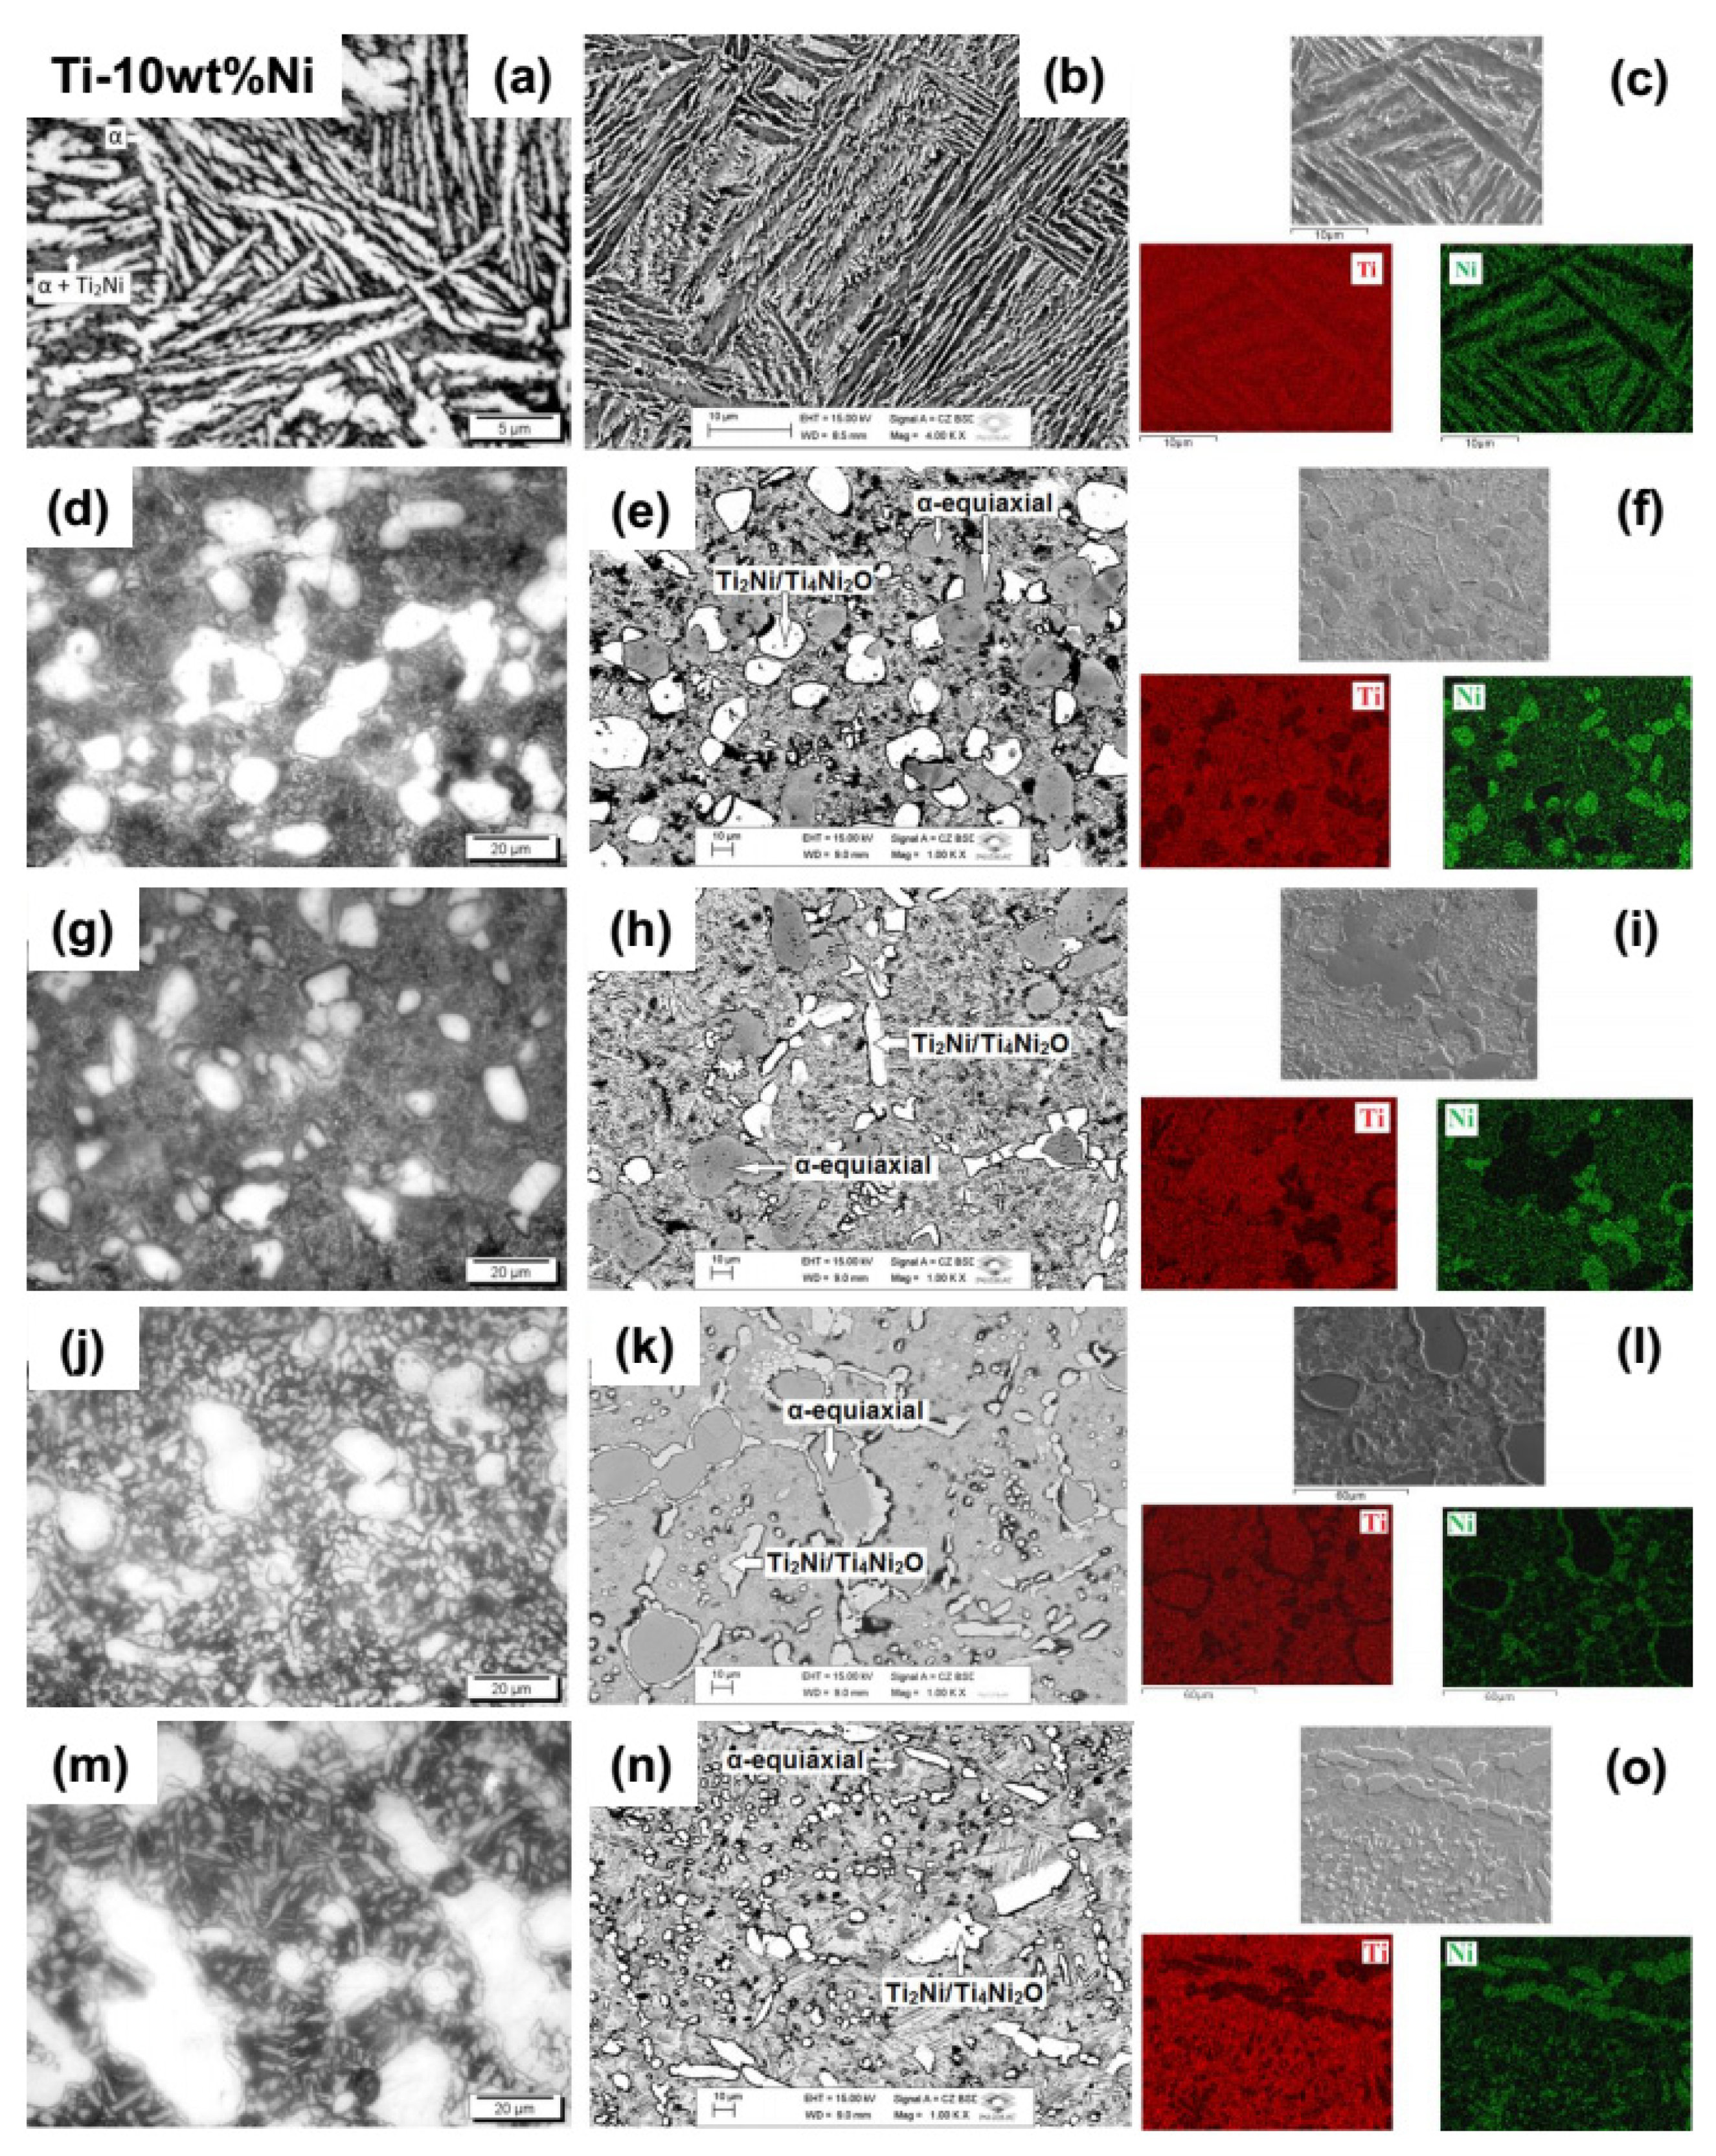
Figure 4 presents optical and scanning electron (backscattered and secondary electrons) micrographs, and EDS mapping, for Ti-10Ni alloy samples, after homogenization heat treatment and after four heat treatments in an oxygen atmosphere, with different values of partial gas pressure, aiming to vary its content in the samples.
It can be observed, through the
Figure 3, corresponding to the Ti-5Ni#1 sample, that the microstructure refers to the α phase of titanium characterized by a set of interlaced lamellae, named Widmanstätten structures, also known as basket-weave structures [
29]. This morphology is more distinct in alloys with higher oxygen and nitrogen contents, where an increase of only 0.3 wt% of oxygen causes its appearance [
30]. However, the dark regions between the α phase lamellae correspond to a eutectoid microstructure characterized by two phases, α and Ti
2Ni alternated with each other. According to the X-ray diffractogram shown in
Figure 2a, there is a small amount of Ti
2Ni intermetallic phase, corroborated by the phase diagram of this system and with works with alloys with this approximate composition [
31,
32]. This fact is verified in micrography using backscattered electrons (
Figure 3b) that presents a higher contrast between regions with different concentrations of chemical elements, due to differences in atomic weights, evidencing a eutectoid microstructure. The images obtained by EDS (
Figure 3c) prove that the distribution of titanium and nickel elements is not homogeneous. The α phase presents a higher amount of titanium than the intermetallic and eutectoid phases.
In the case of the Ti-5Ni#2 sample, which underwent rapid cooling from 700 °C, after heat treatment in an oxygen atmosphere (
Figure 3d), it presents a microstructure similar to the previous one, with a phase lamellae grown and with a not very different size, since this rapid cooling occurs from a temperature below the phase change. The electronic micrograph by backscattered electrons (
Figure 3e) also shows the presence of the eutectoid phase, because the X-ray diffractogram (
Figure 2a) presents a small peak of the intermetallic phase, where the bright regions indicate it. This fact can be observed following the images obtained by EDS (
Figure 3f), where the most nickel-rich region corresponds to the bright regions of secondary electron micrograph and the most titanium-rich region to the darkest regions.
Figure 3d,j show the microstructures of samples that have undergone the doping process with oxygen, samples Ti-5Ni#3 and Ti-5Ni#4, respectively, and display smaller α and α’ lamellar martensitic structures, of Widmanstätten-type, also known as “basket-weave” due to rapid cooling from an above temperature β-transus. The lamellae present in the micrographs of the Ti-5Ni#4 sample are smaller than the Ti5Ni#3 sample. This fact is due to its higher amount of oxygen [
33] since this is a nucleating of the titanium α phase or because the cooling rate is not adequately controlled.
The optical micrographs referring to the Ti-10Ni#1 sample, after undergoing the new heat treatment, carried out at 870 °C, intending to recover the stability of the microstructure, eliminate the stresses of resulting deformations from the hot-rolling process [
34,
35], are shown in
Figure 4a. Although a hyper-eutectoid microstructure was expected, a hypo-eutectoid microstructure was obtained. This fact can be explained by the comparison with commercially pure grade 4 titanium with 0.5 wt% of iron and 0.4 wt% of oxygen, whose β-transus temperature is 950 °C, above the pure titanium β-transus temperature of 882 °C [
36].
Figure 4b shows the contrast between the lamellar region corresponding to the darkest α phase, rich in titanium and the eutectoid microstructure region, composed of alternating granules of the α phase rich in titanium and intermetallic Ti
2Ni, rich in nickel, corresponding to the bright region. In
Figure 4c, images of the mapping of the elements, performed by EDS, presenting nickel as the most abundant element in the bright regions of SEM, obtained using secondary electrons, are presented.
The Ti-10Ni#2 sample, which underwent a doping process followed by rapid cooling from 700 °C, after the annealing heat treatment, has its optical micrographs shown in
Figure 4d, where it is observed that, instead of precipitates of phase α, the sample presents precipitates of Ti
2Ni or Ti
4Ni
2O, which is more likely, due to its reaction with oxygen and the low amount of nickel, in an α predominantly matrix. According to the phase diagram for the Ti-Ni system [
28], this is the planned microstructure. The difference in morphology is due to the type of heat treatment. In the previous cases, the samples were heated from the b field, and in this case, the sample remained for two hours at 700 °C in the α + Ti
2Ni field, and these two phases were in thermodynamic equilibrium. The bright regions with aspects of islands in the images obtained using backscattered electrons (
Figure 4e) characterize the Ti
2Ni/Ti
4Ni
2O phase, in contrast to the eutectoid matrix where there is nickel in smaller quantity. This fact is confirmed in the images obtained by EDS (
Figure 4f), where more intense regions in green constitute such α phase. It is also observed that there are islands of the equiaxial α phase in the regions with a higher concentration of titanium [
37]. This difference in morphology concerning the α lamellar phase is due to the higher nucleation rate in contrast to the higher growth rate of the latter. Oxygen is also an α phase nucleator, so due to its large amount, it caused the formation of these islands of the equiaxial α phase. By the X-ray diffractogram (
Figure 2b), no nitrogen compound was observed in this and other Ti-10Ni samples, concluding that this element must be solubilized, occupying interstitial sites or defects in the crystalline lattice.
Micrographs of the Ti-10Ni#3 sample, obtained by an optical microscope, are shown in
Figure 4g. This sample underwent a heat treatment like the previous sample except for the higher O
2 pressure, which is why the microstructure is similar, only differentiating in size because there is no precise control of the cooling rate. The images obtained show, as in the previous sample, bright Ti
2Ni/Ti
4Ni
2O precipitates in the image by backscattered electrons (
Figure 4h) in a predominantly α darker matrix. The images obtained by EDS (
Figure 4i) corroborate these images, with Ti
2Ni precipitates corresponding to the regions with the highest nickel concentration. A large area of the equiaxial α phase was observed.
In the case of the Ti-10Ni#4 sample that underwent rapid cooling from 850 °C with lower O
2 pressure, the optical micrographs are shown in
Figure 4j. Similarly, the microstructure is composed of precipitates of the α phase predominant matrix, which is also observed by the images obtained by SEM (
Figure 4k). In the matrix were observed regions that comprised of the eutectoid microstructure of a smaller size than the two previous conditions, because the rapid cooling came from a temperature above the β → α phase transformation, which causes a high nucleation rate and low growth. The identification of the phases was more evident in the images obtained by EDS (
Figure 4l), where the most intense regions in green corresponded to the Ti
2Ni/Ti
4Ni
2O precipitates and in the matrix, where there is green, refers to the eutectoid microstructure.
Figure 4m shows the optical micrographs of the Ti-10Ni#5 sample, which underwent rapid cooling from 850 °C with higher oxygen pressure. Similarly, the microstructure was composed of Ti
2Ni/Ti
4Ni
2O precipitates in α phase predominantly matrix, of similar sizes to the previous sample because it underwent the same type of cooling, as seen by the images obtained by SEM (
Figure 4n) and EDS (
Figure 4o).
Figure 5 presents optical and scanning electron (backscattered and secondary electrons) micrographs, and EDS mapping, for Ti-15Ni alloy samples, after homogenization heat treatment and after four heat treatments in an oxygen atmosphere, with different values of partial gas pressure, aiming to vary its content in the samples.
The micrographs of the Ti-15Ni#1 sample, after heat treatment to relieve the stresses arising from the hot rolling process, can be seen in
Figure 5a,b. The two distinct phases, Ti
4Ni
2O and α, can be observed [
9,
38]. In
Figure 5c the mapping obtained by EDS, using secondary electrons, is shown for the titanium and nickel elements, which compose of the alloy. In the case of the Ti-15Ni#2 sample after the first doping with oxygen, the micrographs are shown in
Figure 5d,e, where microstructure similar to the previous sample can be observed, with Ti
4Ni
2O precipitates in an α + Ti
2Ni matrix, consisting of a pearlite microstructure. In
Figure 5f the mapping obtained by EDS is shown, using secondary electrons, of the titanium and nickel elements, which compose of the alloy. In
Figure 5g,h are shown the micrographs of the Ti-15Ni#3 sample, which underwent the same heat treatment concerning the previous sample, but with a higher partial oxygen pressure. In both micrographs, slightly larger lamellae were observed concerning the preceding condition, because in this type of treatment, it is not possible to have accurate control of the cooling rate. However, the sample presents the same microstructure as the previous conditions, precipitated from Ti
4Ni
2O in an α + Ti
2Ni matrix. The mapping of titanium and nickel elements, obtained by EDS using secondary electrons, shown in
Figure 5i, show a higher concentration of nickel in precipitates and titanium in α matrix. Next, in
Figure 5i,j the micrographs of the Ti-15Ni#4 sample, doped now with lower partial oxygen pressure, but treated at 850 °C are shown. It can be observed that among the precipitates of Ti
4Ni
2O, there are lamellar packages typical of the α phase of titanium, which agrees with the X-ray diffractogram for this sample. According to the processing, this sample underwent rapid cooling at a temperature above the eutectoid decomposition, so these lamellar structures suffered little growth. In this composition, it is not possible to form martensitic microstructures, because the line indicative of the beginning of martensitic transformation comprises only of concentrations between 2 and 8 wt% of nickel [
39]. The presence of the titanium equiaxial α phase was observed, as indicated in the micrographs. This same fact occurred with the Ti-10Ni alloy, due to the thermodynamic balance between the α and Ti
2Ni phases for two hours at 850 °C. The micrographs obtained by SEM (
Figure 5k) show that the matrix presents bright and dark alternating regions, evidencing a eutectoid microstructure, which is contrasted with the precipitates of Ti
4Ni
2O, the most colorful area. About the previous condition, this sample presents a lower proportion of the Ti
2Ni intermetallic phase, due to the rapid cooling from the field in which the proportion of this phase is lower, according to the X-ray diffractograms for this sample. The mapping of titanium and nickel elements, obtained by EDS (
Figure 5l), using secondary electrons, corroborate these results. The micrographs of the Ti-15Ni#5 sample, after new doping also at 850 °C, with a partial oxygen pressure higher than the previous one is shown in
Figure 5m,n. Similarly, there are Ti
4Ni
2O precipitates in a matrix with a predominance of phase α, whose lamellar aspect was observed. The microstructure is like the previous sample, apparently with slightly larger lamellae, because the cooling rate was not adequately controlled. In the micrograph obtained by backscattered electrons (
Figure 5n), there is a more significant contrast between the precipitates of Ti
4Ni
2O and the α matrix, which is predominantly darker, without brighter points, evidencing the small amount of Ti
2Ni, which can also be seen in the mapping of titanium and nickel elements, obtained by EDS with secondary electrons, and shown in
Figure 5o.
Figure 6 presents optical and scanning electron (backscattered and secondary electrons) micrographs, and EDS mapping, for Ti-20Ni alloy samples, after homogenization heat treatment and after four heat treatments in an oxygen atmosphere, with different values of partial gas pressure, aiming to vary its content in the samples.
The
Figure 6a–c shows the micrographs of the Ti-20Ni#1 sample in the as-cast condition. Similarly, Ti
4Ni
2O precipitates are observed, in higher quantity concerning the Ti-15Ni alloy, in a matrix α + Ti
2Ni, according to the X-ray diffractograms (shown in
Figure 2d) and phase diagram for this system [
28]. For the Ti-20Ni#2 sample, which underwent a heat treatment for stress relief after the hot-rolling process, the micrographs are shown in
Figure 6d,f. It is observed that, about the previous condition, the microstructures are more extensive due to the large-scale diffusion process and that the amount of Ti
4Ni
2O precipitates is higher, which is following the X-ray diffractograms obtained for the Ti-20Ni alloy in this processing condition and shown in
Figure 2d. The mapping of titanium and nickel elements obtained by EDS (
Figure 6f), using secondary electrons, corroborate the images by backscattered electrons (
Figure 6e), showing a higher amount of nickel in the precipitates.
In the case of the Ti-20Ni#3 sample, after the first doping with oxygen, the micrographs are shown in
Figure 6g,h. It is observed that concerning the previous condition, there was no significant change in the microstructure, neither in the proportion of the phases nor in their sizes. The mapping of titanium and nickel elements, obtained by EDS using secondary electrons, is shown in
Figure 6i, where a higher concentration of nickel can be observed in precipitates and titanium in the α matrix. The micrographs of the Ti-20Ni#4 sample, which underwent a second process of doping with oxygen, are shown in
Figure 6j,k. Before undergoing the doping process, the sample was subjected to a homogenization heat treatment to relieve the stresses of deformation from the conformation, resulting in microstructures of the grown α phase. As the doping process was performed at a temperature lower than the eutectoid decomposition of 765 °C, there was no phase change. Thus, the sample continues with the same anterior microstructure. However, there is the formation of the equiaxial α phase as in the case of the Ti-10Ni alloy, due to the thermodynamic balance between the phases α and Ti
2Ni for two hours at 700 °C. The color contrast between the α structures and the precipitates of Ti
4Ni
2O is observed in the micrograph obtained by SEM (
Figure 6k). However, there are bright points in the matrix showing that it presents the intermetallic Ti
2Ni distributed among the α structures, evidencing a eutectoid microstructure, which can be confirmed in the mapping of titanium and nickel elements, performed by EDS using secondary electrons and shown in
Figure 6l. In this case, some dark regions of the matrix are observed in the titanium mapping, evidencing a higher amount of nickel. Next, the micrographs of the Ti-20Ni#5 sample, which underwent a doping process with oxygen at 850 °C, are shown in
Figure 6m,n. Compared to the previous micrographs, it is observed that the lamellar structures were much smaller. This reduction is because the sample underwent rapid cooling at a temperature higher than the phase change α → α + Ti
2Ni, causing structures out of equilibrium, in addition to a large amount of oxygen.
Figure 6o shows the mapping of titanium and nickel elements obtained by EDS using backscattered electrons. It is observed that the matrix has a uniform color showing that it is formed practically by the α phase. This phase composition happens because rapid cooling suppressed the eutectoid reaction, in addition to a large amount of oxygen, resulting in microstructures out of equilibrium [
20].
Figure 7 shows Vickers microhardness values, and
Figure 8 presents the values of the dynamic elasticity modulus for samples of Ti-Ni alloys, after homogenization heat treatment and after heat treatments in an oxygen atmosphere.
Analyzing
Figure 7, considerable variation of microhardness values can be observed between 250 and 590 HV, without considering the margins of errors. Several factors influence the hardness of a material, the concentration of substitutional and interstitial elements, microstructure, grain size, types of phases, crystallographic orientation in which deformation occurs (since it involves a plastic deformation) and the kind of processing [
40]. The samples of Ti-Ni alloys used in this study show considerable variations of the factors mentioned earlier. It is also observed that the standard deviation was relatively high when compared to single-phase titanium samples. This fact is because the microstructure was heterogeneous, with precipitates α or Ti
2Ni in a eutectoid or α matrix, so the microhardness will vary from the region in which the indentation is made.
Comparing the heat-treated sample with the doped samples, the latter was expected to present higher microhardness in reason to more unstable microstructures due to rapid cooling from high temperatures. However, the amount of oxygen was small, and this did not occur, because even in samples cooled under equilibrium conditions, the eutectoid microstructure was not homogeneous, which increases microhardness. In general, there is no relationship between the interstitial elements (oxygen and nitrogen) and microhardness, because besides not being the only factors involved, they may be accommodated in defects, which would not affect microhardness in the same way as if they were in interstitial positions, deforming the crystalline lattice.
The elastic modulus for commercially pure titanium was around 95–105 GPa [
29]. Thus, the addition of nickel caused a small increase in this property probably by the addition of a new CFC phase referring to the intermetallic Ti
2Ni, as can be seen in
Figure 8. However, there was no proportional relationship of the elastic modulus with the nickel concentration, perhaps because of the role of the interstitials present. Moreover, considering the standard deviations, this variation was not very pronounced.


