Article

Thermal Camber and Temperature Evolution on Work Roll during Aluminum Hot Rolling

by
Evangelos Gavalas
1,2,* and
Spyros Papaefthymiou
2
1
ELKEME S.A., 61st km Athens-Lamia Nat. Road, Oinofyta, 32011 Viotia, Greece
2
Laboratory of Physical Metallurgy, Division of Metallurgy and Materials, School of Mining & Metallurgical Engineering, 9, National Technical University of Athens, Her. Polytechniou str., Zografos, 15780 Athens, Greece
*
Author to whom correspondence should be addressed.
Metals 2020, 10(11), 1434; https://doi.org/10.3390/met10111434
Submission received: 15 September 2020 / Revised: 23 October 2020 / Accepted: 28 October 2020 / Published: 28 October 2020
(This article belongs to the Special Issue Structure-Properties-Processing Relationships in Metallic Materials)

Abstract

:
Flatness is an important quality characteristic for rolled products. Modern hot rolling mills are equipped with actuators that can modify the uneven thickness distribution across the width of the strip (crown), taking into account online measurements of various process parameters such as temperature, force and exit strip profile, either automatically or manually by the operator. However, the crown is also influenced by many parameters that cannot easily be measured during production, such as work roll temperature evolution through thickness and roll geometric variation due to thermal expansion (thermal camber). These have an impact on the strip flatness. In this paper, a thermo-mechanical finite element model on LS-DYNA™ software was utilized to predict the influence of process parameters, and more specifically strip temperature, cooling strategy (application of cooling on the entry or entry and exit side simultaneously) and roll core temperature, on the evolution of roll temperature and thermal camber. The model was initially validated with industrial data. The results indicate that the application of both entry and exit cooling is ~30% more efficient compared to the entry cooling only, thus the thermal camber will be reduced by 2 μm. A hotter roll (380 K) is more stable compared to the cold roll (340 K), showing also an improvement of 2 μm. The hotter roll will also reach a thermal steady state on the surface faster compared to the colder one, without making a significant difference on the steady state temperature. Strip temperature plays a roll in the thermal camber evolution, but it is a less important parameter compared to cooling strategy and roll temperature.

Graphical Abstract

1. Introduction

Aluminum alloys are constantly increasing in terms of their consumption and spectrum of industrial use, with emphasis, amongst others, on the transportation sector, the food industry and construction. A large amount of the materials used in these sectors are strips/sheets that are formed or cut to the final shape using special blanks with very tight tolerances. Such applications require very large amounts of material with strict quality characteristics. One of the most important quality characteristics is the geometric accuracy. The increased requirements for rolled aluminum products with high geometric accuracy and high productivity have triggered many studies related to the effect of the rolling parameters on the strip’s profile.
An important geometric requirement is crown, wherein the thickness varies through the width of the strip. Crown is associated with the roll deflection due to the separating forces developed between the strip and the work rolls, causing the deformed rolls to not create a perfectly rectangular gap, but one that is curved from the top and bottom side (work roll sides) and as a result defining the geometry of the strip [1,2,3,4,5,6,7].
Conventional 4-high rolling mills are equipped with hydraulic systems that allow the bending of the rolls in order to adjust the strip’s crown to the required profile. In the production environment, the bending set point is predetermined and defined during the pass schedule design [1]. Many researchers have utilized analytical and numerical modeling techniques in the effort to predict the work roll bending [1,2,3,4,5,6,7]. Guo (1989) [2] implemented a simple model calculating the work roll bending for each individual schedule. The results were used to classify pass schedules with similar crowns. Sikdarl et al. [3] provided the bending set point for crown control by modeling the roll stack deflection of a hot strip mill. Steinboeck et al. [4] applied nonlinear constitutive equations and a change of coordinates to obtain a time-free formulation to calculate the work roll bending. Fukushima et al. [5] developed an online analytical model, coupled with an FE model that calculated the rolling load distribution, to accurately predict the strip profile. This method enabled the rolling of substantially different products in the same production line. Wang et al. [6] calculated the crown by modeling the process in two steps. The first step was to calculate and predict the rolling force distribution and secondly to use the results as input data in order to calculate the roll deflection. Gavalas et al. [1] implemented an elastic-viscoplastic finite element analysis in order to predict the crown under various rolling conditions for pass schedule strategy allocation. Shigaki et al. [7] predicted roll stack deflection by coupling a commercial FEM model with a multi-slab model for strip deformation. Such approaches have shown good results and are adapted in the real industrial environment in order to either define set points or counteract the effects of variations induced in the process. When these variations become significant, then predictive models have reduced accuracy and the adaptive bending system sometimes either cannot completely correct the crown or it can introduce inhomogeneities in the material.
Work roll thermal camber has a direct influence on profile and is caused by the temperature increase and the presence of temperature gradient due to heat conducted from the hot strip to the roll. Radial thermal expansion differs across the roll width due to axial heat flux towards the roll sides. The result is a greater increase at the center compared to the edges, creating a thermal camber [8]. The thermal camber changes dynamically during production since the thermal state is influenced by many parameters, such as the roll’s core temperature, the strip temperature, the length of the pass, inter-pass time, rolling time since the last work roll replacement, etc.
Many studies focus on the prediction of work roll temperature profile and thermal camber. Tseng et al. [9] developed an analytical solution that predicted the thermal expansion at the roll center plane, and estimated the crown by taking the edge diameter as reference. Sturmer et al. [10] investigated if the combination of models could be replaced with a fast enough 3-D model of the roll shape that can be used online during operation. Jiang et al. [11] derived an online model using differential equations in conjunction with a neural network model to predict the thermal crown in a hot rolling process. Many researchers have studied the thermal crown using the finite difference method (FDM), which is a common numerical method for multidimensional heat transfer problems. Ginzburg et al. [12] developed a simple but efficient model called Coolflex that could be applied in different mill configurations and would analyze the effect of rolling parameters on the thermal profile. Atack et al. [8] incorporated an FDM thermal camber model, whereby spray patterns were the independent variables to determine an optimization program. Lin et al. [13] considered a uniform heat source across the strip width and employed an FDM analysis to compute work roll temperature profile and thermal expansion. Abbaspour et al. [14] used FDM to solve the energy equation in the radial and axial direction, also taking into consideration strip width, time between the passes, strip temperature and thickness reduction. The computational cost of the previous methods is low, but many assumptions have to be considered in the model, limiting the accuracy of the calculation results.
The other recognized modeling method is based on the finite element method (FEM)m and has been widely exploited by many researchers for thermo-mechanical simulations due to the increased quality of the results and the possibility of applying realistic boundary conditions and constraints in complicated models. Guo et al. (2006) [15] analyzed the temperature field and thermal crown of the roll with a simplified finite element method (FEM). Benasciutti et al. [16] and Li et al. [17] proposed an FEM model to calculate the thermal stresses occurring in the work roll due to the non-uniform temperature distribution on the roll surface due to the hot rolling process. Trull et al. [18] developed an FEM model incorporating all major mill components and engineering and process conditions, including thermal camber, for the simulation of shape evolution. Bao et al. [19] investigated the temperature distribution of the work roll, integrating FEM coupled electromagnetic–thermal analysis in order to include the effect of roll induction heating on the surface temperature. Deng et al. [20] developed an analytical FEM model to investigate the thermal and oxidation behavior of an HSS (High Speed Steel) work roll during hot rolling.
In this paper, a thermo-mechanical finite element model on LS-DYNA™ software was designed to study the influence of process parameters, and more specifically strip temperature, cooling unit strategy (entry cooling and entry/exit cooling) and roll average temperature, on the evolution of roll temperature and thermal camber during aluminum hot rolling. Industrially applied rolling parameters were employed for the calculation, and the results can be used as guidance for process optimization in a real production environment.

2. Governing Equations

Thermal boundary loads (heating and cooling) were applied on the rotating roll separated in five main regions, as shown in Figure 1. The roll’s surface temperature increases due to heat flux (   q ˙ strip ) in the contact with the strip, which is hotter compared to the roll during hot rolling. Heat is extracted from the roll due to natural convection and radiation (   q ˙ air ). Stronger cooling (   q ˙ cool ) is the effect of the nozzle sprays and the contact with the support roll (   q ˙ WB ). Between the cooling unit and the hot strip, the coolant flows over the roll, creating different cooling conditions (   q ˙ wet ). For the definition of the heat flux in the deferent zones, each heat transfer coefficient has to be determined and is described below. The value of the heat transfer coefficient of each thermal load was either found in the literature (   q ˙ air ), calculated by typical formulations found in the literature (   q ˙ cool ,   q ˙ WB ,   q ˙ wet ) or calibrated using real production data (   q ˙ strip ).

2.1. Heat Conduction

The basic transient heat conduction equation for cylindrical coordinates and isotropic properties can be written as [12,14,20]:
1 r r ( k wr   r   T r ) + 1 r 2 φ ( k wr   r   T φ ) + z ( k wr   T z )   = ρ   C p   T ( t ) t
where ρ is the density ( g cm 3 ), C p the specific heat capacity ( J kg   K ), T the transient temperature ( K ), t the time (s), r is the radial direction ( m ), φ is the circumferential direction ( m ), z the longitudinal direction, and k wr the thermal conductivity coefficient ( W m   K ). The parameter values are summarized in Table 1. The initial temperature T init was considered homogeneous throughout the roll at the beginning in every case, and can be described by:
T Roll ( r ,   φ ,   m ,   t ) | t = 0   = T init
where T Roll is the roll temperature.

2.2. Boundary Condition for Roll/Strip Contact

The main heat source for the work roll is due to the conduction of heat from the hot strip to the surface of the work roll. The heat flux (   q ˙ Strip ) ( W m 2 ) depends on the temperature difference between the roll and the strip, and in order to have an effective prediction, a boundary heat transfer coefficient ( h strip ) ( W m 2 K ) is assumed [12,14,20]:
  q ˙ strip   = h strip   ( T Strip   T Roll ( t ) )  
The h strip remained constant through each simulation, and was calibrated and validated in a previous work [1] and implicitly includes the phenomena of frictional heat generation (see Table 1). Similarly, the strip temperature was predicted in a previous work and remained constant through each simulation, with a value equal to the average strip surface temperature between the entry and the exit of the roll bite.

2.3. Boundary Condition for Water Jet Cooling

The most efficient cooling zone on the roll is where water from the jet nozzles comes into contact with the high pressure in the roll. The heat flux boundary condition (   q ˙ cool ) ( W m 2 ) that applies to this region is as follows [12,14,20]:
  q ˙ cool   = h cool   ( T Roll ( t )     T coolant )
where h cool is the heat transfer coefficient for the water jet rolling ( W m 2 K ) and T Roll ( t )     T coolant is the transient temperature difference between the roll and the coolant ( K ). The convective heat transfer coefficient, h cool , can be calculated as follows [20]:
h cool   = 6870   W 0.19   P jet 0.27   ( T Roll ( t ) 373   K )
h cool   = 29   10 5   W 0.08   P jet 0.05 T Roll ( t ) 373 100 B T Roll ( t )   T coolant +   6870   W 0.19   P jet 0.27   573 T Roll ( t ) 100 ( T Roll ( t ) > 373   K )
where P jet is the nozzle pressure ( Kg m   s ), W =   V jet A jet   refers to the coolant flow rate per unit area of the coolant on the roll, and B =   ( ( T jet 373 ) 16 ) 0.17 . The parameter values are summarized in Table 1.

2.4. Boundary Condition for Work Roll/Backup Roll Contact

The boundary condition for the heat flow from the contact between the work roll and the backup roll (   q ˙ WB ) was calculated by [12,14,20]:
  q ˙ WB   = h WB   ( T Roll ( t )   T BRoll )
where h WB is the heat transfer coefficient of the contact between the work roll and the backup roll, ( W m 2 K ), and T Roll ( t )   T BRoll is the transient temperature difference between the roll and the backup roll ( K ).
The heat transfer coefficient between the work roll and backup roll ( h WB ) can be calculated as:
h WB =   1.26   k wr π   D W π   α wr L c v wr
where k wr is the work roll thermal conductivity coefficient ( W m   K ), D W is the work roll diameter ( m ), α wr =   k wr ρ   C p   is the work roll thermal diffusivity ( m 2 s ), L c is the contact length between the rolls ( m ) and v wr is the work roll rotational velocity ( m s ). The contact length, L c , was considered equal to the length of the backup roll. The thermal characteristics are summarized in Table 1 and the geometrical in Table 2.

2.5. Boundary Condition for Wet Surface between the Cooling Units and Roll Bite

The roll surface below the cooling units is in contact with coolant flowing over the roll surface under atmospheric pressure. The boundary condition that describes that region is [12,14,20]:
  q ˙ wet   = h wet   ( T Roll ( t )   T coolant )
where h wet is the heat transfer coefficient for the wet surface below the cooling unit ( W m 2 K ) and T Roll ( t )   T coolant is the transient temperature difference between the roll and the coolant ( K ). The h wet can be calculated by [20]:
h wet =   0.023   ( v w   l c μ coolant ) 0.8   Pr 0.4 k coolant l c
where v wr is the work roll rotational velocity ( m s ), l c is the length of the coolant contact area ( m ), μ coolant is the viscosity of the coolant ( Kg m   s ), Pr   is the Prandl number (−) and k coolant is the thermal conductivity coefficient of the coolant ( W m   K ). The length of the coolant contact area was considered to be equal to the work roll length. The parameter values are summarized in Table 1.

2.6. Boundary Condition for Air Cooling

In the region between the cooling units and the work roll, to support roll contact, heat is lost from the surface of the work roll, assuming convection to air and radiation [12,14,20]:
  q ˙ air   = h air   ( T Roll ( t )   T air ) + σ   ε   A   ( T Roll ( t ) 4   T air 4 )
where h air is the heat transfer coefficient of the air ( W m 2 K ), T Roll ( t )   T air the transient temperature difference between the roll and the air ( K ), σ is the Stephan–Boltzmann radiation constant ( kg s 3 K 4 ), A is the area of the emitting body ( m 2 ) and ε is the emissivity of steel. The parameter values are summarized in Table 1.

3. Model Description

A three-dimensional finite element model was designed to study the temperature and thermal camber evolution during the hot rolling process of a 5754 aluminum alloy strip under industrial service conditions, taking into consideration also the heat flux in the longitudinal direction. Thermal camber is the difference in radius between the center of the roll ( R center ) and the position in width where the edge is located ( R edge ), excluding the last 20 mm to avoid edge effects. Camber can be described as:
Camber   =   R center R edge
The direct thermo-mechanical coupling allowed the thermal balance to be achieved in each timestep, and subsequently the thermal expansion to be calculated and each node position updated, resulting in new roll geometry. The simplified form of the description of the thermal expansion equation can be represented in the following form:
Δ L L   = α   Δ T
where α is the coefficient of thermal expansion ( m m   K ), L is length (m) and T is the temperature (K).
For this purpose, a work roll was modeled on LS-DYNA software with a Lagrangian formulation and 3D mesh with an element size of 10 mm close to the surface of the roll where the largest temperature gradients develop. Due to the rolls’ symmetry, the examination of only half of the roll reduced the computational effort without limiting the result quality. The roll was considered elastically deformable, and the geometry and physical properties of the roll [1,14] are shown in Table 2.
The thermal loads described in Section 2 remained constant through each pass. In this study, the effects of strip temperature, roll temperature, rolling speed and cooling unit activation strategy were taken into consideration.

4. Results

A representative snapshot of the temperature gradient on the work roll from a characteristic experiment is illustrated in Figure 2. The red color depicts the highest temperature region on the roll surface while in contact with the high temperature strip. Soon after the roll surface disengages from the strip, it quickly cools down, passing through the cooling units, reaching the same temperature as when in the steady state before the contact with the strip. The width of the thermally affected region is similar to the width of the strip.

4.1. Validation

The model can only be considered reliable after a validation process takes place. Validation can be very difficult in the aggressive industrial environment that also has various limitations. Such an example is the dynamic temperature measurement on the roll surface due to high temperatures, limited space and water/oil mist that limits the accuracy of the measurements. Additionally, the dynamic measurement of the roll diameter during the pass schedule is out of question. Even the static measurement of the roll can be very difficult because the roll has to be removed from the mill, which requires enough time to finally make the measurement unrealistic. The validation was based on the assumption that the variation in the roll geometry is reflected on the final strip geometry evolution, something that can easily and reliably be measured by the rolling mills gauge measurement system. Thus, the difference between the strip crown at the beginning and at the end of a predesigned industrial pass trial was compared with the roll camber difference between the beginning and the end of the same pass. An indicative comparison between the measured crown evolution (Figure 3) and the calculated camber evolution of the same pass (Figure 4) is presented, which has assisted in the validation of the model. The same validation sequence was conducted in several different passes, which were in good agreement regarding accuracy with the presented results, before the model was considered reliable. The result of the original data recording from the online thickness measuring device can be seen in Figure 3. The data refer to a pass with reduction from 6.6 mm to 4.4 mm, with entry temperature of 600 K and exit temperature of 583 K. The average separating force for the pass was 5.8 MN and the speed was 60 rpm. The roll temperature was measured before the pass to be 340 K.
The original data were compared with the simulation result of the same pass. The crown evolution simulation result is illustrated in Figure 4. The first and last 20 m were omitted from each case to avoid any instability and local effects; however, the thermal load on the first 20 m was included in the calculation.
As can be seen in Figure 3, the crown difference between the two reference points was 13 μm, which is in good agreement with the simulated camber evolution, which was calculated to be 12.3 μm for the same pass (Figure 4).

4.2. Analysis of Temperature

For the same validation pass, the temperature evolution is analyzed in Figure 5. It can be observed that although the temperature on the surface (red line) comes into a steady state after approximately 80 s, 15–60 mm (remaining lines) below the surface the temperature continues to rise even at the end of the pass. The roll does not reach thermal balance even at a long pass, which justifies the geometric variation through process.

4.3. Comparison of Cooling Unit Efficiency

During the last passes, cooling only at the entry side is applied on the roll, as can be seen in Figure 6. In the above-mentioned validation step, only the entry cooling was applied as well. However, the mill can utilize cooling also to the exit side, which in most cases is not used due to limitations related to surface quality and stains. Of course, the application of cooling from both sides is more efficient compared to the entry side only, and the benefit will be ~30% according to the simulation results of interfacial heat transfer presented in Figure 7.
This cooling efficiency difference is imprinted on the geometric evolution of the roll through the pass. In Figure 8, the FEM results can be seen, which compare the camber evolution between entry cooling applied and entry and exit cooling applied simultaneously. After 100 s of processing, the camber increased by 6 μm in the case of only entry cooling, and by 4 μm when cooling from both sides was applied.

4.4. Influence of Initial Roll Temperature

Very important as well is the influence of the roll’s initial temperature on the camber evolution, as can be seen in Figure 9. After 100 s of processing the camber increased by ~6 μm in the case of a 340 Κ roll initial temperature, and by ~4 μm in the case of the 380 Κ roll initial temperature.
The rolls at higher temperatures, apart from being geometrically more stable, were also thermally more stable. Figure 10 shows the temperature evolution diagram for the 340 K initial roll temperature and for the 380 K initial roll temperature. For 100 s of processing and at 15 mm away from the surface, the temperature difference between the start and the finish of the pass according to the simulation experiment was 38 Κ (ΔΤ340Κ = 340 − 378 = 38 Κ) for the cold roll and 13 Κ (ΔΤ380Κ = 380 − 393 = 13 Κ) for the hot one. Very interesting is the fact that although the temperature difference at the beginning of the simulation experiment between the rolls was 40 K, the temperature after 100 s was very close, with only 5 K difference in surface temperature.
The hot roll had slightly lower heat dissipation from the strip to the roll (~1%) during the steady state compared to the cold roll, however it had significantly lower heat dissipation at the beginning of the pass (~7%) (Figure 11). The lower heat dissipation should balance the temperature difference between the front and back end of the strip compared to the main body. This will further improve the flatness of the strip through the length as the temperature variation results in rolling force variation, and thus crown variation.

4.5. Influence of Strip Temperature

Although the strip temperature is also a factor that might be able to alter the roll camber, as can be seen in Figure 12, the influence is not as significant compared to the above-mentioned process parameters. A higher strip temperature will further increase the surface temperature, but at the same time it will increase the temperature difference between the roll surface and the coolant, which will increase the cooling units’ efficiency.

5. Discussion

In the final passes of the pass schedule, higher forces can be observed at the front and the end of the strip because of the lower temperature reaching a steady state in between. Moreover, the roll camber evolves due to thermal loads. Consequently, the resulting crown of the strip is significantly higher at the front and back compared to the main body, where the crown has, in many cases, a decreasing trend through length. The variation as well as the absolute value of the crown can sometimes be so high that the whole strip or parts of it will be out of specification, or it will make difficult any further processing.
Some modern rolling mills are equipped with automatic roll bending actuators to compensate for any variation in crown due to force inconsistency and thermal camber through the length of the strip, but often the control window is very narrow so as to correct a poor pass schedule design. Moreover, the thinner the strip, the more difficult it is for the material to flow laterally, and corrections can result in waviness on certain parts of the strip. The same problem will be even stronger in cases where a strip with inconsistent crown reaches the cold rolling stage. For this reason, the proper control of the thermal state and the roll camber with the optimum cooling strategy is crucial for the flatness of the final product.
The effects of the phenomena taking place during rolling and of the process parameters on the thermal camber and the temperature evolution of the roll are difficult to understand and quantify. The proposed model was designed to enhance the understanding of the process and assist in assessing the corrective measures for improvements. Taking into consideration that in the industrial environment the most common methodology for process improvement is “trial and error”, the proposed model will enable us to investigate different parameters unconditionally with substantially lower cost in comparison to industrial trials. The simulation results provide important knowledge gain and guidance for the determination of the proper rolling conditions, which can increase the success rate of the following industrial trials with a minimal rolling trial optimization sequence.
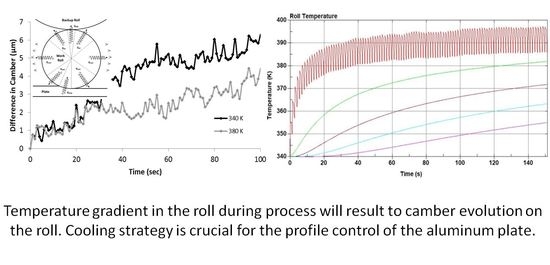
The thermal analysis proved that the roll does not reach a total thermal steady state, a condition where the camber remains constant, and also pointed out the temperature whereat the steady state is reach on the surface. The approach for improvement was to reduce the steady state temperature by increasing the cooling efficiency, to bring the roll closer to this thermal steady state by increasing the roll temperature, and to quantify the improvements for prioritization purposes. The influence of the strip temperature was studied as well.
The model showed the improvement of the application of cooling from both sides of the work roll. The cooling efficiency was improved by ~30%, with similar improvement in the thermal camber evolution. However, the challenges of the use of cooling at the exit side of the roll are well known. Most of the time, these are related to the inefficient removal of the emulsion falling on the strip from the cooling unit at the exit side. Especially in the last passes of a reversing mill, where the strip is coiled, it can cause stains that will diminish the strip’s final surface quality. Of course, with the suitable equipment and a very careful control of the process, such problems can be avoided. Although it can be avoided, the additional effort and the idea of the process being susceptible to visual defects on the final product often leads to the use of the cooling unit only from the entrance side. For products in which the appearance is the basic concern, such an approach is enough, but in higher value-adding products in which flatness is also very significant, the geometrical control of the work roll becomes very important.
On the other side, the increase in the average roll temperature will result in a more geometrically stable roll. This is due to the fact that the temperature difference between both the roll and the strip, but also between the roll surface and roll center, will become smaller, deteriorating the heat flux. According to the simulation, an increase of 40 K in average roll temperature will result in the significant improvement of thermal camber evolution by reducing the finishing camber by 2 μm. Effort is required to increase the rolls’ core temperature. The concern pertains to the effect of a hotter roll on the steady state temperature of the roll surface during rolling. From simulation findings, it appears that the average temperature of the roll has almost no impact on the steady state temperature at the surface of the roll.
In an industrial reversing mill pass schedule, where the time for which the strip is in contact with the roll can even be less than half, the way to achieve such a temperature increase is, firstly, to continue rolling for several pass schedules, but, more importantly, to avoid roll cooling during the inter-pass time. Even after several pass schedules, if the roll is cooled during the inter-pass time, it will remain relatively cold, and as a result, will never reach a steady state and will be geometrically unstable on high thermal loads and long passes.
An additional benefit of a hot roll is seen during its first contact with the strip. A common problem in rolling is that the first and last meters of the strip have lower temperatures compared to the main body of the strip, which results in an increase in separation forces and, consequently, in poor flatness and properties variation. The lower temperature can be attributed to many reasons, such as the contact of the strip with the cold core in the center during coiling, the free surfaces at the front and back end, the lower speed with which each pass starts before reaching the maximum speed, etc. The smaller temperature difference between a higher temperature roll and the strip will cause a drop of heat flux between the strip and the roll, and more heat will be maintained in the front and the back of the strip. In some cases, in order to further enhance this effect, a practice is to start the pass with turned off cooling units in order for the roll surface to more quickly reach the steady state temperature, and then the cooling is applied at a few meters from the beginning of the pass.
The strip sticking to the roll is a common problem in aluminum hot rolling. Apart from other issues, it can be related to either very high or very low roll surface temperatures. The surface temperature can mainly be controlled by the effective cooling. In the cases wherein sticking is observed, the application of cooling at the exit side becomes again very important. To cool the roll between the passes in order to start a certain pass with the lowest temperature possible, or to avoid a high temperature roll core due to the fear that it will impact the final product’s surface quality, are not recommended.

6. Conclusions

The strip profile is significantly influenced by the temperature profile on the roll and the camber evolution caused by thermal expansion. The model was validated by comparing industrial measurements of crown evolution through length with the calculated evolution of the roll camber. The conclusions are summarized below.
The application of cooling from both the entry and the exit side is ~30% more efficient compared to entry side cooling only. The final camber evolution at the end of a 100 s pass will drop from 6 μm in the case of only entry cooling to 4 μm for both entry and exit cooling.
The initial roll temperature will affect the final camber substantially. The hotter roll will be geometrically more stable compared to the colder roll. More specifically, for a 100 s pass the camber increases by ~6 μm in the case of 340 Κ roll initial temperature, and by ~4 μm in the case of the 380 Κ roll initial temperature.
In a hotter roll the surface temperature will reach a steady state faster compared to a colder one, shaping a different temperature gradient in the strip as well.
The surface temperature of the roll during the process has only slight dependency on the roll’s average temperature. A high increase in roll temperature will lead to only a very small increase in surface temperature.
The strip temperature will alter the thermal camber, however it has a weaker effect compared to the average roll temperature and cooling strategy.

Author Contributions

Conceptualization, E.G.; methodology, E.G. and S.P.; software, E.G.; validation, E.G.; formal analysis, E.G. and S.P.; investigation, E.G.; resources, S.P.; data curation, E.G.; writing—original draft preparation, E.G.; writing—review and editing, S.P.; visualization, E.G.; supervision, S.P.; project administration, S.P. All authors have read and agreed to the published version of the manuscript.

Funding

This research received no external funding.

Acknowledgments

The authors acknowledge the technical management of ELVAL S.A. for providing access to the production site and for the permission to utilize production data for the validation of our model. The discussions with A. Mavroudis, M. Gonidakis and D. Kortselis throughout the execution of the project are also highly appreciated. The authors also express gratitude to the Hellenic Research Centre for Metals—ELKEME S.A. for their support in this research.

Conflicts of Interest

The authors declare no conflict of interest.

References

  1. Gavalas, E.; Papaefthymiou, S. Prediction of Plate Crown during Aluminum Hot Flat Rolling by Finite Element Modeling. J. Manuf. Mater. Process. 2019, 3, 95. [Google Scholar] [CrossRef] [Green Version]
  2. Guo, R.M. Determination of Optimal Work Roll Crown for a Hot Strip Mill. Iron Steel Technol. 1989, 66, 52–60. [Google Scholar]
  3. Sikdar, S.; Shylu, J.; Pandit, A.; Dasu, R. Analysis of roll stack deflection in a hot strip mill. J. Braz. Soc. Mech. Sci. Eng. 2007, 29. [Google Scholar] [CrossRef]
  4. Steinboeck, A.; Ettl, A.; Kugi, A. Dynamical Models of the Camber and the Lateral Position in Flat Rolling. Appl. Mech. Rev. 2017, 69, 040801. [Google Scholar] [CrossRef]
  5. Fukushima, S.; Washikita, Y.; Sasaki, T.; Nakagawa, S.; Buei, Y.; Yakita, Y.; Yanagimoto, J. High-Accuracy Profile Prediction Model for Mixed Scheduled Rolling of High Tensile Strength and Mild Steel in Hot Strip Finishing Mill; Nippon Steel & Sumitomo Metal Technical Report; Nippon Steel Corporation: Tokyo, Japan, March 2016. [Google Scholar]
  6. Wang, T.; Xiao, H.; Zhao, T.Y.; Qi, X.D. Improvement of 3-D FEM Coupled Model on Strip Crown in Hot Rolling. J. Iron Steel Res. Int. 2012, 19, 14–19. [Google Scholar] [CrossRef]
  7. Shigaki, Y.; Montmitonnet, P.; Silva, J.M. 3D finite element model for roll stack deformation coupled with a Multi-Slab model for strip deformation for flat rolling simulation. AIP Conf. Proc. 2017, 1896, 190018. [Google Scholar] [CrossRef]
  8. Atack, P.A.; Robinson, I.S. An investigation into the control of thermal camber by spray cooling when hot rolling aluminium. J. Mater. Process. Technol. 1994, 45, 125–130. [Google Scholar] [CrossRef]
  9. Tseng, A.A.; Tong, S.X.; Chen, T.C. Thermal Expansion and Crown Evaluations in Rolling Processes. Mater. Des. 1997, 17, 193–204. [Google Scholar] [CrossRef]
  10. Stürmer, M.; Dagner, J.; Manstetten, P.; Köstler, H. Real-time simulation of temperature in hot rolling rolls. J. Comput. Sci. 2014, 5, 732–742. [Google Scholar] [CrossRef]
  11. Jiang, M.; Li, X.; Wu, J.; Wang, G. A precision on-line model for the prediction of thermal crown in hot rolling processes. Int. J. Heat Mass Transf. 2014, 78, 967–973. [Google Scholar] [CrossRef]
  12. Ginzburg, V.B.; Bakhtar, F.A.; Issa, R.J. Application of Coolflex model for analysis of work roll thermal conditions in hot strip mills. Iron Steel Eng. 1997, 74, 38–45. [Google Scholar]
  13. Lin, Z.-C.; Chen, C.-C. Three-dimensional heat-transfer and thermal-expansion analysis of the work roll during rolling. J. Mater. Process. Technol. 1995, 49, 125–147. [Google Scholar] [CrossRef]
  14. Abbaspour, M.; Saboonchi, A. Work roll thermal expansion control in hot strip mill. Appl. Math. Model. 2008, 32, 2652–2669. [Google Scholar] [CrossRef]
  15. Guo, Z.F.; Li, C.S.; Xu, J.Z.; Liu, X.H.; Wang, G.D. Analysis of temperature field and thermal crown of roll during hot rolling by simplified FEM. J. Iron Steel Res. Int. 2006, 13, 27–30. [Google Scholar] [CrossRef]
  16. Benasciutti, D.; Brusa, E.; Bazzaro, G. Finite element prediction of thermal stresses in work roll of hot rolling mills. Procedia Eng. 2010, 2, 707–716. [Google Scholar] [CrossRef] [Green Version]
  17. Li, C.-S.; Yu, H.-L.; Deng, G.-Y.; Liu, X.-H.; Wang, G.-D. Numerical Simulation of Temperature Field and Thermal Stress Field of Work Roll during Hot Strip Rolling. J. Iron Steel Res. Int. 2007, 14, 18–21. [Google Scholar] [CrossRef]
  18. Trull, M.; McDonald, D.; Richardson, A.; Farrugia, D. Advanced finite element modelling of plate rolling operations. J. Mater. Process. Technol. 2006, 177, 513–516. [Google Scholar] [CrossRef]
  19. Bao, L.; Qi, X.-W.; Mei, R.-B.; Zhang, X.; Li, G.-L. Investigation and modelling of work roll temperature in induction heating by finite element method. J. Sout. Afr. Inst. Min. Metall. 2018, 118, 735–743. [Google Scholar] [CrossRef]
  20. Deng, G.Y.; Zhu, H.T.; Tieu, A.K.; Su, L.H.; Reid, M.; Zhang, L.; Wei, P.T.; Zhao, X.; Wang, H.; Zhang, J.; et al. Theoretical and experimental investigation of thermal and oxidation behaviours of a high speed steel work roll during hot rolling. Int. J. Mech. Sci. 2017, 131–132, 811–826. [Google Scholar] [CrossRef] [Green Version]
Figure 1. Schematic illustration of the zones with the different boundary conditions.
Metals 10 01434 g001
Figure 2. Roll temperature gradient during rolling.
Metals 10 01434 g002
Figure 3. Original record of crown from the online thickness measuring device.
Metals 10 01434 g003
Figure 4. Calculated roll thermal camber evolution for the validation pass.
Metals 10 01434 g004
Figure 5. Temperature evolution across the roll surface.
Metals 10 01434 g005
Figure 6. Schematic representation of the position of the cooling units (a) and the influence of only exit cooling (b) and only entry cooling (c) on the energy balance.
Metals 10 01434 g006
Figure 7. Comparison of heat flux between the roll and the strip for different cooling strategies.
Metals 10 01434 g007
Figure 8. Comparison of camber evolution between entry cooling applied and entry and exit cooling applied simultaneously.
Metals 10 01434 g008
Figure 9. Comparison of camber evolution between rolls with 340 Κ και 380 Κ initial temperature.
Metals 10 01434 g009
Figure 10. Comparison of temperature evolution between rolls with 340 Κ (up) and 380 Κ (down) initial temperature.
Metals 10 01434 g010
Figure 11. Comparison of heat dissipation from the strip towards the roll for different initial roll temperatures (340 Κ and 380 Κ).
Metals 10 01434 g011
Figure 12. Comparison of roll camber evolution for rolling strips with different temperatures (560 Κ and 620 Κ).
Metals 10 01434 g012
Table 1. Process parameter constants.
ParameterValue
ρ [ kg m 3   ]7800
C p [J kgK]485
k wr [W mK]38
h strip [ W m 2 K ]100
V jet [ Liter min ]3500
A jet [ m 2 ]0.4
P jet [Pa]0.5 × 10⁶
T coolant [K]323
μ coolant ( Kg m   s )4 × 10⁻⁴
Pr   [-]2
k coolant [W mK]0.65
h air [ W m 2 K ]10
T air [K]300
σ [ Kg s 3 K 4 ]5.67 × 10⁻⁸
ε [-]0.5
Table 2. Work roll geometry and physical properties.
ParameterValue
Work Roll Length ( m )3
Work Roll Diameter ( m )0.95
Support Roll Length ( m )2.5
Poisson’s ratio 0.3
Young’s modulus [ GPa ]200
Thermal expansion coefficient [ 1 K ]12.5 × 10⁻⁶
Publisher’s Note: MDPI stays neutral with regard to jurisdictional claims in published maps and institutional affiliations.

