Microstructural Control and Properties Optimization of Microalloyed Pipeline Steel

Institute of Metallurgy, Clausthal University of Technology, Robert-Koch-Straße 42, 38678 Clausthal-Zellerfeld, Germany
†
Faculty of Engineering, Galala University, 43511 Galala City, Egypt.
Metals 2020, 10(11), 1499; https://doi.org/10.3390/met10111499
Submission received: 29 September 2020
/
Revised: 30 October 2020
/
Accepted: 4 November 2020
/
Published: 10 November 2020
(This article belongs to the Special Issue Alloy and Process Design of Metallic Materials)
Abstract
:A series of physical simulations, with parameters resembling those of industrial rolling, were applied using a thermo-mechanical simulator on microalloyed bainitic pipeline steel to study the influence of varying the processing parameters on its microstructure evolution and mechanical properties. In this study, the austenitization temperature and roughing parameters were kept unchanged, whereas the parameters of the finishing stage were varied. The developed microstructures were studied using scanning electron microscopy (SEM) and transmission electron microscopy (TEM). It is illustrated that selecting the appropriate cooling strategy (without altering the deformation schedule) can produce an optimized microstructure that breaks through the strength–ductility trade-off. Increasing the cooling rate after the finishing stage from 10 K·s−1 to 20 K·s−1 activated the microstructure refinement by effective nucleation of acicular ferrite and formation of finer and more dispersed martensite/austenite phase. This resulted in a remarkable enhancement in the ductility without compensating the strength. Furthermore, a pronounced strength increase with a slight ductility decrease was observed when selecting the appropriate coiling temperature, which is attributed to the copious precipitation associated with locating the coiling temperature near the peak temperature of precipitation. On the other hand, it was observed that the coiling temperature is the predominant parameter affecting the strain aging potential of the studied steel. Higher strain aging potentials were perceived in the samples with lower yield strength and vice versa, so that the differences in yield strength after thermo-mechanical treatments evened out after strain aging.
1. Introduction
The World Energy Outlook (WEO, 2019) [1] forecast for world energy supply specified that natural gas will play a significant role in the world’s energy supply over the next two decades and that the world is poised to enter a “Golden Age of Gas”. In many advanced economies, coal is being increasingly replaced by renewables and natural gas. Natural gas will gradually overtake coal and by 2040 the gas demand will have grown by over a third [1]. The demand for development of cost-effective steel with high strength and toughness for oil and gas pipeline-construction is driven by the increased worldwide consumption of both of the fossil fuels, particularly gas-consumption. High strength pipelines facilitate operating at higher pressures, while reducing the wall thickness and lowering the construction costs. In addition to the high operating pressures, extreme external effects, like ground movement or buffering exerted forces on the pipe during construction, play an important role that urges pipeline constructors to utilize increasingly demanding high-strength and ultra-high-strength steel grades [2].
The strength, toughness and weldability of the pipelines have been extended by combining the designed alloying in conjunction with specific thermomechanical processing routes. This development is based on a design strategy that combines both new alloying concepts along with thermo-mechanical rolling schedules tailored for the designed alloy. In this strategy, carbon is not the main strengthening source; it is kept below 0.09 wt.% to improve the weldability and toughness [3]. The strength–ductility balance in the pipeline steels is attained via thermo-mechanical processing (TMP), which strengthens the steel through microstructure refinement, precipitation hardening and microstructural modification. The TMP comprises three stages, namely rough rolling, finish rolling and accelerated cooling. In the course of the rough stage, the repeated cycles of work hardening and the recrystallization process results in the refining of the austenite grains. The finish rolling begins following the roughing stage. The deformation during this stage takes place in the non-recrystallization region, which results in substantial refinement to the final microstructure. The accelerated cooling step starts subsequently to the finishing step with the aim of suppressing the polygonal ferrite formation and urging the formation of non-equilibrium, non-equiaxed ferrite microstructures [4]. The latter transformation products are known to contribute to increasing strength, while maintaining a reasonable level of toughness through both small effective grain sizes and increased dislocation densities [5]. The developed microstructure is complex, consisting of mixtures of different morphologies, and accordingly, wide combinations of mechanical properties can be achieved by controlling them.
Beside the microstructure-control, controlling the precipitation process is also essential for achieving the desired mechanical properties in pipeline steels, which are considered as one of the most successful applications of microalloying [6,7]. The amount of the used microalloying elements, for single and multi-elements, are up to 0.15 wt.%. They could be Nb, V and/or Ti alloy [8]. Nb can be used as a single microalloying element or combined with V. The Ti is added in combination with one of the two microalloying elements. The interactions between the microalloying elements are complex, but in general terms Nb precipitates more readily in austenite than does V, so it is relatively more effective as a grain refiner [9].
In the present study, thermo-mechanical simulations were carried out on samples of a low-carbon CMnMoNbTi pipeline steel following a close-to-industrial schedule. In these simulations, parameters in the finishing stage, namely the finish rolling temperature, coiling temperature and cooling rates between the finish rolling stage and the coiling temperature, were varied. The effect of varying the simulation parameters on the microstructure development and mechanical properties were studied. The dependence of the developed microstructures and the mechanical properties on the applied thermo-mechanical processing parameters was analyzed. The effect of the processing parameters on the strain-aging behavior was also investigated.
2. Materials and Methods
2.1. Material and Preparation of Specimens
Flat compression samples for the physical simulations were machined out a 52 mm thickness industrially rough rolled transfer slab with the chemical composition given in Table 1. This composition corresponds to an API X80-grade. The low C level is for enhancing weldability. The addition of Mn, Mo and Cr is to compensate for the hardenability loss due to the low carbon content. Microalloying with Nb and Ti is conducted to enhance the strength through precipitation strengthening. Additionally, an undissolved quantity of TiN precipitates remain in the solution during the austenitization stage. These particles limit the coarsening of the austenite grains by the strong pinning effect. Figure 1 shows the geometry of the flat compression samples. The samples serve as tensile testing samples after applying the TMP on them. The longitudinal axes of the specimens were taken parallel to the rolling direction and their thicknesses parallel to the transfer bar thickness. The specimens have shoulders of 42 mm for clamping the specimens after TMP during tensile testing and two Ø 6 mm holes for decreasing the heat-dissipation from the testing-zone towards the shoulders. A centerline segregation of the Mn solute element is expected to occur at the mid-thickness region of the 52 mm slab [10]. This segregation zone was avoided by machining the flat compression specimens out of the upper and lower third of the slab.
2.2. Thermo-Mechanical Simulation
The thermo-mechanical simulation was carried out using the flat compression setup of the TTS 820 thermo-mechanical simulator (TA Instruments, Huellhorst, Germany). The temperature during the simulation was monitored using a thermocouple spot-welded on the specimen. The specimen was placed on two ceramic rollers and fixed from the upper side by two ceramic rods. The deformation steps were carried out via two deformation stamps, which upset the specimen in its centre. A detailed description of the flat compression setup of the TTS820 is given in [11]. The flat compression specimens were subjected to the TMP schedule shown in Figure 2. The process variables were selected based on industrial rolling parameters. The focus of this study lies in the consideration of the finishing stage. In this schedule, specimens were heated up to the austenitization temperature (TA) of 1235 °C. The samples were subsequently cooled to 1100 °C and deformed at this temperature applying a true strain value φ of 0.3. The delay-time between the roughing and finishing stages was selected to be 5 s. The successive three deformation steps were performed to simulate the finish rolling stage. Subsequently, the specimens were cooled from the finish rolling temperature “FRT” of the last deformation step to the coiling temperature “CT” applying cooling rate “a”. The accelerated cooling is considered to prevent the formation of the polygonal ferrite (PF). Finally, the cooling in the coil was simulated by applying a very slow cooling rate of 30 K/h (0.0083 K/s), starting from the coiling temperature CT. A strain rate of 15 s−1 was applied for all the upsetting steps. The investigated TMP-parameters are given in Figure 2. Additionally, dilatometric investigations employing the TMP of Figure 2, one time with FRT = 840 °C and another time without applying the deformation steps, were carried out using the Dil 805A/D deformation dilatometer (TA Instruments, Huellhorst, Germany). A detailed description of this dilatometer is given in [12].
2.3. Microstructure Characterization
Microstructure characterization was carried out using scanning electron microscopy (SEM) and transmission electron microscopy (TEM). CAMSCAN 44 (Cambridge scanning Company Ltd., Cambridge, UK) SEM investigations were carried out on central sections of the deformation region cut parallel to the deformation direction. The samples were prepared applying the conventional metallographic preparation procedures comprising mounting, grinding and polishing. A quantity of 0.3 µm oxide-polish silica suspension was used for the final polishing. Nital etchant of 2% concentration was used for revealing the microstructure. After etching, the samples were rinsed with ethyl alcohol and dried under a warm air drier. Stereological measurements were carried out on the scanning electron micrographs to evaluate the obtained phase fractions using the manual point count method, and to evaluate the martensite/austenite particle size by applying the linear intercept method.
Carbon extraction replicas and thin foils for TEM investigation were prepared from a slice mechanically thinned to 0.3 mm. The slices were taken from the central zone of the deformed region parallel to the direction of deformation. The thin foils were prepared by electropolishing in a solution of 10% perchloric acid and 90% ethanol. The process of single-sided extraction replication was used for preparing the extraction replicas. A JEOL 2000 EX II (JEOL Lt., Tokyo, Japan) and an FEI Tecnai 20F microscope (Philips, Amsterdam, The Netherlands) operating at 200 kV were used for the microstructural analyses.
2.4. Tensile Testing
After thermo-mechanical simulation processes, the samples were machined in the form of mini-tensile specimens, as previously illustrated in [11]. Three samples were tested for each processing condition. Pre-straining and loading until fracture of the tensile samples were conducted in a computerized universal testing machine UTS (Zwick-Roell, Ulm, Germany) with a 250 kN load cell. A video extensometer (Zwick-Roell, Ulm, Germany) was used for measuring the strain during testing.
2.5. Evaluating the Strain Aging Potential
The aging treatment was performed after applying a pre-strain of 2% on the TMP samples. The pre-strained samples were aged at 170 °C for 20 min in a recirculating air furnace. The strain aging potential was assessed by the value “S2”. S2 is evaluated as S2 = ReL − R2, where ReL is the lower yield strength after aging and R2 is the measured stress at the applied 2% pre-strain [12,13].
3. Results and Discussion
3.1. Classification and Characteristics of the Obtained Micro-Constituents
The microstructures of pipeline steels consist of mixtures of different morphologies, and therefore, several nomenclatures have arisen over the years for the identification of such microstructures. Figure 3 shows an example of the obtained microstructure together with key-illustrations for classifying its different micro-constituents [4,11,14]. The microstructure of Figure 3 consists mainly of a mixture of acicular ferrite (AF) and granular bainite (GB). The AF has a featureless interior area with a jagged outer boundary. Likewise, the GB is characterized by a non-smooth outer boundary but its interior area is featured with retained austenite and carbide phases, dispersed within the grain. A further observable micro-constituent in the microstructure is the bainitic ferrite (BF). The BF has a feathery form of ferritic laths. Additionally, a very limited quantity of polygonal ferrite (PF), below 3%, appears in the microstructure. The PF is characterized by its featureless interior areas and a smooth outer boundary. The AF poses an assemblage of parallel or non-parallel interwoven ferrite laths. This form of ferrite laths could not be distinguished in the scanning electron micrographs SEM. However, a deeper insight using TEM revealed an interwoven structure, as shown in Figure 4b,c. In line with this observation, Zhao et al. [15] and Yakubtsov el al. [16] revealed the interwoven structure of the AF under TEM, which was not distinguishable using SEM. Figure 4a illustrates that the disorganized microstructure of the AF gives it its larger ability to deflect cracks, thus it is the most favorable structure in pipeline steels [15]. Two types of AF are observed in this study, with crossing laths and with parallel laths, as shown in Figure 4b,c, respectively. The high dislocation density in the AF laths that is observable under TEM is an essential characteristic of intermediate transformation products and is principally caused by heavy accommodated strain occurred due to the transformation process [17]. The high dislocation density contributes considerably in achieving high strength in the final product. The finer AF laths of Figure 4c exhibit higher dislocation density than that of the coarser ones of Figure 4b. It is also observable in Figure 4b,c that acicular ferritic laths are separated by strips of martensite/austenite (M/A) islands, which are distributed at their grain boundaries and have elongated shapes. Wang et al. [18] reported that the M/A islands in acicular ferritic pipeline steels distributed at the grain boundary of AF are formed during the continuous cooling and that they become thinner and shorter by increasing the cooling rate after hot deformation. The occurrence of the AF in the studied structure is attributed to both the chemistry of the steel and the applied processing route. It was previously reported that the low-carbon Mn-Mo-Nb-Ti microalloyed pipeline steel promotes the AF transformation [4,19]. Furthermore, hot deformation also strongly promotes the formation of AF through enlarging the temperature zone of its formation in the continuous cooling transformation (CCT) diagram [4].
Figure 5 shows TEM micrographs of GB and PF. Under TEM, GB appears as equiaxed ferrite grains but with much higher dislocation density than that of the PF and with islands of M/A within it [20,21]. The PF exhibits regions with slight dislocation densities at its neighborhood-boundary of the M/A island (designated with arrows in Figure 5b). This dislocations were created during the martensite formation, which is accompanied by a change in the shape of the transformed region [22]. Because the martensite formation occurs in a temperature range where the shape change cannot be accommodated elastically, the plastic deformation that is driven by the shape change causes the accumulation of dislocations in both the produced phase and in the surrounding ferrite phase [23]. Thus, plastic deformation is induced in the PF to accommodate the geometrical changes that are associated with martensite and bainite transformation.
The dispersed small M/A phase appears as shiny elevated phase in Figure 3 and as black islands in Figure 4 and Figure 5. This M/A phase results from carbon partitioning at the interface between the parent phase, i.e., the austenite, and the phases being formed during continuous cooling of steel. During the phase transformation, the carbon diffuses from the phase being formed to the austenite sites, which results in an increase in the austenite stability. Consequently, a part of the carbon-enriched austenite remains in the transformed microstructure as retained austenite and the other part transforms to martensite during the continuous cooling. This results in coexistence of retained austenite with martensite in a single micro-constituent, which is generally considered as an M/A micro-constituent. The M/A attains two morphologies, namely the blocky one, which is observable in Figure 3 and Figure 5 and the slender one, which is observable as thin layers between acicular ferrite laths, as distinguishable in Figure 4b,c.
3.2. Classification and Characteristics of the Obtained Precipitates
Beside the abovementioned micro-constituents, precipitates of size ranging from ~50 nm up to ~250 nm are observable as well (some of them are white circled in Figure 3). High-resolution scanning electron investigations combined with energy-dispersive X-ray microanalysis (EDX) performed on JEOL JSM7000F (JEOL Lt., Tokyo, Japan) revealed three types of precipitates. Figure 6 illustrates scanning electron micrographs of these different types together with their EDX-spectrum. The first precipitate-type, which has rectangular non-equilateral form, like that shown in Figure 6a, was identified using EDX analysis as (Ti, Nb) (C, N). The microalloying with Ti and Nb is believed to play a particular role. The TiN has a high solubility temperature, therefore an undissolved quantity of its particles remains in the microstructure during the austenitization stage, which limits the coarsening of the austenite grains by the pinning effect [11]. Conversely, NbC completely dissolves during austenitization. The subsequent deformation and cooling processes result in the precipitation of NbC on the pre-existing TiN, i.e., NbC forms a shell around TiN [24]. The precipitates identified as (Ti, Nb) (C, N) are believed to be formed according to this scenario. Ma et al. [24] showed, using electron energy loss spectrometry (EELS), that these precipitates have a core that is Ti rich, or in some cases Ti and Nb rich, and a shell that is Nb rich. The tendency of the precipitation of NbC on the pre-existing TiN is proved by means of thermodynamic calculations using the software MatCalc® version 6.00 (MatCalc Engineering, Vienna, Austria) as will be shown in Section 3.5. It is basically shown using these calculations that, in case of the pre-existing TiN precipitates, the NbC fraction precipitating at dislocations is almost two to three times that of NbC fraction nucleating on the TiN surface. The precipitates nucleating at the dislocations will be designated by NbC-n and the ones nucleating at the surface of the TiN will be designated by NbC-s.
Figure 6b reveals an example of the NbC-n type of precipitates. These precipitates are smaller in size than the (Ti,Nb) (C,N) and are characterized by an equilateral rectangular shape. The EDX analysis of these precipitates did not reveal N; however, it revealed Ti. As shown in the predicted composition of the NbC precipitates of Table 2, Ti remains as an accompanying element in this precipitate-type. The absence of the N and the observation of Ti in lower intensity in the EDX together with their dissimilar shape to the (Ti,Nb)(C,N) precipitates is the reason for judging these precipitates as NbC-n and not TiN shelled with NbC-s.
Figure 6c shows the cementite precipitates, which are characterized by their elliptical shape. The EDX analysis of these particles revealed their enrichment with Mn. This is also confirmed from their predicted composition given in Table 2. It was previously reported that the cementite often does not consist only of pure iron carbide; it contains, in most cases, varying amounts of manganese carbide [25]. The reason for the high Mn level in cementite is alloying with Mn above the level required to form MnS; the excess Mn combines with some of the carbon to produce carbide of manganese, which is formed in conjunction with iron carbide. It is worth mentioning here that the predicted composition given in Table 2 was found to be dependent on the coiling temperature and insignificantly affected by the other investigated processing parameters. The thermodynamic calculations predicted that the mass-fraction of Mn in cementite increased to 0.31 and its iron content decreased to 0.25 when increasing the CT to 500 °C.
The existing precipitates resulting from addition of microalloying elements enhance the steel-strength through:
- Limiting the coarsening of austenite grains during austenitization by the pinning effect.
- Refining the austenite grain via retarding the recrystallization of austenite during hot-rolling.
- Providing nanostructure phases, which are the precipitates themselves.
An extension of this investigation, in which an extensive TEM study is to be carried out, is the main goal of a further investigation. This study will incorporate both stereological measurements on the precipitates to determine the volume fraction and the distribution of each precipitate-type, and studying of the elements’ distribution within the precipitates.
3.3. Microstructure Evolution
Figure 7 shows representative scanning electron photomicrographs comparing the combined effect of cooling rate and coiling temperature on the developed microstructures. The main micro-constituents of the microstructure are the AF and GB. The BF is observed only in the samples with CT = 350 °C and a = 20 K·s−1 (Figure 7d). The BF grows in the form of packets consisting of clusters of thin lenticular plates or laths. The transformation of BF is a displacive one, and therefore it cannot cross the austenite grain boundaries [26]. The formation of PF is avoided/minimized, thanks to the combined effect of the alloy design and the applied thermo-mechanical schedule. Zhao et al. [4] found that the additions of Mn, Nb, Ti and/or Mo significantly suppress PF formation and promote the formation of AF. The formation of AF is also strongly promoted by hot deformation [4]. The formation of AF starts at a temperature slightly above the upper bainite region and below that of PF. GB, on the other hand, is formed at lower temperatures than that of AF [5,17,27]. The last micro-constituent to form before the martensite transformation is the BF [4].
The metallographic investigations on the samples with FRT of 780 °C showed for both of the investigated coiling temperatures that higher AF fraction and finer and more dispersed martensite/austenite (M/A) phase are observed for the samples cooled applying a = 20 K·s−1. The volume fraction of the AF increased from ~0.27 to ~0.48 when increasing the cooling rate “a” from 10 K·s−1 to 20 K·s−1. Increasing the cooling rate has not significantly affected the M/A fraction, which is observed to be about 0.05. However, its particle size decreased from ~0.65 µm to ~0.30 µm with the increasing of the cooling rate. The CT has an insignificant effect on the obtained AF fraction. The latter observation is attributed to the fact that the AF is formed at a temperature range above the CT. Therefore, the AF fraction can only be dependent on the “FRT” and the cooling rate “a”. Similarly, Hwang et al. [28] showed for their studied pipeline steels that they underwent little microstructural change with varying the CT from 400 °C to 600 °C.
On the other hand, increasing the cooling rate stimulates the intra-granular nucleation and subsequently the acicular ferrite transformation is promoted [29,30]. Furthermore, Anijdan and Yau [31] reported that a higher cooling rate is an important parameter that determines the formation of non-equiaxed ferrite-based micro-constituents, a desired microstructure for high strength pipeline steels. In the context of the observed significant grain refinement of M/A after applying higher cooling rates, Yi el al. [32] attributed this observation to the faster movement of the ferrite/austenite interface. Thus, the high cooling rate leaves isolated small austenite particles at temperatures above the martensite start temperature (Ms). Below Ms, the austenite particles form the M/A phase. Although the lower cooling rate produces larger retained austenite particles, their enrichment with carbon would be higher due to the availability of longer time for the carbon to diffuse from the ferrite and bainite to the retained austenite [33,34]. Similar refinement of the M/A phase is also observed by Anijdan and Yau [31].
The higher fraction of AF and the refinement of M/A with increasing “a” from 10 K·s−1 to 20 K·s−1 is also observable for the FRT 840 °C, as shown in Figure 8. Increasing FRT from 780 °C to 840 °C resulted in a marginal decrease in the developed AF fraction to 0.24 for a = 10 K·s−1 and to 0.46 for a = 20 K·s−1. Indeed, lowering the FRT activates the interior dislocation in the austenite phase, which promotes the formation nucleation sites for AF. The M/A particle size is slightly increased by the rise of the FRT; they recorded ~0.74 µm and ~0.38 µm for “a” values of 10 K·s−1 and 20 K·s−1, respectively.
3.4. Transformation Kinetics
Figure 9a,b illustrates the transformation kinetics in terms of the length change during cooling after the last deformation step in the TTS 820 simulator. The observed high noise in the dilatometric curves are due to employing a relatively loose fixing method of the samples in the simulator. However, this noise does not affect the identification of the transformation point. The PF, AF, GB and BF takes place during cooling from FRT to CT. The rapid increase in the length change at CT indicates that the transformation continues at the beginning of coiling simulation. This transformation can be considered as isothermal transformation owing to the applied very slow cooling rate of 0.0083 K/s. It is noted in Figure 9 that the sample with a = 20 K·s−1 − CT = 350 °C precedes to higher degree of transformation at the beginning of coiling simulation than the one subjected to a = 10 K·s−1 − CT = 350 °C. It is suggested that this significantly higher dilatation of the former case is due to the formation of BF, since it is the last phase to form during cooling before the martensite transformation [4]. This dilatometric observation is in agreement with the metallographic observation that the BF is observable for the case a = 20 K·s−1 − CT = 350 °C (Figure 7d) and it is absent in the microstructures of the other TMP conditions.
The martensite transformation takes place during continuous cooling in the coil, as revealed by the deviation from linearity in the dilatometric curves below the CT, as shown in Figure 9a,b. It is obvious from the dilatometric curves that increasing the cooling rate “a” from 10 K·s−1 to 20 K·s−1 shifts the martensite start temperature (Ms) to a lower value, which is an indication of increased austenite stability. The parameters affecting the austenite stability are its grain size and solute enrichment. The dependence of the Ms on the austenite grain size is experimentally confirmed. The smaller the particle size from which the martensite is formed, the lower the Ms [35,36]. Additionally, Yang and Bhadeshia developed a model that estimates the Ms variation as a function of the austenite grain size [37]. It is evident from Figure 7 and Figure 8 that the M/A particles of the samples cooled with a = 20 K·s−1 have smaller size compared to those cooled with a = 10 K·s−1. Accordingly, this decrease in particle size can promote the decrease in Ms. According to the empirical equation of Lee and Park [38], decreasing the M/A particle size (formed from untransformed austenite grains with similar grain size) from 0.68 to 0.3 µm results in a decreasing of the Ms by about 12 °C. That the decrease of Ms with increasing “a” recorded about 40 °C indicates an increase in the solute elements in the small particles, which plays an additional role in decreasing Ms. Additionally, the expected better carbon distribution in smaller grain sizes, because of the reduced diffusion distance, can also shift Ms to a lower value. Martensite transformation in the austenite starts at the regions where the carbon content is the lowest. Thus, the more homogeneous distribution of carbon in austenite phase, the lower would be its Ms. The apparent absence of the martensite start in Figure 9a for samples processed with CT = 350 °C may be attributed to the occurrence of Ms near the start of the coiling simulation. The deviation from linearity due to martensite formation is thus concealed within the transformation just at the beginning of coiling simulation at 350 °C.
For comparison, Figure 9c,d show the transformation kinetics in undeformed samples and deformed ones with FRT = 840 °C observed using Dil 805A/D deformation dilatometer. These figures show that the beginning of austenite decomposition during cooling starts ~15 degrees below that of the deformed steel. Deformation of the steel moves the phase curves of the CCT diagram to the top left corner [4]. By contrast, the Ms of the deformed steels showed lower values compared to the undeformed ones. The latter effect is more pronounced when CT = 350 °C. This can be attributed to the smaller grains resulting from the structure refinement due to deformation. The austenite decomposition temperatures of the cylindrical compressed samples are comparable to those of the flat compressed ones. A temperature of ~670 °C was recorded when cooling with 10 K·s−1, and ~ 655 °C when cooling with 20 K·s−1. On the other hand, the transformation at the beginning of coiling for the flat compression samples is significantly higher than that of the cylindrical compressed ones.
3.5. Precipitation Process
In order to gain insight into the precipitation process, thermodynamic simulations of the TMP were performed be means of the software MatCalc® version 6.00 using the database mc_fe_V2.058. In these simulations, four types of precipitates, corresponding to those observed in the microstructures (see Section 3.2) were considered. These are: TiN, NbC-n and NbC-s and cementite. The simulations integrated the perceived change in the precipitation domain that occurred due to the phase transformation from austenite to ferrite at about 650 °C (Figure 9). The simulation results are presented in Figure 10 and Figure 11. It is shown in these figures that the TiN precipitates pre-exist just at the beginning of the simulation at TA of 1235 °C, which is due to the occurrence of its dissolution temperature above this reheating temperature. The NbC-s starts to form with the precipitation of TiN, whereas the NbC-n starts to precipitate later on at about 1070 °C, i.e., between the simulated roughing and finishing stages. In all cases, the predicted number density of NbC-s developed to attain a value that is equal to that one of the TiN. This behaviour indicates that, in the final microstructure, all the TiN precipitates are predicted to be covered with NbC-s precipitates. A slight increase in the number density of TiN, NbC-n and NbC-s are observable with the beginning of ferrite formation as well as the start of coiling at 500 °C. The cementite precipitation starts after the ferrite formation (below 650 °C). The coiling temperature has the strongest impact on the cementite precipitation. Coiling at 500 °C is predicted to result in the increasing of the cementite volume fraction by three orders of magnitude, as shown in Figure 10b,d and Figure 11b,d, respectively. These figures show also that the cementite number densities exhibit an increase by one order of magnitude at the coiling temperature. Additionally, a significant increase in the volume fraction of NbC-n and NbC-s when coiling at 500 °C is also predicted. However, there is no significant increase in the predicted precipitates when coiling at 350°C, as shown in Figure 10a,c and Figure 11a,c. This effect of CT on the precipitation process can be related to the precipitation–time–temperature (PTT) of the studied alloy. Coiling nearby to the peak temperature of precipitation activated the precipitation kinetics and therefore resulted in increasing the number density and volume fraction of the formed precipitates.
On the other hand, the attained cementite volume fraction is predicted to double when decreasing the cooling rate “a” from 20 K·s−1 to 10 K·s−1. The thermodynamic calculations showed an insignificant effect of decreasing FRT from 840 °C to 780 °C on the predicted precipitation process, as observed when comparing Figure 10 and Figure 11.
An extensive TEM study to experimentally determine the volume fraction and number density of each type of the developed precipitates, including the very tiny ones, is the aim of a future study. The results are then to be compared with the predicted ones.
3.6. Tensile Properties
Figure 12 shows representative stress–strain curves for the TMP conditions. Indeed, the tensile results showed a very high level of consistency with divergence of less than ±2%, due to avoiding the segregation zone of the transfer bar during the machining of samples, and to the high reproducibility of the processing conditions using the TTS820 simulator. It is obvious in Figure 12 that the most dominating factor affecting the strength (Rm and Rp values) of the produced TMP-specimens is the coiling temperature. The specimens with CT = 500 °C recorded higher strength compared to those with CT = 350 °C. Nevertheless, this pronounced effect of CT on the tensile behaviour is not observable in the microstructures of Figure 7 and Figure 8. This indicates that the strength-increase of this steel is influenced by the precipitation kinetics rather than the micro-constituents. It is presented Figure 10 and Figure 11 and explored in the discussion of the previous section that increasing the coiling temperature from 350 °C to 500 °C is predicted to activate the kinetics of precipitation, particularly the precipitation of cementite, which showed an increase in its fraction and number density by two to three orders of magnitude. The TiN, NbC-n and NbC-s are also predicted to increase by order of 1.5 to two times by increasing CT. A similar increase in strength is reported by Xiao el al. due to increasing the CT of their studied microalloyed AF pipeline steel from 500 °C to 600 °C [39]. TEM investigations of Xiao et al. showed two typical carbonitrides precipitates with different size distributions. They indicated that the amount of the smaller precipitates is increased by the rising of the temperature towards the peak temperature for precipitation [39]. Therefore, selecting the proper CT is vital for precipitation strengthening, which increases both the strength and toughness.
On the other hand, the predominant factor dictating the fracture strain is the cooling rate “a”. Increasing the cooling rate from 10 K·s−1 to 20 K·s−1 results in a pronounced increase in the ductility (in terms of total elongation) associated with a slight increase in Rm, as shown in Figure 12a,b. This behaviour can be correlated with the greater AF fraction with increasing the cooling rate, as observed in Figure 7 and Figure 8. The ability of AF to deflect the crack during its propagation (see Figure 4a) results in an enhancing of the tensile ductility with the increasing of the cooling rate. Furthermore, the M/A films at the AF lath-boundaries (Figure 4b,c) present a hindrance for crack propagation [40]. The rise of the AF fraction results in increasing these M/A films. Additionally, the finer and well distributed M/A particles of the fast cooled steel would contribute to the ductility increase.
Referring to Figure 12c,d, it is obvious that decreasing FRT has a significant effect in enhancing the Rm of the specimens with CT = 350 °C and a slight/insignificant effect for CT = 500 °C. Decreasing the FRT results in activating the formation of the substructure and probably increasing the dislocations’ density, and therefore the nucleation sites of the AF are stimulated, as observed when comparing Figure 7 with Figure 8.
3.7. Effect of the TMP Parameters on Strain Aging
Figure 13 shows the stress–strain curves of the samples after aging. Table 3 lists the different S2-values assessed according to Section 2.5. It was interesting to observe that the yield strength after strain aging recorded about 800 MPa, irrespective of the applied TMP parameters. The samples with lower yield strength showed higher strain aging potential, and vice versa, so that the differences in their original yield strengths (after TMP) are compensated. It becomes clear that the strain aging potential is considerably affected by the TMP parameters. The predominant parameter affecting the S2-value is the CT, as shown in Table 3. Applying CT of 350 °C results in substantially higher S2 value.
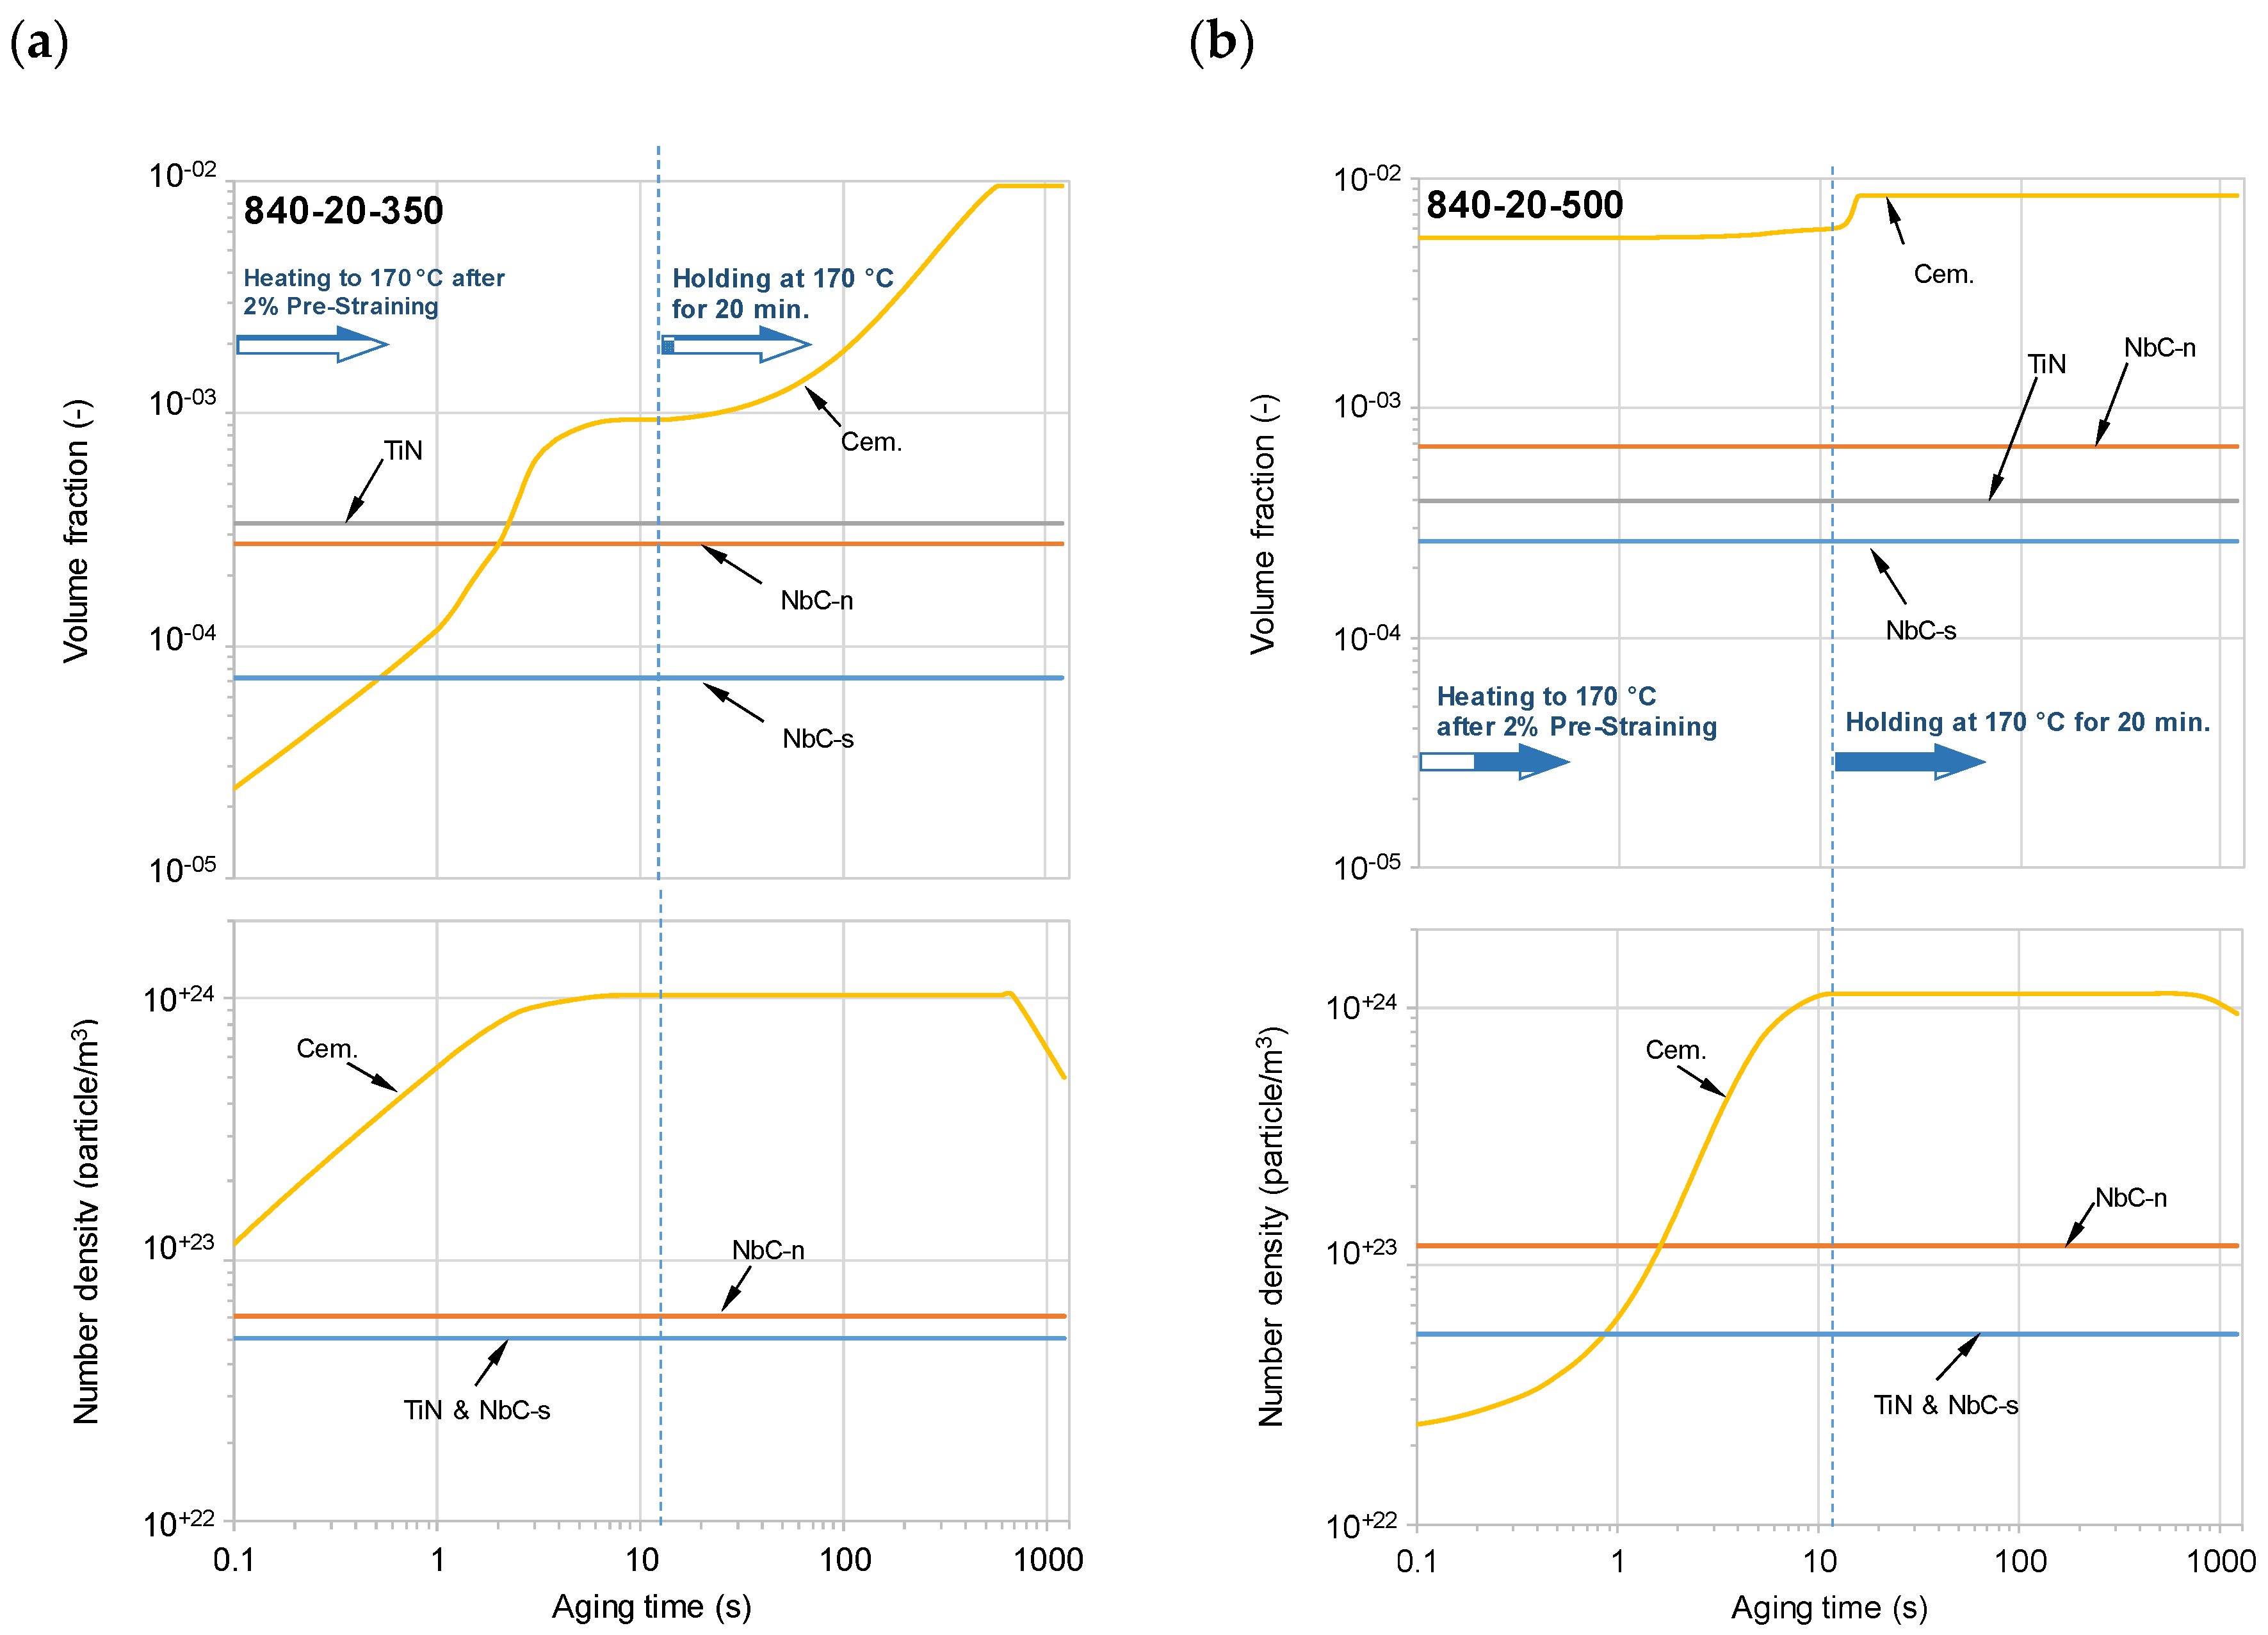
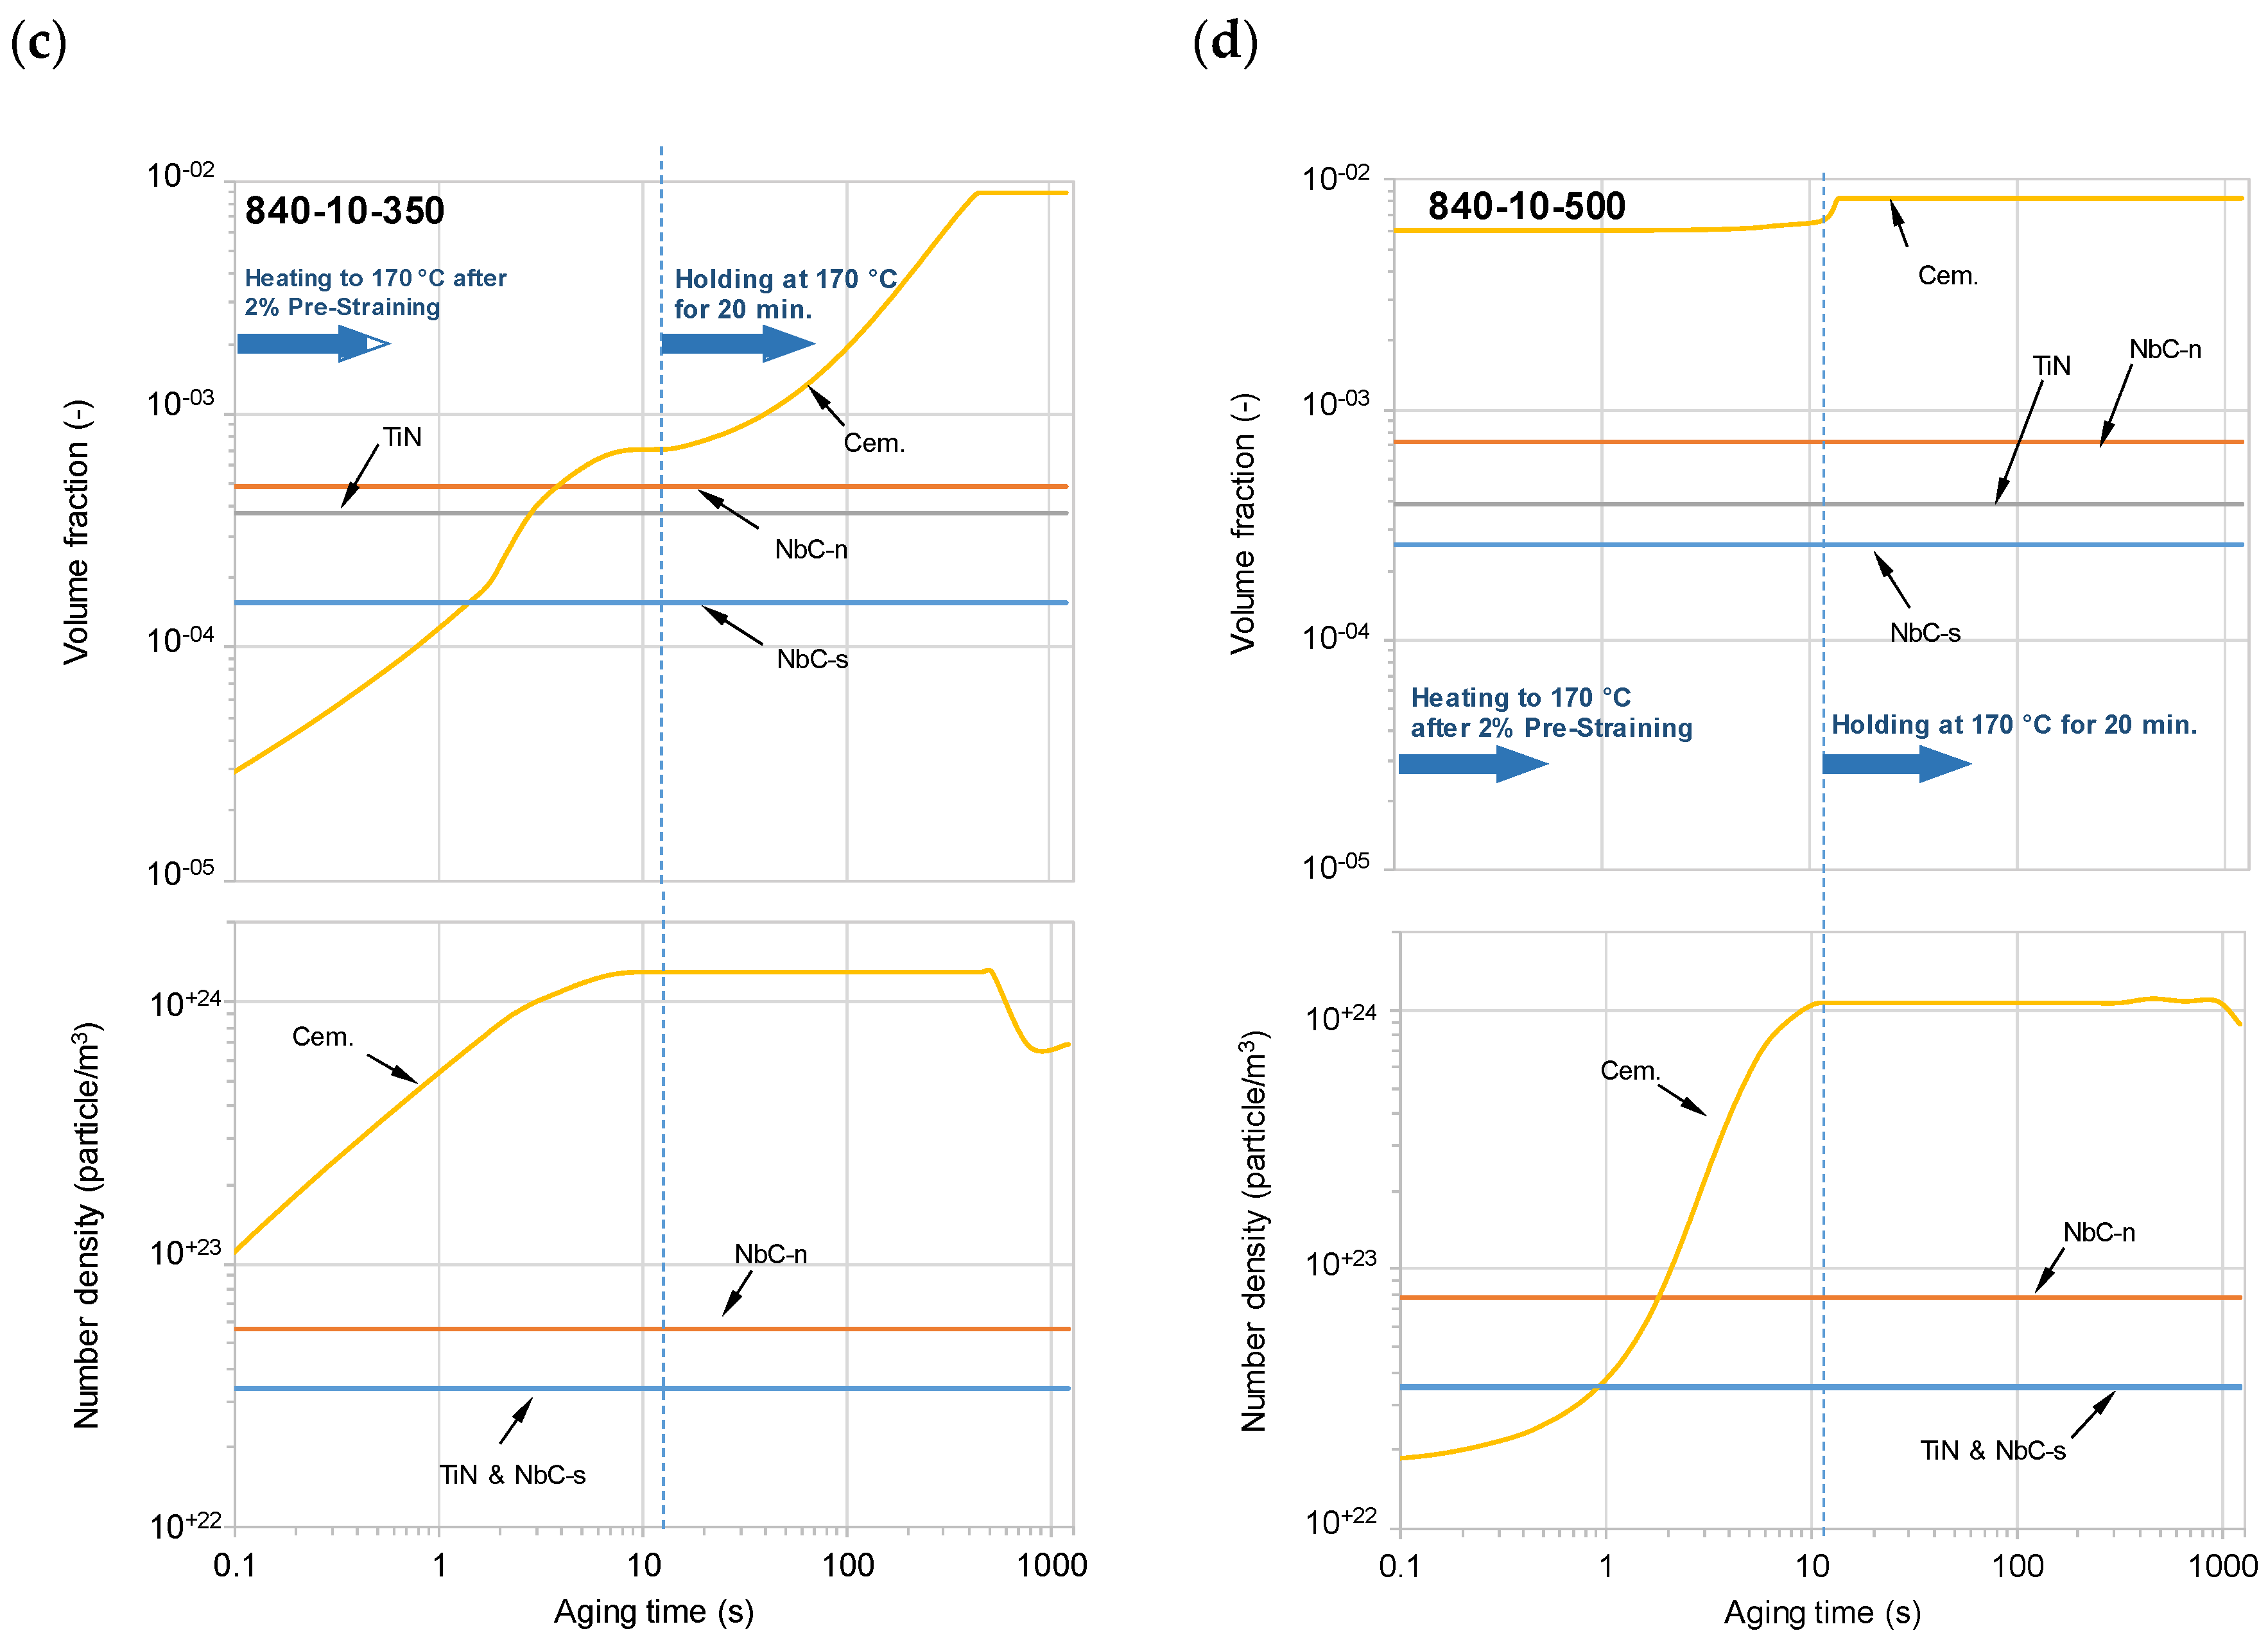
During aging, the free C and N atoms available in the structure diffuse to the dislocations. The stabilizing of the dislocations due to the locking-effect with these interstitial atoms results in the increasing of the force necessary to cause their movement, and consequently the yield strength increases [41]. With the increasing of the available free C and N in steel, aging response should also increase because of the availability of more atoms pinning the mobile dislocations [42]. Taking into account the previous discussion regarding the formation of additional finer precipitates when CT = 500 °C (coiling near the peak temperature for precipitation, see Figure 10b,d and Figure 11b,d), one can expect that this leads to the availability of lower amounts of C and N atoms and consequently lower strain aging potential. Figure 14 shows the thermo-dynamic simulation of the precipitation process during aging after 2% pre-straining of the steels with FRT = 840 °C. The steels with FRT = 780 °C have similar precipitation behavior as those given in Figure 14 because the FRT has an insignificant effect on the predicted attained precipitates after the TMP, as previously illustrated under Section 3.5. After strain ageing, the available cementite precipitates locking the dislocations of the steels with CT = 350 °C, and those with CT = 500 °C, even out, as shown in Figure 14, and therefore the yield strengths equalize. This point needs further investigation.
4. Conclusions
Microstructure development and tensile properties were studied for a microalloyed pipeline steel by carrying out a series of physical simulations resembling the roughing and finishing stages of the rolling process. In these simulations, parameters in the finishing stage, namely the finish rolling temperature, coiling temperature and cooling rate between the last deformation step and the coiling temperature were varied. Austenitization temperature and roughing parameters were kept unchanged throughout all the applied simulation processes. It is shown that the appropriate selection of both the cooling rate after the last deformation step and the coiling temperature is an effective method to optimize the mechanical properties and is proven to break through the strength–ductility trade-off. This breakthrough is realized without refining the structure via changing the hot deformation parameters. It was achieved by:
- Activating the formation of both the acicular ferrite and finer and more dispersed martensite/austenite phase by increasing the cooling rate after the last deformation step. It is shown in this study that stimulating this structure results in an appreciable increase in the ductility without reducing the strength.
- Promoting the formation of finer and more dispersed cementite and carbonitride precipitates, which are of particular importance for enhancing the precipitation strengthening. Selecting the proper coiling temperature plays the central role by which the precipitation process can be promoted effectively. The appropriate selection of the coiling temperature in this study resulted in enhancing the strength without compensating the ductility.
Accordingly, the optimized tensile properties in this study were observed in the samples having a cooling rate after the last deformation step of 20 K·s−1 and a coiling temperature of 500 °C. The finish rolling temperature has a lesser effect on the tensile properties compared to that of the two above-mentioned factors. Furthermore, the coiling temperature can greatly influence the strain aging potential of the pipeline steel by affecting the available amount of free carbon and nitrogen atoms. An important observation of this study is that the samples with lower yield strength showed higher strain aging potential, and vice versa, so that their initial difference in RP-values due to applying different TMPs evened out after strain aging.
Author Contributions
The author confirms sole responsibility for the following: study conception and design, data collection, analysis and interpretation of results, and manuscript preparation. All authors have read and agreed to the published version of the manuscript.
Funding
This research was funded by VFWH, grant number AW147.
Acknowledgments
The author acknowledges Salzgitter Mannesmann Forschung GmbH for the material supply. The author expresses his gratitude to Heinz Palkowski for providing the facilities to perform the experimental work and for the useful discussions.
Conflicts of Interest
The author declares no conflict of interest. The funders had no role in the design of the study; in the collection, analyses, or interpretation of data; in the writing of the manuscript, or in the decision to publish the results.
References
- World Energy Outlook. Flagship Report. Available online: https://www.iea.org/reports/world-energy-outlook-2019 (accessed on 4 November 2019).
- Das, A.K. The Present and the Future of Line Pipe Steels for Petroleum Industry. Mater. Manuf. Process. 2010, 25, 14–19. [Google Scholar] [CrossRef]
- Jeffus, L. Welding Principles and Applications, 7th ed.; Delmar: Clifton Park, NY, USA, 2012. [Google Scholar]
- Zhao, M.; Yang, K.; Xiao, F.-R.; Shan, Y.-Y. Continuous Cooling Transformation of Undeformed and Deformed Low Carbon Pipeline Steels. Mater. Sci. Eng. A 2003, 355, 126–136. [Google Scholar] [CrossRef]
- Tamura, I.; Sekine, H.; Tanaka, T.; Ouchi, C. Thermomechanical Processing of High Strength Low-Alloy Steels; Butterworth & Co. Ltd.: London, UK, 1988. [Google Scholar]
- Jiang, M.; Chen, L.-N.; He, J.; Chen, G.-Y.; Li, C.; Lu, X.-G. Effect of Controlled Rolling/Controlled Cooling Parameters on Microstructure and Mechanical Properties of The Novel Pipeline Steel. Adv. Manuf. 2014, 2, 265–274. [Google Scholar] [CrossRef] [Green Version]
- Xu, J.; Misra, R.; Guo, B.; Jia, Z.; Zheng, L. Understanding Variability in Mechanical Properties of Hot Rolled Microalloyed Pipeline Steels: Process–Structure–Property Relationship. Mater. Sci. Eng. A 2013, 574, 94–103. [Google Scholar] [CrossRef]
- Villalobos, J.C.; Del Pozo, A.; Campillo, B.; Mayén, J.; Serna, S. Microalloyed Steels through History until 2018: Review of Chemical Composition, Processing and Hydrogen Service. Metals 2018, 8, 351. [Google Scholar] [CrossRef] [Green Version]
- Bhadeshia, H.; Honeycombe, R. Steels: Microstructure and Properties, 4th ed.; Butterworth-Heinemann: Oxford, UK, 2017. [Google Scholar]
- Guo, F.; Wang, X.; Liu, W.; Shang, C.; Misra, R.D.K.; Wang, H.; Zhao, T.; Peng, C. The Influence of Centerline Segregation on the Mechanical Performance and Microstructure of X70 Pipeline Steel. Steel Res. Int. 2018, 89, 1800407. [Google Scholar] [CrossRef]
- Soliman, M.; Palkowski, H. Influence of Hot Working Parameters on Microstructure Evolution, Tensile Behavior and Strain Aging Potential of Bainitic Pipeline Steel. Mater. Des. 2015, 88, 759–773. [Google Scholar] [CrossRef]
- Soliman, M.; Palkowski, H. Tensile Properties and Bake Hardening Response of Dual Phase Steels with Varied Martensite Volume Fraction. Mater. Sci. Eng. A 2020, 777, 139044. [Google Scholar] [CrossRef]
- Standard Testing Method DIN-EN 10325. Available online: https://www.mystandards.biz/standard/dinen-10325-1.10.2006.html (accessed on 4 November 2020).
- Tafteh, R. Austenite Decomposition in a X80 Line Pipe Steel. Master’s Thesis, The University of British Columbia, Vancouver, BC, Canada, May 2011. [Google Scholar]
- Zhao, M.; Yang, K.; Shan, Y. The Effects of Thermo-Mechanical Control Process on Microstructures and Mechanical Properties of A Commercial Pipeline Steel. Mater. Sci. Eng. A 2002, 335, 14–20. [Google Scholar] [CrossRef]
- Yakubtsov, I.; Boyd, J. Bainite Transformation During Continuous Cooling of Low Carbon Microalloyed. Steel. Mater. Sci. Technol. 2001, 17, 296–301. [Google Scholar] [CrossRef]
- Lee, J.-L.; Hon, M.-H.; Cheng, G.-H. The Intermediate Transformation of Mn-Mo-Nb Steel During Continuous Cooling. J. Mater. Sci. 1987, 22, 2767–2777. [Google Scholar] [CrossRef]
- Wang, C.; Wu, X.; Liu, J.; Xu, N. Transmission Electron Microscopy of Martensite/Austenite Islands in Pipeline Steel X70. Mater. Sci. Eng. A 2006, 438–440, 267–271. [Google Scholar] [CrossRef]
- Zuo, X.; Zhou, Z. Study of Pipeline Steels with Acicular Ferrite Microstructure and Ferrite-bainite Dual-phase Microstructure. Mater. Res. 2015, 18, 36–41. [Google Scholar] [CrossRef]
- Rodrigues, P.; Pereloma, E.V.; Santos, D. Mechanical Properities of an HSLA Bainitic Steel Subjected to Controlled Rolling with Accelerated Cooling. Mater. Sci. Eng. A 2000, 283, 136–143. [Google Scholar] [CrossRef]
- Bramfitt, B.L.; Speer, J.G. A Perspective on the Morphology of Bainite. Met. Mater. Trans. A 1990, 21, 817–829. [Google Scholar] [CrossRef]
- Young, C.H.; Bhadeshia, H.K.D.H. Strength of Mixtures of Bainite and Martensite. Mater. Sci. Technol. 1994, 10, 209–214. [Google Scholar] [CrossRef]
- Lei, T.C.; Shen, H.P.; Zhang, J. Phase-Hardening and Phase Softening Phenomena in Dual-Phase Steels. In Proceedings of the International Conference on Martensitic Transformations, The Japan Institute of Metals, Nara, Japan, 26–30 August 1986; pp. 465–470. [Google Scholar]
- Ma, X.; Langelier, B.; Gault, B.; Subramanian, S. Effect of Nb Addition to Ti-Bearing Super Martensitic Stainless Steel on Control of Austenite Grain Size and Strengthening. Met. Mater. Trans. A 2017, 48, 2460–2471. [Google Scholar] [CrossRef]
- Sauveur, A. The Metallography and Meat Treatment of Iron and Steel: Forgotten Books; Ripol Classic Publishing House: London, UK, 2013; pp. 148–149. [Google Scholar]
- Zhao, H.; Wynne, B.; Palmiere, E. Effect of Austenite Grain Size on the Bainitic Ferrite Morphology and Grain Refinement of A Pipeline Steel after Continuous Cooling. Mater. Charact. 2017, 123, 128–136. [Google Scholar] [CrossRef]
- Xu, Y.-B.; Yu, Y.-M.; Xiao, B.-L.; Liu, Z.-Y.; Wang, G.-D. Microstructural Evolution in an Ultralow-C and High-Nb Bearing Steel during Continuous Cooling. J. Mater. Sci. 2009, 44, 3928–3935. [Google Scholar] [CrossRef]
- Hwang, B.; Kim, Y.G.; Lee, S.; Kim, Y.M.; Kim, N.J.; Yoo, J.Y. Effective Grain Size and Charpy Impact Properties of High-Toughness X70 Pipeline Steels. Met. Mater. Trans. A 2005, 36, 2107–2114. [Google Scholar] [CrossRef] [Green Version]
- Manohar, P.A.; Chandra, T. Continuous Cooling Microalloyed Steels Transformation for Behaviour of High Strength Linepipe Applications. ISIJ Int. 1998, 38, 766–774. [Google Scholar] [CrossRef]
- Edmonds, D.V.; Cochrane, R.C. Structure-Property Relationships in Bainitic Steels. Met. Mater. Trans. A 1990, 21, 1527–1540. [Google Scholar] [CrossRef]
- Anijdan, S.H.M.; Yue, S. The Effect of Cooling Rate, and Cool Deformation Through Strain-Induced Transformation, on Microstructural Evolution and Mechanical Properties of Microalloyed Steels. Met. Mater. Trans. A 2011, 43, 1140–1162. [Google Scholar] [CrossRef]
- Yi, J.J.; Yu, K.J.; Kim, I.S.; Kim, S.J. Role of Retained Austenite on The Deformation of an Fe-0.07 C-1.8 Mn-1.4 Si Dual-Phase Steel. Met. Mater. Trans. A 1983, 14, 1497–1504. [Google Scholar] [CrossRef]
- Thompson, S.W.; Colvin, D.J.; Krauss, G. Austenite Decomposition During Continuous Cooling of an HSLA-80 Plate Steel. Met. Mater. Trans. A 1996, 27, 1557–1571. [Google Scholar] [CrossRef]
- Goel, N.C.; Chakravarty, J.P.; Tangri, K. The Influence of Starting Microstructure on The Retention and Mechanical Stability of Austenite in an Intercritically Annealed-Low Alloy Dual-Phase Steel. Met. Mater. Trans. A 1987, 18, 5–9. [Google Scholar] [CrossRef]
- Huang, J.; Xu, Z. Effect of Dynamically Recrystallized Austenite on The Martensite Start Temperature of Martensitic Transformation. Mater. Sci. Eng. A 2006, 438–440, 254–257. [Google Scholar] [CrossRef]
- Lee, S.J.; Lee, Y.K. Effect of Austenite Grain Size on Martensitic Transformation of a Low Alloy Steel. Mater. Sci. Forum 2005, 475–479, 3169–3172. [Google Scholar] [CrossRef]
- Yang, H.-S.; Bhadeshia, H. Austenite Grain Size and The Martensite-Start Temperature. Scr. Mater. 2009, 60, 493–495. [Google Scholar] [CrossRef]
- Lee, S.-J.; Park, K.-S. Prediction of Martensite Start Temperature in Alloy Steels with Different Grain Sizes. Met. Mater. Trans. A 2013, 44, 3423–3427. [Google Scholar] [CrossRef]
- Xiao, F.-R.; Liao, B.; Shan, Y.-Y.; Qiao, G.-Y.; Zhong, Y.; Zhang, C.; Yang, K. Challenge of Mechanical Properties of An Acicular Ferrite Pipeline Steel. Mater. Sci. Eng. A 2006, 431, 41–52. [Google Scholar] [CrossRef]
- Shanmugam, S.; Misra, R.D.K.; Hartmann, J.; Jansto, S. Microstructure of High Strength Niobium-Containing Pipeline Steel. Mater. Sci. Eng. A 2006, 441, 215–229. [Google Scholar] [CrossRef]
- Cottrell, A.H.; Bilby, B.A. Dislocation Theory of Yielding and Strain Ageing of Iron. Proc. Phys. Soc. Sect. A 1949, 62, 49–62. [Google Scholar] [CrossRef]
- van Snick, A.; Lips, K.; Vandeputte, S.; de Cooman, B.C.; Dilewijns, J. Effect of Carbon Content, Dislocation Density and Carbon Mobility on Bake Hardening. In Modern LC and ULC Sheet Steels for Cold Forming: Processing and Properties; Institute of Ferrous Metallurgy: Aachen, Germany, 1998; pp. 413–424. [Google Scholar]
Figure 1.
The flat compressing sample (dimensions in mm). The sample was used for tensile testing after applying the TMP.
Figure 1.
The flat compressing sample (dimensions in mm). The sample was used for tensile testing after applying the TMP.

Figure 2.
Schematic of the applied TMP.

Figure 3.
Scanning electron micrograph of steel processed with the parameters: FRT = 780 °C, a = 20 K·s−1, CT = 350 °C together with schematic illustrations of the different obtained micro-constituents.
Figure 3.
Scanning electron micrograph of steel processed with the parameters: FRT = 780 °C, a = 20 K·s−1, CT = 350 °C together with schematic illustrations of the different obtained micro-constituents.
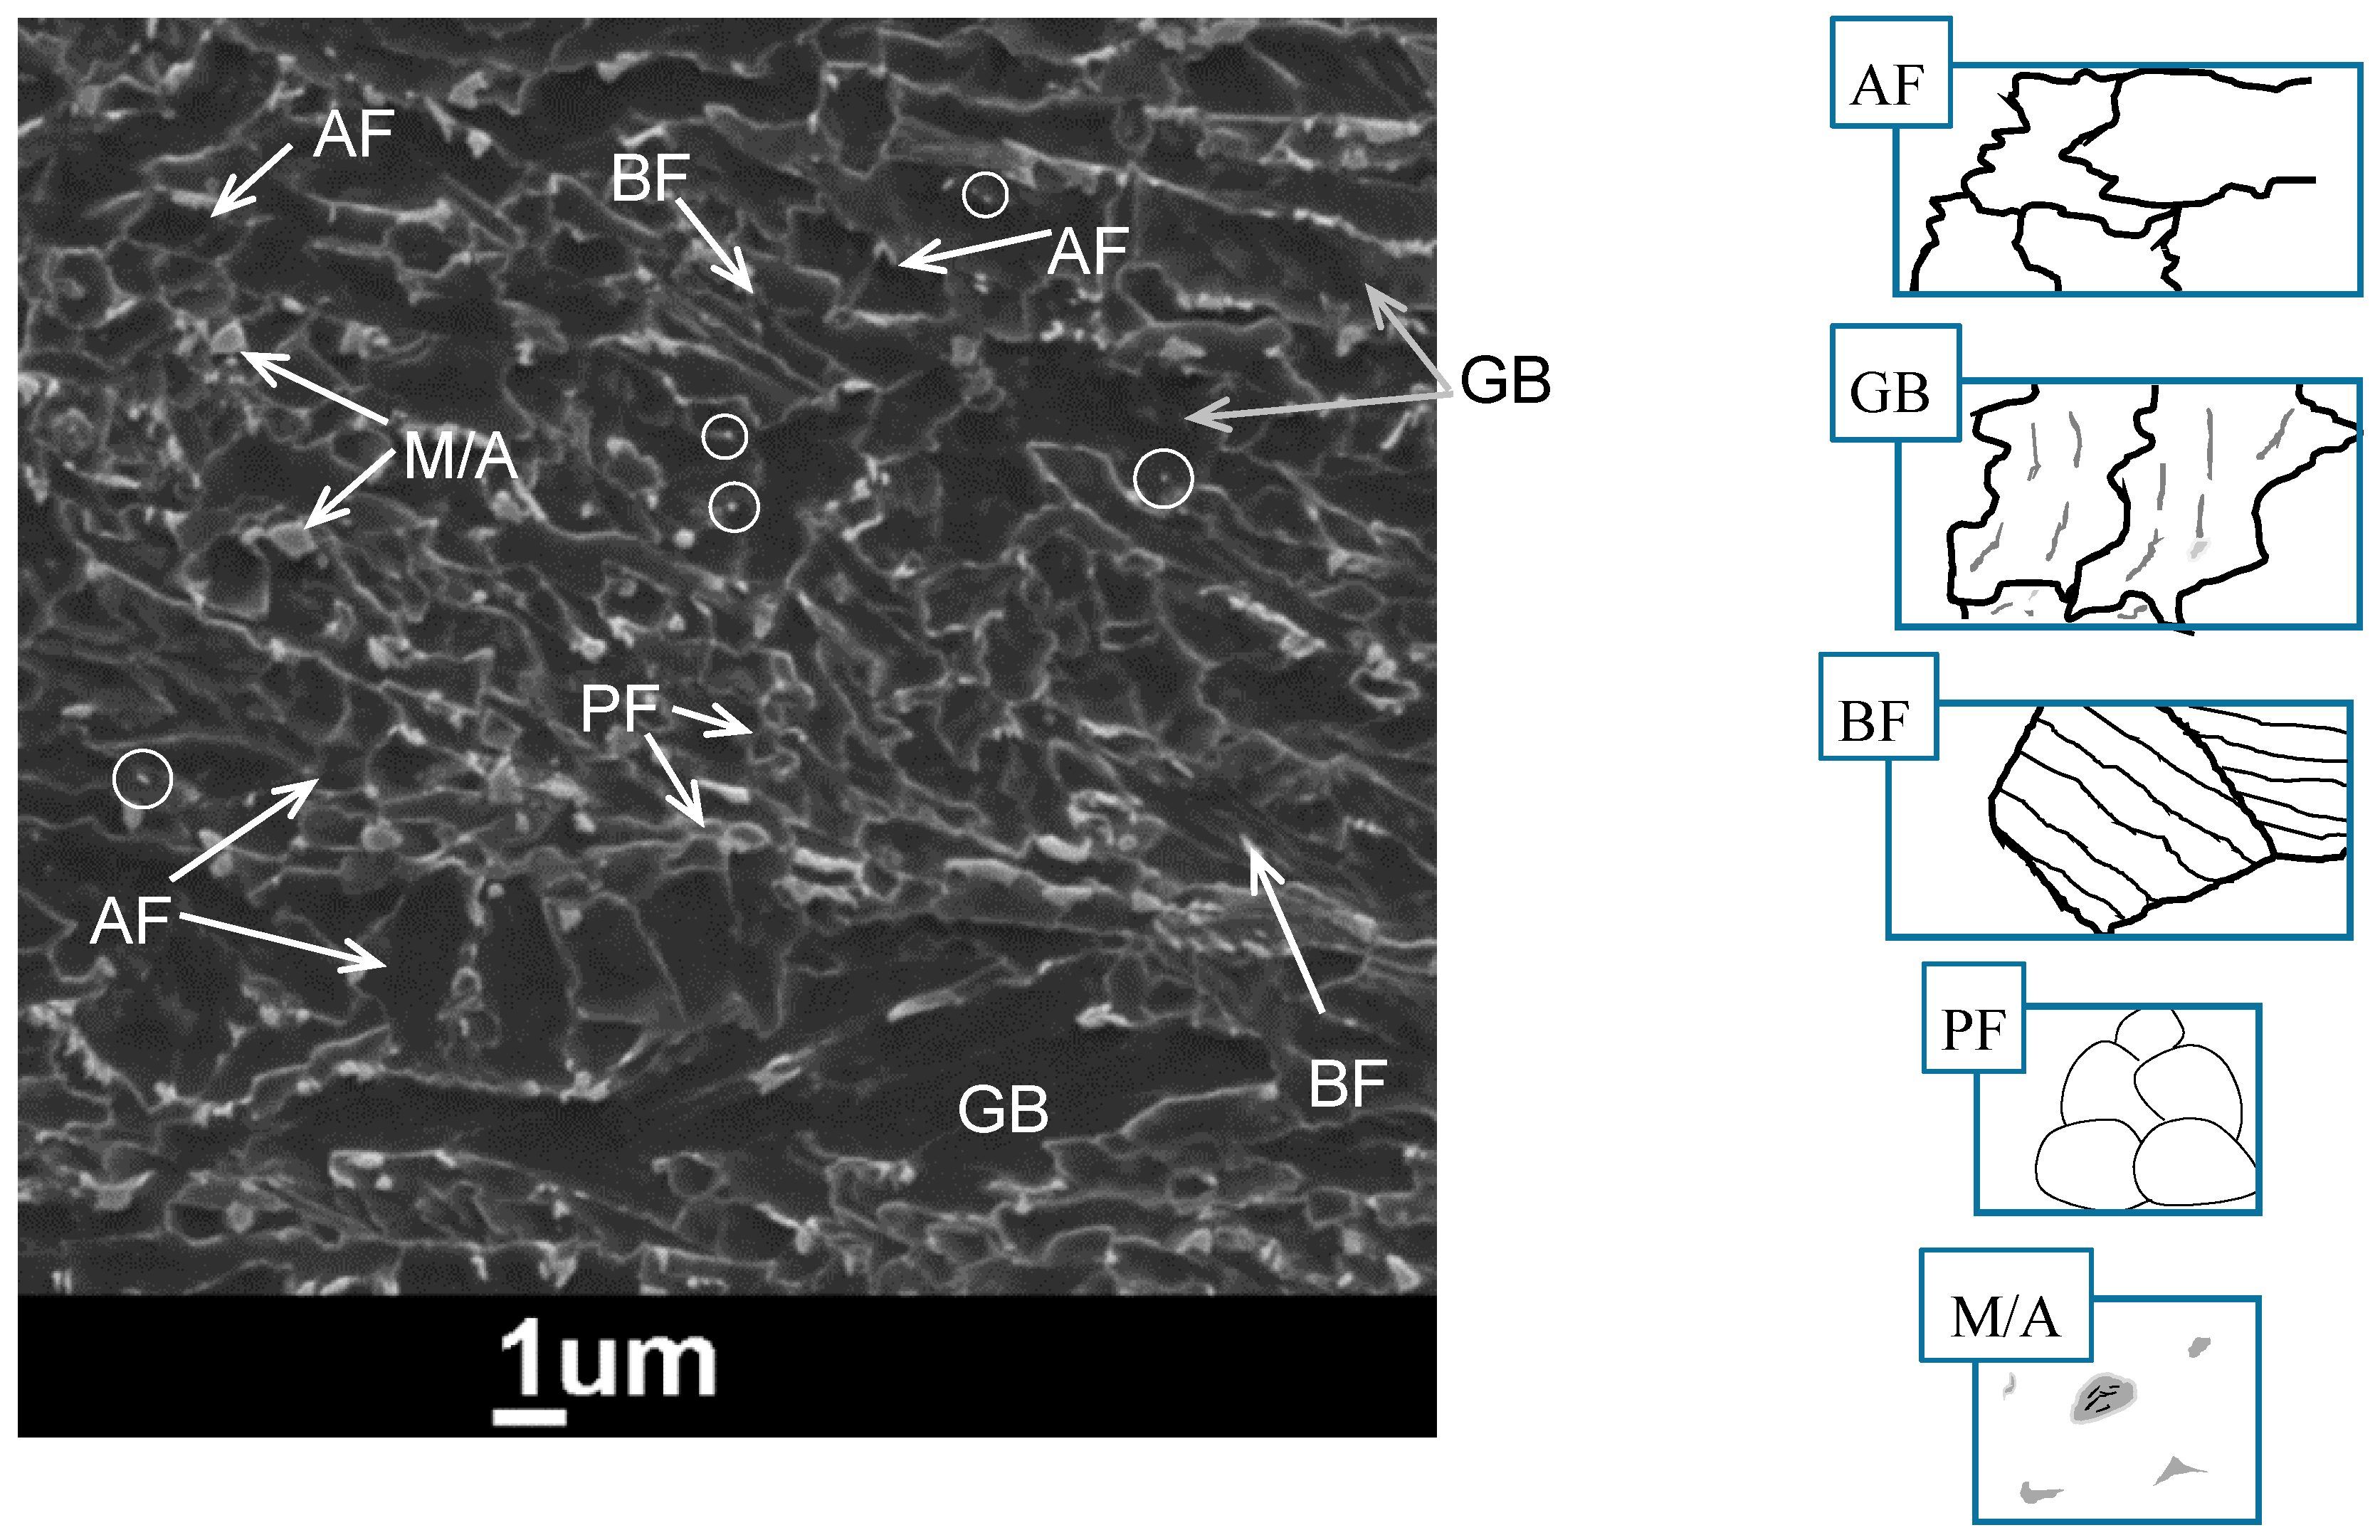
Figure 4.
(a) Schematic feature of cleavage crack deflection at the lath boundaries of acicular ferrite [15]. (b,c) TEM micrographs of acicular ferrite developed under the processing parameters: FRT = 780 °C, a = 20 K·s−1, CT = 350 °C. The AF in (b) is of crossing interwoven ferrite laths and in (c) is of parallel ones.
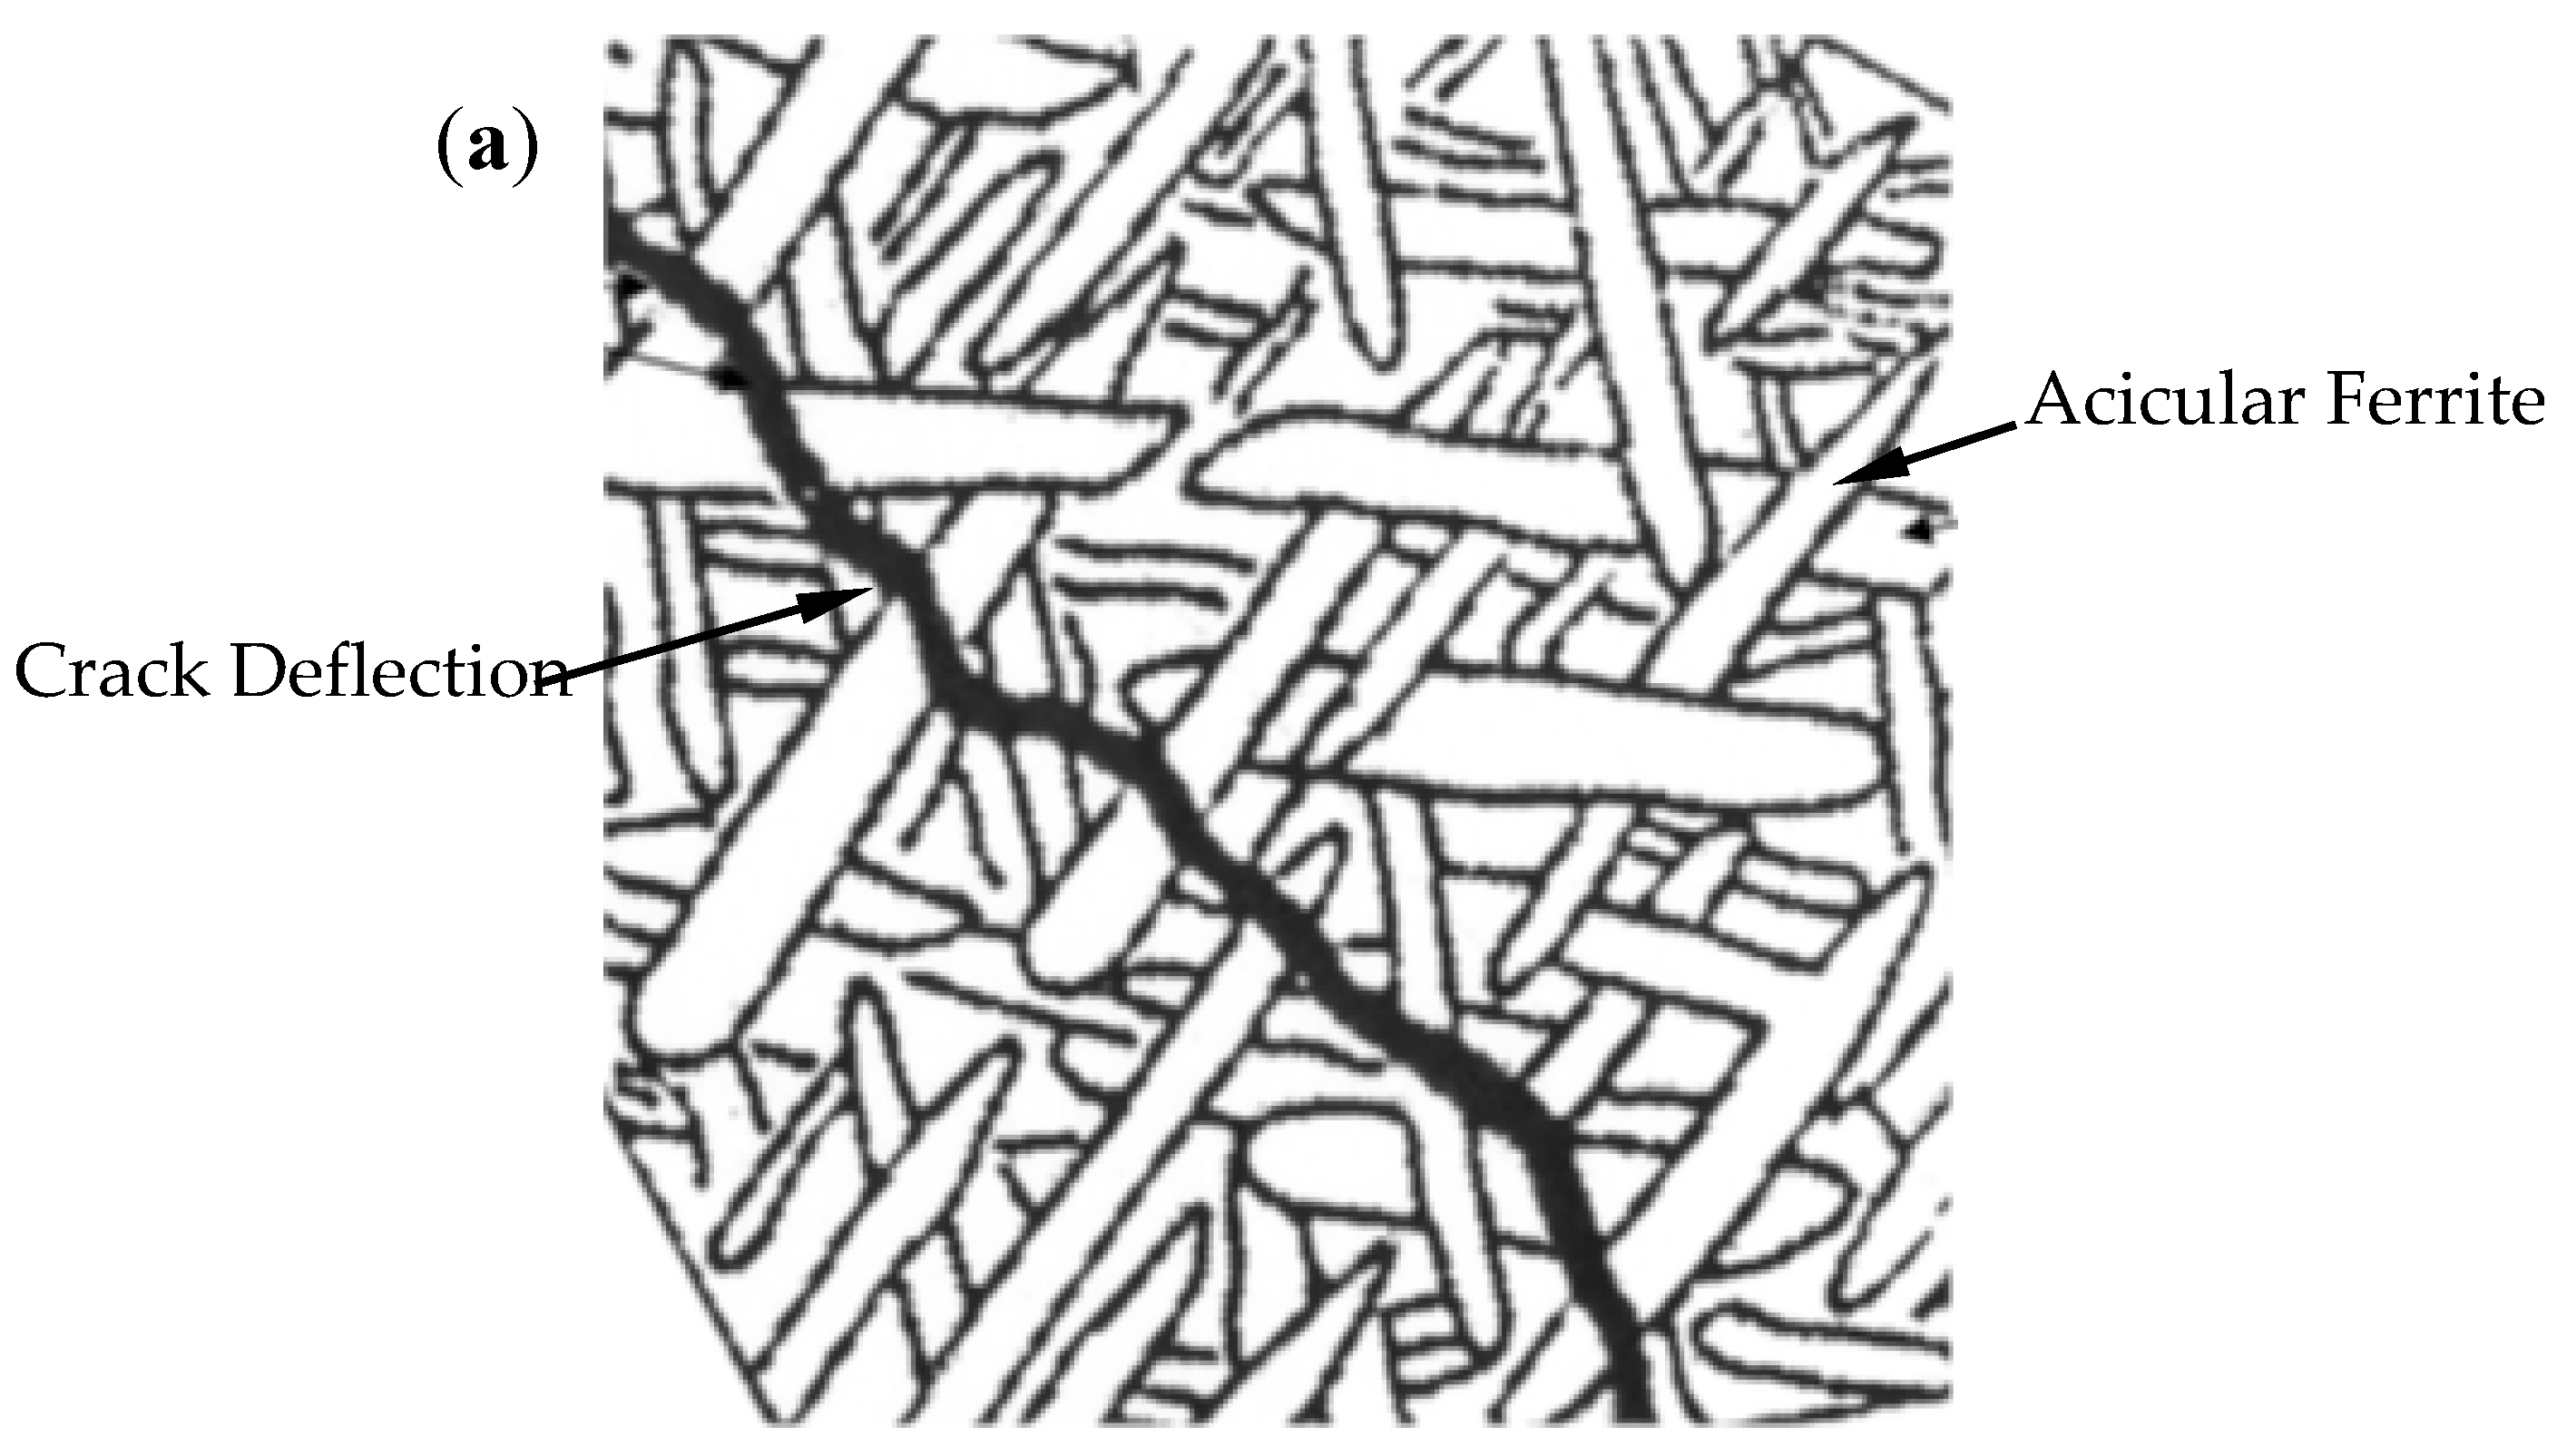

Figure 5.
(a) TEM micrographs showing GB and PF. GB has much higher dislocation density than PF. (b) shows an enlarged view of PF; the arrows show the slight dislocations developed in PF at the interface with M/A and GB. The processing parameters are as that of Figure 4.
Figure 5.
(a) TEM micrographs showing GB and PF. GB has much higher dislocation density than PF. (b) shows an enlarged view of PF; the arrows show the slight dislocations developed in PF at the interface with M/A and GB. The processing parameters are as that of Figure 4.

Figure 6.
Scanning electron micrographs showing the observed types of precipitates together with the EDX-spectrum of the circled precipitates; (a) is (Ti, Nb)(C, N), (b) is NbC and (c) is cementite.
Figure 6.
Scanning electron micrographs showing the observed types of precipitates together with the EDX-spectrum of the circled precipitates; (a) is (Ti, Nb)(C, N), (b) is NbC and (c) is cementite.
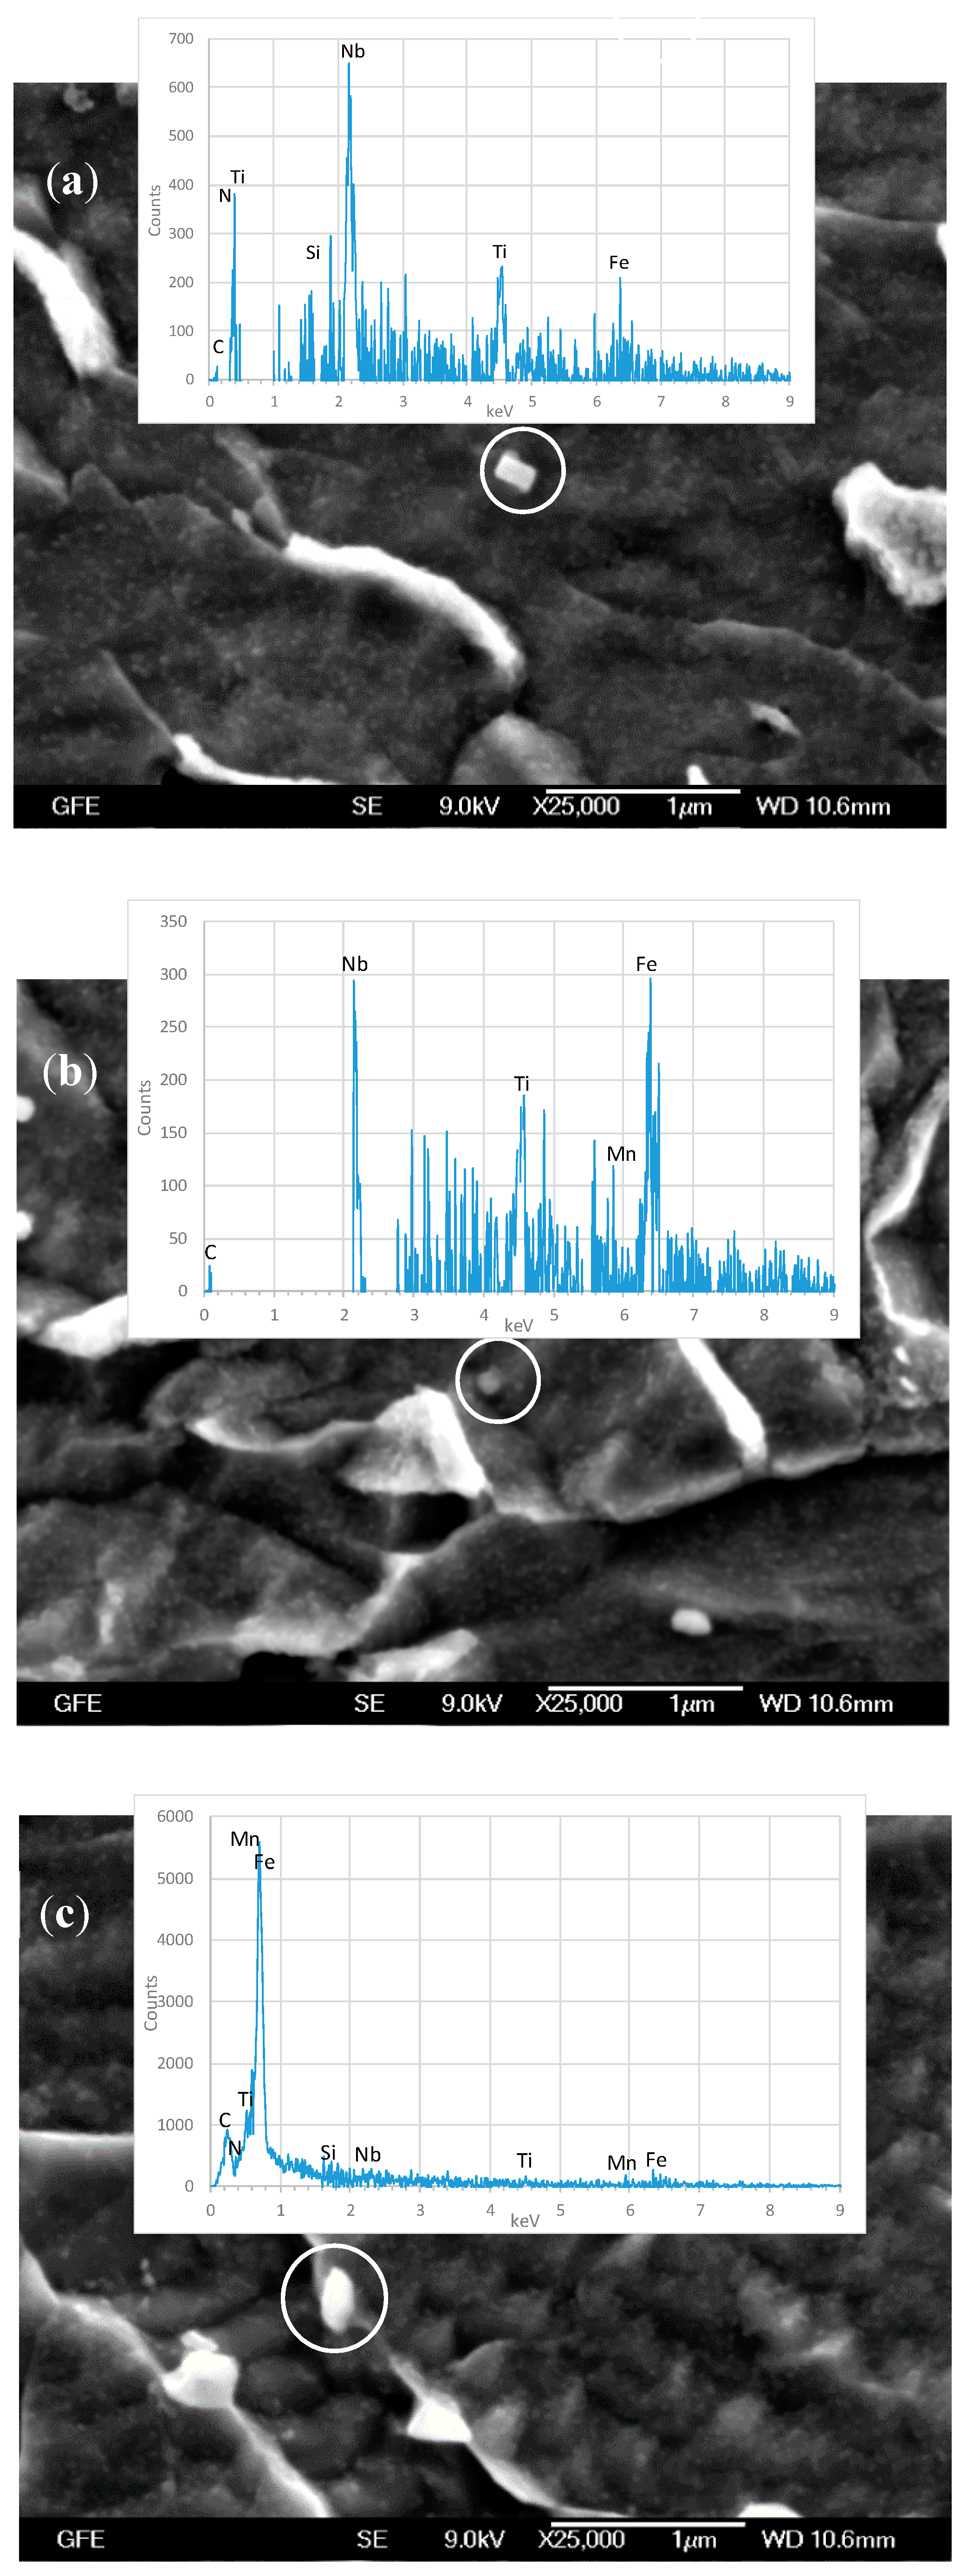
Figure 7.
Scanning electron micrographs of samples processed under the prescribed conditions and having FRT = 780 °C. (a,b) for CT = 500 °C, (c,d) for CT = 350 °C and (e,f) higher magnification images of structure with same processing conditions as that of (d).
Figure 7.
Scanning electron micrographs of samples processed under the prescribed conditions and having FRT = 780 °C. (a,b) for CT = 500 °C, (c,d) for CT = 350 °C and (e,f) higher magnification images of structure with same processing conditions as that of (d).

Figure 8.
Scanning electron micrographs of samples processed under the prescribed conditions and having FRT = 840 °C. (a,b) for CT = 500 °C and (c,d) for CT = 350 °C.
Figure 8.
Scanning electron micrographs of samples processed under the prescribed conditions and having FRT = 840 °C. (a,b) for CT = 500 °C and (c,d) for CT = 350 °C.
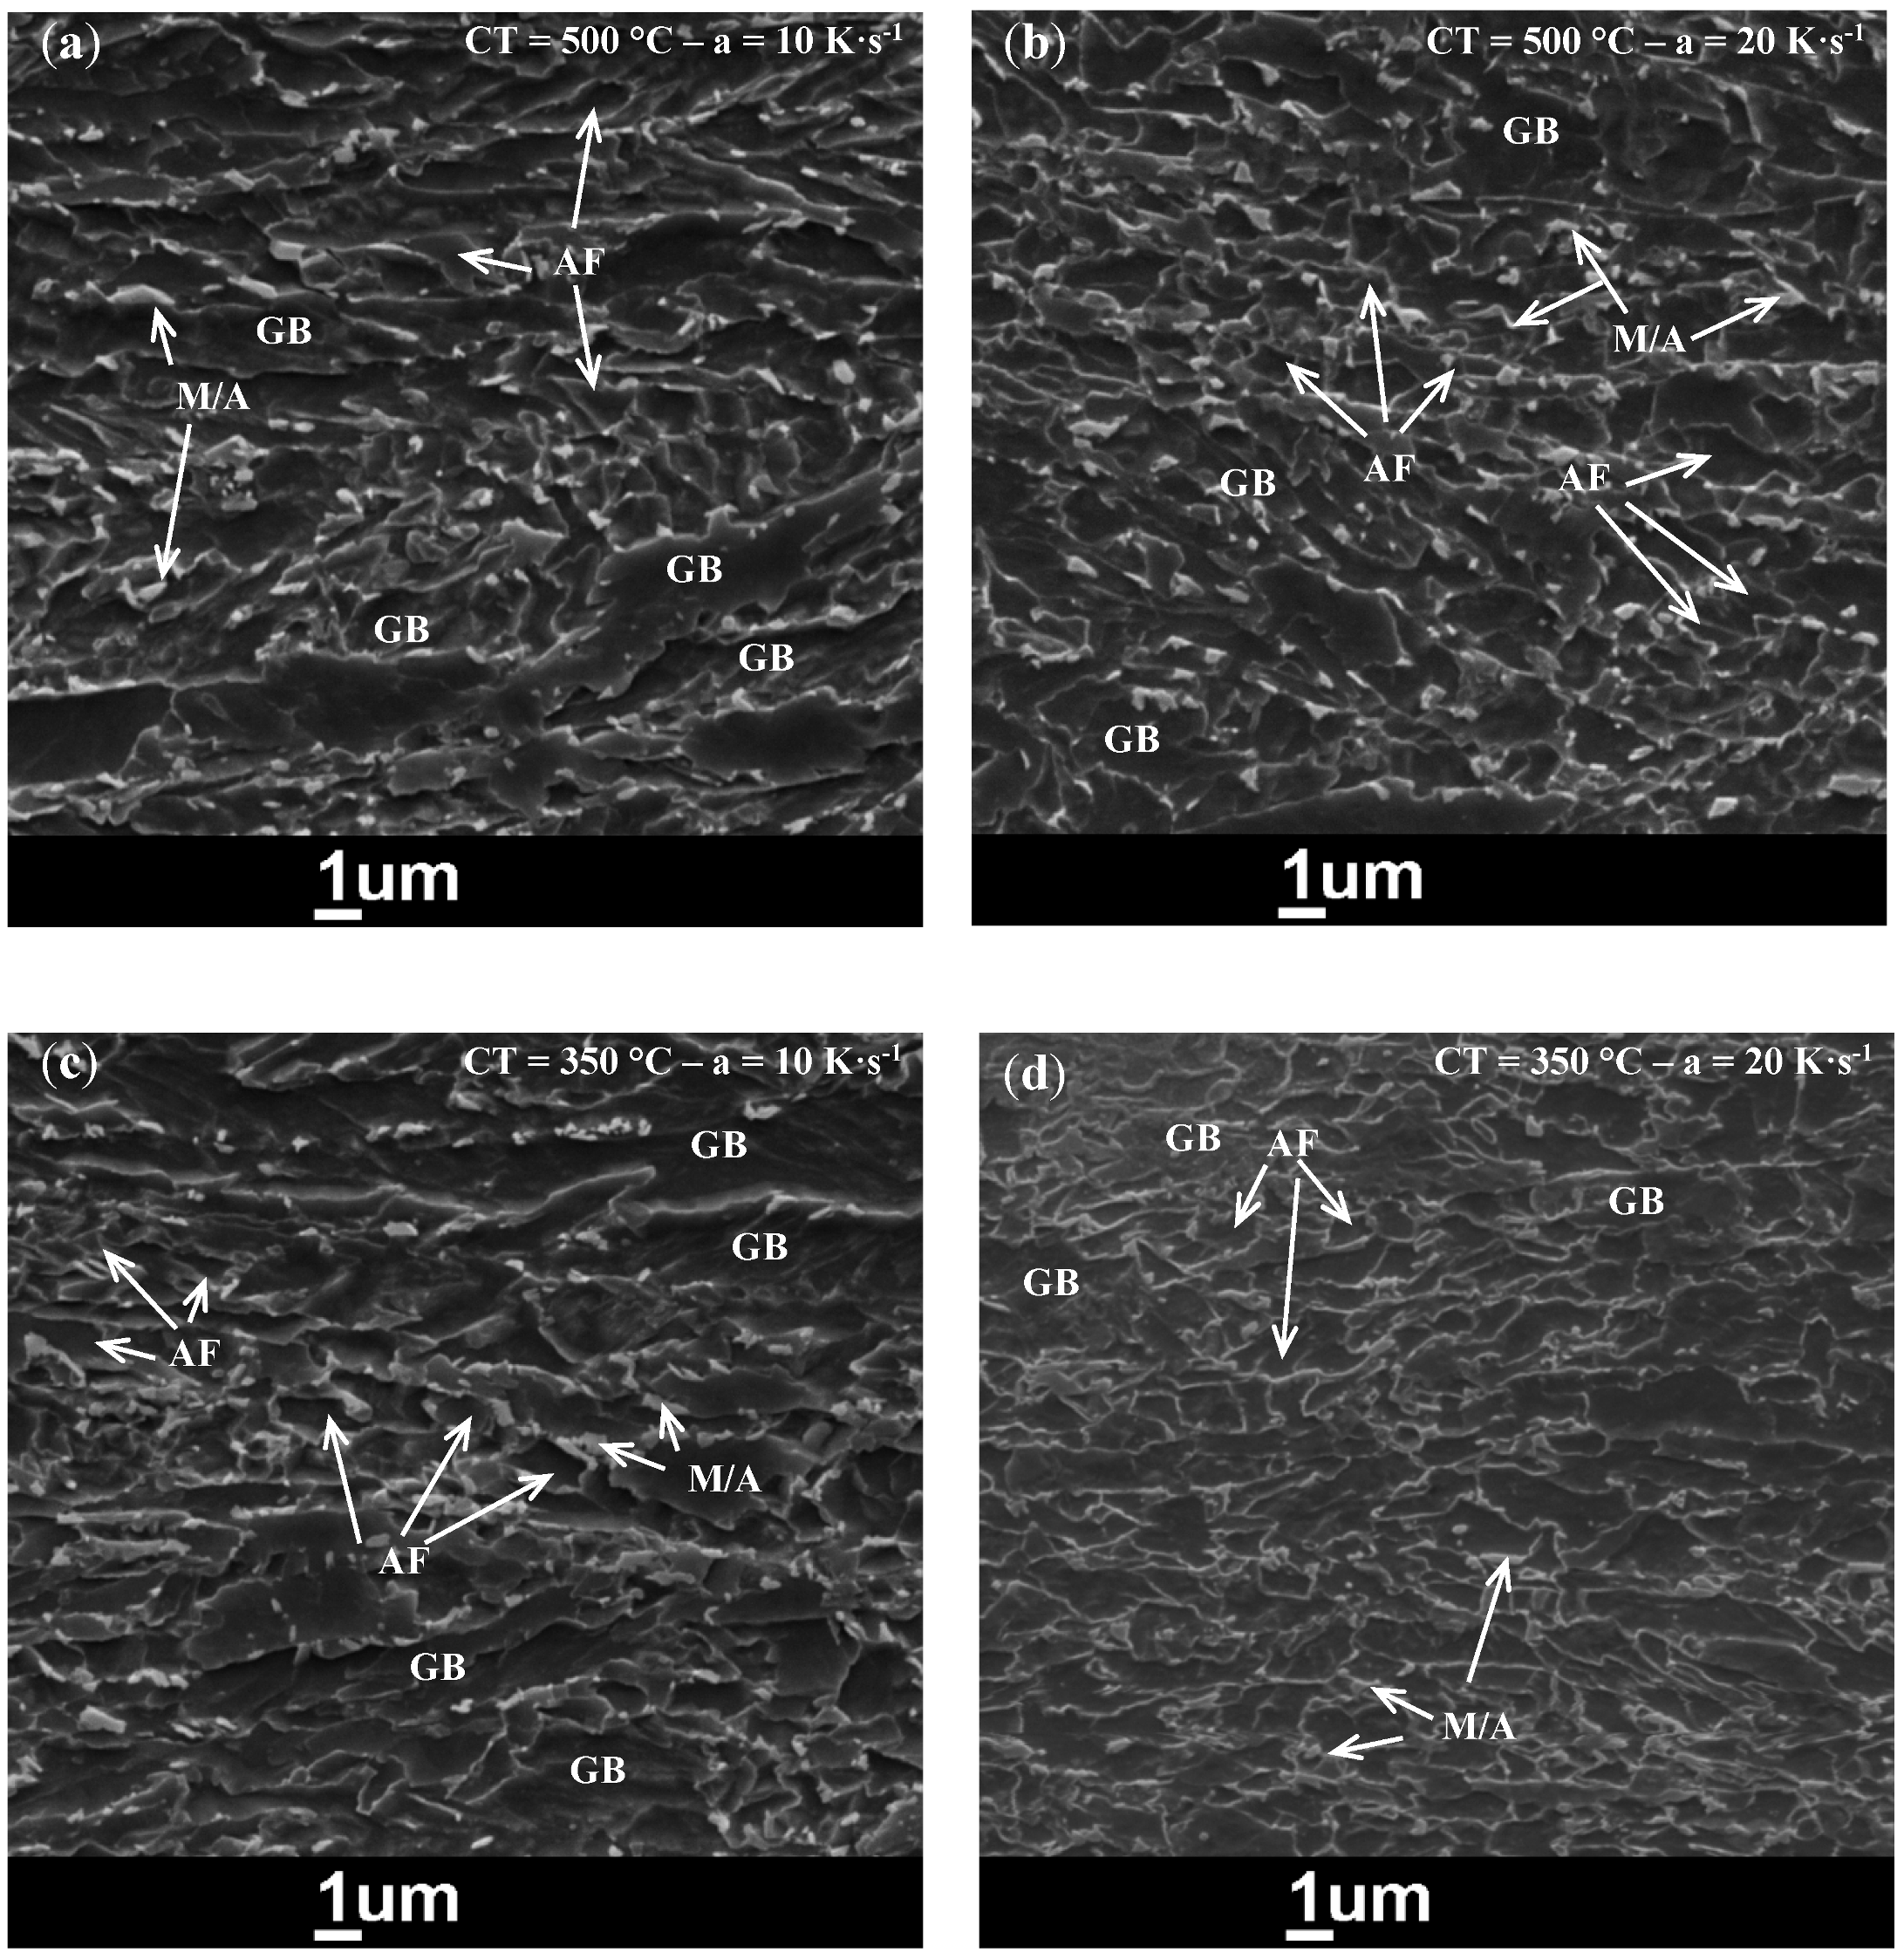
Figure 9.
(a,b) Dilatation curves during continuous cooling of samples processed under the prescribed conditions. (c,d) Dilatation curves observed using Dil 805A/D for undeformed samples and deformed samples according to the TMP with FRT = 840 °C.
Figure 9.
(a,b) Dilatation curves during continuous cooling of samples processed under the prescribed conditions. (c,d) Dilatation curves observed using Dil 805A/D for undeformed samples and deformed samples according to the TMP with FRT = 840 °C.

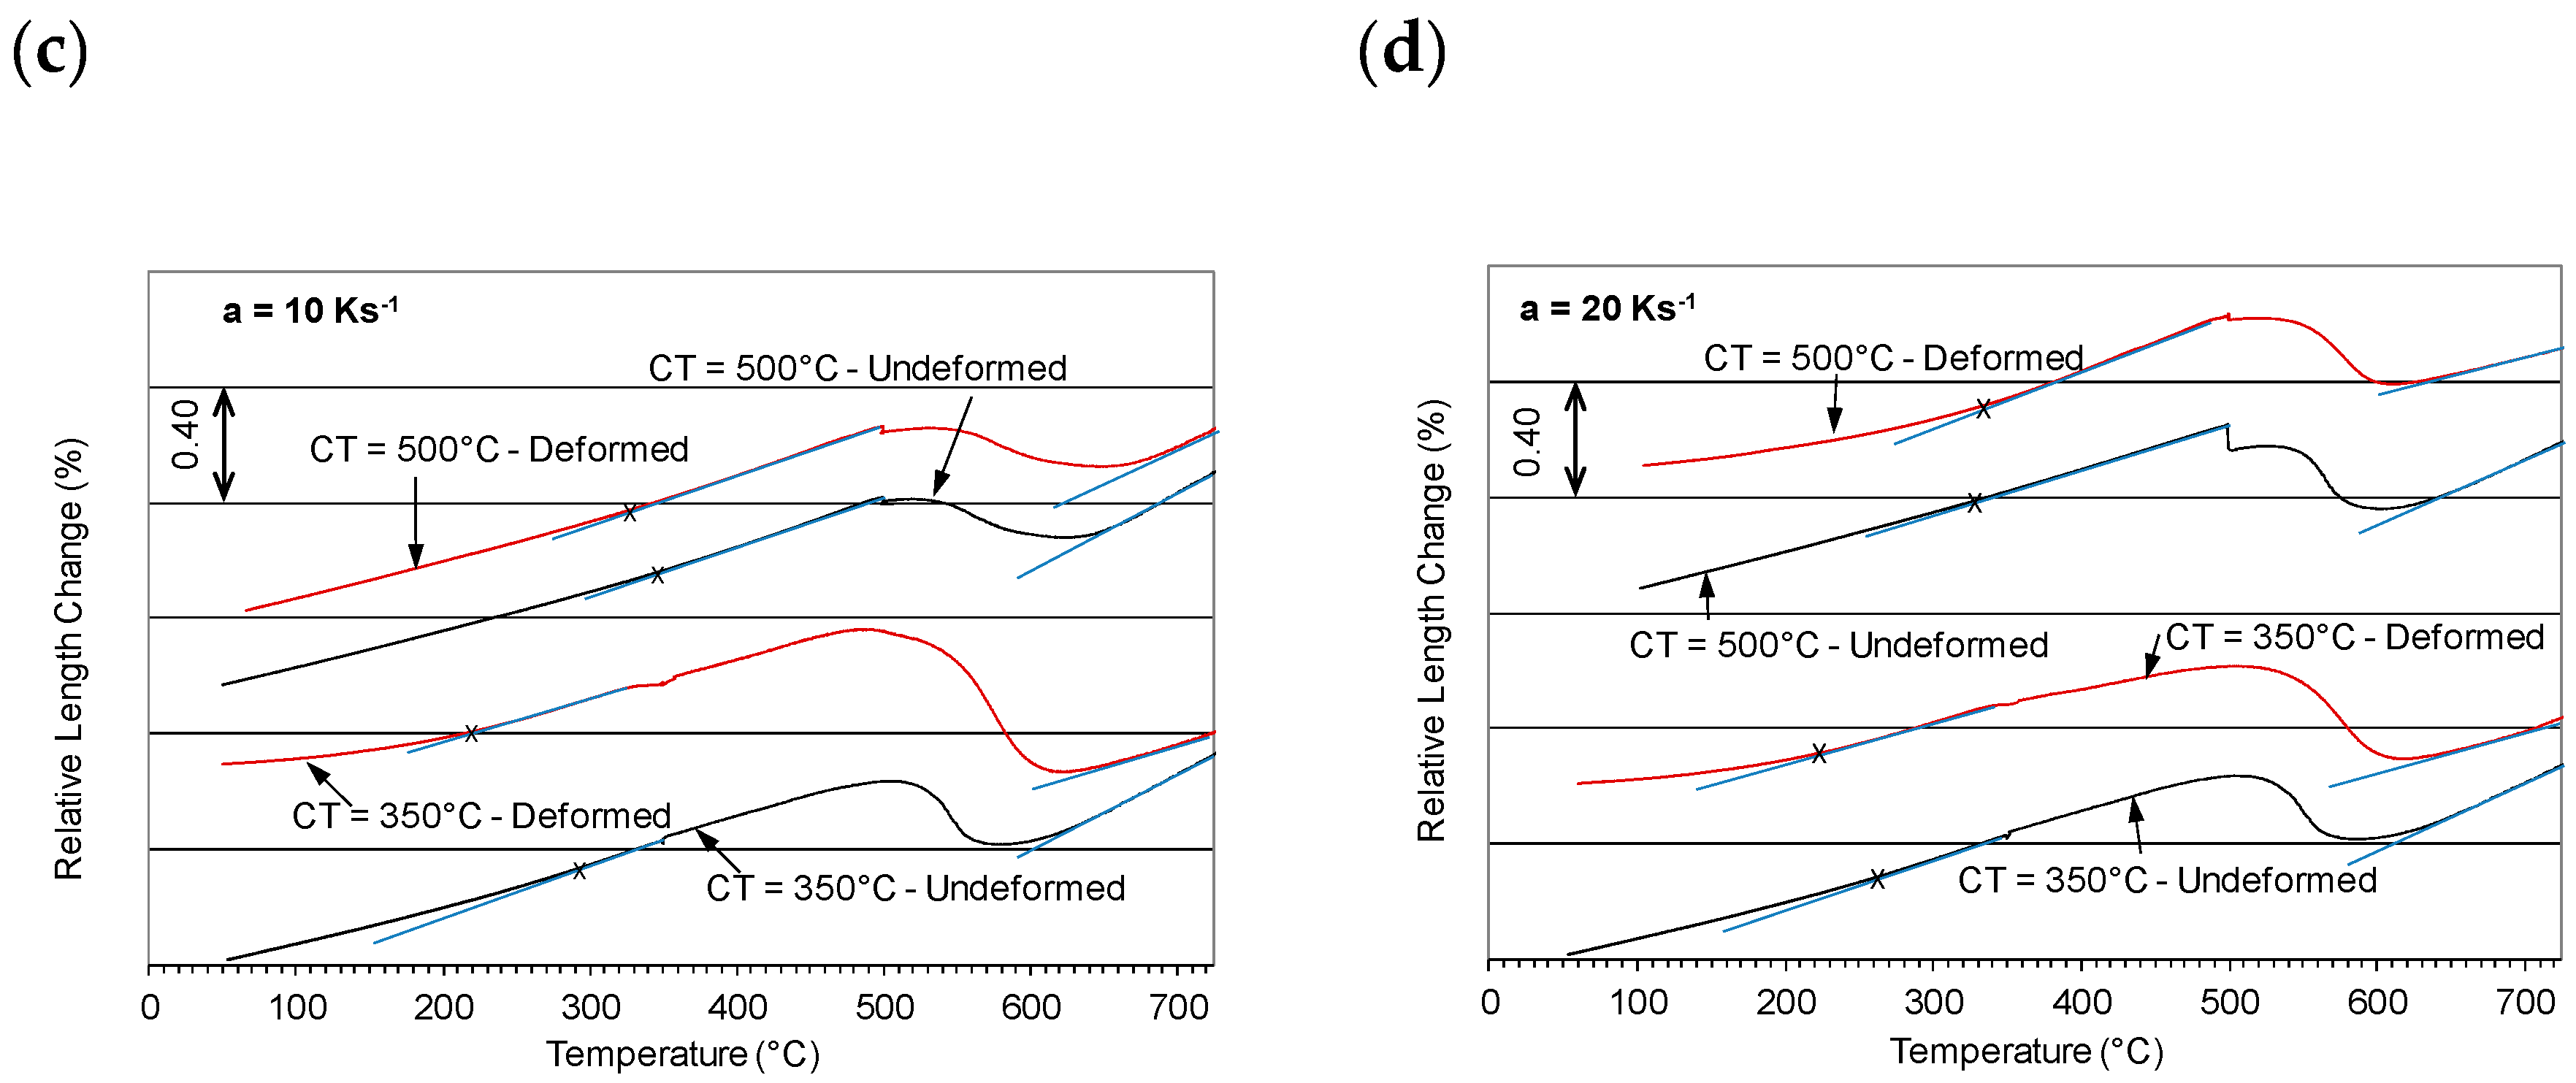
Figure 10.
Predicted precipitates development for steels having FRT = 840 °C using the software MatCalc® and applying the parameters (a) 20 K·s−1-350 °C, (b) 20 K·s−1-500 °C, (c) 10 K·s−1-350 °C and (d) 10 K·s−1-500 °C.
Figure 10.
Predicted precipitates development for steels having FRT = 840 °C using the software MatCalc® and applying the parameters (a) 20 K·s−1-350 °C, (b) 20 K·s−1-500 °C, (c) 10 K·s−1-350 °C and (d) 10 K·s−1-500 °C.
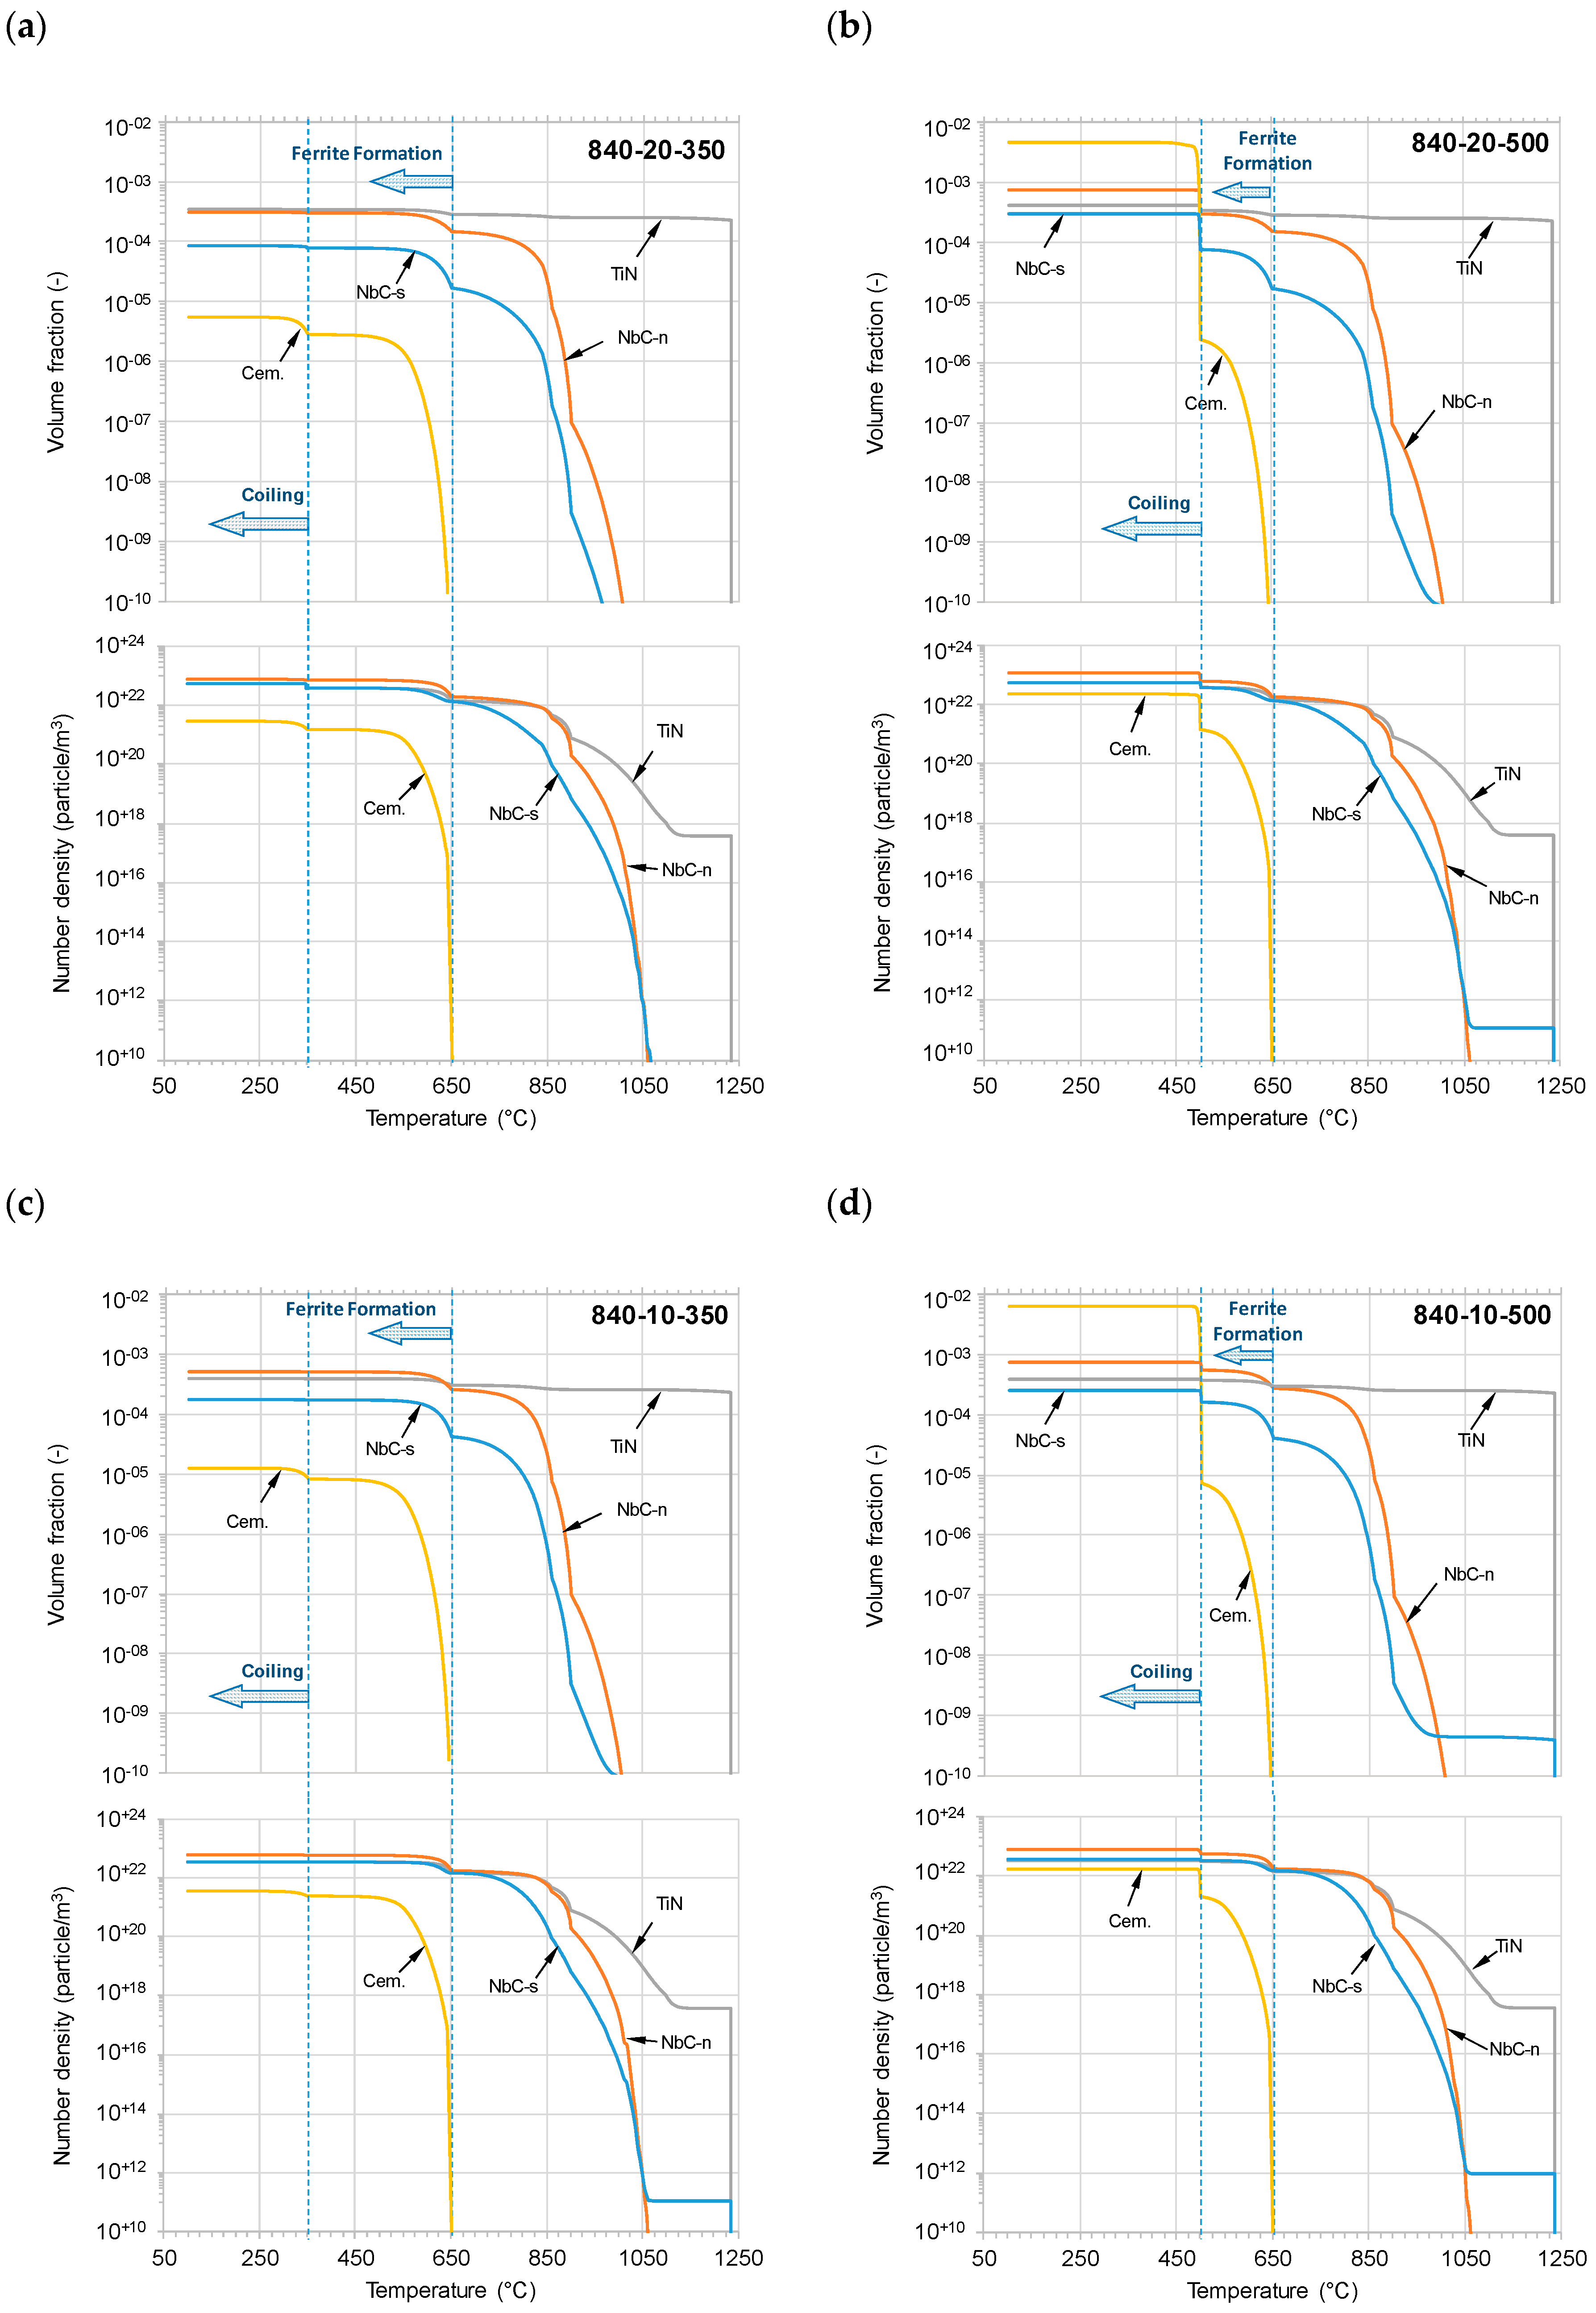
Figure 11.
Predicted precipitation development for steels having FRT = 780 °C using the software MatCalc® and applying the parameters (a) 20 K·s−1-350 °C, (b) 20 K·s−1-500 °C, (c) 10 K·s−1-350 °C and (d) 10 K·s−1-500 °C.
Figure 11.
Predicted precipitation development for steels having FRT = 780 °C using the software MatCalc® and applying the parameters (a) 20 K·s−1-350 °C, (b) 20 K·s−1-500 °C, (c) 10 K·s−1-350 °C and (d) 10 K·s−1-500 °C.

Figure 12.
Stress–strain curves of samples with the prescribed TMP parameters; (a) FRT = 840 °C, (b) FRT 780 °C, (c) a = 10 K·s−1 and (d) a = 20 K·s−1.
Figure 12.
Stress–strain curves of samples with the prescribed TMP parameters; (a) FRT = 840 °C, (b) FRT 780 °C, (c) a = 10 K·s−1 and (d) a = 20 K·s−1.

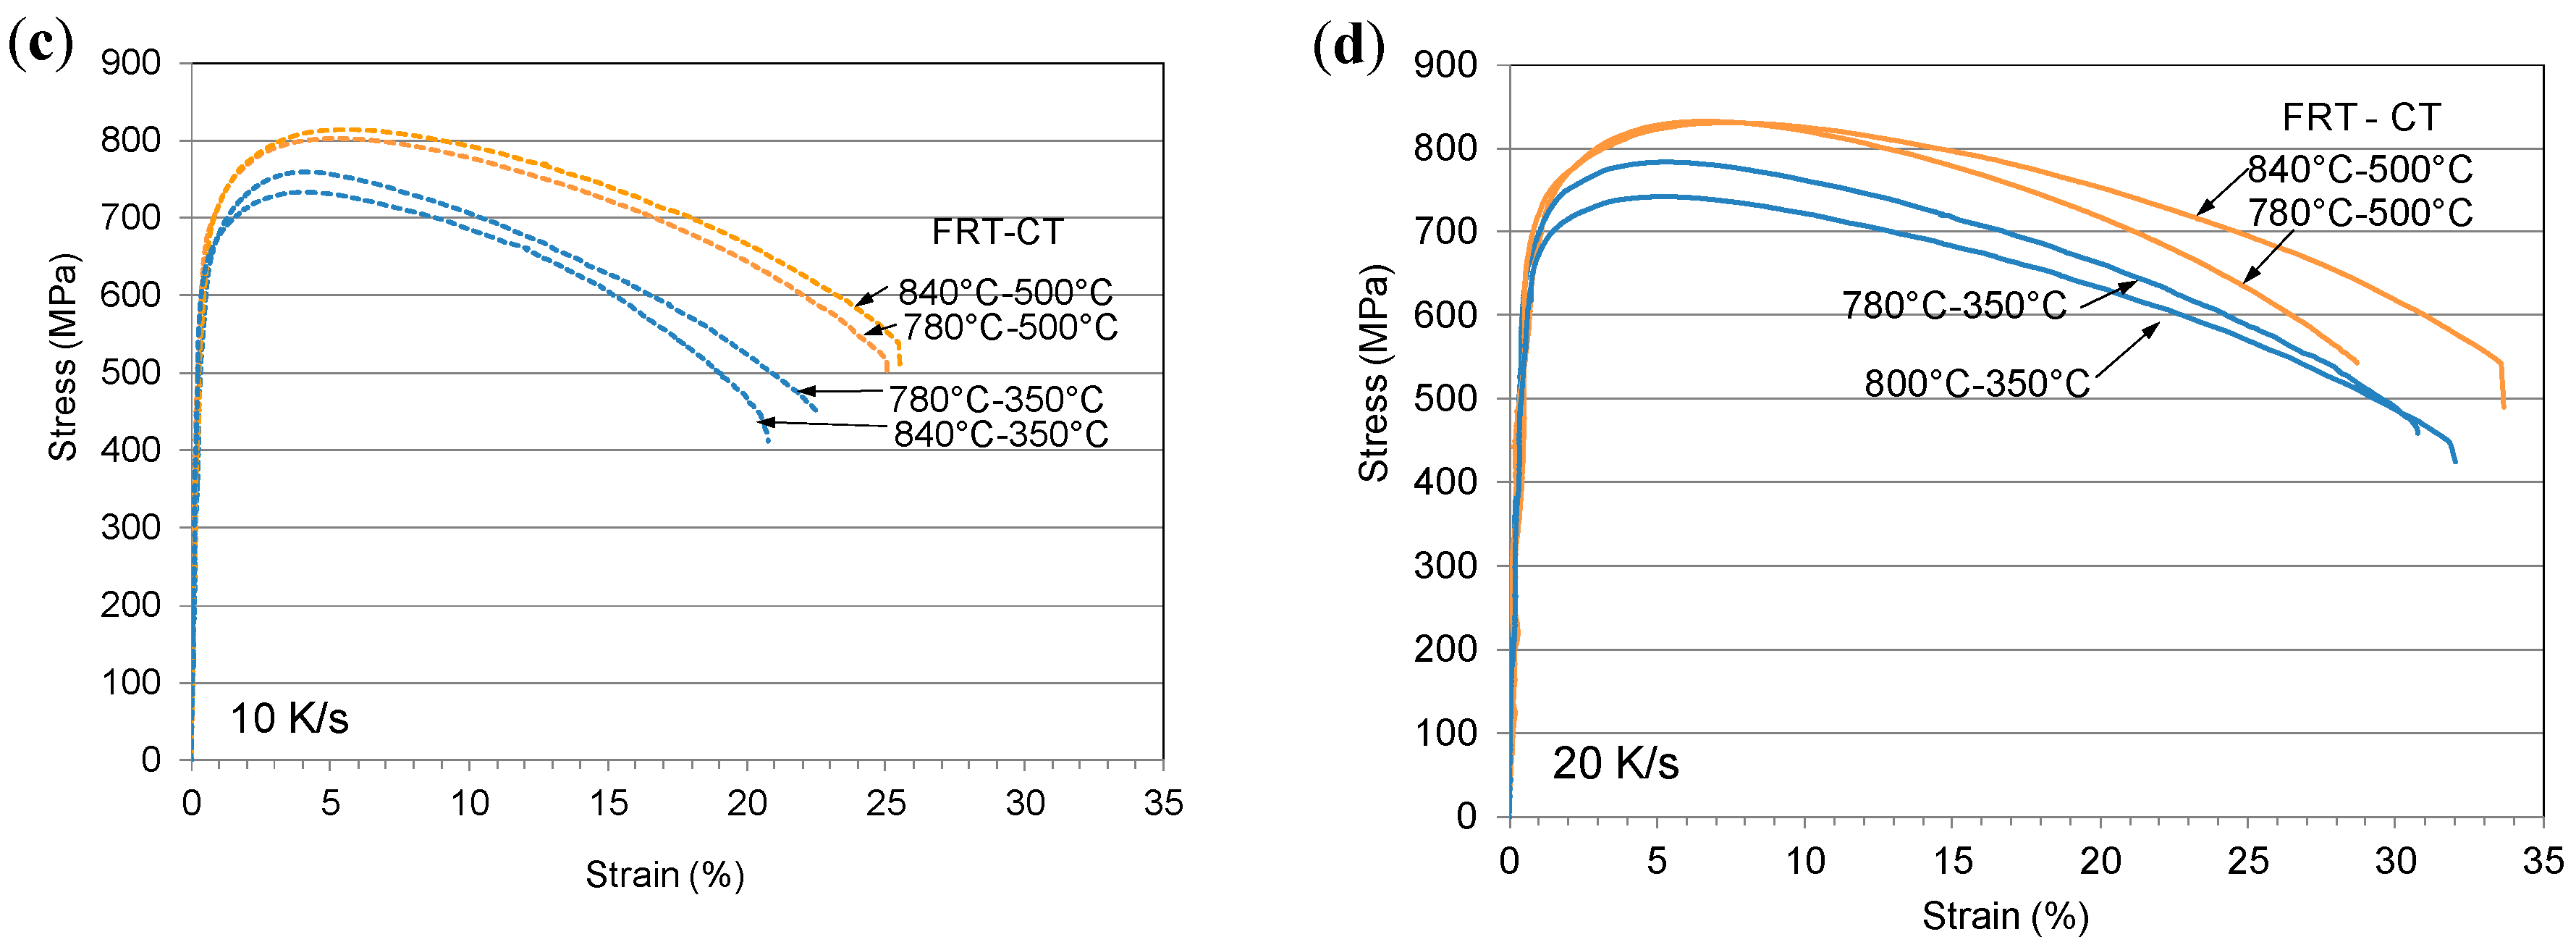
Figure 13.
Stress–strain curves, after strain aging, of samples with the prescribed TMP parameters; (a) FRT = 840 °C, (b) FRT 780 °C, (c) a = 10 K·s−1 and (d) a = 20 K·s−1.
Figure 13.
Stress–strain curves, after strain aging, of samples with the prescribed TMP parameters; (a) FRT = 840 °C, (b) FRT 780 °C, (c) a = 10 K·s−1 and (d) a = 20 K·s−1.

Figure 14.
Precipitation kinetics during aging at 170 °C after 2% pre-straining, predicted using the software MatCalc®. The steel is thermo-mechanically processed prior to strain aging by applying FRT = 840 °C and the “a-CT” parameters of (a) 20 K·s−1-350 °C, (b) 20 K·s−1-500 °C, (c) 10 K·s−1-350 °C and (d) 10 K·s−1-500 °C.

Table 1.
Composition in wt.% of the studied material.
| C | Mn | Si | Mo | Cr | Ti | Nb | N |
|---|---|---|---|---|---|---|---|
| 0.055 | 1.84 | 0.3 | 0.26 | 0.18 | 0.0256 | 0.101 | 0.006 |
Table 2.
The predicted precipitates compositions (in mass fraction) using MatCalc® and considering the processing parameters: FRT = 780 °C, a = 20 K·s−1 and CT = 350 °C.
Table 2.
The predicted precipitates compositions (in mass fraction) using MatCalc® and considering the processing parameters: FRT = 780 °C, a = 20 K·s−1 and CT = 350 °C.
| Element | Ti | Nb | C | Mn | Fe | N |
|---|---|---|---|---|---|---|
| TiN | 0.499 | - | 0.029 | - | - | 0.470 |
| NbC-n | 0.115 | 0.390 | 0.464 | - | - | 0.031 |
| Cementite | - | 0.061 | 0.250 | 0.233 | 0.378 | - |
| NbC-s | 0.115 | 0.392 | 0.466 | - | - | 0.026 |
Table 3.
Strain aging potential (MPa).
| a-Value | 10 K·s−1 | 20 K·s−1 | |||
|---|---|---|---|---|---|
| CT | 500 °C | 350 °C | 500 °C | 350 °C | |
| FRT | |||||
| 840 °C | 32 | 76 | 48 | 79 | |
| 780 °C | 43 | 72 | 30 | 71 | |
Publisher’s Note: MDPI stays neutral with regard to jurisdictional claims in published maps and institutional affiliations. |
© 2020 by the author. Licensee MDPI, Basel, Switzerland. This article is an open access article distributed under the terms and conditions of the Creative Commons Attribution (CC BY) license (http://creativecommons.org/licenses/by/4.0/).
Share and Cite
MDPI and ACS Style
Soliman, M. Microstructural Control and Properties Optimization of Microalloyed Pipeline Steel. Metals 2020, 10, 1499. https://doi.org/10.3390/met10111499
AMA Style
Soliman M. Microstructural Control and Properties Optimization of Microalloyed Pipeline Steel. Metals. 2020; 10(11):1499. https://doi.org/10.3390/met10111499
Chicago/Turabian StyleSoliman, Mohamed. 2020. "Microstructural Control and Properties Optimization of Microalloyed Pipeline Steel" Metals 10, no. 11: 1499. https://doi.org/10.3390/met10111499
Note that from the first issue of 2016, this journal uses article numbers instead of page numbers. See further details here.