Article

Localized Strain Analysis of Ce- and Mg-Treated Cast Iron under Uniaxial Compression

1
Materials Science and Engineering Department, University of Alabama at Birmingham, 1150 10th Avenue South, Birmingham AL-35205, UK
2
Mechanical and Aerospace Engineering Department, University of Alabama at Huntsville, 301 Sparkman Drive, Huntsville AL-35899, UK
*
Author to whom correspondence should be addressed.
Metals 2020, 10(12), 1638; https://doi.org/10.3390/met10121638
Submission received: 8 November 2020 / Revised: 25 November 2020 / Accepted: 1 December 2020 / Published: 5 December 2020
(This article belongs to the Section Metal Casting, Forming and Heat Treatment)

Abstract

:
Cast iron exhibits a wide range of mechanical properties, depending on its microstructural features. The microstructure of cast iron consists of several microconstituents with different elastic-plastic behavior, making the strain non-uniform across the bulk material. To understand the individual effects of these microconstituents on the overall mechanical behavior, local strain analysis using digital image correlation analysis was carried out. Samples with two different compositions (varying cerium, magnesium and silicon) were processed at different solidification velocities in a Bridgman furnace. Sections of the directionally solidified samples were loaded under uniaxial compression to measure global and local strain behavior. Despite the variability of the microstructure, the stress–strain curves obtained by digital image correlation (DIC) were found to react in a well-controlled way to changes in solidification velocity. It was observed that high-strain failure (greater than 15%) was accompanied by local straining of the softer ferritic phase, but during low-strain failure, local straining was not prominent. Higher nodularities, due to higher solidification velocities, raised the compressive strength without affecting the toughness significantly. Higher percentages of carbides led to higher compressive strengths with corresponding losses in ductility. The continuity of the matrix was also found to play an important role in the behavior during compression.

1. Introduction

Cast iron can exhibit a wide range of mechanical properties, depending on the specific microstructure and phases found in the final part [1]. The microstructure of cast iron consists mainly of two microconstituents: the metallic matrix, which is mostly ferritic or pearlitic, and the carbon-rich phases, which can either be graphite or cementite (Fe3C). Furthermore, non-metallic inclusions and pores can also be present. Research on mechanical behavior has shown that increasing the volume fraction of retained austenite (γ) or ferrite (α) increases the toughness and ductility but decreases the strength of the solidified material [2,3]. Having a primarily pearlitic matrix leads to a higher modulus of elasticity and strength [4]. The amount of increase, however, is dependent on the interlamellar spacing of the α-Fe and Fe3C [4]. Fe3C is a relatively hard phase which increases strength but decreases ductility and toughness. The size, morphology and distribution of graphite within the matrix also influences the mechanical properties [5].
The majority of mechanical testing on cast iron, including all of the sources cited in the above paragraph [2,3,4,5,6], were conducted on cast iron samples under tension, where debonding between graphite and matrix occurs during deformation [7,8] and graphite particles act as stress risers which leads to microcrack initiation [9]. Its behavior, however, can be markedly different under compressive loads. Ductile iron exhibits larger flow stresses during compression because of the presence of spheroidal graphite particles and their ability to resist deformation more effectively under compression than tension [10]. Higher compressive strengths were observed for both quasi-static and dynamic strain rates. Compressive strengths have been measured to be 1.3–1.8 times greater than tensile strengths for ductile iron and 2.8–3.4 times greater for gray cast iron [11,12,13]. Other than the study by Yokoyama et al. [10] and Soliman et al. [14], relatively little work has been done on the relationships between microstructure and mechanical behavior of cast iron under compression. Therefore, that is the focus of the current investigation. Solidification of the samples was conducted in a Bridgman-type furnace in order to precisely control both composition and processing conditions (specifically, velocity and thermal gradient). Samples were extracted from the initial melt and cooled with sufficient rapidity for the metal to solidify as white cast iron. As previously demonstrated [15], the presence of carbon as cementite instead of free graphite in the sample prevented flotation of graphite during directional solidification, thereby maintaining a uniform composition throughout the sample.
The microstructure of a typical cast iron product is heterogeneous, which results in complex mechanical behavior of these materials [16]. For this reason, it is difficult to evaluate the ultimate strength of the material by numerical analysis [8]. In this work, analyzing the local deformation behavior via digital image correlation (DIC) addressed the issue of heterogeneity. DIC is a non-contact method of measuring full-field strain of a material under static or dynamic tension, compression or torsion [17]. The fundamental details and history of the technique can be found in [18,19], while practical aspects of implementing DIC into an experiment can be found in a series of articles by Reu starting with [20]. Being able to measure displacements, and subsequently calculate strain, in a non-contact fashion allows for strain measurement of specimens of virtually any size. Physical strain gauges measure strain at the singular location where they were fixed to a specimen. In contrast, measuring strain over an entire surface using DIC allows for the investigation of localization of strain concentration. Digital image correlation is akin to attaching hundreds of miniature strain gauges to the surface; thus, strain localization and regions of failure can be detected. For example, Jacobs et al. quantified localized behavior to understand dynamic strain aging in pipeline steel by using DIC [21]. Microscopic localized strain behavior, such as strain along specific slip systems and twin boundaries, can also be measured when DIC is used in conjunction with a scanning electron microscope [22].
The resulting correlation between solidification conditions, composition, microstructure and mechanical behavior will provide data to the design engineers considering application of cast iron under compression and will add to the library of mechanical property data provided by previous research. Using DIC analysis, this study aims to improve understanding of the deformation behavior of gray and spheroidal cast iron under compression.

2. Materials and Methods

To study the effect of the microstructure on the mechanical properties of cast iron, the processing samples to produce different microstructures was conducted in two steps. The first step was acquiring white cast iron samples from a foundry-grade Fe–C–Si melt. Samples were initially extracted from a 45.4 kg (100 lb) cast iron melt by suction using a bulb attached to a quartz tube. The carbon solidified as cementite due to the fast cooling rate of the melt inside the tubes. Cementite has approximately the same density as liquid iron and thus avoids the issue of graphite flotation during subsequent directional solidification. The samples were acquired in two batches. The first batch, “C”, was extracted from the furnace after the addition of misch metal, which contains cerium, lanthanum and other rare earth metals. The second batch, “M” was extracted after additionally treating the melt with magnesium (Mg) using the sandwich method. After acquiring the samples for batch “C”, the remaining metal was transferred to a ladle where it was poured over a layer of cover steel and Lamet® magnesium-ferrosilicon [23]; batch “M” material was then extracted from the ladle. The composition of each batch is shown in Table 1. Batch “C” contained only cerium as a nodularizing element, whereas batch “M” contained both Ce and Mg. Due to decarburization during processing and the Si increase during the nodularization treatment with magnesium-ferrosilicon, the carbon equivalent CE of the C-batch was approximately as high as the CE of the C-batch. In addition to the effects of the Mg, the extra Si in “M” samples was considered to promote graphitization and suppressed carbide formation.
The second step was processing the samples from each batch in the Bridgman furnace. Each sample was cut to a length of 100 to 120 mm, put in an alumina crucible (inner diameter = 5 mm), and then placed inside the furnace. The hot zone of the furnace was maintained at 1200 °C using a Kanthal APM (“advanced powder-metallurgical”) (Sandvik AB, Hallstahammar, Sweden) resistive heating element. This placed the solid/liquid interface in the adiabatic zone where the thermal gradient was measured to be 5 K/mm. The sample was positioned such that the bottom of it remained in the cold zone, which is a water-cooled copper chill block. The bottom 10–20 mm of the sample was kept unmelted during the initial melting and liquid homogenization (45 min soak) to provide surface for nucleation during solidification. The unmelted section also ensured uniform thermal conduction during processing by helping to maintain a stable thermal gradient at the solid/liquid interface. The furnace was translated upwards, causing the sample to pass through the cold zone and directionally solidify opposite to the gravity vector. During directional solidification, the solidification velocity, v, was varied to obtain different microstructural features. For batch “C” four samples were directionally processed with solidification velocities of 10, 15, 20 and 30 µm/s, referred to as C-10, C-15, C-20 and C-30, respectively. For batch “M”, three samples were directionally processed with solidification velocities of 10, 20 and 30 µm/s (M-10, M-20 and M-30).
After processing, samples were mounted and polished so that the microstructure in the longitudinal direction could be recorded using optical microscopy (Zeiss, Jena, Germany). The micrographs were analyzed to determine the carbide area fraction and nodularity of the graphite particles. Roundness of the graphite particles was calculated using Equation (1), where Agr is the area of a graphite particle and FeretMax is the maximum axis length (maximum Feret diameter) [24]:
R o u n d n e s s   = 4 · A g r π · F e r e t M a x 2
where Agr is the area of a graphite particle and FeretMax is the maximum axis length (maximum Feret diameter) [23]:
Graphite particles were classified into nodular, intermediate and compacted types based on roundness values. A nodular particle is defined to have a roundness between 0.625 and 1, particles with intermediate shapes have roundness between 0.525 and 0.625, and particles below 0.525 are considered compacted or flake. Nodularity was calculated as a relative area using Equation (2) [24],
N o d u l a r i t y   = A N o d u l e s + 0.5 · A I n t e r m e d i a t e s A N o d u l e s + I n t e r m e d i a t e s + C o m p a c t e d
where A is the area of all graphite particles of each type.
Nodularity was chosen as a microstructural feature of importance because Mg and Ce are specifically intended to promote nodular graphite. However, the observed microstructures featured additional graphite shapes [15]; thus the lamellar graphite particles were also visually classified according to their type A-E [25]. A MATLAB® (MathWorks, Natick, MA, USA) code was used to determine the area fraction of the cementite phase in the solidified microstructure of the processed sample. The samples were etched using 50% HCl, which reacted with the pearlite regions in the microstructure but not with the primary carbide or graphite phases. The carbide regions were, therefore, bright enough to be automatically detected and the area fraction of the carbidic region could be determined.
After the quantitative microstructure analysis, a short section was cut from the directionally solidified samples and stress-strain analysis was performed. As previously discussed, DIC was required for this study to assess how microstructure affected strain localization and because the small specimen size made the use of physical strain gauges impractical. Test samples were approximately 9 mm high and 4 mm deep from the front face due to the initial longitudinal polishing of the samples (see Figure 1). The front surface of each specimen was painted white with black speckles using an airbrush with a 0.3 mm needle. Tests were carried out on a servo-hydraulic MTS 370 load frame (MTS Systems Corporation, Eden Prairie, MN, USA) equipped with a 100 kN load cell and 10 cm compression platens. A small layer of DuPont GPL206 lubricant was applied on the specimen’s contact surfaces. Tests were performed under displacement control at a rate of 1 mm/min. Nominal parameters for the DIC measurements are listed in Table 2. Engineering stress–strain diagrams were plotted using the average calculated DIC strain of the speckled surface, excluding the edges. Toughness values were calculated by numerically integrating the area under the stress–strain curve using MATLAB®. Strain contours were examined to relate strain behavior to the microstructure observed with optical microscopy. Finally, additional pieces of each sample were subjected to microhardness measurements, determined as an average of 10–11 indents per rod.

3. Results and Discussions

3.1. Microstructure and Global Strain Analysis

The stress strain curves obtained via DIC are shown in Figure 2. From the curves, toughness and ultimate compressive strength for each sample were determined. These results, along with quantitative microstructural analysis and microhardness measurements, are summarized in Table 3. The plots in Figure 3 show a graphical comparison of the effect of solidification velocity and composition on the microstructure and the mechanical properties of the material under compression. Examples of the different microstructures observed can be seen in Figure 4. M-30 shows a sample with relatively high nodularity, C-10 shows clusters of flake graphite with low nodularity, and C-30 illustrates the situation where most carbon takes the form of carbide, with small regions of indistinctly formed graphite between carbide laths. Additional images and a more detailed description of the microstructure in these samples is presented in [15], which is somewhat different than the microstructure expected from these compositions under normal foundry conditions.
It is of particular note that, for both compositions, the stress–strain curves change in very consistent ways as velocity is adjusted. For batch “C”, an increase in velocity increased ultimate compression stress and decreased ductility. For batch “M”, increasing solidification velocity increased ultimate compression stress and toughness without affecting ductility. The consistency of the response across all measured samples indicates that the results can be reasonably used to draw conclusions about the behavior of the material, at least at a qualitative level, even though only one sample of each condition was tested. The consistency of the mechanical response to velocity also shows that directional solidification in a Bridgman-type furnace is a useful tool for charting out the effect of freezing rate on the mechanical behavior, even in an alloy system as subject to variability as modified cast iron.
In the case of batch “C” samples, the increase in velocity from 10 µm/s to 30 µm/s caused an increase in nodularity from 4% to 9.5%. For the same increase in velocity the carbide fraction increased from 1.67% to 87.8%. For batch “M” samples, the increase in solidification velocity from 10 µm/s to 30 µm/s increased the nodularity from 14.8% to 46.2%. However, the carbide fraction remained low, increasing from 0.03% to only 1.82%. Thus, the effect of increasing carbide content (caused by Ce treatment, i.e., batch “C”) as well as increasing nodularity (caused by Mg treatment, i.e., batch “M”) on the mechanical properties could be independently investigated. Nodularity and carbide area fraction are two competing factors determining the mechanical behavior of cast irons. Typically, increasing the nodularity increases the ductility and toughness of the material, whereas increasing the carbide fraction decreases both the ductility and toughness.
The global stress–strain curves, shown in Figure 2, were used to calculate toughness. It was found that as the solidification velocity of the “C” batch samples increased, toughness decreased as shown in Figure 3d, along with an increase in the ultimate compressive strength of the samples as shown in Figure 3a. This decrease in ductility and toughness can be attributed to the increase in carbide content (Figure 3e). Hence, in this case, the small increase in nodularity (Figure 3f) was overwhelmed by the much larger increase in carbide fraction.
With increasing velocity, the samples from batch “M” also showed an increase in ultimate compressive strength; this increase, however, was much lower than the increase in strength for batch “C” (Figure 3d). The “M” sample at the lowest velocity exhibited higher strength than the “C” sample (1480 MPa vs. 1209 MPa), but at the highest velocity, the “M” sample had a lower strength (1663 MPa vs. 1883 MPa). Also, unlike the Ce treated samples, Mg-treated samples demonstrated high strain before failure even for the sample processed at 30 µm/s as shown in Figure 2b. Retaining high strain behavior caused the toughness of the “M” samples to remain about the same (Figure 3d), even as the strength increased (Figure 3a). The change in behavior of these samples is controlled primarily by the increasing nodularity (see Figure 3c,f) because the carbide fraction for the Mg-treated samples remains too low (Figure 3b,e) to have much influence on the mechanical behavior.
Figure 3g,h compares the microhardness of the pearlitic matrix of the different samples using the Vickers pyramid number (HV). For both batches of samples, the hardness was found to increase with a higher solidification velocity due to an increasing carbon content. While for significant amounts of carbide, a linear correlation of carbide content and hardness can be observed, the nearly equivalent carbon contents of M-20 and M-30 yield similar hardness values. For lower velocities of 10 µm/s and 20 µm/s, the microhardness values for the two compositions were nearly identical. The results show that the changes in composition between the samples did not have much effect on the pearlite matrix. For the batch “M” samples, the effect of velocity was also quite small. However, for the batch “C” sample processed at 30 µm/s, the hardness was significantly higher. This increase in hardness is the result of the high fraction of eutectic cementite (87.8%) in the “C” sample at 30 µm/s (Figure 3h).

3.2. Local Strain Analysis

The samples investigated in this study solidified with complex, multiphase microstructures. The constituents of the microstructure were ferrite, cementite and graphite, each of which has different elastic-plastic behavior and volume fraction in a particular sample. The presence of these various microconstituents makes the local microstructure heterogeneous, which leads to complex local deformation. To understand the effect of individual phases on the strain, the local strain maps acquired from DIC were analyzed. The contours in Figure 4 show the longitudinal strain distribution at 25%, 50%, 75% and 100% of total compression. The value in the scale bar of the strain maps of each sample represents the local strain and it is a negative number because the material is undergoing a decrease in length under compression. Optical micrographs in Figure 4 show the microstructural features where the largest strains are present in the specimen. The presence of flake graphite creates stress risers which ultimately cause deformation of the surrounding matrix.
Samples M-30 and C-10 fractured at higher strain compared to C-20 and C-30. The amount of carbides in M-10 and C-10 were 0.03% and 1.7% which is significantly lower compared to the 15.7% and 87.8% in the C-20 and C-30 samples. However, the morphology and distribution of graphite was different in these two cases which accounts for the difference in strength and toughness. Sample C-10 had colonies of type B flakes forming a rosette pattern. Although the flakes within each colony were interconnected, the colonies themselves were not connected with each other. On the other hand, graphite was distributed more uniformly throughout the entire sample for M-30. Thus, the continuous pearlitic region in sample C-10 allowed higher strain accommodation than the interrupted matrix of M-30. For sample M-10, by overlaying the DIC strain map with the microstructure, it was observed that strain localization originated from a region where the morphology of the graphite particles was flake. As the sample was compressed, the material strained at the pearlitic regions until it failed. Significantly less straining was observed in the regions where the microstructure consisted of flake graphite similar to type D flakes.
Similarly, in C-10, strain originated at the continuous pearlitic regions. Local strain values at these regions were twice those of global strain values at fracture. Both C-20 and C-30 failed at lower strain values with total compression of 26% and 7% respectively. The higher amount of cementite in C-20 and C-30, 15.5% and 87.8% respectively, was responsible for the lower strain and higher strength values. The microstructure and the local strain map of C-10 and C-20 are shown in Figure 4. At 25% of the total compression, sample C-20 showed local straining at the pearlitic regions of the matrix. At 50% and 75% of the total compression the same pearlitic regions experienced higher local straining. Ultimately, failure occurred at the pearlitic regions due to extensive straining. On the other hand, sample C-30 contained austenite dendrites that during cooling transformed into pearlite, interdendritic graphite aggregates and primary plate cementite. During compression, local straining throughout the sample was inhibited by the carbide phase in the matrix. The inhibition to local straining caused strain hardening of the matrix which increased the ultimate compression stress of the sample, but it failed at a relatively low strain of 0.04. It was possible to illustrate using DIC that a continuous pearlitic matrix, even in the presence of flakes, failed at comparatively high strain. A discontinuous matrix inhibited local straining and increased the ultimate compression stress of the material but decreased ductility. Material that failed at very low global strain values experienced less localization of strain.

4. Conclusions

In this work, carefully controlled solidification velocities during directional solidification of two cast iron compositions provided samples with various microstructural features, enabling the study of the influence of these features on the mechanical properties. Global and local strain values under quasi-static compressive loading were measured with DIC. The following conclusions were drawn from the analysis:
  • The mechanical properties of modified cast iron measured by DIC vary in consistent and predictable ways during directional solidification, despite the variability of the microstructure and sensitivity of the system.
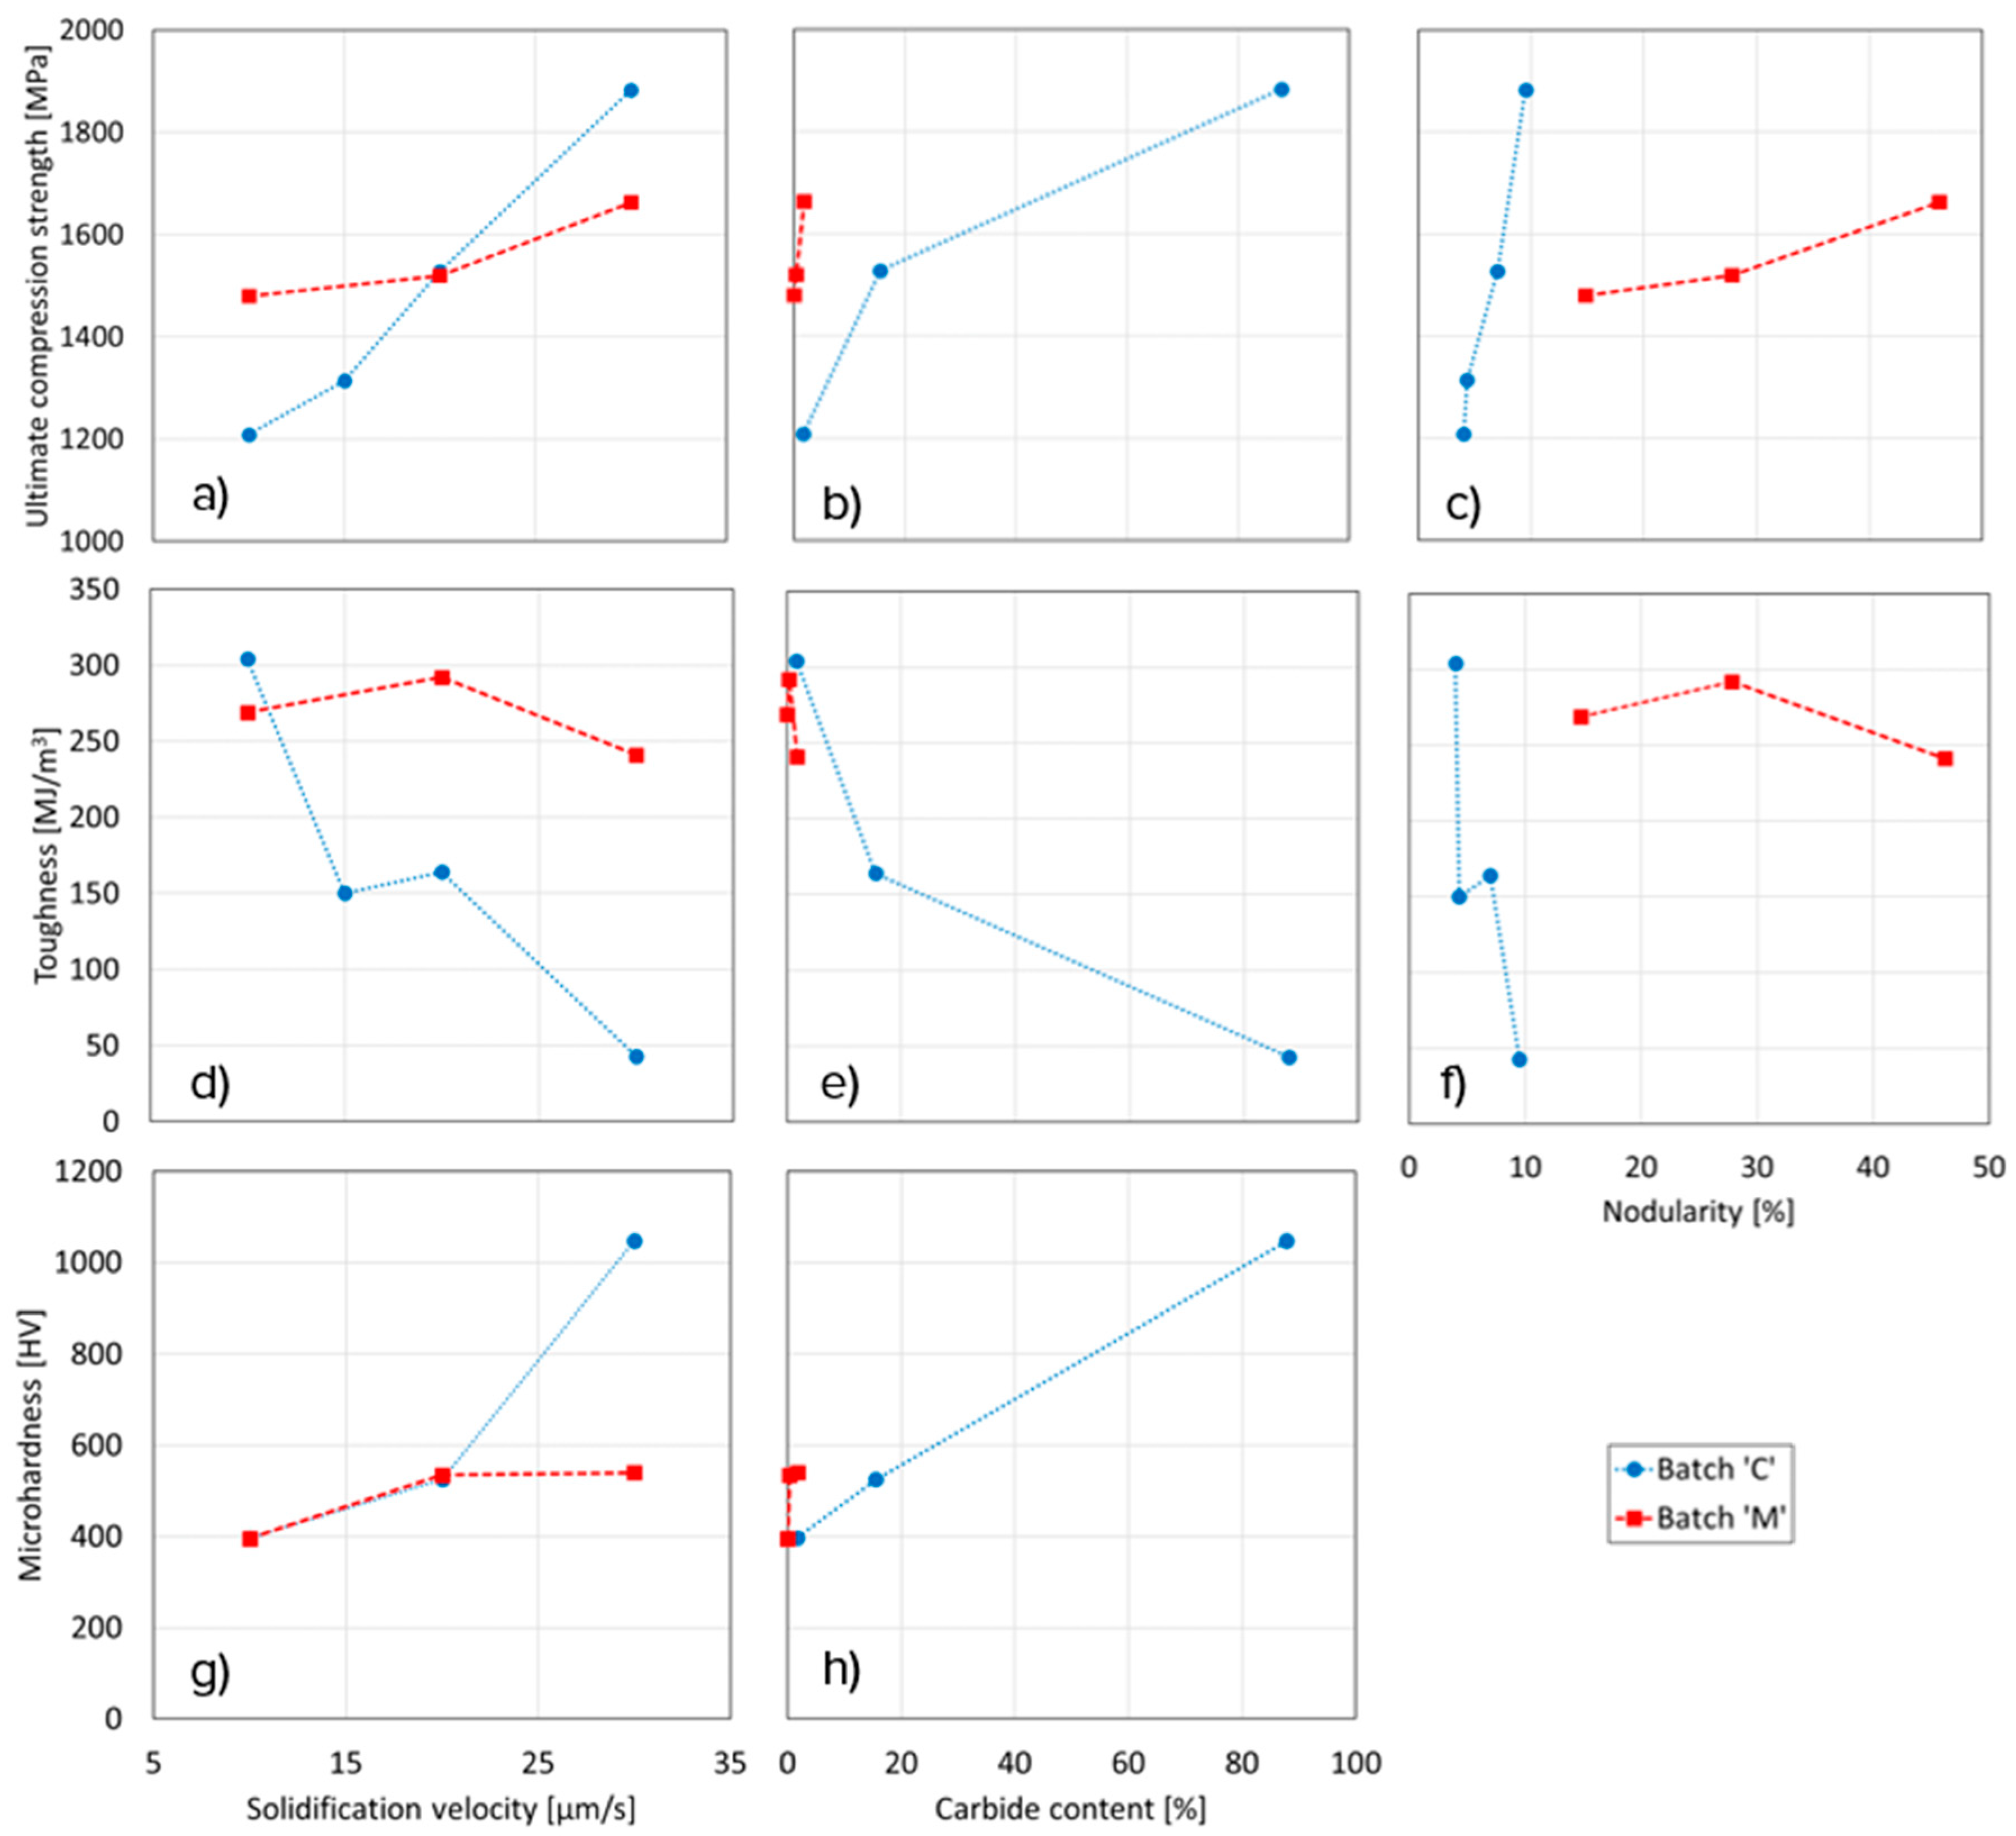
  • DIC measurements also confirmed the known fact that global mechanical behavior was controlled by carbide fraction, graphite morphology and continuity of the pearlitic matrix. Additionally, the carbide fraction and graphite morphology (namely nodularity) was controlled by both the solidification velocity and addition of Ce or Mg to the cast iron.
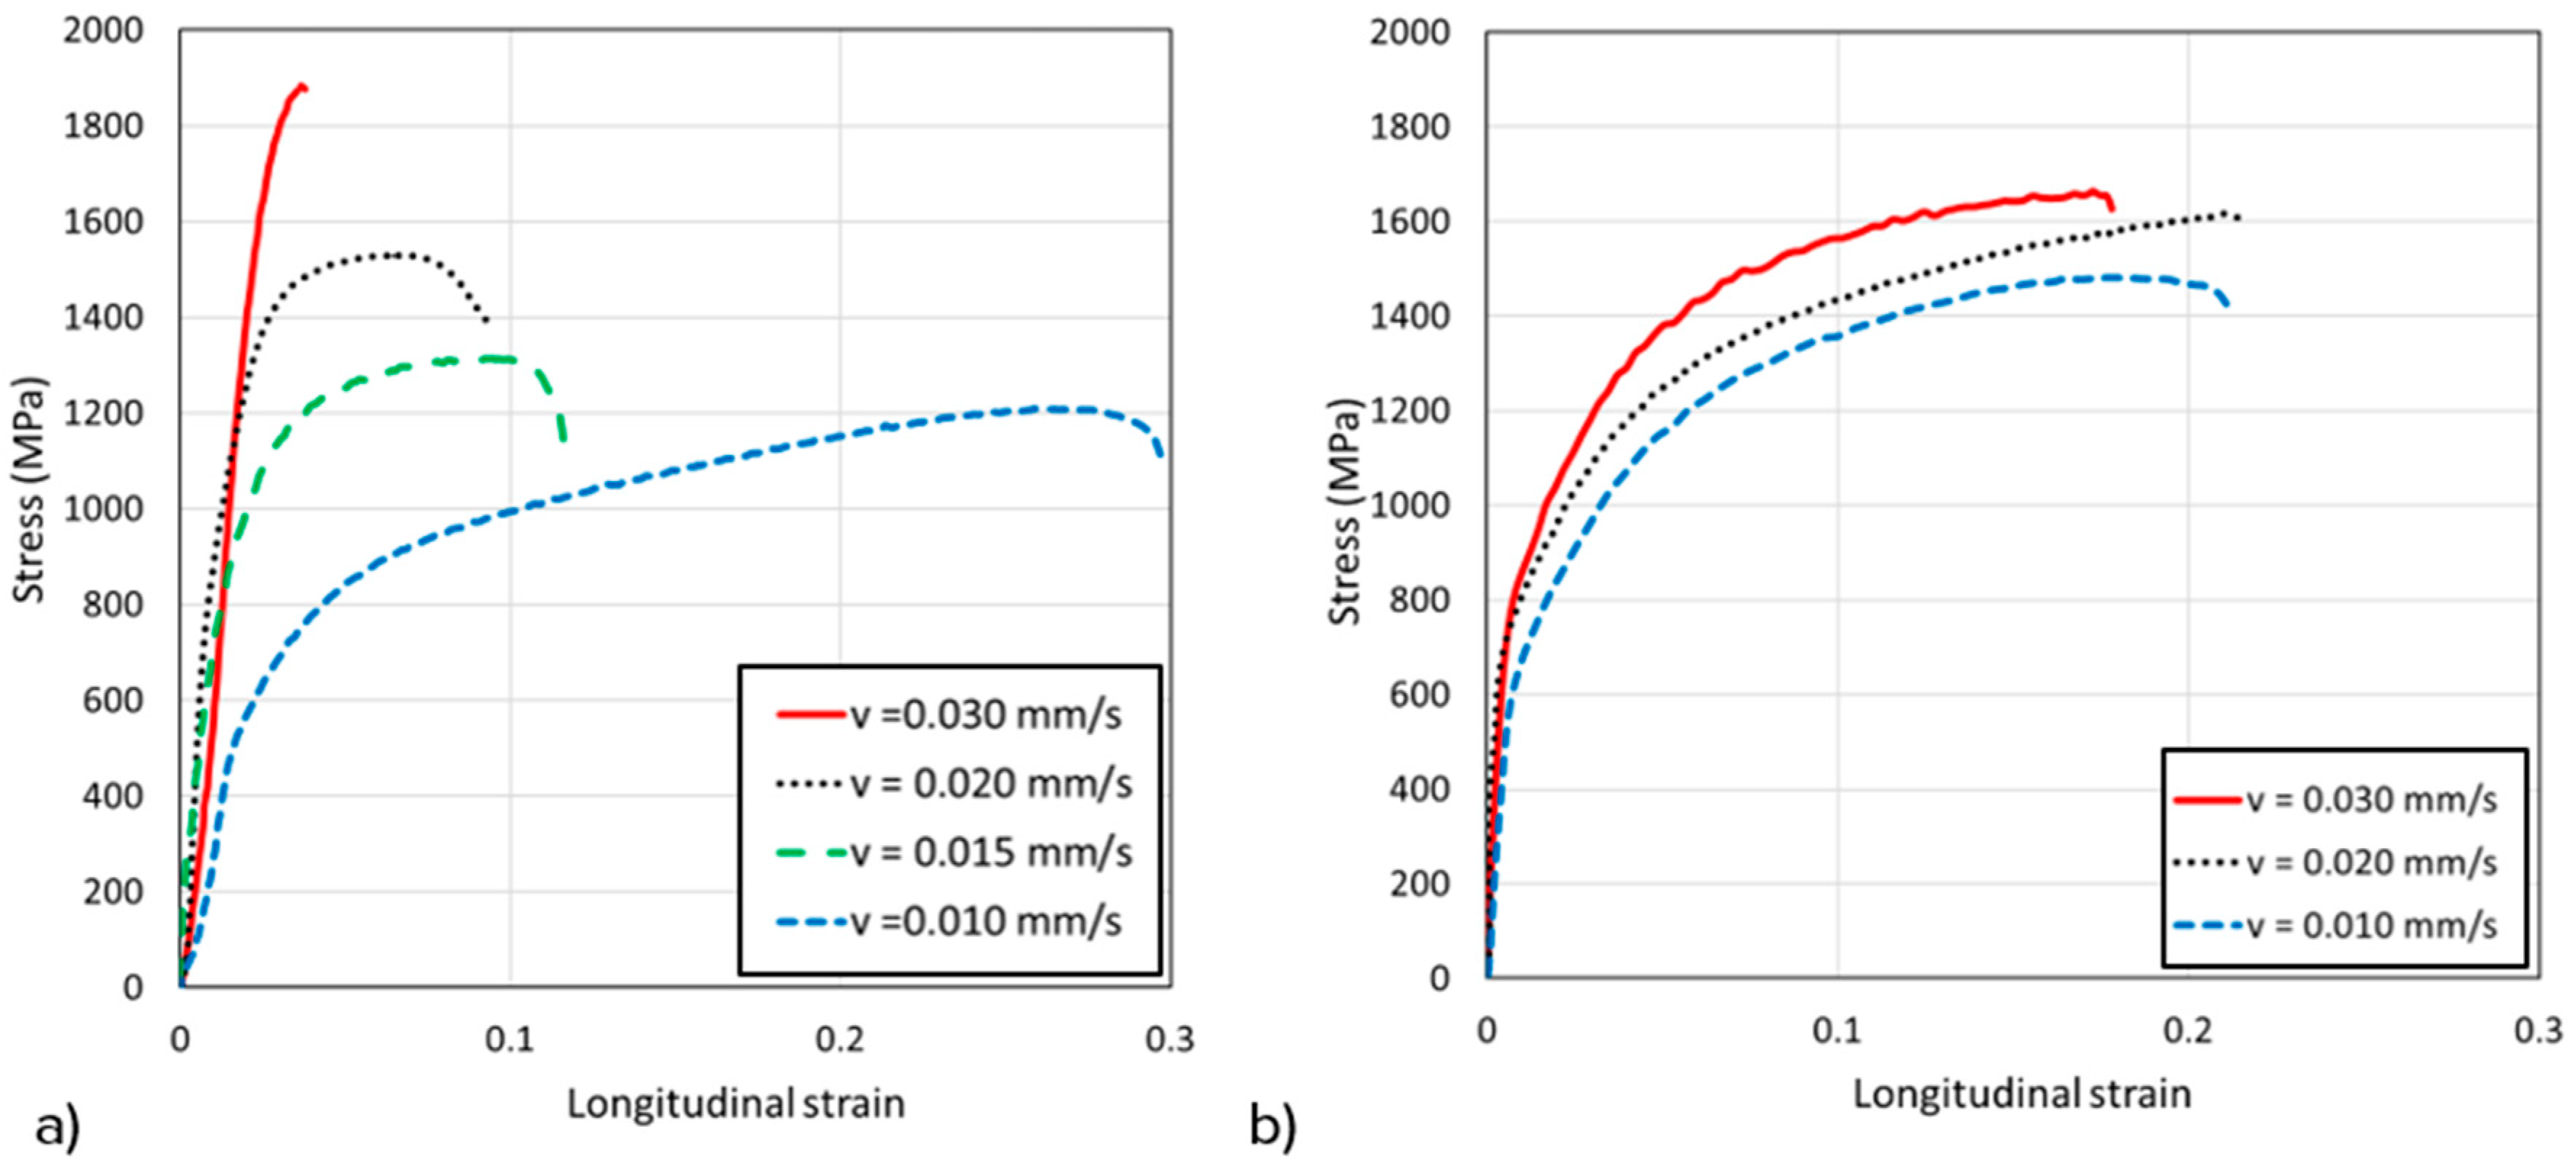
  • Higher carbide content was responsible for the 55% increase in ultimate compressive strength. However, a lack of strain accommodation around the carbide content led to considerably less ductility and toughness relative to the other samples.
  • For samples with both Ce and Mg (batch “M” samples), an increase in solidification velocity resulted in an increase of ultimate compressive strength without a corresponding significant decrease in toughness. The increase in strength was due to the presence of fine type D flake graphite while the ductility was maintained by an increase in nodularity. An increase of nodularity from 14.8% to 46.2% was sufficient to maintain toughness as the ultimate compression stress increased from 1480 MPa to 1663 MPa.
  • High-strain failure occurred by local straining in specific locations of the microstructure. However, in the case of low-strain failure, strain was more homogenously distributed throughout the matrix.

Author Contributions

Conceptualization and methodology, S.C., K.H., A.L.G.; experimental investigation, S.C. and J.I., data analysis, S.C., J.I., P.S., A.L.G.; resources, A.G. and K.H.; writing—original draft preparation, S.C. and J.I.; writing—review and editing, A.L.G., P.S., J.F., J.I.; visualization, S.C., J.I., J.F.; supervision, A.L.G., K.H.; project administration, A.L.G.; funding acquisition, A.L.G., K.H. All authors have read and agreed to the published version of the manuscript.

Funding

Initial melts were prepared at the UAB Materials Processing and Application Development Center (MPAD) as part of project DE-EE0005980 through the Department of Energy and Caterpillar Inc. Additional project support was provided by NSF CAREER #1554856.

Acknowledgments

Microhardness measurements were performed by Harrison Stevens.

Conflicts of Interest

The authors declare no conflict of interest.

References

  1. Stefanescu, D.M. 30 Years of modeling of microstructure evolution during casting solidification. In Proceedings of the Materials and Technologies-4th International Conference on Materials and Manufacturing Technologies, MATEHN’06, Cluj-Napoca, Romania, 21–23 September 2007; Volume 23, pp. 9–16. [Google Scholar]
  2. Aranzabal, J.; Gutierrez, I.; Rodriguez-Ibabe, J.M.; Urcola, J.J. Influence of the amount and morphology of retained austenite on the mechanical properties of an austempered ductile iron. Met. Mater. Trans. A 1997, 28, 1143–1156. [Google Scholar] [CrossRef]
  3. Bayati, H.; Elliott, R. Relationship between structure and mechanical properties in high manganese alloyed ductile iron. Mater. Sci. Technol. 1995, 11, 284–293. [Google Scholar] [CrossRef]
  4. Davis, J.R. ASM Speciality Handbook: Carbon and Alloy Steels; ASM International: Almere, The Netherlands, 1996; Volume 9. [Google Scholar]
  5. Voort, G.F.V. ASM Handbook: METALLOGRAPHY and Microstructures; ASM International: Almere, The Netherlands, 2004. [Google Scholar]
  6. Alp, T.; Wazzan, A.A.; Yilmaz, F. Microstructure-Property Relationships in Cast Irons. Arab. J. Sci. Eng. Sect. B Eng. 2005, 38, 163–175. [Google Scholar]
  7. Dong, M.J.; Berdin, C.; Beranger, A.S.; Prioul, C. Damage Effect in the Fracture Toughness of Nodular Cast Iron. Le J. Phys. Colloq. 1996, 6, 65–74. [Google Scholar] [CrossRef]
  8. Yamaguchi, T.; Kimura, Y. Compression characteristics of spheroidal graphite cast iron pipe members. High Perform. Optim. Des. Struct. Mater. 2014, 137, 455–463. [Google Scholar] [CrossRef] [Green Version]
  9. Di Cocco, V.; Iacoviello, F.; Cavallini, M. Damaging micromechanisms characterization of a ferritic ductile cast iron. Eng. Fract. Mech. 2010, 77, 2016–2023. [Google Scholar] [CrossRef]
  10. Yokoyama, T.; Takata, T.; Sogabe, Y. Impact Testing of Ductile Cast Iron: Tension and Compression; American Society of Mechanical Engineers: New York, NY, USA, 1995; Volume 300, pp. 121–127. [Google Scholar]
  11. Klubberg, F.; Beiss, P.; Broeckmann, C. Schwingfestigkeit von Gusseisen mit Lamellengraphit. Giesserei-Praxis Fachzeitschrift für alle Bereiche der Gießereitechnik. Gießtechnik Motorenbau 2009, 60, 153–158. [Google Scholar]
  12. German Institute for Standardization. DIN EN 1563:2019-04: Founding-Spheroidal Graphite Cast Irons; German Version EN 1563; German Institute for Standardization: Berlin, Germany, 2018. [Google Scholar]
  13. German Institute for Standardization. DIN EN 1561:2012-01: Founding-Grey Cast Irons; German Version EN 1561; German Institute for Standardization: Berlin, Germany, 2011. [Google Scholar]
  14. Soliman, M.; Nofal, A.; Palkowski, H. Alloy and process design of thermo-mechanically processed multiphase ductile iron. Mater. Des. 2015, 87, 450–465. [Google Scholar] [CrossRef]
  15. Chakraborty, S.; Gadkari, S.; Steinmetz, P.; Monroe, C.A.; Genau, A.L. Evolution of Microstructure in Directionally Solidified Cast Iron Treated with Cerium and Magnesium. Metall. Mater. Trans. A 2019, 50, 2922–2932. [Google Scholar] [CrossRef]
  16. Willidal, T.; Bauer, W.; Schumacher, P. Stress/strain behaviour and fatigue limit of grey cast iron. Mater. Sci. Eng. A 2005, 413–414, 578–582. [Google Scholar] [CrossRef]
  17. Dante Dynamics, “Digital Image Correlation (DIC)”. Available online: www.dantecdynamics.com/solutions-applications/solutions/stress-strain-espi-dic/digital-image-correlation-dic/ (accessed on 30 August 2018).
  18. Sutton, M.A.; Orteau, J.J.; Schreier, H. Image Correlation for Shape, Motion and Deformation Measurements-Basic Concepts Theory and Applications; Springer: New York, NY, USA, 2009. [Google Scholar]
  19. Sutton, M.A.; Matta, F.; Rizos, D.; Ghorbani, R.; Rajan, S.; Mollenhauer, D.H.; Schreier, H.W.; Lasprilla, A.O. Recent Progress in Digital Image Correlation: Background and Developments since the 2013 W M Murray Lecture. Exp. Mech. 2017, 57, 1–30. [Google Scholar] [CrossRef]
  20. Reu, P. Introduction to digital image correlation: Best practices and applications. Exp. Tech. 2012, 36, 3–4. [Google Scholar] [CrossRef]
  21. Jacobs, T.; Matlock, D.K.; Findley, K.O. Characterization of localized plastic deformation behaviors associated with dynamic strain aging in pipeline steels using digital image correlation. Int. J. Plast. 2019, 123, 70–85. [Google Scholar] [CrossRef]
  22. Stinville, J.C.; Vanderesse, N.; Bridier, F.; Bocher, P.; Pollock, T.M. High resolution mapping of strain localization near twin boundaries in a nickel-based superalloy. Acta Materialia 2015, 98, 29–42. [Google Scholar] [CrossRef]
  23. Elkem, “Lamet nodulariser”. Available online: https://www.elkem.com/foundry/foundry-and-steel-products/nodularisers/lamet-nodulariser-ladle-grades (accessed on 18 July 2018).
  24. International Organization for Standardization. ISO 16112: Compacted (Vermicular) Graphite Cast Irons-Classification; International Organization for Standardization: Geneva, Switzerland, 2017. [Google Scholar]
  25. ASTM International. ASTM A247: Standard Test Method for Evaluating the Microstructure of Graphite in Iron Castings; ASTM International: West Conshohocken, PA, USA, 2019. [Google Scholar]
Figure 1. Specimen orientation and digital image correlation (DIC) imaging plane relative to loading direction. The DIC camera is positioned normal to the imaging plane.
Metals 10 01638 g001
Figure 2. Engineering stress–strain curve for samples processed at varying solidification velocities for samples from (a) batch “C” (showing the effect of increasing carbide percentage resulting in a transition from ductile to brittle behavior) and (b) batch “M” (showing the effect of increased nodularity resulting in more ductile behavior). The curves were obtained under compression.
Metals 10 01638 g002
Figure 3. Correlation of ultimate compression strength (first row: a--c), toughness (middle row: d--f) and microhardness (bottom row: g,h) from the solidification velocity (first column: a,d,g), carbide content (middle column: b,e,h) and nodularity (last column: c,f).
Metals 10 01638 g003
Figure 4. Local strain distribution of M-30, C-10, C-20 and C-30 at 25%, 50%, 75% and 100% of their respective total compression. The optical microscope images show the region of the specimen where strain localization and failure initiated.
Metals 10 01638 g004
Table 1. Chemical composition of the investigated samples in wt% (CE: carbon equivalent).
Batch TypeCSiMnSPCrCeMgCE
“C”3.941.150.590.0080.0490.1970.03-4.32
“M”3.652.040.590.0080.0470.1940.020.044.33
Table 2. DIC (Correlated Solutions Inc., Irmo, SC, USA) parameters.
ItemSpecification
Camera5MP GS3-U3-51S5M-C Point Grey Camera
LensNavitar 1-60135 zoom lens
Image Scale198 pixels/mm
DIC SoftwareCorrelated Solutions VIC-2D
Correlation AlgorithmNormalized Square Differences
Subset Size25 pixels
Step Size8 pixels
Strain Window5 pixels
Virtual Strain Gauge Size33 pixels (170 µm)
Displacement Uncertainty0.035 pixels
Strain Uncertainty370 με (Lagrange)
Table 3. Microstructure parameters and compression properties.
Solidification Velocity
(µm/s)
Carbide (%)Nodularity (%)Ultimate Compressive
Strength (MPa)
Microhardness
(HV)
Toughness
(MJ/m3)
CMCMCMCMCM
101.7 ± 0.20.03 ± 0.014.014.81209 ± 351480 ± 40397 ± 43396 ± 31304 ± 9269 ± 7
2015.5 ± 1.90.4 ± 0.17.027.81528 ± 431520 ± 40525 ± 27535 ± 46164 ± 3292 ± 8
3087.8 ± 4.31.8 ± 0.49.546.21883 ± 531663 ± 451047 ± 74540 ± 3643 ± 2241 ± 8
Publisher’s Note: MDPI stays neutral with regard to jurisdictional claims in published maps and institutional affiliations.

