Abstract
This work has focused on the study of hot working behavior of Ti-Nb microalloyed steels with high Ti contents (> 0.05%). The role of Nb during the hot deformation of low carbon steels is well known: it mainly retards austenite recrystallization, leading to pancaked austenite microstructures before phase transformation and to refined room temperature microstructures. However, to design rolling schedules that result in properly conditioned austenite microstructures, it is necessary to develop models that take into account the effect of high Ti concentrations on the microstructural evolution of austenite. To that end, in this work torsion tests were performed to investigate the microstructural evolution during hot deformation of steels microalloyed with 0.03% Nb and different high Ti concentrations (0.05%, 0.1%, 0.15%). It was observed that the 0.1% and 0.15% Ti additions resulted in retarded softening kinetics at all the temperatures. This retardation can be mainly attributed to the solute drag effect exerted by Ti in solid solution. The precipitation state of the steels after reheating and after deformation was characterized and the applicability of existing microstructural evolution models was also evaluated. Determined recrystallization kinetics and recrystallized grain sizes reasonably agree with those predicted by equations previously developed for Nb-Ti microalloyed steels with lower Ti concentrations (<0.05%).
1. Introduction
The steel industry is under continuous pressure to improve the mechanical properties of steel while simultaneously decreasing its price. Due to this, there is a permanent need for the development of new steel compositions, and when possible, adapted processing parameters. In low carbon steels, tailored mechanical properties can be obtained by adding microalloying elements, such as Nb, V or Ti. Nb leads to retarded softening kinetics during hot deformation [1,2,3]. As a result, if adequately designed rolling strategies are applied, deformed austenite microstructures before phase transformation and refined room temperature microstructures with improved mechanical strength can be obtained [4,5,6]. Ti, in conventional concentrations (<0.025%), results in the formation of TiN precipitates at very high temperatures, even during solidification. Models have been developed to predict the amount of these precipitates in both binary and multicomponent alloys [7,8,9]. If adequate in size and volume fraction, these precipitates can prevent austenite grain growth during reheating and after recrystallization and also provide room temperature microstructural refinement [10]. V is added due to the nanometer-sized precipitates that are formed during and/or after phase transformation, which results in precipitation hardening [11]. To some extent, Ti and Nb can also lead to a similar effect [12,13,14]. In the case of Ti, the large hardening potential of high Ti additions (>0.05%) that occur due to precipitation during or after phase transformation has been long known [15], although this has not been conventionally applied at industrial scale.
However, over the last years, the use of high Ti additions has attracted increasing interest. Many works have investigated the mechanical properties of these types of steels and shown that it is possible to produce high precipitation hardening contributions and yield strength values over 700 MPa [16]. High Ti additions are typically used in combination with other microalloying elements, such as Mo, V or Nb [17,18,19]. In a previous work, very high precipitation hardening contributions, over 300 MPa, were estimated for a 0.1% Ti–0.03% Nb steel at some of the coiling simulation conditions investigated [20]. This suggests that high Ti-Nb microalloying can be an interesting alternative to achieve steels with very high mechanical strength. In good agreement with these results, yield strengths of 700 MPa have been reported for industrially produced high Ti-Nb microalloyed steels [21].
However, in addition to the effect of precipitation, another factor to consider for high Ti-Nb steels is the supplementary grain size hardening effect that can be attained if pancaked austenite microstructures are obtained before phase transformation. Microstructural evolution models can be a good tool for evaluating and designing rolling schedules that result in such austenite conditioning. However, to use the models, it is necessary to have experimental data and develop equations that consider the effect that Ti and Nb have on the austenite microstructure evolution. Many works have studied the effect of these elements on the austenite recrystallization, grain growth or strain-induced precipitation kinetics [1,2,3,22,23]. However, most of them have focused on conventional Ti additions, while the data on high Ti steels is very scarce and mostly concentrated on the study of TiC precipitation during hot deformation. For instance, Akben et al. [24] investigated the effect of Mn on the dynamic precipitation kinetics of 0.1%Ti steels, while Liu et al. [25,26] and Wang et al. [27,28] analyzed the strain-induced precipitation behavior of different high Ti steels. However, none of these works considered high Ti-Nb microalloying combinations. It is necessary to take into account that, even for conventional additions, complex interactions have been observed in the precipitate dissolution behavior or precipitation kinetics when both Nb and Ti are present [29]. In the presence of Ti and Nb, it has been observed that they are mutually soluble and the precipitation of coarse particles starts at very high temperatures as (Ti,Nb)N. Okaguchi et al. [30] provided some data on the composition of undissolved precipitates in high Ti-Nb steels and studied the strain-induced precipitation kinetics of a 0.05% Ti–0.02% Nb steel. However, information about the effect of high Ti on other austenite microstructural evolution mechanisms, such as recrystallization or austenite grain growth, is scarcer. Taking this into account, the aim of this work was to characterize the austenite microstructure evolution processes that occur during hot deformation in 0.03% Nb microalloyed steels with high Ti concentrations (0.05%, 0.1%, 0.15%). Different types of torsion tests were performed to study the recrystallization kinetics in these steels. In addition, quenched samples were characterized to analyze the recrystallized microstructures, the grain growth kinetics and the morphology of the precipitates present after reheating and after deformation. The applicability of available microstructural evolution models for these steels was also considered.
2. Materials and Methods
The composition of the steels investigated is detailed in Table 1. All of them were laboratory-casted in a vacuum induction melting furnace and contain similar C, Mn and residual element levels. Aluminium and Sulphur were added in an industrially relevant level. The compositions include a reference plain C-Mn steel (Ti0Nb0), a 0.03% Nb microalloyed steel (Ti0Nb3), and three steels with the same 0.03%Nb level, and different high Ti concentrations of 0.05%, 0.1% and 0.15% (Ti5Nb3, Ti10Nb3 and Ti15Nb3 steels, respectively).

Table 1.
Chemical composition of the steels investigated in this work (wt.%).
To study their hot deformation and microstructural evolution behavior, different types of torsion tests were performed. The specimens were a reduced central gauge section of 16.5 mm in length and 7.5 mm in diameter. A schematic representation of the thermomechanical schedule used in the tests is shown in Figure 1. In all cases, a soaking treatment was applied at 1250 °C for 10 min. To determine the softening kinetics, double-hit torsion tests were carried out. In some of the tests (type I in Figure 1), after reheating, the samples were cooled directly to the deformation temperature, where two deformation passes ( and = 0.1) with different interpass times () between them were applied. In the rest of the tests (type II in Figure 1), a roughing deformation pass with = 0.35, = 1s−1 was first applied at 1100 °C, followed by a holding time that was determined to result in a fully recrystallized microstructure. The aim was to obtain refined initial austenite microstructures, more representative of those present during hot rolling. In the double-hit tests, both deformation passes were applied at constant temperature and strain rate conditions. The range of deformation parameters used was: from 0.1 to 0.35, strain rate from 1 s−1 to 5 s−1 and deformation temperatures from 1150 °C to 850 °C. The fractional softening was determined using the 2% offset method, which is reported as the method that most accurately excludes the effect of recovery in the absence of strain- induced precipitation [31,32].
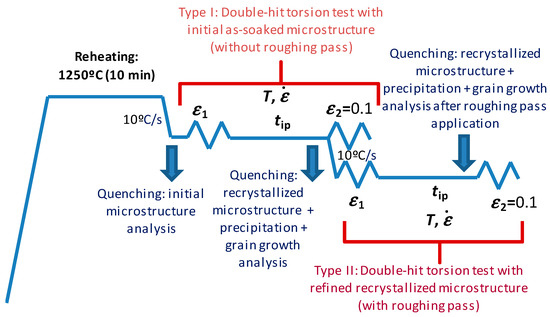
Figure 1.
Thermomechanical cycles employed in the double-hit torsion tests and quenching treatments performed for microstructural analysis.
To analyze the initial microstructure present before the tests, samples were quenched after reheating and cooling to 1100 °C. Samples were also quenched before applying the second deformation pass of the double-hit torsion tests at different conditions: after holding times corresponding to (time for 95% fractional softening) to analyze the recrystallized microstructures, at longer times to analyze the austenite grain growth behavior ( + 50 s and + 250 s), or at shorter or longer times to investigate the strain-induced precipitation evolution.
Metallographic measurements were performed on a section corresponding to 0.9 of the outer radius of the torsion specimen, also known as the sub-surface section. Bechet-Beaujard etching [33] was used to reveal the previous austenite grain boundaries in the quenched samples. The etched samples were examined via optical microscopy, and austenite grain size measurements were performed in terms of the mean equivalent diameter (MED). To analyze the coarsest precipitates, some specimens were also examined via optical microscopy or by field-emission gun scanning electron microscopy (FEG-SEM, JEOL JMS 7100F, JEOL Ltd., Tokyo, Japan) after conventional mechanical polishing. To examine the smallest precipitates, carbon extraction replicas were prepared and examined using a transmission electron microscope operated at 200 kV with a LaB6 filament (TEM Jeol 2100, JEOL Ltd., Tokyo, Japan). To prepare the carbon replica, the quenched samples were polished following standard metallographic techniques and etched with 2% Nital (2% nitric acid in ethanol). Next, a carbon film was deposited onto the samples and cut into ≅ 2 mm squares. The replicas were extracted by etching the samples again in Nital solutions with variable concentration and collected using Ni or Cu grids.
3. Results
3.1. Initial Precipitation and Microstructural State
The presence of coarse undissolved precipitates was first analyzed using optical microscopy in the high Ti specimens quenched for initial microstructure analysis. An example of the micrographs obtained for the Ti5Nb3 steel is shown in Figure 2. A significant number of coarse particles, in the size range of µm, can be detected. While some correspond to inclusions, precipitates containing Ti can be distinguished in the micrograph due to their characteristic orange contrast (see particles marked with arrows). The optical micrographs obtained for the rest of the high Ti steels showed similar features, and no significant differences were observed between the Ti5Nb3, Ti10Nb3 and Ti15Nb3 samples regarding precipitate amount or size.
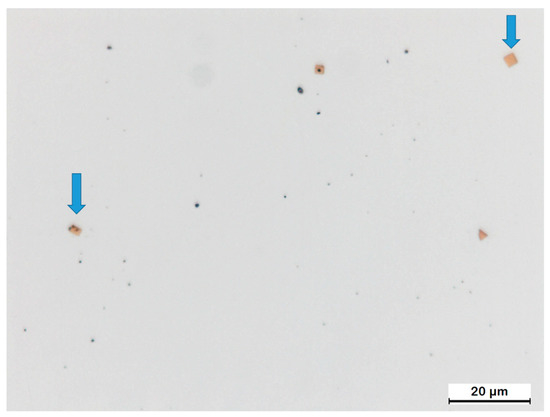
Figure 2.
Examples of the large precipitates observed by optical microscopy in the Ti10Nb3 steel quenched after reheating for initial microstructural analysis.
To characterize the nature of these coarse precipitates in more detail, a FEG-SEM analysis was performed. Although in some cases the particles were identified only as TiN, in most of the cases different constituents were detected. Figure 3 shows a representative example of the precipitates found in the Ti5Nb3 and Ti10Nb3 steel samples. In the particles, a rounded area with dark contrast can be observed (Energy-dispersive spectroscopy analysis (EDS) number 1 in Figure 3). The EDS analysis shows that this is most likely Al2O3. The cube-shaped lighter contrast areas were identified as TiN (EDS number 3) and round lighter contrast areas were MnS (EDS number 2) co-precipitates. In the EDS of the TiN precipitates (number 3), a low Nb signal can also be detected.
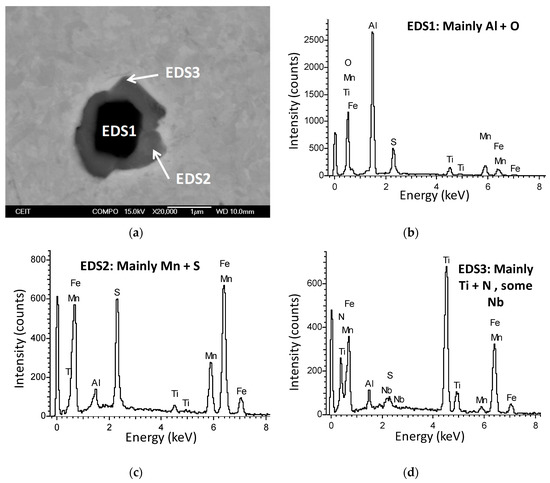
Figure 3.
(a) Example of a Ti-complex precipitate observed by field-emission gun scanning electron microscopy (FEG-SEM) in the Ti5Nb3 sample quenched for initial microstructure analysis and (b–d), corresponding EDS analysis.
In the case of the Ti15Nb3 steel, precipitates with similar morphology were also found. However, in most cases, instead of MnS, the rounded areas were found to be rich in Ti and S. In addition, large particles containing only Ti and S were also found dispersed in the matrix for this steel.
Examples of the TEM results for the carbon extraction replicas extracted from the specimens quenched after soaking are shown in Figure 4. Nanometer-sized precipitates could be found dispersed in the replicas of all the microalloyed steels analyzed, even in the case of the Ti0Nb3 steel. From the EDS, it can be observed that in all cases the precipitates contain Ti and some Nb (the Cu and Ni signals are due to the grid used to support the replicas and the C signal can be due to both the replica and the precipitates and their contributions cannot be separated). In the Ti0Nb3 steel, since the Ti content is residual and the N level lower, the presence of these Nb-Ti precipitates was less expected. In good agreement with this, the precipitate amount was much lower than in the rest of the high Ti replicas analyzed. In addition, average precipitate size for this steel (D = 71 ± 10 nm) was smaller than for the rest of the high Ti steels (D = 131 ± 7 nm, 135 ± 15 nm and 138 ± 8 nm for the Ti5Nb3, Ti10Nb3, Ti15Nb3 steels, respectively).
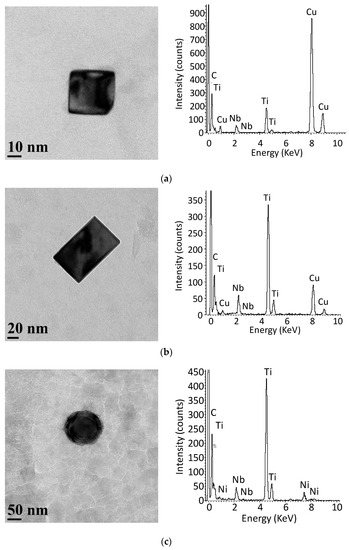
Figure 4.
Examples of Nb-Ti precipitates found in the replicas extracted from the initial microstructure and corresponding EDS analysis. (a) Ti0Nb3 steel, (b) Ti5Nb3 steel, (c) Ti15Nb3 steel.
For the high Ti steels, although very similar precipitate sizes were measured, greater precipitate size heterogeneity was observed for the Ti10Nb3 and Ti15Nb3 steels. In addition, as shown in Figure 4, the precipitates tend to have a more rounded shape in the Ti10Nb3 and Ti15Nb3 steels, while in the Ti5Nb3 steel the shape is more cubic/rectangular. Although the precipitate density in the replicas was not measured, it must be mentioned that the amount of precipitates found in the Ti10Nb3 replicas was lower than in the Ti5Nb3 and Ti15Nb3 ones. Finally, in the case of the Ti10Nb3 and Ti15Nb3 steels, particles containing S and Ti could also be detected. Although in some cases these could be identified as S and Ti co-precipitates on Nb-Ti undissolved precipitates, these were mainly found as individual particles (see Figure 5) and in some cases, some Nb was detected in their composition. The size distribution of both the Nb-Ti- and S-containing precipitates overlap, and it can be difficult to distinguish them without EDS analysis.
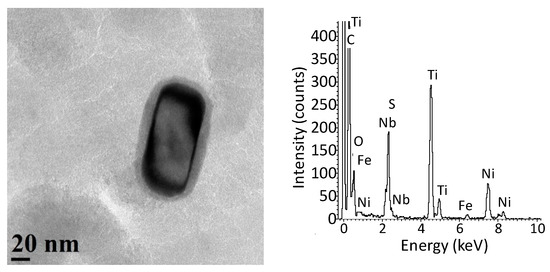
Figure 5.
S-, Nb- and Ti- containing precipitate found in the carbon replicas extracted from the Ti10Nb3 specimen quenched for initial microstructure analysis.
The grain size was measured from specimens quenched after reheating and after application of the roughing pass using Bechet-Beaujard etching [33]. The results are summarized in Table 2. After reheating, similar austenite grain sizes of 230–240 μm were measured for the Ti0Nb0 and Ti0Nb3 steels. This indicates that the amount of undissolved Nb-Ti precipitates detected for Ti0Nb3 was too low to prevent grain growth during reheating, although some improvement in grain size homogeneity was observed in the latter. For the Ti5Nb3 and Ti15Nb3 steels, some grain refinement was observed, which could be attributed to the pinning effect exerted by the smallest undissolved precipitates [10]. On the other hand, this was not observed for the Ti10Nb3 steel, which is in good agreement with the lower density of the nanometer-sized undissolved precipitates observed in the replicas for this steel. After the roughing pass, the average grain sizes decreased in all cases, and differences between the steels can also be observed. It is worth noting the significant grain size refinement obtained for the Ti0Nb3 steel, while the coarsest grain size corresponds again to the reference Ti0Nb0.
Table 2.
Average austenite grain sizes measured for samples quenched for initial microstructure analysis before and after roughing pass application.
3.2. Softening Kinetics
Figure 6 shows examples of the fractional softening data obtained for the all the steels at constant strain and strain-rate conditions ( = 0.35, = 1 s−1) in tests carried out after the application of a roughing pass. For the Ti0Nb0 steel at all temperatures, for the Ti5Nb3 steel at temperatures from 1100 to 950 °C, and for the rest of the steels from 1100 to 1050 °C, the fractional softening follows a sigmoidal shape and can be fitted to an Avrami curve of the type:
where is the fractional softening corresponding to a time , is the time to reach a 50% fractional softening and is the Avrami exponent. At lower temperatures, the behavior varies depending on the steel considered. For the Ti0Nb3 steel at 950 °C and 900 °C (Figure 6b) and for the Ti15Nb3 steel at 900 °C (Figure 6e), softening stagnations, or plateaux, which are usually related to the onset of strain-induced precipitation [2,23], are detected. In the rest of the cases, although a larger softening retardation is observed relative to higher temperatures, the softening increases continuously as the interpass time increases within the time range investigated.
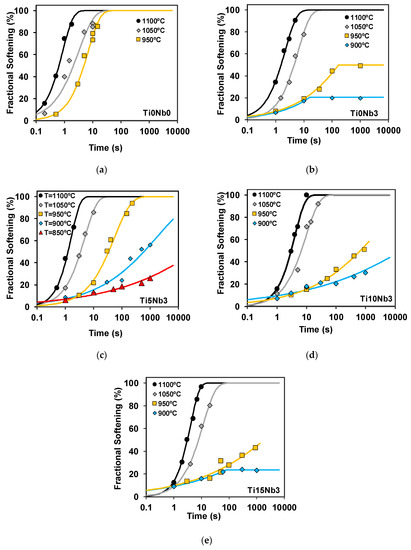
Figure 6.
Softening curves obtained for the steels investigated at constant strain and strain-rate conditions ( = 0.35, = 1 s−1) and different temperatures after roughing pass application. (a) Ti0Nb0 steel, (b) Ti0Nb3 steel, (c) Ti5Nb3 steel, (d) Ti10Nb3 steel and (e) Ti15Nb3 steel.
Examples of the effect of strain and of roughing pass application are illustrated in Figure 7. As is usually reported, increasing strain results in faster softening kinetics. The same is observed with the application of a roughing pass, due to initial microstructure refinement, although the effect is lower than it is for increasing strain. Similar trends were observed for the rest of the steels investigated.
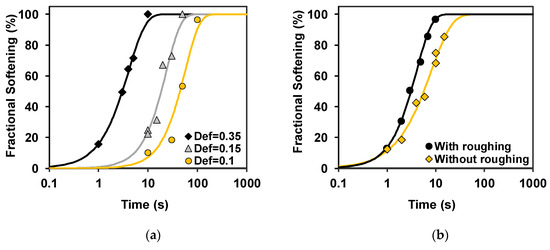
Figure 7.
Examples of the effect of strain and of initial microstructural refinement on the softening curves. (a) Ti10Nb3 steel, T = 1100 °C, roughing pass applied, = 1 s−1 and (b) Ti10Nb3 steel, T = 1100 °C, = 0.35, = 1 s−1.
Examples of the effect of steel composition on the softening kinetics at similar deformation and in high temperature conditions are illustrated in Figure 8. It can be observed that in both cases, the Ti0Nb0 steel showed the fastest softening kinetics, followed by Ti5Nb3 and then Ti0Nb3. The slowest softening kinetics correspond to the Ti10Nb3 and Ti15Nb3 steels. For the Ti0Nb0 steel, the initial austenite grain sizes were determined to be coarser than or in the same range of those measured for Ti0Nb3 (Table 2). Since coarser initial microstructures are known to delay the recrystallization kinetics [3], the softening retardation observed for Ti0Nb3 compared to Ti0Nb0 can only be explained due to the solute drag exerted by Nb [1,2,3,23]. On the other hand, for the Ti5Nb3 steel, the initial microstructure is slightly finer than for Ti0Nb3. Although the difference is very small after roughing, refinement of the initial microstructure can contribute to the acceleration of the softening kinetics observed for the Ti5Nb3 steel compared to Ti0Nb3. Additionally, a decrease in the Nb content in solid solution due to its presence in undissolved precipitates in Ti5Nb3 (Figure 4) could also contribute to this acceleration. On the other hand, for the Ti10Nb3 and Ti15Nb3 steels a higher amount of Ti in solid solution can explain the softening retardation observed for both.
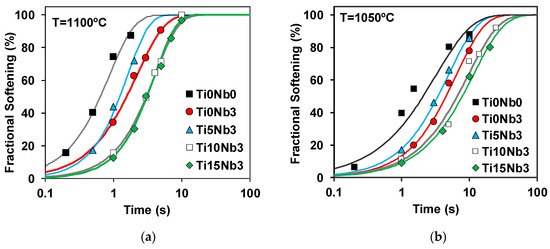
Figure 8.
Effect of steel composition on the softening curves at high temperatures, roughing pass applied, = 0.35, = 1 s−1. (a) T = 1100 °C, (b) 1050 °C.
The softening curves determined for all steels at lower temperatures of 950 °C and 900 °C are compared in Figure 9. It can be observed that at 950 °C, for the Ti0Nb0 and Ti5Nb3 steels, the softening curve also follows a sigmoidal shape. For the Ti0Nb3 steel a plateau, which is usually considered to be caused by strain-induced precipitation start, is observed at ≅ 180 s. For the Ti10Nb3 and Ti15Nb3 steels, in contrast, there are no clear plateaux. However, the very retarded softening kinetics are similar to what is observed for Ti0Nb3. At 900 °C, for the Ti5Nb3 steel, a very slow but continuous increase in softening is observed within the interpass time range investigated. For the Ti0Nb3, Ti5Nb3 and Ti15Nb3 steels, the softening is more retarded and tends to saturate at 20–30% levels up to interpass times as long as 1000 s.
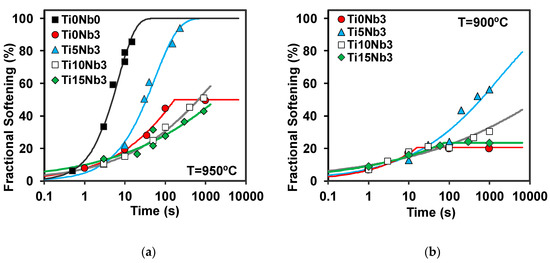
Figure 9.
Softening kinetics for the steels investigated at low temperatures, roughing pass applied, = 0.35, = 1 s−1. (a) T = 950 °C, (b) 900 °C.
3.3. Strain-Induced Precipitation Behavior
From the softening data, it is difficult to accurately determine the start time for strain-induced precipitation, especially for the high Ti steels. Therefore, to study the precipitation behavior of these steels, quenching treatments were performed for all the microalloyed steels after deformation at 900 °C (roughing pass applied, = 0.35, = 1 s−1) and interpass times of 100 s and 1000 s (fractional softening results corresponding to these conditions are shown in Figure 9b). For Ti0Nb3, an additional quenching treatment was performed at similar deformation conditions for 950 °C, t = 180 s (time for plateau start, Figure 9a). An analysis of the carbon extraction replicas prepared from this specimen showed the presence of some Nb strain-induced precipitates with an average size of D = 15.5 ± 1.8 nm. Although these were scarce and found to be heterogeneously distributed, the presence of these particles suggests that the plateau observed at 950 °C could be related to strain-induced precipitation start.
Regarding the 900 °C condition, for the Ti5Nb3 steel, strain-induced precipitates were not detected at neither at 100 or 1000 s holding times. However, as Figure 10 shows, the co-precipitation of Nb-rich caps on the undissolved precipitates was observed in the replicas extracted from this steel.
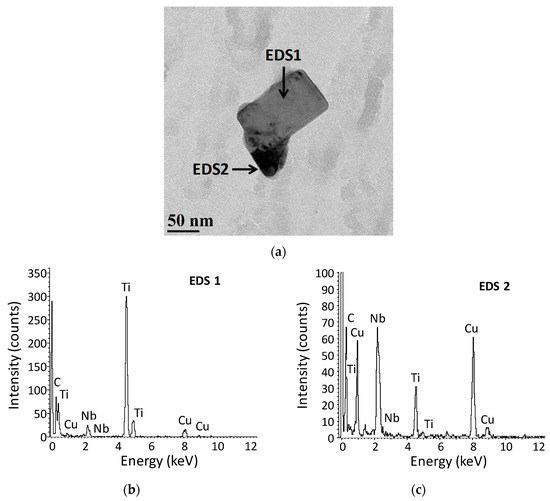
Figure 10.
(a) Example of Ti-Nb undissolved precipitate with Nb-Ti co-precipitate observed in the Ti5Nb3 900 °C-1000 s sample and, (b,c) corresponding EDS analysis.
For the Ti10Nb3 and Ti15Nb3 steels, some co-precipitation was also observed on the undissolved precipitates, while for the Ti0Nb3 steel this was more difficult to evaluate since a low number of undissolved precipitates was detected. However, more homogeneously distributed strain-induced precipitates could be observed in all the Ti0Nb3, Ti10Nb3 and Ti15Nb3 samples analyzed.
Figure 11 shows examples of the precipitation state and an EDS analysis observed for the 100 s condition for the three steels. Additionally, while very fine Nb-containing precipitates (D = 7.2 nm) were detected for the Ti0Nb3, for both the Ti10Nb3 and Ti15Nb3 steels, the precipitates were coarser (D ≅ 15–16 nm) and both Nb and Ti could be clearly detected in their composition. It must be mentioned that in carbon extraction replicas the smallest precipitates may not be extracted [12], although in the case of Figure 11a precipitates as small as 3.3 nm have been measured.
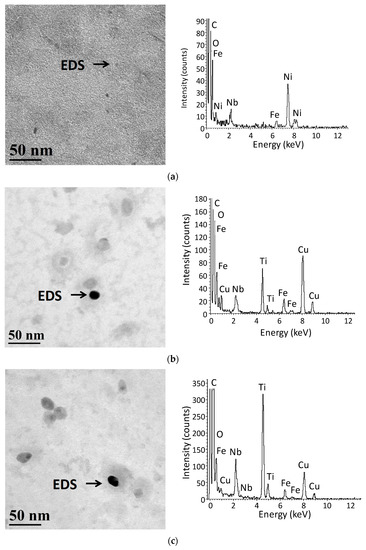
Figure 11.
Strain-induced precipitates detected in the carbon replicas after deformation at 900 °C and corresponding EDS analysis (tests performed with roughing, = 0.35, = 1 s−1 and 100 s holding time). (a) Ti0Nb3 steel, D = 7.2 ± 0.2 nm, (b) Ti10Nb3 steel, D = 15.0 ± 0.4 nm, (c) Ti15Nb3 steel, D = 16.0 ± 0.5 nm.
Figure 12 summarizes the precipitate size distributions measured after deformation at the same temperature, but with a longer holding time of 1000 s. The EDS analysis showed no significant changes in the composition of the precipitates compared to the ones extracted after 100 s. However, it can be observed that for all the steels, the precipitate size increases during the interpass time. Nevertheless, while precipitate size growth is quite limited for the Ti0Nb3 steel (D increases from 7 to 13 nm), this is much larger for the Ti15Nb3 (D from 16 to 33 nm) and especially the Ti10Nb3 steel (D from 16 to 52 nm).
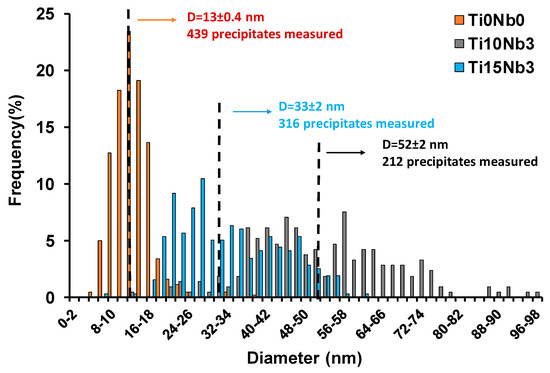
Figure 12.
Precipitate size distributions measured for the Ti0Nb3, Ti10Nb3 and Ti15Nb3 steels in samples quenched after deformation at 900 °C (roughing pass applied, = 0.35, = 1 s−1) and 1000 s holding time.
3.4. Recrystallized Grain Size
Figure 13 shows examples of the recrystallized microstructures obtained from the Ti0Nb3 and Ti5Nb3 steels at = 1100 °C and 1150 °C, = 1 s−1 in specimens quenched at . The micrographs were obtained after reheating and applying different deformation conditions: a single deformation pass of ε = 0.35 at 1100 °C in the case of Figure 13a,b, a single deformation pass of ε = 0.15 at 1100 °C–1150 °C in Figure 13c,d, and a roughing pass plus a deformation pass of ε = 0.35 at 1100 °C in Figure 13e,f. As expected, equiaxed austenite microstructures are obtained in all cases. When considering the effect of deformation conditions, similar behavior is observed for both steels: the application of a single deformation pass of ε = 0.35 leads to significant microstructural refinement of the initial as-soaked microstructure (from 241 to 88 μm for Ti0Nb3 and from 163 to 64 μm for Ti5Nb3). On the other hand, when a lower strain level of ε = 0.15 is applied, for both steels the grain size remains approximately constant or even slightly increases for the Ti0Nb3 steel. Finally, the application of another ε = 0.35 deformation pass also results in some grain size refinement (from 88 to 65 μm for the Ti0Nb3 and from 70 to 56 μm for the Ti5Nb3 steel), although the effect is less marked than when the coarser as-soaked microstructure was deformed.
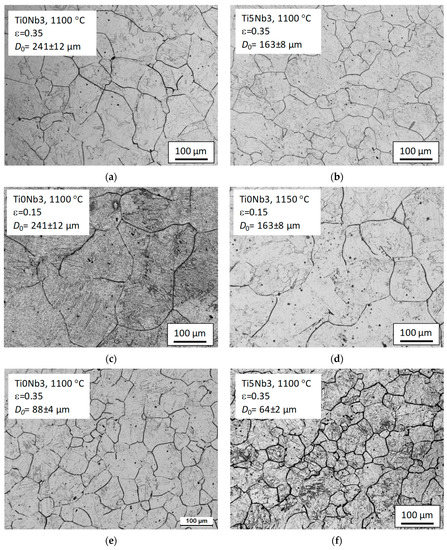
Figure 13.
Examples of recrystallized austenite microstructures obtained at different deformation conditions. (a) = 88 ± 4 µm, (b) = 70 ± 2 µm, (c) = 256 ± 4 µm, (d) = 162 ± 9 µm, (e) = 65 ± 4 µm, (f) = 56 ± 1 µm.
Table 3 summarizes the recrystallized grain size () measurements performed at the different conditions under study, together with the initial austenite grain size () and deformation conditions employed in the tests. The trends are similar for all the steels investigated: applying deformation levels of = 0.35 led to microstructural refinement, while lower levels of = 0.15 led to similar or slightly larger austenite grain sizes. The results obtained for the Ti0Nb3 steel after a roughing pass show that, as is usually reported, modifying the deformation temperature from 1100 to 1050 °C does not significantly affect the recrystallized grain size. Similarly, data corresponding to the Ti5Nb3 at = 0.35 and without a roughing pass shows a small effect on variation in strain-rate from 1 to 5 s−1.
Table 3.
Experimental determined at different deformation conditions.
3.5. Grain Growth Behavior
Figure 14 shows examples of microstructures quenched at or at longer holding times ( + 50 s or 250 s) to study the grain growth behavior. The microstructures correspond to the Ti0Nb0, Ti0Nb3 and Ti15Nb3 steels and a constant holding temperature of 1100 °C. For Ti0Nb0, as time increases, a significant grain size increase is observed, from 62 to 120 μm after 250 s holding time. For the Ti0Nb3, grain growth is more limited, from 65 to 105 μm, and for the Ti15Nb3, the grain size remains approximately constant at ≅ 85 μm.
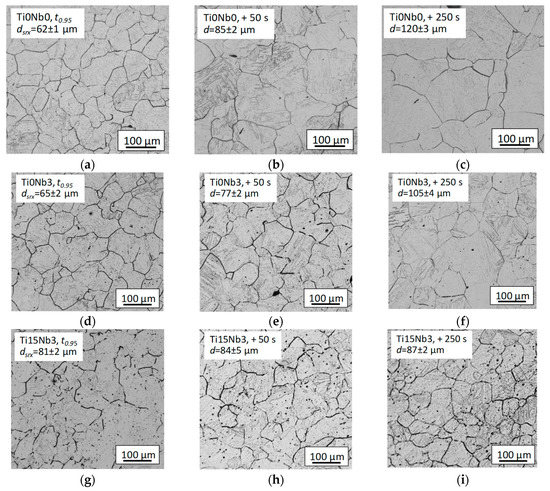
Figure 14.
Examples of recrystallized microstructures quenched at (T = 1100 °C, = 0.35, = 1 s−1) or after and longer holding times of 50 s and 250 s for the Ti0Nb0, Ti0Nb3 and Ti15Nb3 steels.
4. Discussion
4.1. Initial Microstructural and Precipitation State
To further understand the precipitation sequence at the conditions investigated, calculations were performed using the Thermo-Calc software (version 2017a, Thermo-Calc software, Solna Sweden) [34] (Thermo-Calc Software TCFE8 Steels/Fe-alloys database [35]). Table 4 summarizes the amount of Nb and Ti in solid solution predicted by the software at 1250 °C in the austenite phase, and in Figure 15 the Ti concentration present in each of the equilibrium phases (in wt.%) is plotted as a function of temperature for the high Ti steels. The table shows that for all the steels, Nb is expected to be in solid solution after soaking. With regard to Ti, the situation is more complex. As observed in Figure 15, in addition to the austenite, it is predicted that at 1250 °C some Ti will be present in three other phases: Ti4C2S2, N-rich fcc precipitates and C-rich fcc precipitates. As a result, at 1250 °C, only slightly less than half of the nominal Ti concentration is calculated to be in solid solution in the austenite at equilibrium conditions.
Table 4.
Amount of Nb, Ti in solid solution in austenite (wt.%) at 1250 °C for the microalloyed steels calculated using Thermo-Calc software [34,35].
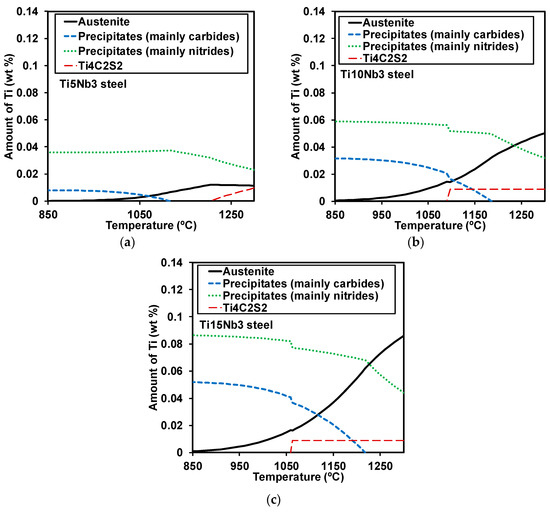
Figure 15.
Amount of Ti (wt.%) in each of the phases at equilibrium conditions calculated with Thermo-Calc software [34,35] for the high Ti steels. (a) Ti5Nb3, (b) Ti10Nb3, (c) Ti15Nb3.
For Ti0Nb3 steel, in contrast to the Thermo-Calc predictions, some Nb-Ti precipitates were found. However, these were scarce, only found via TEM, small in size (D = 71 nm) and were probably related to the presence of some residual Ti content in the steel. This means that the amount of Nb in these scarce precipitates is expected to be very low or even negligible.
On the other hand, for the high Ti steels a large number of precipitates, with a wide range of sizes from microns to several nanometers, were detected. This reduces the amount of Ti in solid solution in austenite that is available for further precipitation, which is in good agreement with the predictions of Thermo-Calc software. The coarsest Ti containing precipitates were in most cases found nucleated over oxides (Al2O3), which suggests that the amount of these particles can be related to the number of oxides and therefore influenced by steel cleanliness. This can be critical, since these coarse Ti nitrides (in the micron range) are very difficult to dissolve during reheating. Nanometer-sized particles with similar average size (D ≅ 135 nm) were also found for all the high Ti specimens quenched for initial microstructure analysis, although the density tends to be lower for the Ti10Nb3 steel. The reasons for the reduced precipitate amount are not clear, but they may be related to casting or solidification conditions. Regarding precipitate composition, for the three high Ti steels some N could be detected in the coarsest particles observed via FEG-SEM, which suggests that these are mostly nitrides. This is in good agreement with the predictions of Thermo-Calc, which shows that at 1250ºC a large amount of Ti is expected to be pinned in the form of TiN. In the case of the smallest precipitates detected by TEM, some Nb was found in their composition (Figure 4). This suggests that some loss of Nb in solid solution not predicted by Thermo-Calc could be taking place. For the Ti10Nb3 and Ti15Nb3 steels, S- and Ti-containing precipitates, mainly small for the former steel and of all sizes for the latter, were also detected. In other types of steels, it has been reported that Ti and S can combine to form TiS or Ti4C2S2 [36]. It is difficult to detect C by EDS in the FEG-SEM, and it is not possible in the carbon replicas examined in the TEM. However, the predictions of Thermo-Calc suggest that these could be of the Ti4C2S2 type. Finally, although these were the least frequent type of particles, in some of the precipitates found via TEM, Nb and S was also detected. However, this was not investigated in detail.
4.2. Static Softening and Strain-Iduced Precipitation Behavior
From the softening curves, the and Avrami exponent were calculated for all the conditions investigated. The results obtained for all those cases where interaction with strain-induced precipitation was not observed are summarized in Table 5.
Table 5.
Experimental t0.5 and n values determined from the softening curves.
In a previous work [3], the following equation was developed to predict as a function of initial grain size (, deformation conditions (ε, and T) and the amount of microalloying elements in solid solution:
where the amount of microalloying elements is given in wt%, in μm, in s−1 and T in K. The equation was developed considering steels microalloyed with Nb, Ti and Nb-Ti with 0.035%Nb and 0.067%Ti as maximum levels [3]. Although not applicable in the present work, the equation has been extended to steels with high Mo [37], Al [38] and B [39] additions. In Figure 16 the times calculated from this equation are plotted against the experimentally determined values. The amount of microalloying element in solid solution predicted by Thermo-Calc (Table 4) was used in the calculations and only those cases in which interaction with strain-induced precipitation was not detected were considered. From the figure, on average, a good fit is observed for all the steels investigated. Although the above results indicate that Thermo-Calc may slightly overestimate values of Nb in solid solution for the high Ti steels, this does not seem to lead to significant error in prediction. In fact, the fit is slightly more accurate for the microalloyed steels than for Ti0Nb0. In some cases, some overestimation of the calculated can be observed. However, it must be mentioned that this was observed for the longest values, which correspond mainly to the lowest applied strain values (ε = 0.1 and ε = 0.15). The lower accuracy of these type of models when low strain levels are applied has also been observed in previous works [38].
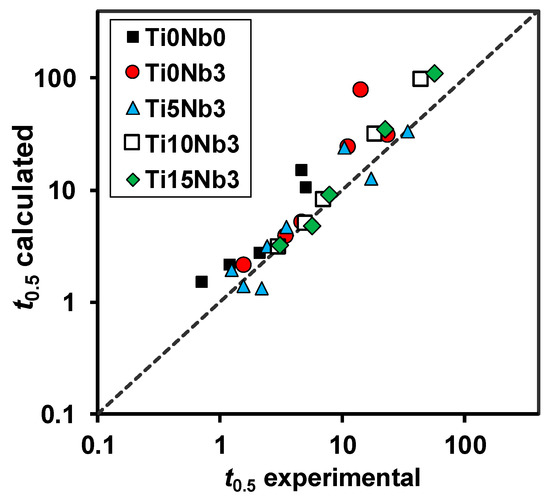
Figure 16.
Comparison between the experimental and the values predicted using Equation (2).
Regarding the experimental Avrami exponent, in some works this parameter’s dependence on deformation temperature has been reported [2,23,40]. However, within the range of conditions investigated in this work (most of the available data corresponding to T = 1100 °C or 1050 °C) and taking into account that this parameter is rather noisy [40], it is difficult to assess such an effect with the available data. However, the average value determined from the available results, = 1.26, is within the range of values reported for other microalloyed steels [3], and also close to the predictions made by the equations developed by Medina et al. [2] for low alloy steels ( = 0.94 to 0.98) and for microalloyed steels ( = 1.07 to 1.21) in the 1050–1100 °C temperature range.
The strain-induced precipitation behavior shows a more complex dependence on steel composition. The carbon replica and softening analysis show that, within the microalloyed steels, the Ti5Nb3 one presents the most retarded precipitation kinetics. For this steel, some loss of Nb in solid solution into the undissolved precipitates can take place. However, the presence of coarse undissolved precipitates in the microstructure of the high Ti steels must also be considered. The activation energy for nucleation of precipitates depends both on the driving force and the energy barrier. The driving force is a function of the amount of microalloying content in solid solution relative to the equilibrium values, while the energy barrier includes the interfacial energy and the strain mismatch between precipitate and matrix [41]. For the Ti5Nb3 steel, lower amount of Nb in solid solution compared to Ti0Nb3 can reduce the driving force and make less favorable precipitate nucleation. However, another factor to take into account is that heterogeneous nucleation of Nb-Ti precipitates on undissolved precipitates takes place following a coherent cube-cube orientation relationship, leading to a decrease of the interfacial energy [29]. As a result, for this steel, co-precipitation on undissolved particles could become the most favorable nucleation mechanism for the Ti5Nb3. Similar results were observed by Hong et al. [29] for 0.04%C-0.05%Nb steels with 0.016%Ti addition. For the Ti10Nb3 and Ti15Nb3 steels (Figure 11), some co-precipitation over undissolved precipitates was also observed. However, for these steels, more homogeneously distributed precipitates were observed in the replicas (Figure 11b,c). A higher amount of Ti in solid solution in these steels leads to higher driving force for precipitation. As result, both precipitation mechanisms, co-precipitation and precipitation in the austenite lattice defects, such as dislocation or sub-grain boundaries [32,41], is observed to take place, leading to larger softening retardation levels than for the Ti5Nb3 steel.
Some differences can also be observed regarding the composition and size of the strain-induced precipitates. While EDS analysis of Ti0Nb3 steel shows that they contain mostly Nb, for the Ti10Nb3 and Ti15Nb3 steels, both Nb and Ti could be clearly detected in the composition. In addition, a much higher strain-induced precipitate growth/coarsening rate was determined in the high Ti steels compared to Ti0Nb3. This could be related to the higher amount of microalloying element in solid solution present in these steels [42]. After a 1000s holding time, the precipitate size increase was especially enhanced for the Ti10Nb3. The lower amount of nanometer-sized precipitates found in the initial microstructure analysis suggests that for this steel more Ti could be put into solution after reheating. However, although the effect is small, more retarded softening kinetics were observed for Ti15Nb3 than for Ti10Nb3, which can only be explained due to larger amount of Ti in solid solution (Figure 8). Given the small amount of material that it is analyzed by TEM means, local segregation effects could explain this result.
4.3. Recrystallized Grain Size
As shown in Table 3 and commonly reported in the literature, the effect of deformation temperature or strain rate on the recrystallized grain size is low. As a result, to calculate the recrystallized grain size, the following type of dependence is usually applied [43,44,45]:
where A, p and q are material dependent constants. Table 6 summarizes some of the values proposed in the literature for these constants for C-Mn and Nb microalloyed steels [43,44,45], while in Figure 17 the experimental recrystallized grain sizes measured in this work have been compared to the predictions of these models.
Table 6.
Parameters proposed for the calculation of the recrystallized grain size for different steels using equation (3).
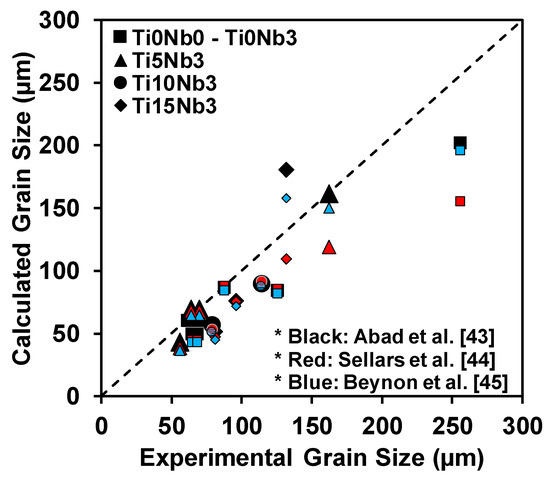
Figure 17.
Comparison between the experimental recrystallized grain size measured for the steels investigated and predictions from several models proposed in the literature [43,44,45].
It can be observed from Figure 17 that for the finest recrystallized grain sizes, the fit is similar for the three equations considered. In addition, no significant differences can be appreciated in the fit as a function of high Ti content. Equation from reference [44] tends in most cases to underestimate the recrystallized grain size, while for the coarsest recrystallized grain sizes, equations from references [43] and [45] provide more accurate results.
4.4. Grain Growth Behavior
The following equation is usually applied to low/medium carbon steels to predict growth as a function of holding time (in s) and temperature (in K):
where is the apparent activation for grain growth, is the growth exponent and is a constant. The parameters of some of the models developed for different steels are summarized in Table 7:
Table 7.
Values of the parameters proposed for some grain growth models in the literature.
Figure 18 compares the predictions of these models and the experimental measurements performed in this work. Regarding the experimental data, it can be noted that the Ti0Nb0 steel shows the fastest growth kinetics, while this is slower for Ti0Nb3 and much more limited for the high Ti steels. On the other hand, when considering the predicted values, these trends were not always true; higher grain growth rates were predicted for the Nb microalloyed steels relative to the CMn ones by the equations developed. At 1050 °C and at 1100 °C, when the coarsest initial recrystallized grain size is considered (Figure 18b,c), good agreement is observed between the experimental data for the Ti0Nb3 steel and the values predicted by the equation developed by Hodgson for Nb microalloyed steels. On the other hand, at 1100 °C, when finer initial recrystallized grain sizes are considered (Figure 18a), the experimental values tend to be lower than the ones predicted. In the same conditions the grain growth kinetics for the Ti0Nb0 steel was best predicted by the Hodgson CMn equation, while at 1050 °C, this was underestimated by all the reported models. This makes difficult to determine which is the most adequate equation for the Ti0Nb0 and Ti0Nb3 steels. However, when considering the high Ti steels, especially Ti15Nb3, applying the equation developed by Hodgson for Ti microalloyed steels, which predicts very limited grain growth, would provide the most reliable results.
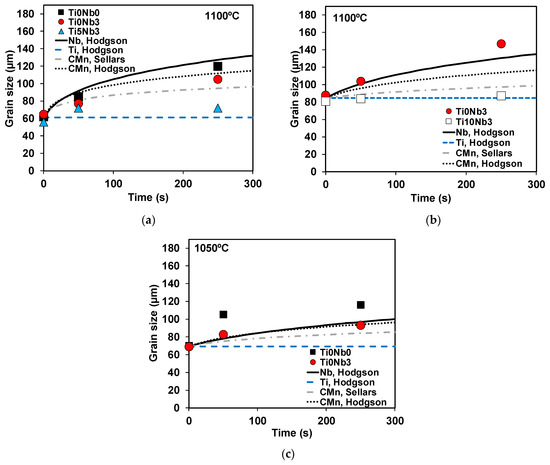
Figure 18.
Comparison between the experimental grain growth data and the results of several models reported in the literature (symbols represent experimental data and lines model predictions) at (a), (b) 1100 °C and (c) 1050 °C.
5. Conclusions
This work analyzed the austenite microstructural evolution of 0.03%Nb microalloyed steels with different high Ti additions (0.05%, 0.1%, 0.15%) during hot working. The main conclusions that can be extracted are as follows:
For the reference 0.03%Nb microalloyed steel, after reheating at 1250 °C, all the Nb is in solid solution in the austenite. In contrast, for the high Ti steels, according to thermodynamic calculations, only slightly half of the Ti concentration available can be dissolved. The coarsest Ti containing precipitates (in the range of microns) often appear co-precipitated over Al2O3 particles. For the Ti5Nb3 and Ti10Nb3 steels, these co-precipitates are mainly TiN, although they can also contain some Nb, while for the Ti15Nb3 steel coarse Ti- and S-containing particles were also detected. Additionally, nanometer-sized precipitates were present for all the steels. Some Nb could also be detected in these particles, which can result in lower Nb in solid solution than the values predicted by the Thermo-Calc software.
The fastest recrystallization kinetics was determined for the Ti0Nb0 steel, followed by the Ti5Nb3 and then Ti0Nb3 steels. The most retarded softening kinetics was observed for the Ti10Nb3 and Ti15Nb3 steels. Grain size and the amount of microalloying in solid solution can explain the observed trends. Experimental and Avrami exponent values determined for all high Ti steels are in good agreement with those predicted by available models developed for Nb, Nb-low Ti and CMn microalloyed steels.
Within the microalloyed steels investigated, the most retarded strain-induced precipitation kinetics was determined for the Ti5Nb3 steel. In this steel mainly co-precipitation over undissolved precipitates occurs. This effect could be explained by a lower amount of microalloying element in solution compared to the Ti0Nb3 or to the reduction of interfacial energy for nucleation. On the other hand, for the Ti10Nb3 and Ti15Nb3 steels, both co-precipitation and more dispersed precipitates were detected, which can be attributed to larger amount of Ti in solid solution, resulting in higher precipitation driving force.
The strain-induced precipitates found in the Ti10Nb3 and Ti15Nb3 steels presented both Nb and Ti in their composition. These precipitates resulted in a softening retardation effect comparable to or even larger than that observed for the Ti0Nb3 steel. However, the size of these precipitates was also coarser than for Ti0Nb3 and they presented a higher growth rate.
For the high Ti steels, the recrystallized grain sizes could be reasonably well predicted by the models developed for other microalloyed steels. Regarding grain growth, for the Ti0Nb0 and Ti0Nb3 steels it is not clear which of the existing models is the most accurate one. However, for the high Ti steels, grain growth was much more limited.
Author Contributions
L.G.-S., B.L. and B.P. conceived and designed the experiments; L.G.-S. performed the experiments; L.G.-S., B.L. and B.P. analyzed the data; B.L. and B.P wrote the paper. All authors have read and agreed to the published version of the manuscript.
Funding
The authors acknowledge financial support to carry out this work from the European Commision’s Research Fund for Coal and Steel (RFSR-CT-2015-00013).
Conflicts of Interest
The authors declare no conflict of interest.
References
- Andrade, H.L.; Akben, M.G.; Jonas, J.J. Effect of Molybdenum, Niobium, and Vanadium on Static Recovery and Recrystallization and on Solute Strengthening in Microalloyed Steels. Metall. Trans. A 1983, 14, 1967–1977. [Google Scholar] [CrossRef]
- Medina, S.F.; Quispe, A. Improved Model for Static Recrysallization Kinetics of Hot Deformed Austenite in Low Alloy and Nb/V Microalloyed Steels. ISIJ Int. 2001, 41, 774–781. [Google Scholar] [CrossRef]
- Fernandez, A.I.; Uranga, P.; López, B.; Rodriguez-Ibabe, J.M. Static Recrystallization Behaviour of a Wide Range of Austenite Grain Sizes in Microalloyed Steels. ISIJ Int. 2000, 40, 893–901. [Google Scholar] [CrossRef]
- Aretxabaleta, Z.; Pereda, B.; Lopez, B. Multipass Hot Deformation Behaviour of High Al and Al-Nb Steels. Mater. Sci. Eng. A 2014, 600, 37–46. [Google Scholar] [CrossRef]
- Bengochea, R.; Lopez, B.; Gutierrez, I. Influence of the Prior Austenite Microstructure on the Transformation Products obtained for C-Mn-Nb Steels after Continuous Cooling. ISIJ Int. 1999, 39, 583–591. [Google Scholar] [CrossRef]
- DeArdo, A.J. Niobium in Modern Steels. Int. Mater. Rev. 2013, 48, 371–402. [Google Scholar] [CrossRef]
- Wolczynski, W. Back-Diffusion in Crystal Growth. Eutectics. Arch. Metall. Mater. 2015, 60, 2403–2407. [Google Scholar] [CrossRef]
- Wolczynski, W. Back-Diffusion in Crystal Growth. Peritectics. Arch. Metall. Mater. 2015, 60, 2409–2414. [Google Scholar] [CrossRef]
- Himemiya, T.; Wolczynski, W. Solidification Path and Solute Redistribution of an Iron-Based MultiComponent Allow with Solute Diffusion in the Solid. Mater. Trans. 2002, 43, 2409–2414. [Google Scholar] [CrossRef][Green Version]
- Medina, S.F.; Chapa, P.; Valles, A.; Quispe, M.I.; Vega, M.I. Influence of Ti and N Contents on Austenite Grain Control and Precipitate Size in Structural Steels. ISIJ Int. 1999, 39, 930–936. [Google Scholar] [CrossRef]
- Lagneborg, R.; Siwecki, T.; Zajac, S. Role of Vanadium in Microalloyed Steels. Scand. J. Metall. 1999, 28, 186–241. [Google Scholar]
- Sanz, L.; Pereda, B.; Lopez, B. Effect of Thermomechanical Treatment and Coiling Temperature on the Strengthening Mechanisms of Low Carbon Steels Microalloyed with Nb. Mater. Sci. Eng. A 2017, 685, 377–390. [Google Scholar] [CrossRef]
- Iza-Mendia, A.; Altuna, M.A.; Pereda, B.; Gutierrez, I. Precipitation of Nb in Ferrite after Austenite Conditioning. Part I: Microstructural Characterization. Metall. Trans. A 2012, 43, 4553–4570. [Google Scholar] [CrossRef]
- Altuna, M.A.; Iza-Mendia, A.; Gutierrez, I. Precipitation of Nb in Ferrite after Austenite Conditioning. Part II: Strengthening Contribution in High-Strength Low-Alloy (HSLA) Steels. Metall. Mater. Trans. A 2012, 43, 4571–4586. [Google Scholar] [CrossRef]
- Freeman, S.; Honeycombe, R.W.K. Strengthening of Titanium Steels by Carbide Precipitation. Met. Sci. 1977, 11, 59–64. [Google Scholar] [CrossRef]
- Funakawa, Y.; Shiozaki, T.; Tomita, K.; Yamamoto, T.; Maeda, E. Development of High Strength Hot-Rolled Sheet Steel consisting of Ferrite and Nanometer-Sized Carbides. ISIJ Int. 2004, 44, 1945–1951. [Google Scholar] [CrossRef]
- Bu, F.Z.; Wang, X.M.; Yang, S.W.; Shang, C.J.; Misra, R.D.K. Contribution of Interphase Precipitation on Yield Strength in Thermomechanically Simulated Ti-Nb and Ti-Nb-Mo Microalloyed Steels. Mater. Sci. Eng. A 2015, 620, 22–29. [Google Scholar] [CrossRef]
- Chen, C.Y.; Yen, H.W.; Kao, F.H.; Li, W.C.; Huang, C.Y.; Yang, J.R.; Wang, S.H. Precipitation Hardening of High-Strength Low-Alloy Steels by Nanometer-Sized Carbides. Mater. Sci. Eng. A 2009, 449, 162–166. [Google Scholar] [CrossRef]
- Chen, J.; Wang, J.D. Precipitation Characteristics in a Low-Carbon Vanadium-Titanium-Bearing Steel. Steel Res. Int. 2015, 86, 821–824. [Google Scholar] [CrossRef]
- Garcia-Sesma, L.; Lopez, B.; Lopez, B.; Pereda, B. Effect of Coiling Conditions on the Strengthening Mechanisms of Nb Microalloyed Steels with High Ti Addition Levels. Mater. Sci. Eng. A 2019, 748, 386–395. [Google Scholar] [CrossRef]
- Patra, P.K.; Sam, S.; Singhai, M.; Hazra, S.S.; Ram, G.D.J.; Bakshi, S.R. Effect of Coiling Temperature on the Microstructure and Mechanical Properties of Hot-Rolled Ti-Nb Microalloyed Ultra High Strength Steel. Trans. Indian Inst. Met. 2017, 70, 1773–1781. [Google Scholar] [CrossRef]
- Hodgson, P.D.; Gibbs, R.K. A Mathematical Model to Predict the Mechanical Properties of Hot Rolled C-Mn and Microalloyed Steels. ISIJ Int. 1992, 32, 1329–1338. [Google Scholar] [CrossRef]
- Pereda, B.; Rodriguez-Ibabe, J.M.; Lopez, B. I Improved Model of Kinetics of Strain Induced Precipitation and Microstructure Evolution of Nb Microalloyed Steels during Multipass Rolling. ISIJ Int. 2008, 48, 1457–1466. [Google Scholar] [CrossRef]
- Akben, M.G.; Chandra, T.; Plassiard, P.; Jonas, J.J. Dynamic Precipitation and Solute Hardening in a Titanium Microalloyed Steel Containing Three Levels of Manganese. Acta Metall. 1984, 32, 591–601. [Google Scholar] [CrossRef]
- Liu, W.J.; Jonas, J.J. A Stress Relaxation Method for Following Carbonitride Precipitation in Austenite at Hot Working Temperatures. Metall. Trans. A 1988, 19, 1403–1413. [Google Scholar] [CrossRef]
- Liu, W.J.; Jonas, J.J. Ti(CN) Precipitation in Microalloyed Austenite during Stress Relaxation. Metall. Trans. A 1988, 19, 1415–1424. [Google Scholar] [CrossRef]
- Wang, Z.; Mao, X.; Yang, Z.; Sun, X.; Yong, Q.; Li, Z.; Wen, Y. Strain-induced Precipitation in a Ti Micro-Alloyed HSLA Steel. Mater. Sci. Eng. A 2011, 529, 459–467. [Google Scholar] [CrossRef]
- Wang, Z.; Sun, X.; Yang, Z.; Yong, Q.; Zhang, C.; Li, Z.; Weng, Y. Effect of Mn Concentration on the Kinetics of Strain Induced Precipitation in Ti Microalloyed Steels. Mater. Sci. Eng. A 2013, 561, 212–219. [Google Scholar] [CrossRef]
- Hong, S.G.; Kang, K.B.; Park, C.G. Strain-induced Precipitation of NbC in Nb and Nb-Ti Microalloyed HSLA Steels. Scripta Mater. 2002, 46, 163–168. [Google Scholar] [CrossRef]
- Okaguchi, S.; Hashimoto, T. Computer Model for Prediction of Carbonitride Precipitation during Hot Working in Nb-Ti Bearing HSLA Steels. ISIJ Int. 1992, 32, 283–290. [Google Scholar] [CrossRef]
- Fernandez, A.I.; Lopez, B.; Rodriguez-Ibabe, J.M. Relationship Between the Austenite Recrystallized Fraction and the Softening Measured from the Interrupted Torsion Test Technique. Scripta Mater. 1999, 40, 543–549. [Google Scholar] [CrossRef]
- Llanos, L.; Pereda, B.; Lopez, B. Interaction Between Recovery, Recrystallization and NbC Strain-Induced Precipitation in High-Mn Steels. Metall. Mater. Trans. A 2015, 46, 5248–5265. [Google Scholar] [CrossRef]
- Bechet, S.; Beaujard, L. New Reagent for the micrographical demonstration of the austenite grain of hardened or hardened-tempered steels. Rev. Met. 1955, 52, 830–836. [Google Scholar] [CrossRef]
- Andersson, J.O.; Helander, T.; Höglund, L.; Shi, P.F.; Sundman, B. Thermo-Calc and DICTRA, Computational Tools for Materials Science. Calphad 2002, 26, 273–312. [Google Scholar] [CrossRef]
- Thermo-Calc Software. TCFE9 Steels/Fe-Alloys Database; Thermo-Calc Software: Solna, Sweden.
- Hua, M.; Garcia, C.I.; DeArdo, A.J. Multi-phase Precipitates in Interstitial-Free Steels. Scripta Metall. Mater. 1993, 28, 973–978. [Google Scholar] [CrossRef]
- Pereda, B.; Lopez, B.; Rodriguez-Ibabe, J.M. Increasing the Non-Recrystallization Temperature of Nb Microalloyed Steels by Mo Addition. In Proceedings of the International Conference on Microalloyed Steels: Processing, Microstructure, Properties and Performance Proceedings, Pittsburgh, PA, USA, 16–19 July 2007; pp. 151–159. [Google Scholar]
- Pereda, B.; Aretxabaleta, Z.; Lopez, B. Softening Kinetics in High Al and High Al-Nb-Microalloyed Steels. J. Mater. Eng. Perform. 2015, 24, 1279–1293. [Google Scholar] [CrossRef]
- Larrañaga-Otegui, A.; Pereda, B.; Jorge-Badiola, D.; Gutierrez, I. Austenite Static Recrystallization Kinetics in Microalloyed, B. Steels. Metall. Mater. Trans. A 2016, 47, 3150–3164. [Google Scholar] [CrossRef]
- Llanos, L.; Pereda, B.; Lopez, B.; Rodriguez-Ibabe, J.M. Modelling of Static Recrystallization Behavior of High Manganese Austenitic Steels with Different Alloying Contents. ISIJ Int. 2016, 56, 1038–1047. [Google Scholar] [CrossRef]
- Dutta, B.; Palmiere, E.J.; Sellars, C.M. Modelling the Kinetics of Strain Induced Precipitation in Nb Microalloyed Steels. Acta Mater. 2001, 49, 785–794. [Google Scholar] [CrossRef]
- Nagata, M.T.; Speer, J.G.; Matlock, D.K. Titanium Nitride Precipitation Behaviour in Thin-Slab Cast High-Strength Low-Allow Steels. Metall. Mater. Trans. A 2002, 33, 3099–3110. [Google Scholar] [CrossRef]
- Abad, R.; Fernandez, A.I.; Lopez, B. Interaction Between Recrystallization and Precipitation during Multipass Rolling in a Low Carbon Niobium Microalloyed Steel. ISIJ Int. 2001, 41, 1373–1382. [Google Scholar] [CrossRef]
- Sellars, C.M. Hot Working and Forming Processes. In Proceedings of the International Conference, Sheffield, UK, 17–20 July 1979; Sellars, C.M., Davies, G.J., Eds.; Metals Society: London, UK, 1980; pp. 3–15. [Google Scholar]
- Beynon, J.H.; Sellars, C.M. Modelling Microstructure and Its Effects during Multipass Hot Rolling. ISIJ Int. 1992, 32, 359–367. [Google Scholar] [CrossRef]
- Sellars, C.M.; Whiteman, J.A. Recrystallization and Grain Growth in Hot Working. Met. Sci. 1979, 13, 187–194. [Google Scholar] [CrossRef]


© 2020 by the authors. Licensee MDPI, Basel, Switzerland. This article is an open access article distributed under the terms and conditions of the Creative Commons Attribution (CC BY) license (http://creativecommons.org/licenses/by/4.0/).