Article

Finite Element Analysis of Dynamic Recrystallization of Casting Slabs during Hot-Core Heavy Reduction Rolling Process

1
The State Key Laboratory of Rolling and Automation, Northeastern University, Shenyang 110819, China
2
Analytical and Testing Center, Inner Mongolia University of Science and Technology, Baotou 014010, China
*
Author to whom correspondence should be addressed.
Metals 2020, 10(2), 181; https://doi.org/10.3390/met10020181
Submission received: 1 January 2020 / Revised: 23 January 2020 / Accepted: 24 January 2020 / Published: 26 January 2020
(This article belongs to the Special Issue Modeling and Simulation of Metal Processing)

Abstract

:
Hot-core heavy reduction rolling (HHR2) is an innovative technology, where a two-high rolling mill is installed after the solidification end of a strand, which can significantly eliminate the core defects of the slab. The mill exhibits a heavy reduction ratio, which promotes the dynamic recrystallization (DRX) of the slab. This study aims to optimize the parameters of the HHR2 process considering the effect of DRX on microstructure homogeneity. The secondary development of commercial software DEFORM-3D is conducted to calculate the deformation and DRX behavior of HHR2 for different reduction ratios. The parameters of DRX volume fraction and DRX grain size are compared, and finer DRX grains are obtained when the greater reduction ratios are conducted in HHR2. Then, corresponding to the deformation conditions in the HHR2, the thermal–mechanical simulations are conducted on the Gleeble3800 to obtain the average grain sizes before and after this process. When the reduction amount increases from 20 mm to 50 mm, the difference of average grain size between the core and the surface reduces by 52%. In other words, appropriately enhancing the reduction ratio is helpful to reduce the average austenite grain and promote the microstructure uniformity of the slab. These results provide some valuable information on the design of deformation parameters for HHR2.

1. Introduction

As the raw material of hot-rolled steel, the quality of continuous casting slab has an essential influence on the quality of final products. The internal defects of continuous casting slab include center segregation, porosity, and shrinkage cavity. Owing to an insufficient reduction ratio, these defects cannot be effectively eliminated in the subsequent rolling processes; thus, heavy plates manufactured from slabs are always subjected to the deterioration of soundness and mechanical properties. Soft reduction (SR) technology helps reduce these inner defects of slabs during continuous casting [1,2,3]. The SR is generally applied to the central segregation forming region. The suitable reduction region of SR is different for distinct steel grades [4,5,6,7,8]. As reported by Thome and Karste [9], the SR should be conducted without creating internal cracks. Therefore, this technique generally allows a small reduction amount (a total reduction amount: 4–7 mm) to avoid the formation of internal cracks [10]. In this case, for blooms or slabs with larger sections, the amount of SR maybe not be sufficient to overcome the resistance of the thicker shell; therefore, the inner qualities could not be efficiently improved.
Heavy reduction (HR) technologies have been proposed to eliminate internal porosity defects of blooms or slabs with larger sections, which impose a larger reduction amount near the complete solidification point, where the solid fraction is approximately 0.8–1.0. A HR technology classified among forging technology [11] was used in continuous casting bloom to improve the center density, segregation, and solidification shrinkage cavity in Kawasaki Steel Corp. Sumitomo Metal Industries [12,13] also proposed a HR technology called “PCCS” to reduce the center porosity of slabs manufactured by Kashima Works. Heavy plates with a maximum thickness of 150 mm could be manufactured from the continuous casting slab using PCCS technology. A HR technology called “PosHARP” was also developed by POSCO to eliminate internal defects of the slab. Recently, a similar two-stage sequential HR method has been presented by Ji et al. [14], in which the reductions are conducted both before and after the solidification end to improve the homogeneity and compactness of the bloom, respectively. For these HR technologies, the deformation temperature of the core metal is in the brittleness temperature range [15,16]; thus, the internal are cracks easily formed in those HR processes discussed above. Moreover, these technologies adopted multi-pass compression to improve the quality of bloom or slab. However, according to the results of Zhao [17], the single-pass HR process is more effective than the multi-pass process for promoting void closure.
In recent studies [18,19], an innovative process called hot-core heavy reduction rolling (HHR2) was proposed to eliminate the internal porosity defects of casting steel with heavy thickness. In the HHR2 process, a two-high rolling mill is installed after the solidification end of the strand. According to an existing study, a new roll profile for HHR2 was designed to obtain the best effect on shrinkage closure [18]. The dynamic recrystallization (DRX) model of the Nb-Ti microalloyed steel was also established for the HHR2 deformation process [19]. In this study, the DRX model was embedded into the finite element software via secondary development. The DRX behavior of the slab during the HHR2 process was then investigated using a finite element analysis. The goal of the current study is to optimize the parameters of the HHR2 process from the perspective of microstructure homogeneity.

2. Material Models and FEM Simulations

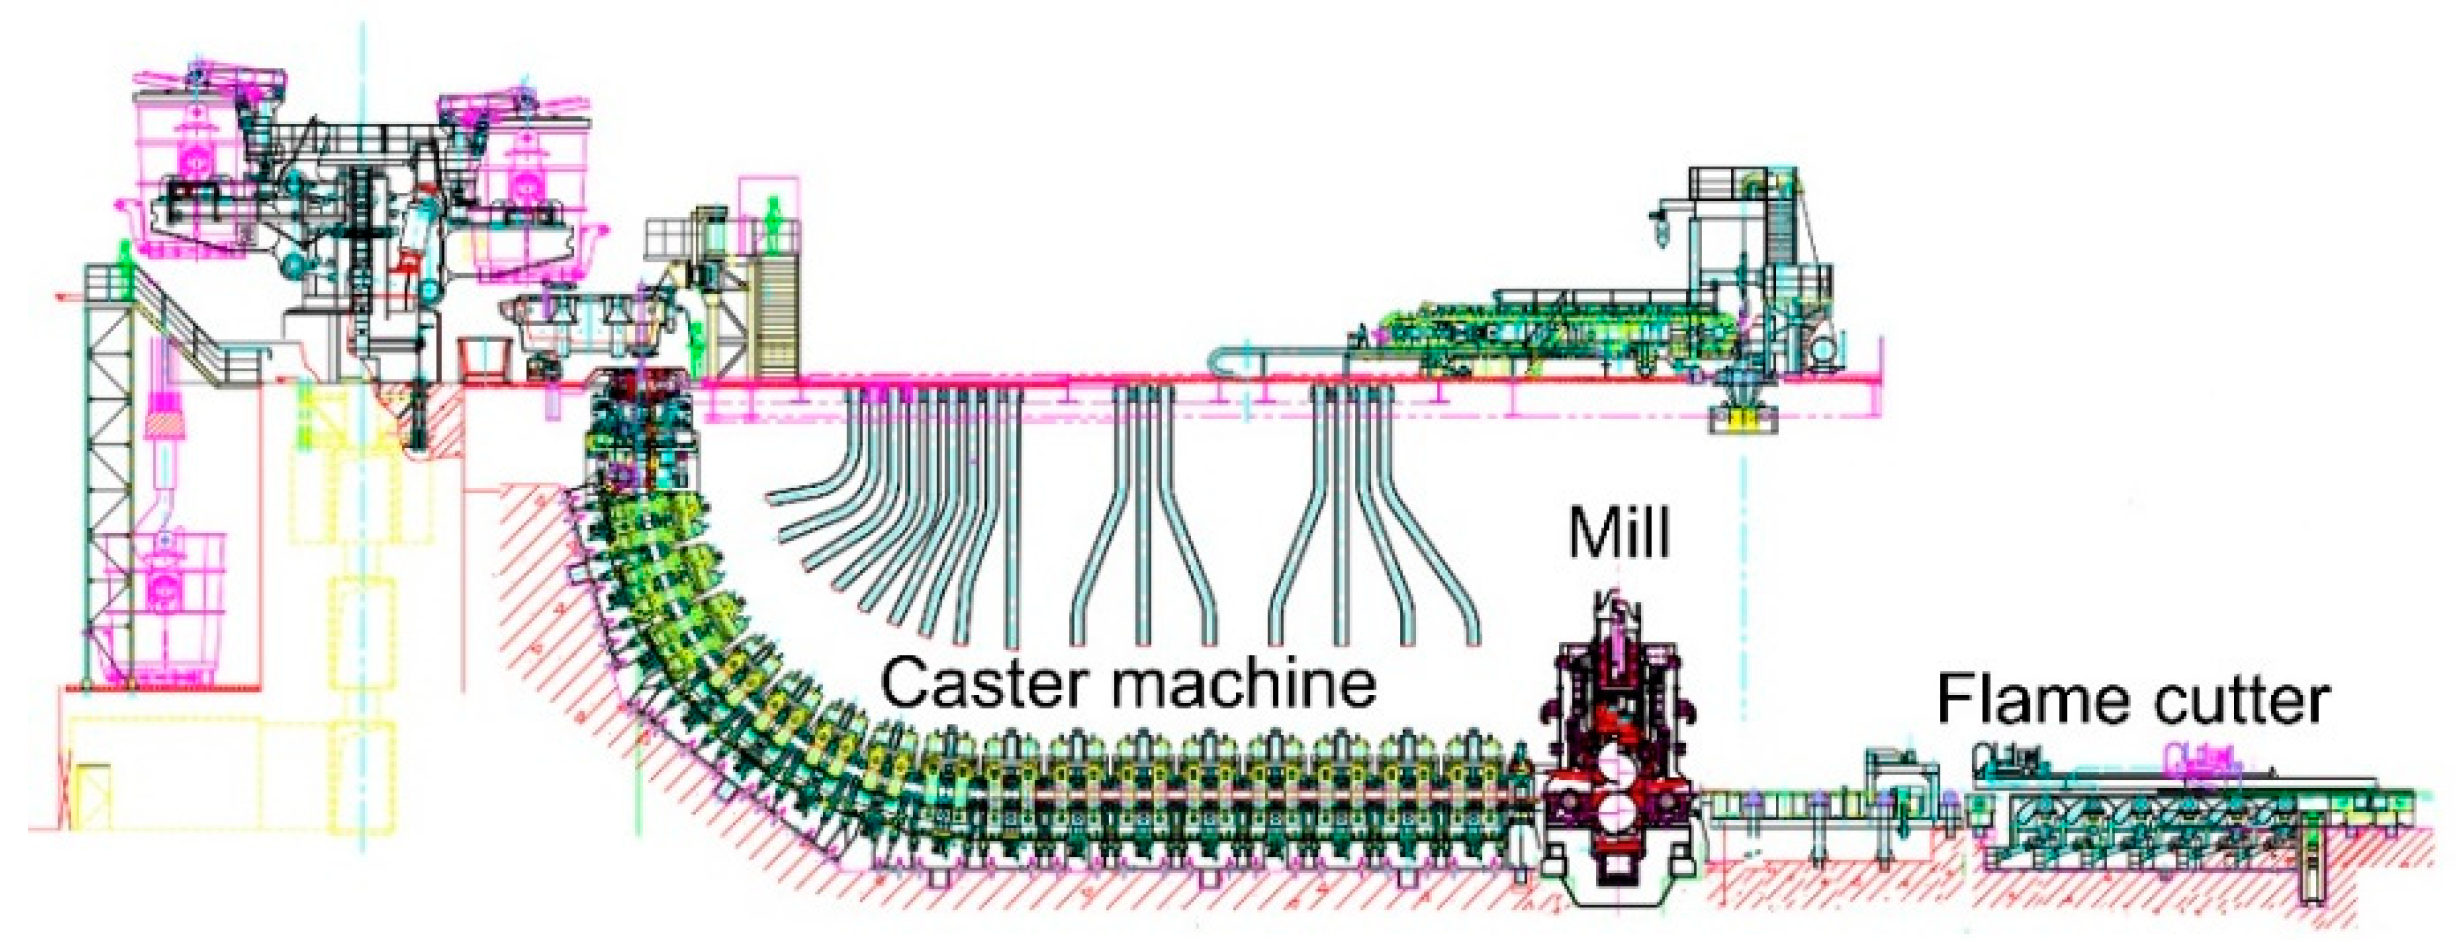
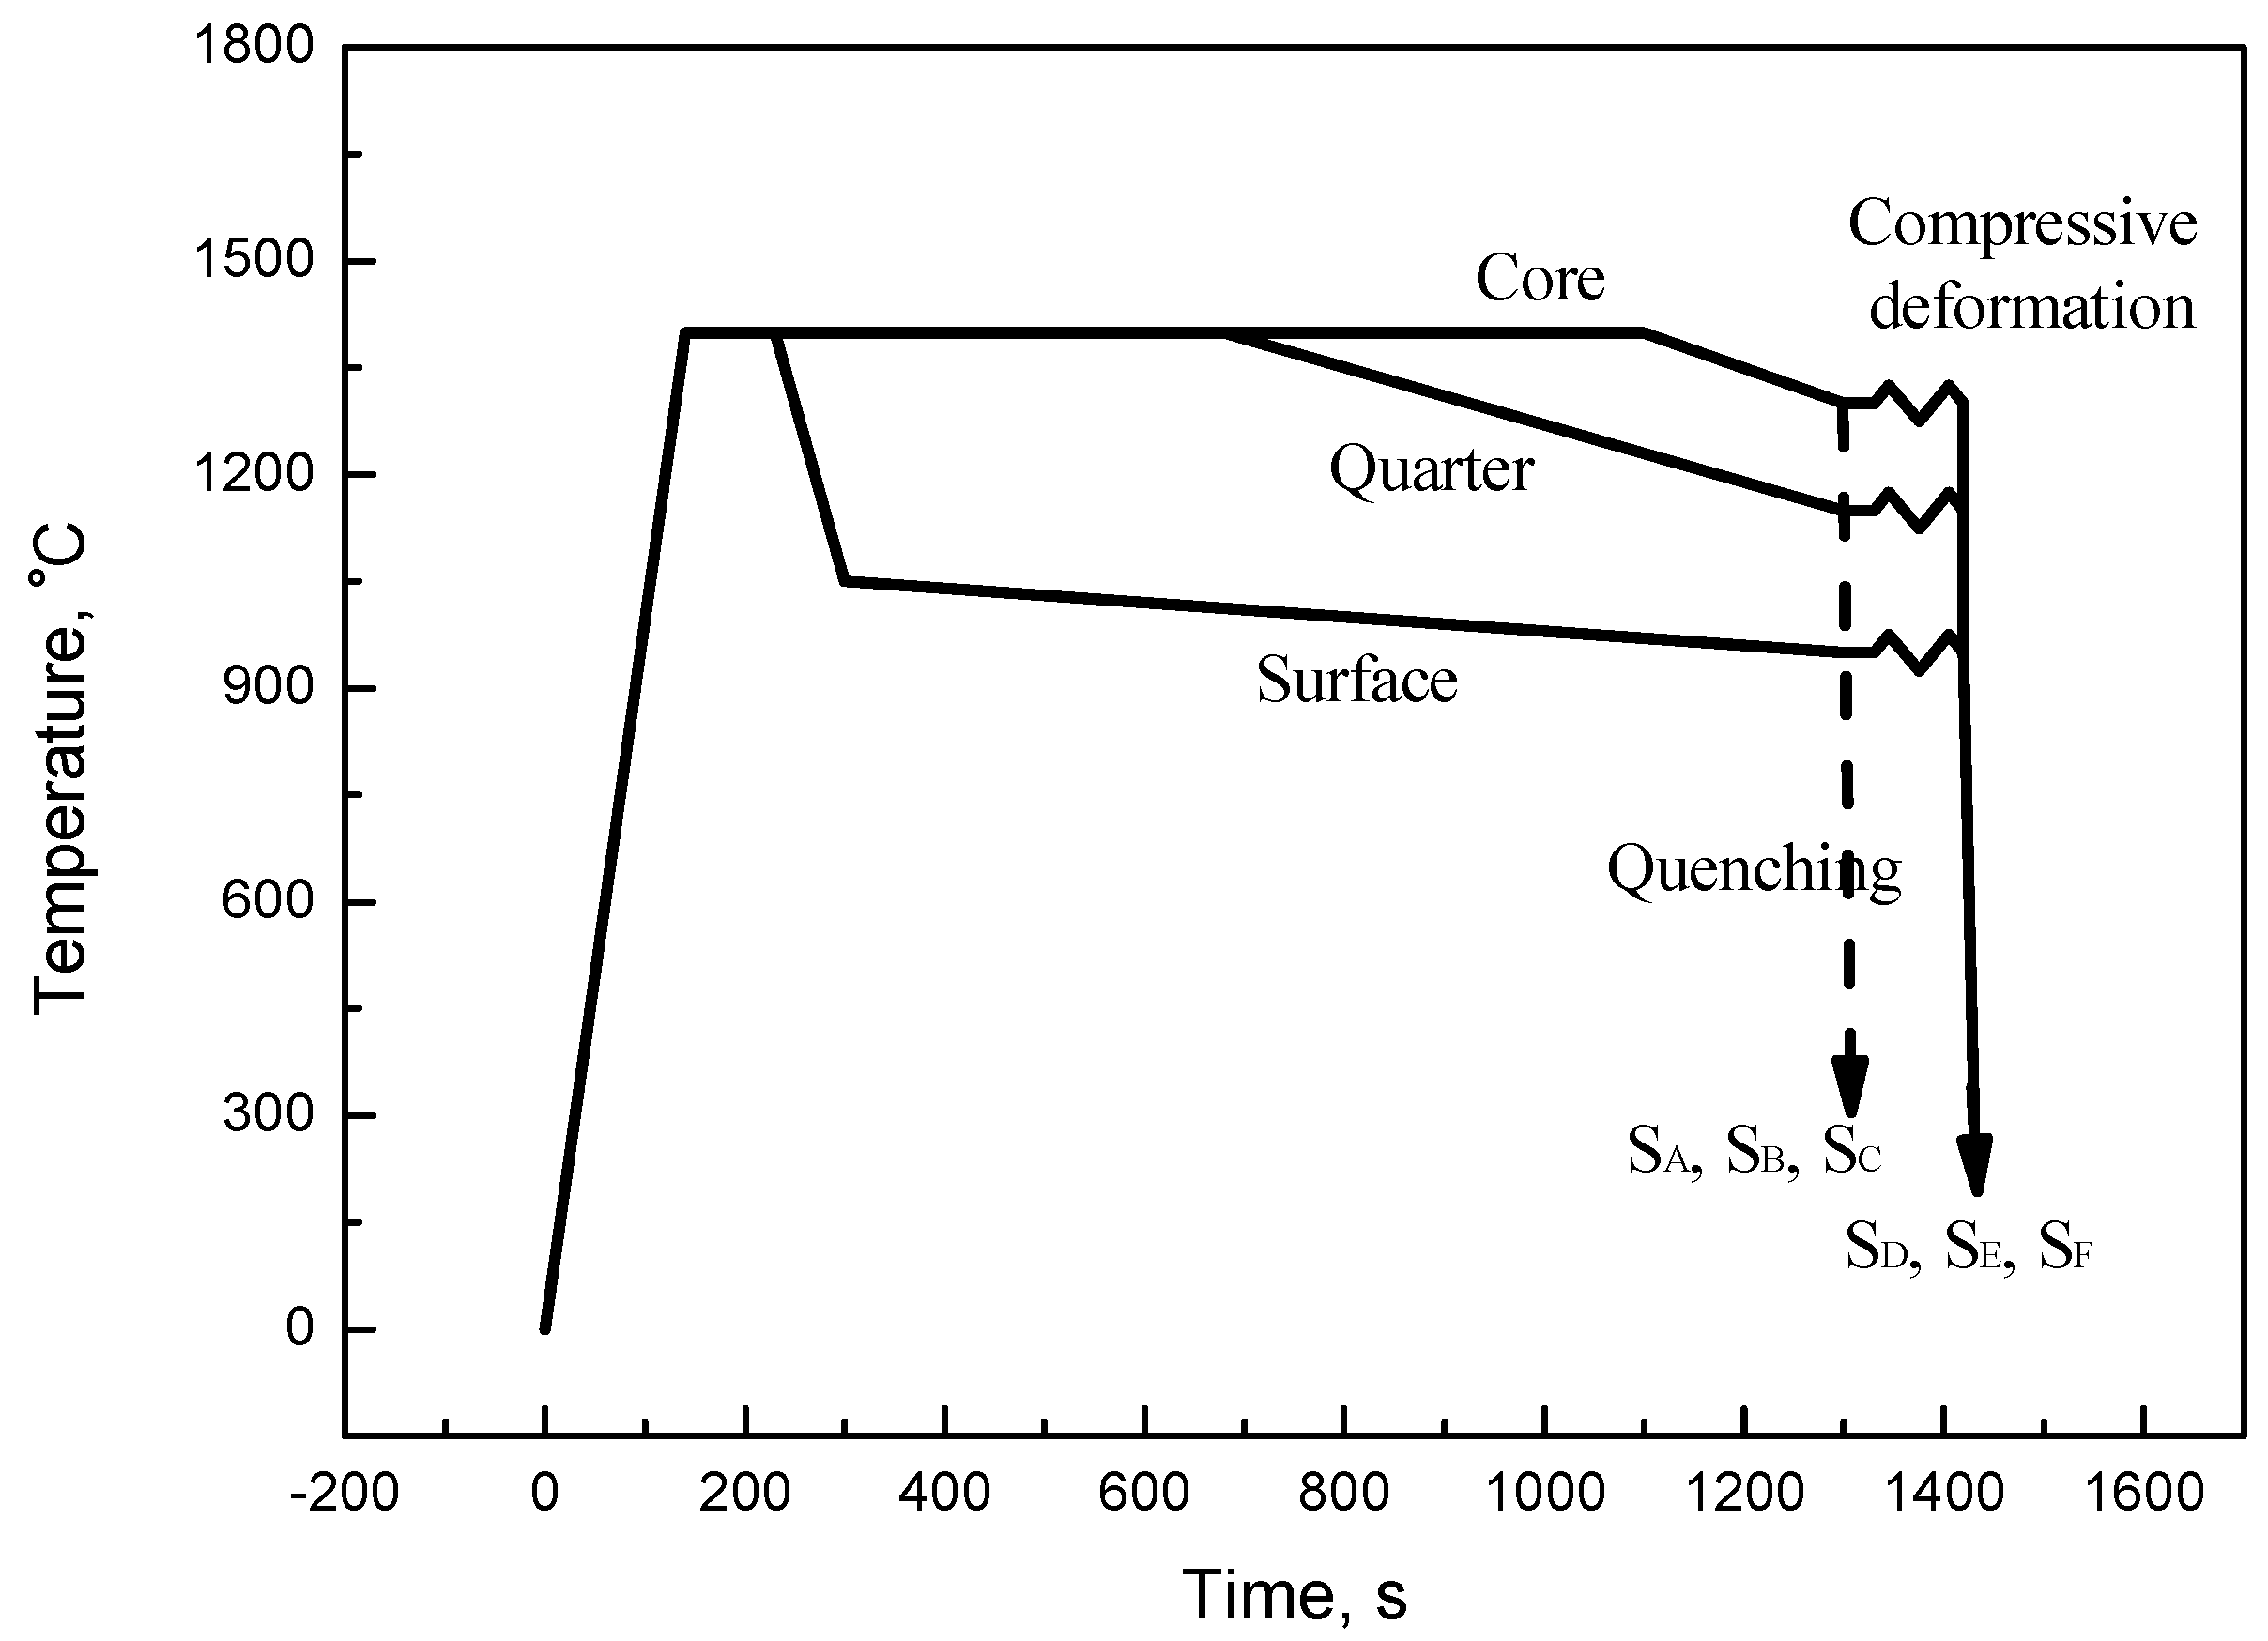
2.1. Process and Equipment Descriptions

The layout of HHR2 is shown in Figure 1. A mill is located downstream the continuous caster machine. After casting, the hot-core slab is directly rolled. Compared with conventional rolling process, inverse temperature distribution throughout the slab thickness is favorable for the deformation to penetrate into the core; therefore, DRX easily occurs at the core of the slab. Correspondingly, the center microstructure is significantly refined. In this study, an industrial vertical-bending-type continuous casting caster for slabs has been selected as the specific research objective. The caster was designed by bending and straightening the liquid core. The caster comprises 16 segments for guiding the slab. The main parameters of the caster are listed in Table 1. An irreversible rolling mill can realize the HHR2 process with a single pass. According to the mass flow constant principle, the rolling speed is synchronous with the casting speed of continuous caster. The main parameters of the mill are listed in Table 2.

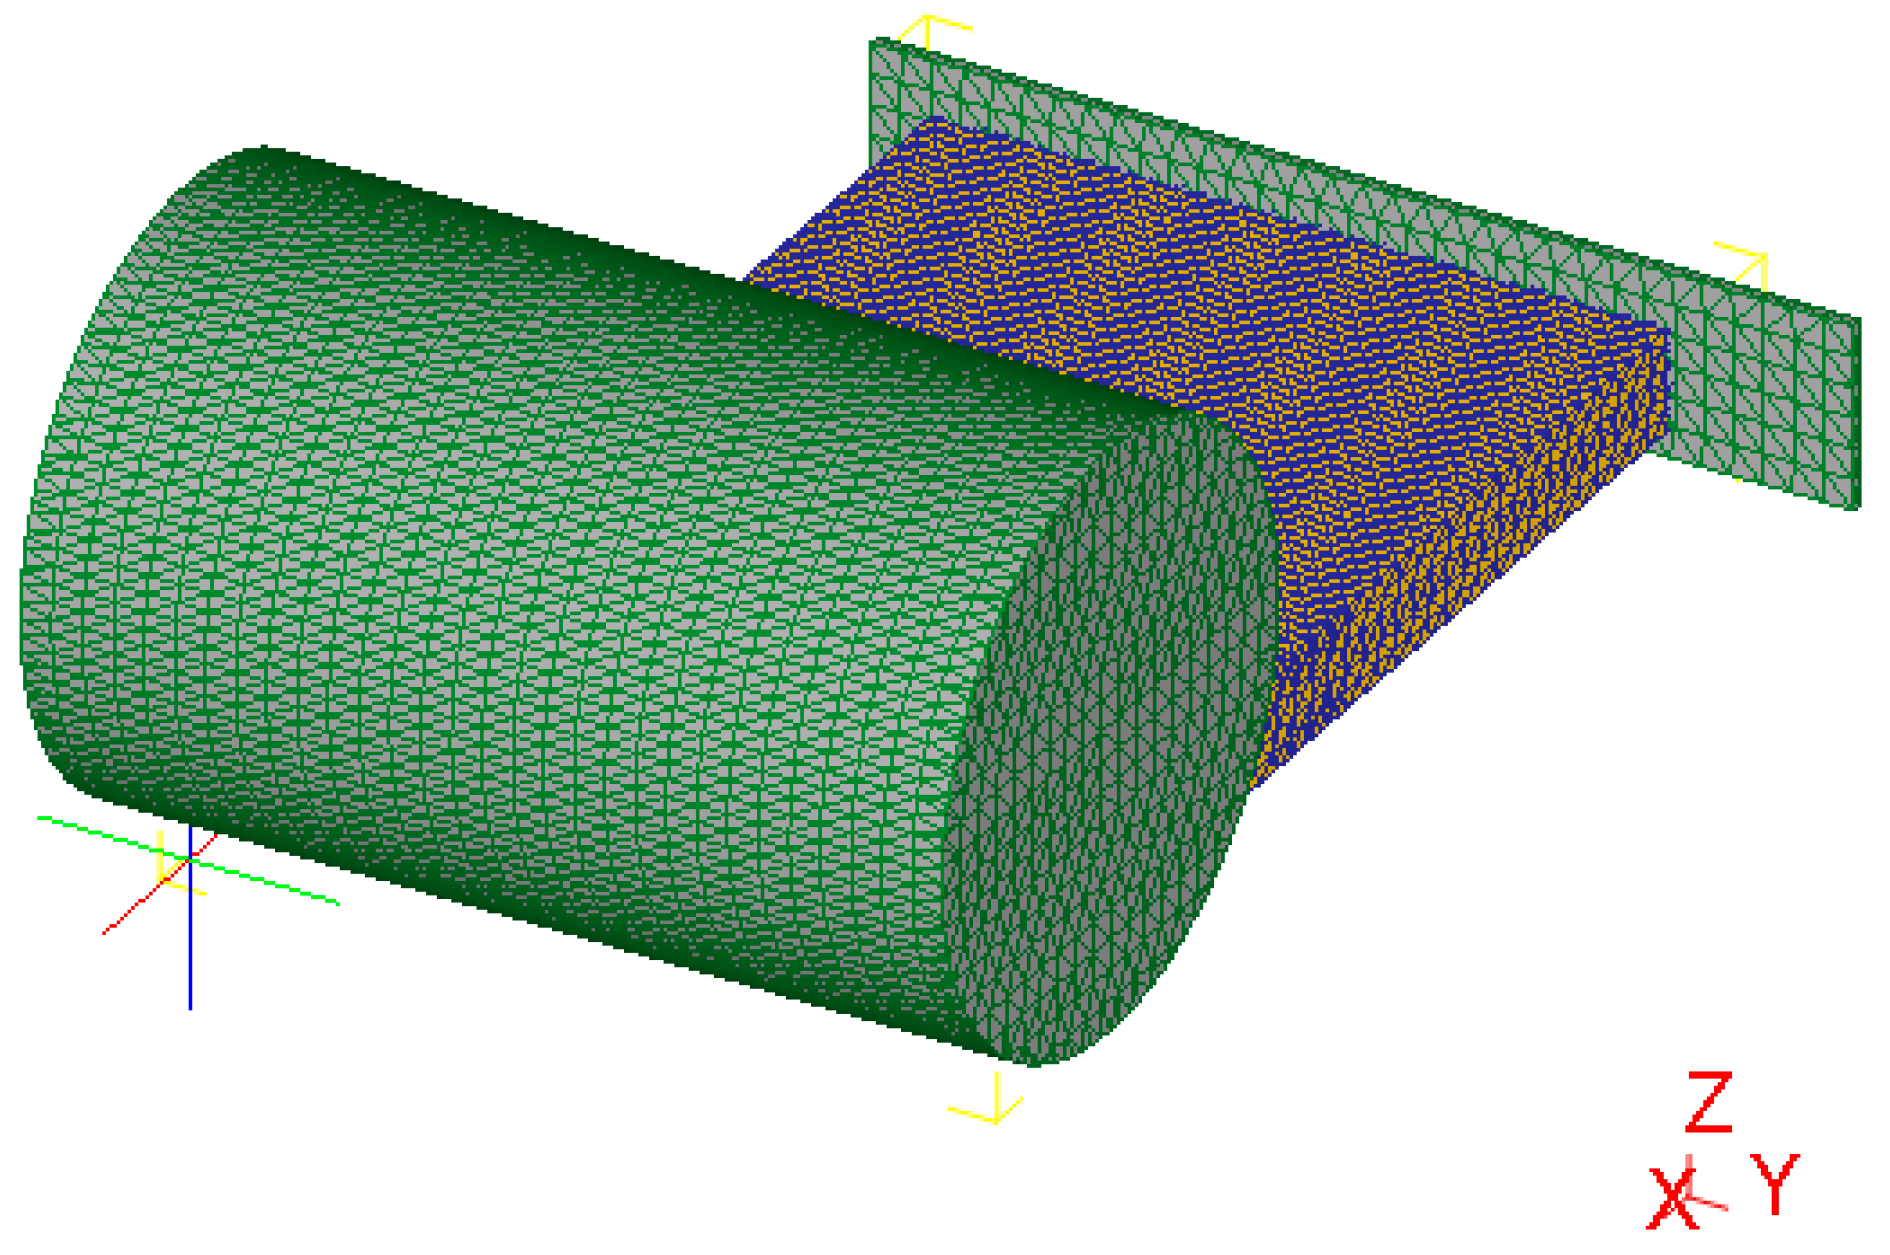
2.2. FEM Resolution Procedure

In the current study, the hot-core heavy reduction was conducted in a slab with a 330 × 2400 mm2 section, and a Nb–Ti microalloyed slab for heavy plates application was selected to obtain basic information on the behavior of materials under the HHR2 process. The chemical composition of the selected slab was C-0.098, Si-0.051, Mn-1.52, P-0.040, S-0.016, Cr-0.28, Ni-0.60, Al-0.028, Cu-0.264, Ti-0.02, Nb-0.022, N-0.003, and Fe-balance (wt%). The calculations included two stages of continuous casting and rolling. The temperature field of the slab was calculated during the continuous casting stage, and the results of the temperature field were used as the initial temperature state for the following rolling calculation. During the continuous casting process, a 3-D thermal model was established using the commercial software ABAQUS (ABAQUS 6.14, Dassault Systemes Simulia Corp., Providence, RI, USA) to obtain the temperature evolution of the slab. Based on the industrial production conditions, the superheat in a tundish was 35 °C and the casting speed was 0.6 m/min. In the secondary cooling zone of continuous casting, the equivalent convection coefficients were calculated by considering the spray water density and thermal radiation. The measured surface temperature was used to verify the heat transfer behavior, and the surface temperature was collected from online production by the thermal imager (FLIR SC620, FLIR Systems, Inc., Wilsonville, OR, USA), as shown in Figure 2. The calculated results and measured temperatures are compared in Figure 3, and their values at the corresponding positions are fairly similar, which means the calculation is reliable.
During the rolling calculation, the 3-D thermal–mechanical coupled model was established using DEFORM-3D to simulate the HHR2 process, and the 1/4 finite element model was revealed in Figure 4. In this model, the roller and slab were defined as the rigid body and viscoplastic material, respectively. A tetrahedral mesh was used, and the number of elements is 15,320. According to the calculation experience of rolling process of medium plate, this mesh density can ensure the accuracy of the calculation. The temperature field calculated from continuous casting was used as the initial condition of the rolling stage by defining the node temperature. The temperature-dependent material properties such as Poisson’s ratio, Young modulus, thermal conductivity, and specific heat were obtained from authors’ own studies [18], which covered the temperature range of the HHR2 process. The Hansel–Spittel model was selected to describe the relationship between strain and stress, as shown in Equation (1). The shear friction model was applied to describe the friction between the work roller and the workpiece, and the friction coefficient can be defined as a function of temperature [20], which was expressed as Equation (2).
σ = 27.49 e 0.0035 T ε 0.00428 ε ˙ 0.391 e 0.000011 ε ( 1 + ε ) 0.000913 T e 0.00012 ε ε ˙ 0.00042 T T 0.932
where σ is flow stress, MPa; ε is strain; ε ˙ is strain rate, s−1; and T is temperature, K.
{ τ = m k m = 1.06 0.0006 T a b s
where τ is the friction stress, MPa; m is the friction coefficient; k is the shear stress, MPa; and T a b s is temperature, K.

2.3. Modeling of DRX during HHR2

According to a previous work [19], for the Nb–Ti microalloyed steel selected in this study, hot compressive deformation tests were conducted using thermo-mechanical simulator (Gleeble-3800, Dynamic Systems Inc., Poestenkill, NY, USA). The specimens were reheated to 1400 °C and held for 180 s to ensure that the austenite grain size was close to the coarse grain size of the original continuously cast slab. Next, they were cooled at the deformation temperature and held for 15 s. The tested temperatures were 850–1350 °C, and the strain rates ranged from 0.01 s−1 to 1 s−1. After deformation, the specimens were water quenched to room temperature to retain austenite morphology at high temperatures. The quenched samples were polished to mirror finish and etched in saturated picric acid by adding a wetting agent and hydrofluoric acid in a water bath heated at 70 °C for approximately 145 s. Based on the above experimental method, three paralleled tests were carried out, and the average values were used in modeling to reduce the experimental error.
The kinetic model of DRX for the selected steel were established using Johnson Mehl–Avrami (JMA) equation, which is expressed in Equations (3)–(5).
ε c = 0.02375 [ ε ˙ exp ( 331293 8.314 T ) ] 0.0619
ε p = 0.0161 [ ε ˙ exp ( 331293 8.314 T ) ] 0.1088
X = 1 exp [ 0.38456 ( ε ε c ε p ) 4.442 ]
where ε, εc, and εp are DRX critical strain, peak strain, and effective strain, respectively; ε ˙ is the strain rate, s−1; T is the temperature, K; and X is the recrystallization volume fraction.
During hot deformation, when the value of equivalent strain ε is higher than that of DRX critical strain εc, the DRX behavior will then occur. Thus, the criteria for DRX initiation f can be expressed as Equation (6), which is the function of strain, temperature, and strain rate.
f ( ε , T , ε ˙ ) = ε ε c ( T , ε ˙ ) 1.0
The austenite grain size at different deformation conditions was measured using an intercept linear method. The recrystallized grain size model was then established and described as Equation (7).
d rex = 2047.072 ε ˙ 0.1409 exp ( 36229 R T )
where drex is recrystallized grain size, mm; ε ˙ is the strain rate, s−1; T is the deformation temperature, K; and R is the universal gas constant, J·mol−1·k−1.
Equations (5)–(7) were coded in Fortran and embedded into the commercial software DEFORM-3D (Scientific Forming Technologies Corporation, Columbus, OH, USA). The influence of reduction amount on DRX and that of microstructure homogeneity on thickness were then investigated using the finite element analysis method.

3. Results and Discussions

As described above, owing to the mill, a large reduction is observed near the strand where the slab is wholly solidified during the HHR2 process. Supposing the reduction amounts are 20 mm, 30 mm, and 50 mm, respectively, the deformation and DRX are compared in detail in this section.

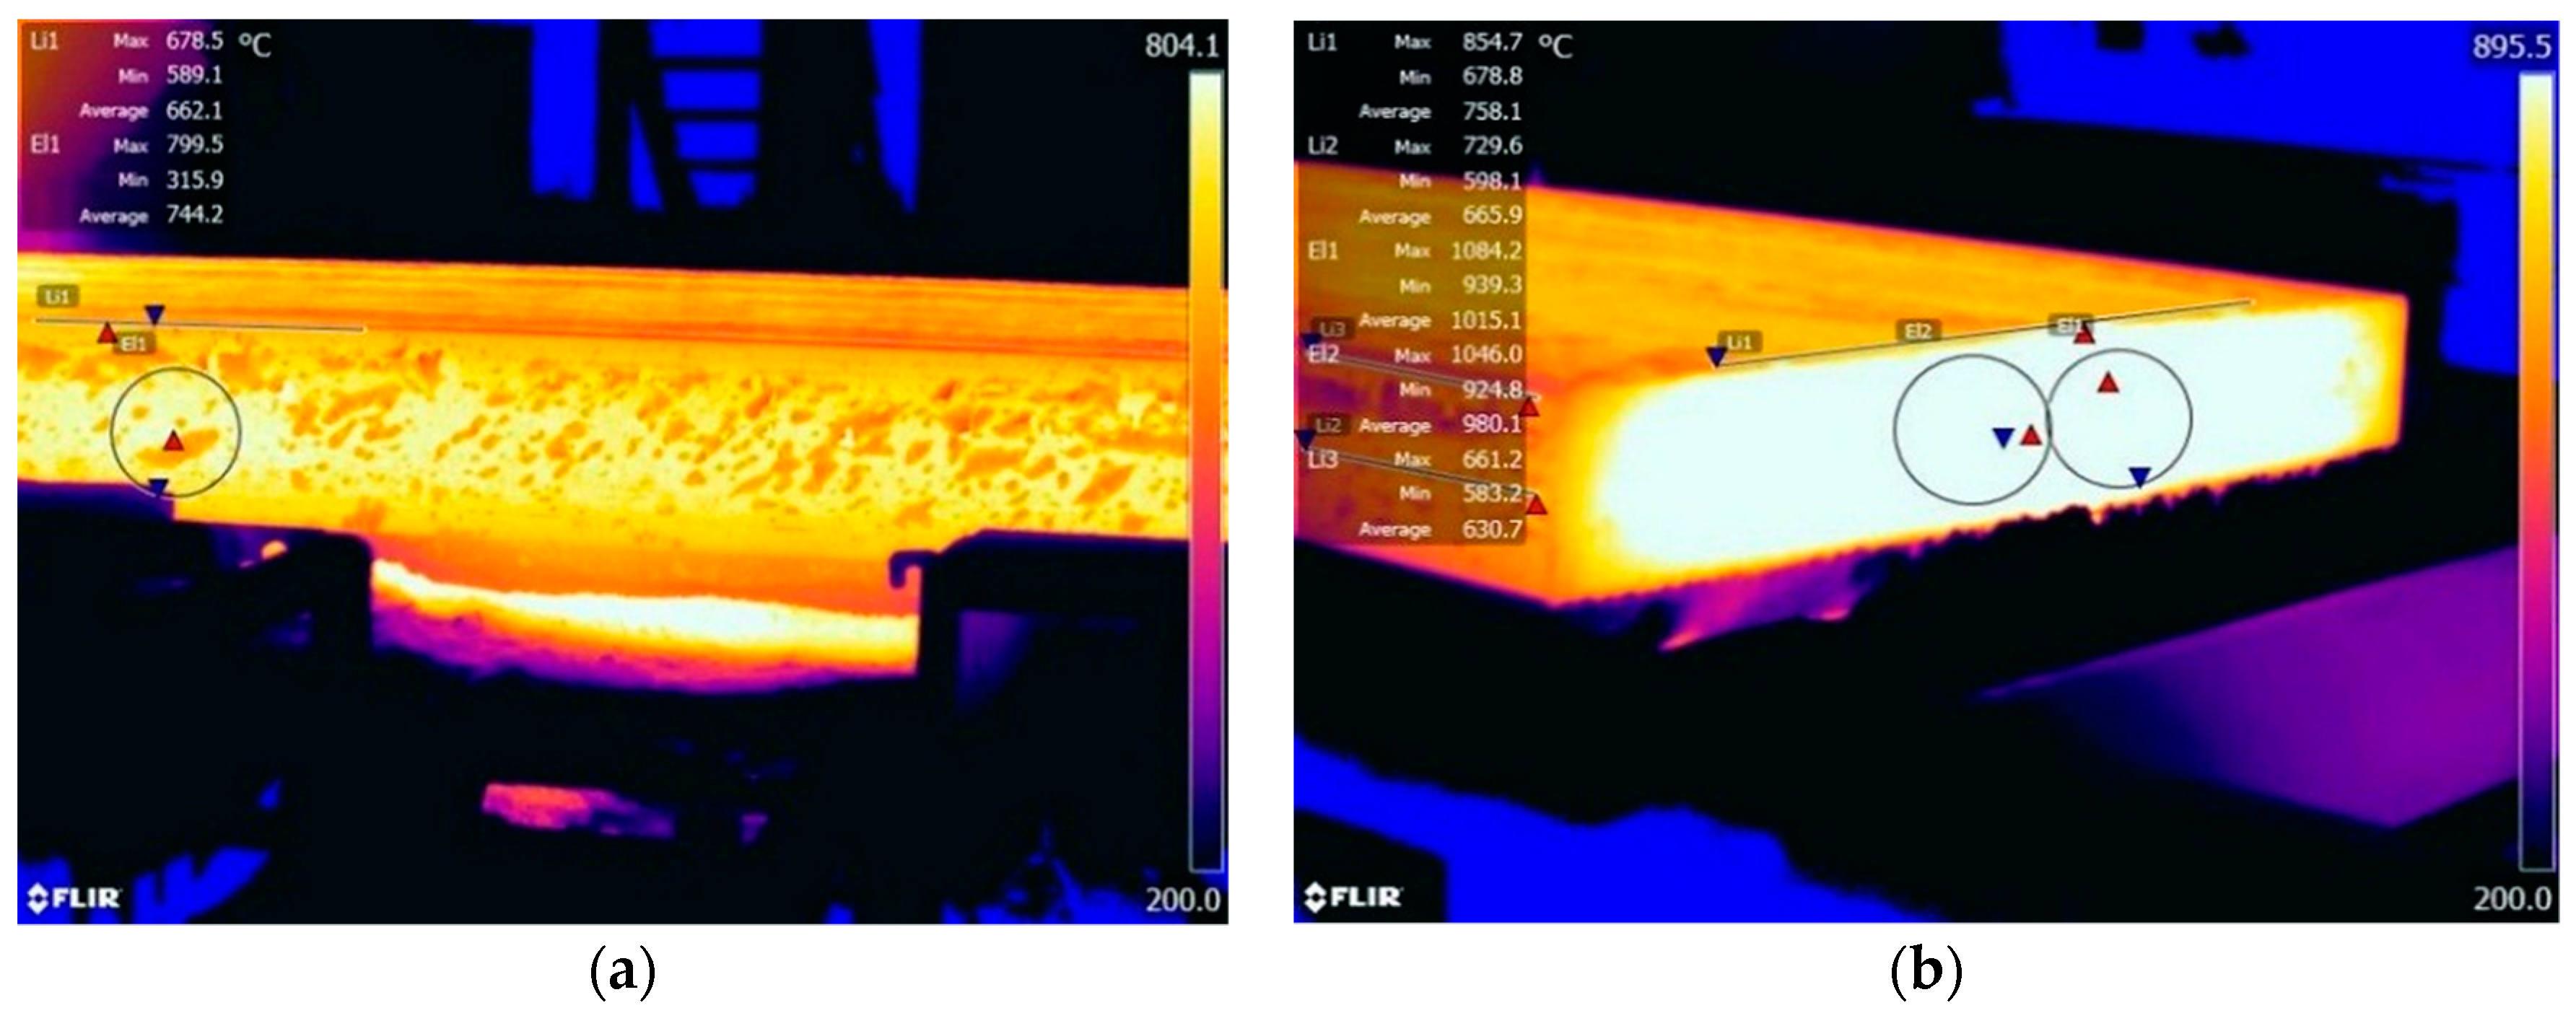
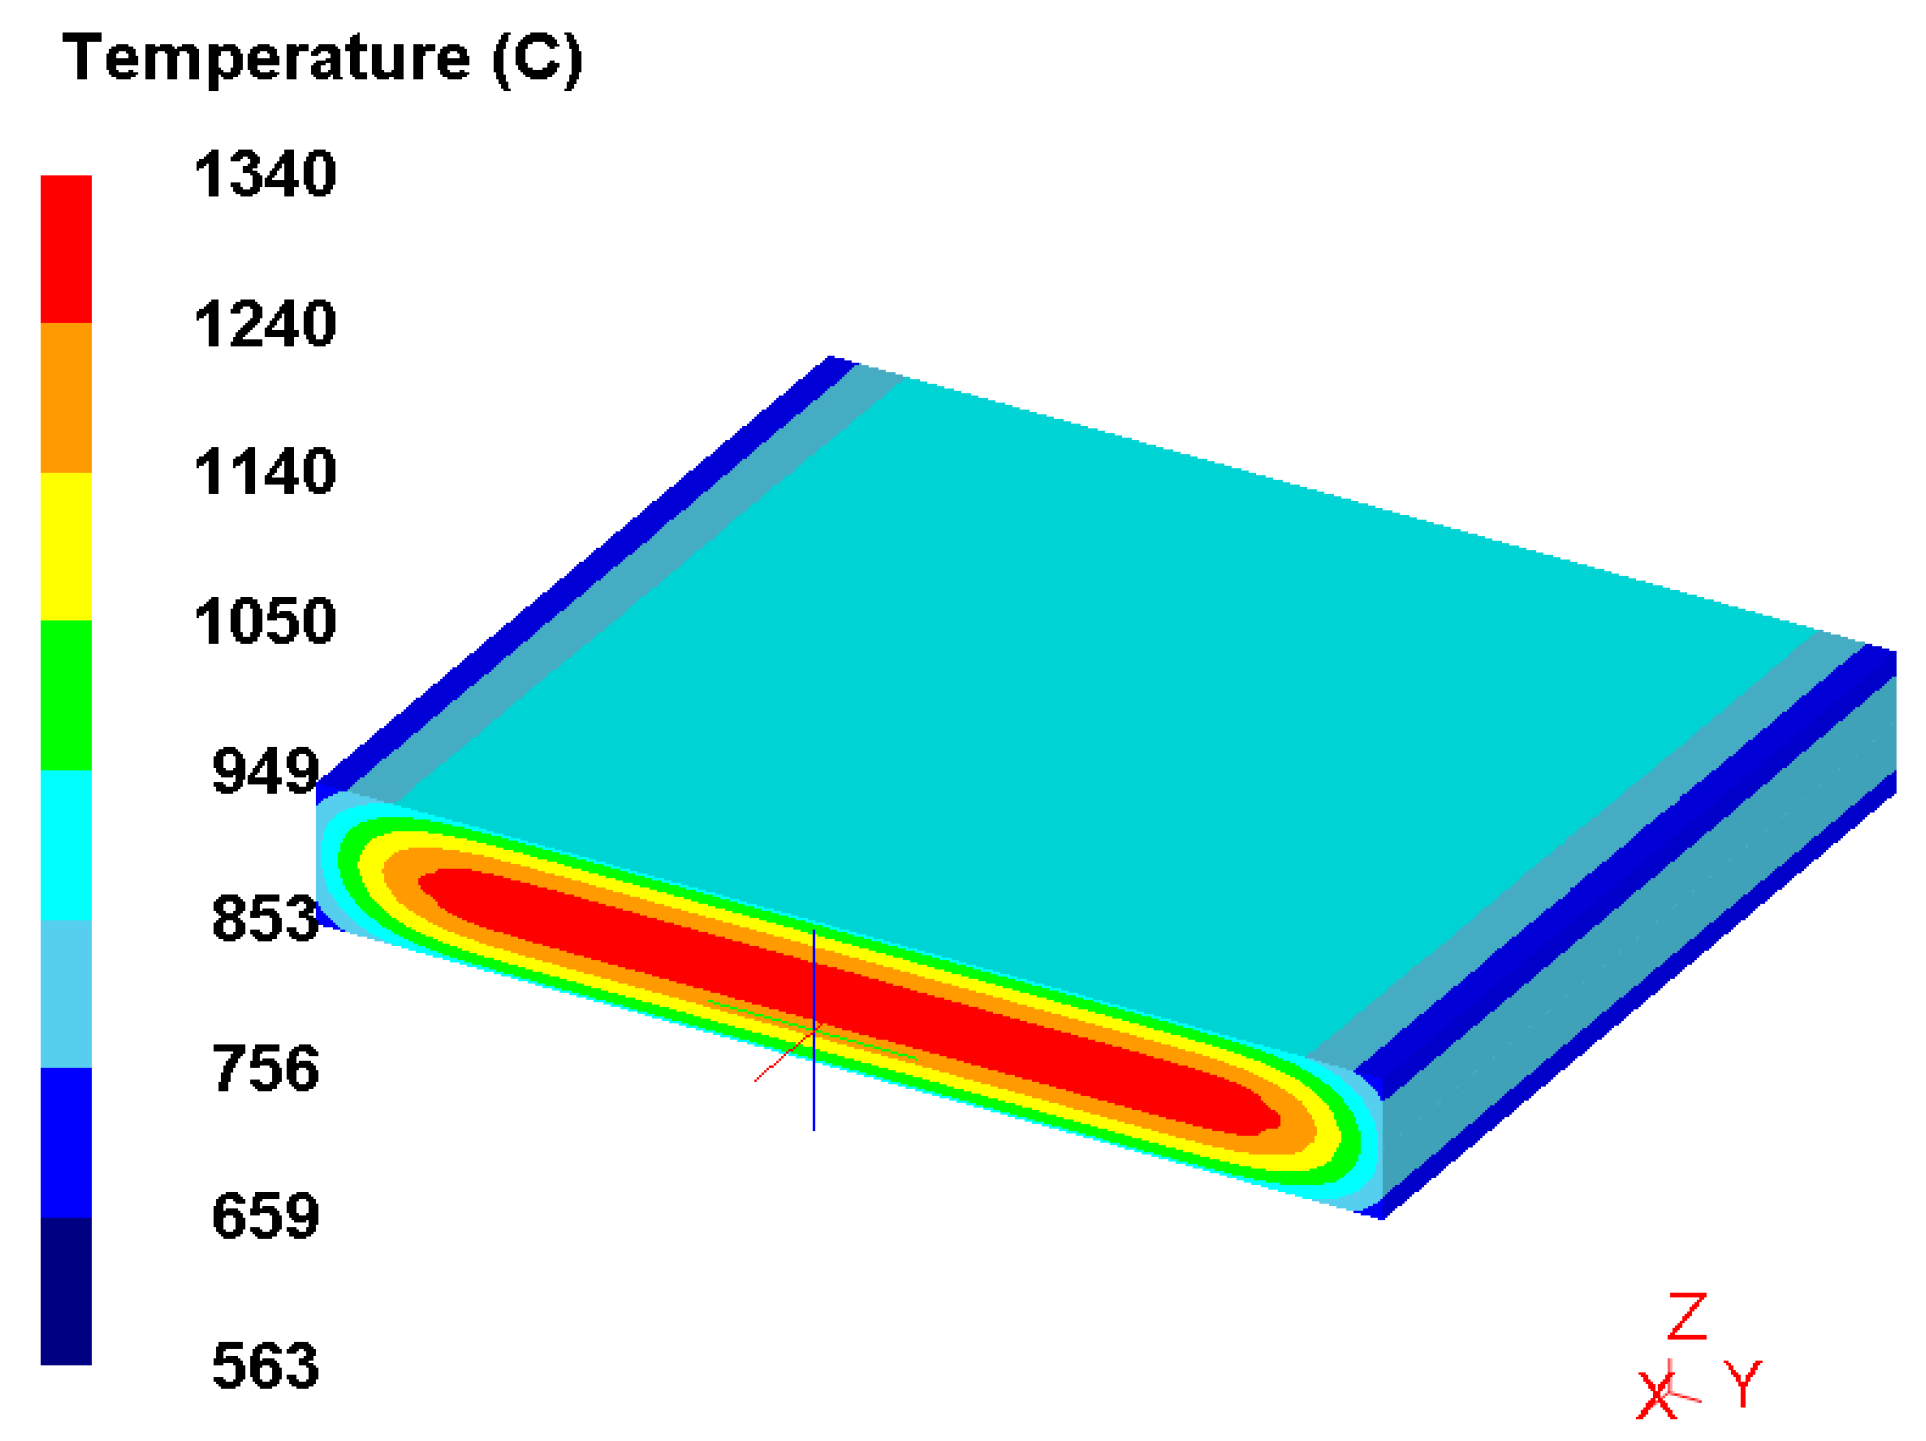
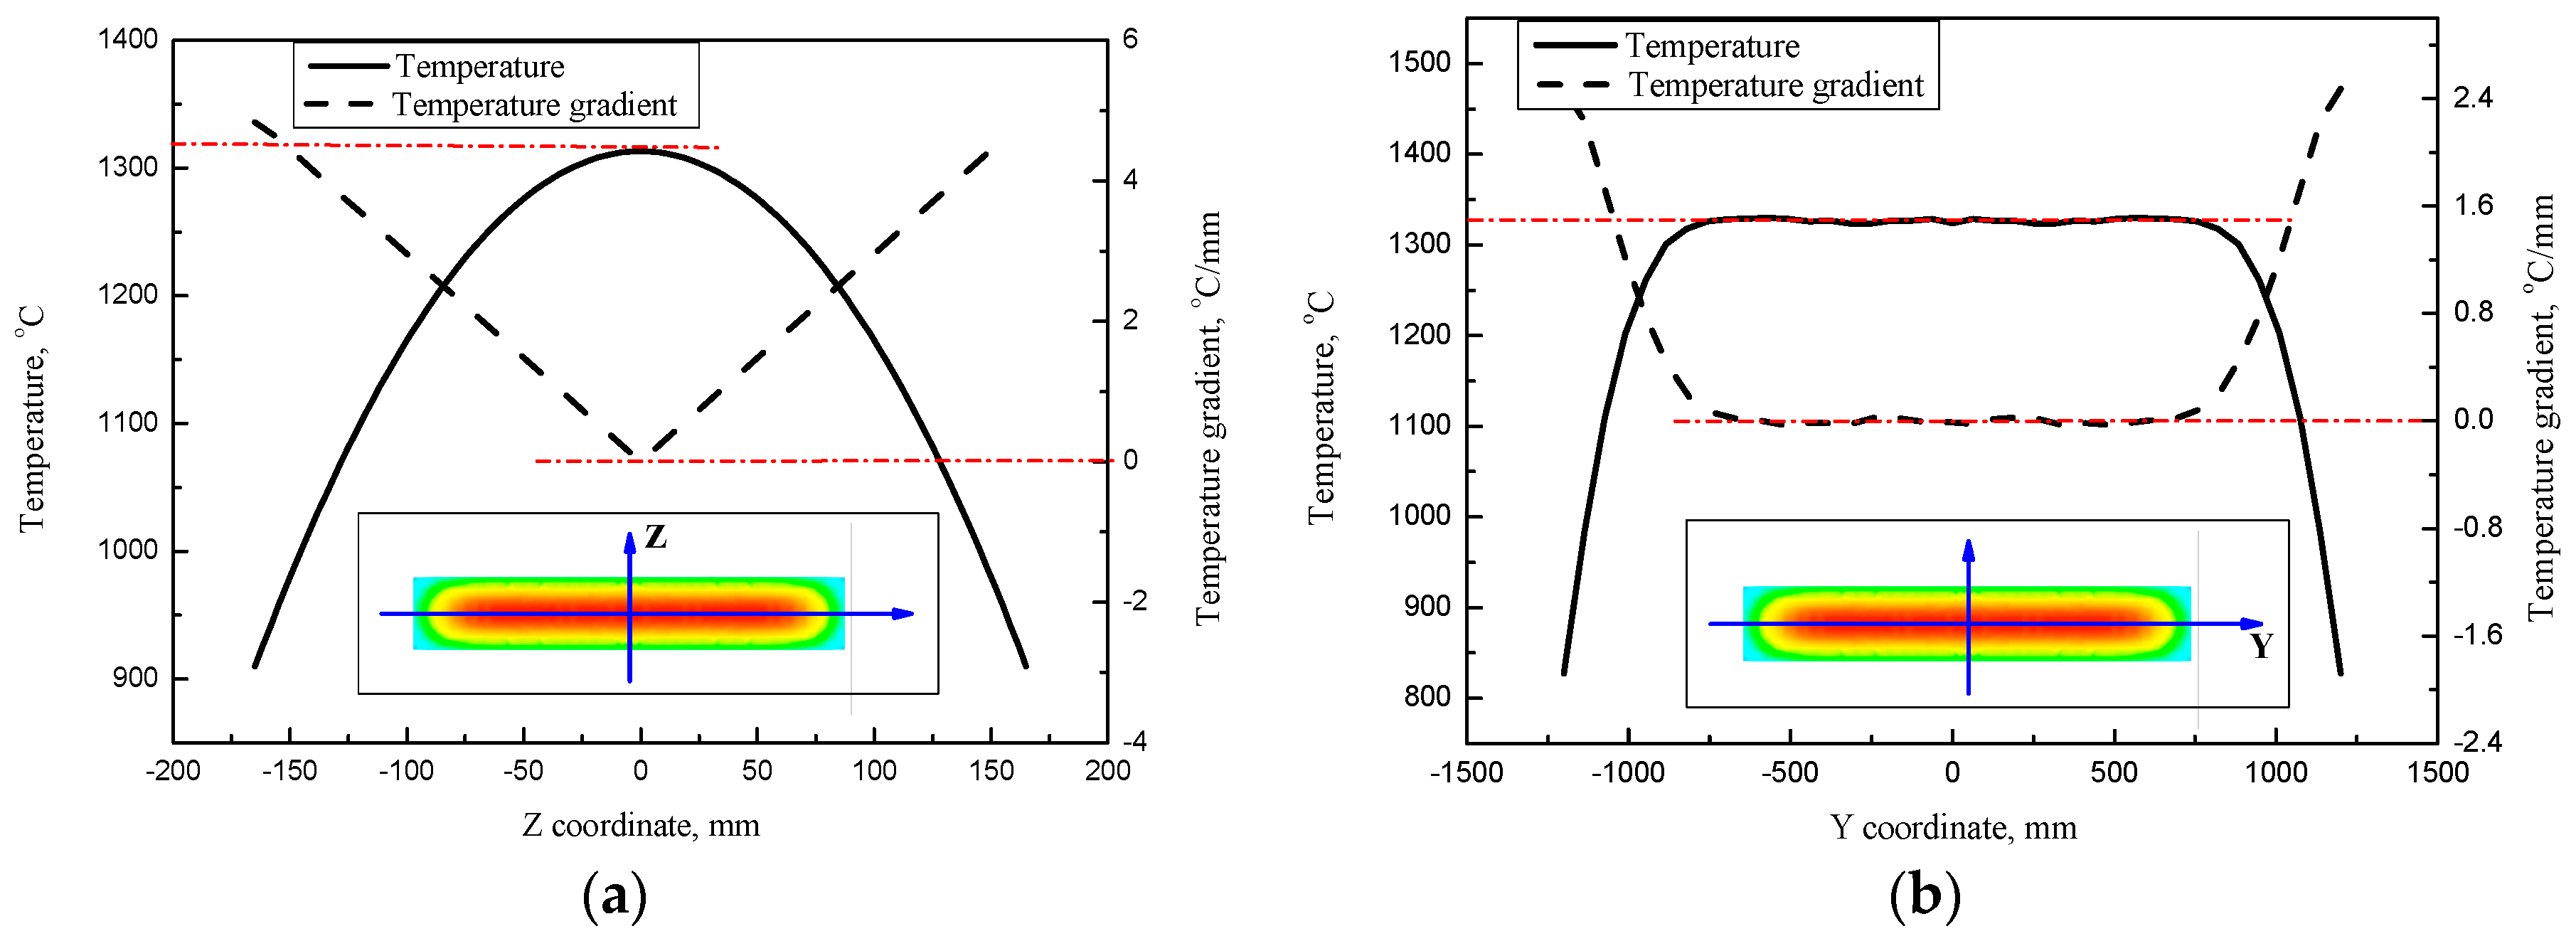
3.1. Temperature Distribution in Slab During HHR2

The temperature distribution is a primary factor that influences the deformation and DRX behavior of the slab. The characteristic of temperature in the HHR2 process is fairly different from that in hot rolling. The calculated temperature field of the slab before HHR2 is shown in Figure 5. The core temperature is the highest, whose value is 1324 °C. Moreover, a low temperature is obtained on the surface, and the values at the middle of the upper and lateral surfaces of the slab are 922 °C and 830 °C, respectively. The corner temperature is lowest at 702 °C.
Owing to the effect of secondary cooling of continuous casting, a large temperature difference is presented along the thickness of the slab. A planar coordinate system is established by considering the center of the cross-section as the origin of the coordinates. Thus, the temperatures at different positions can be quantitatively expressed accurately. The temperature gradient is defined as the absolute value of the partial derivative of temperature with respect to directional coordinates. Figure 6 reveals the distributions of temperature and temperature gradient along with the directions of x = 0 and y = 0. The temperature gradient decrease from the lateral surface to the inner at the edge of the slab, and its value at the inner with the width of 1500 mm is equal to zero. However, the temperature gradient falls all along thickness from the upper surface to the core, which is nearly a liner relation dependent on the z coordinate.

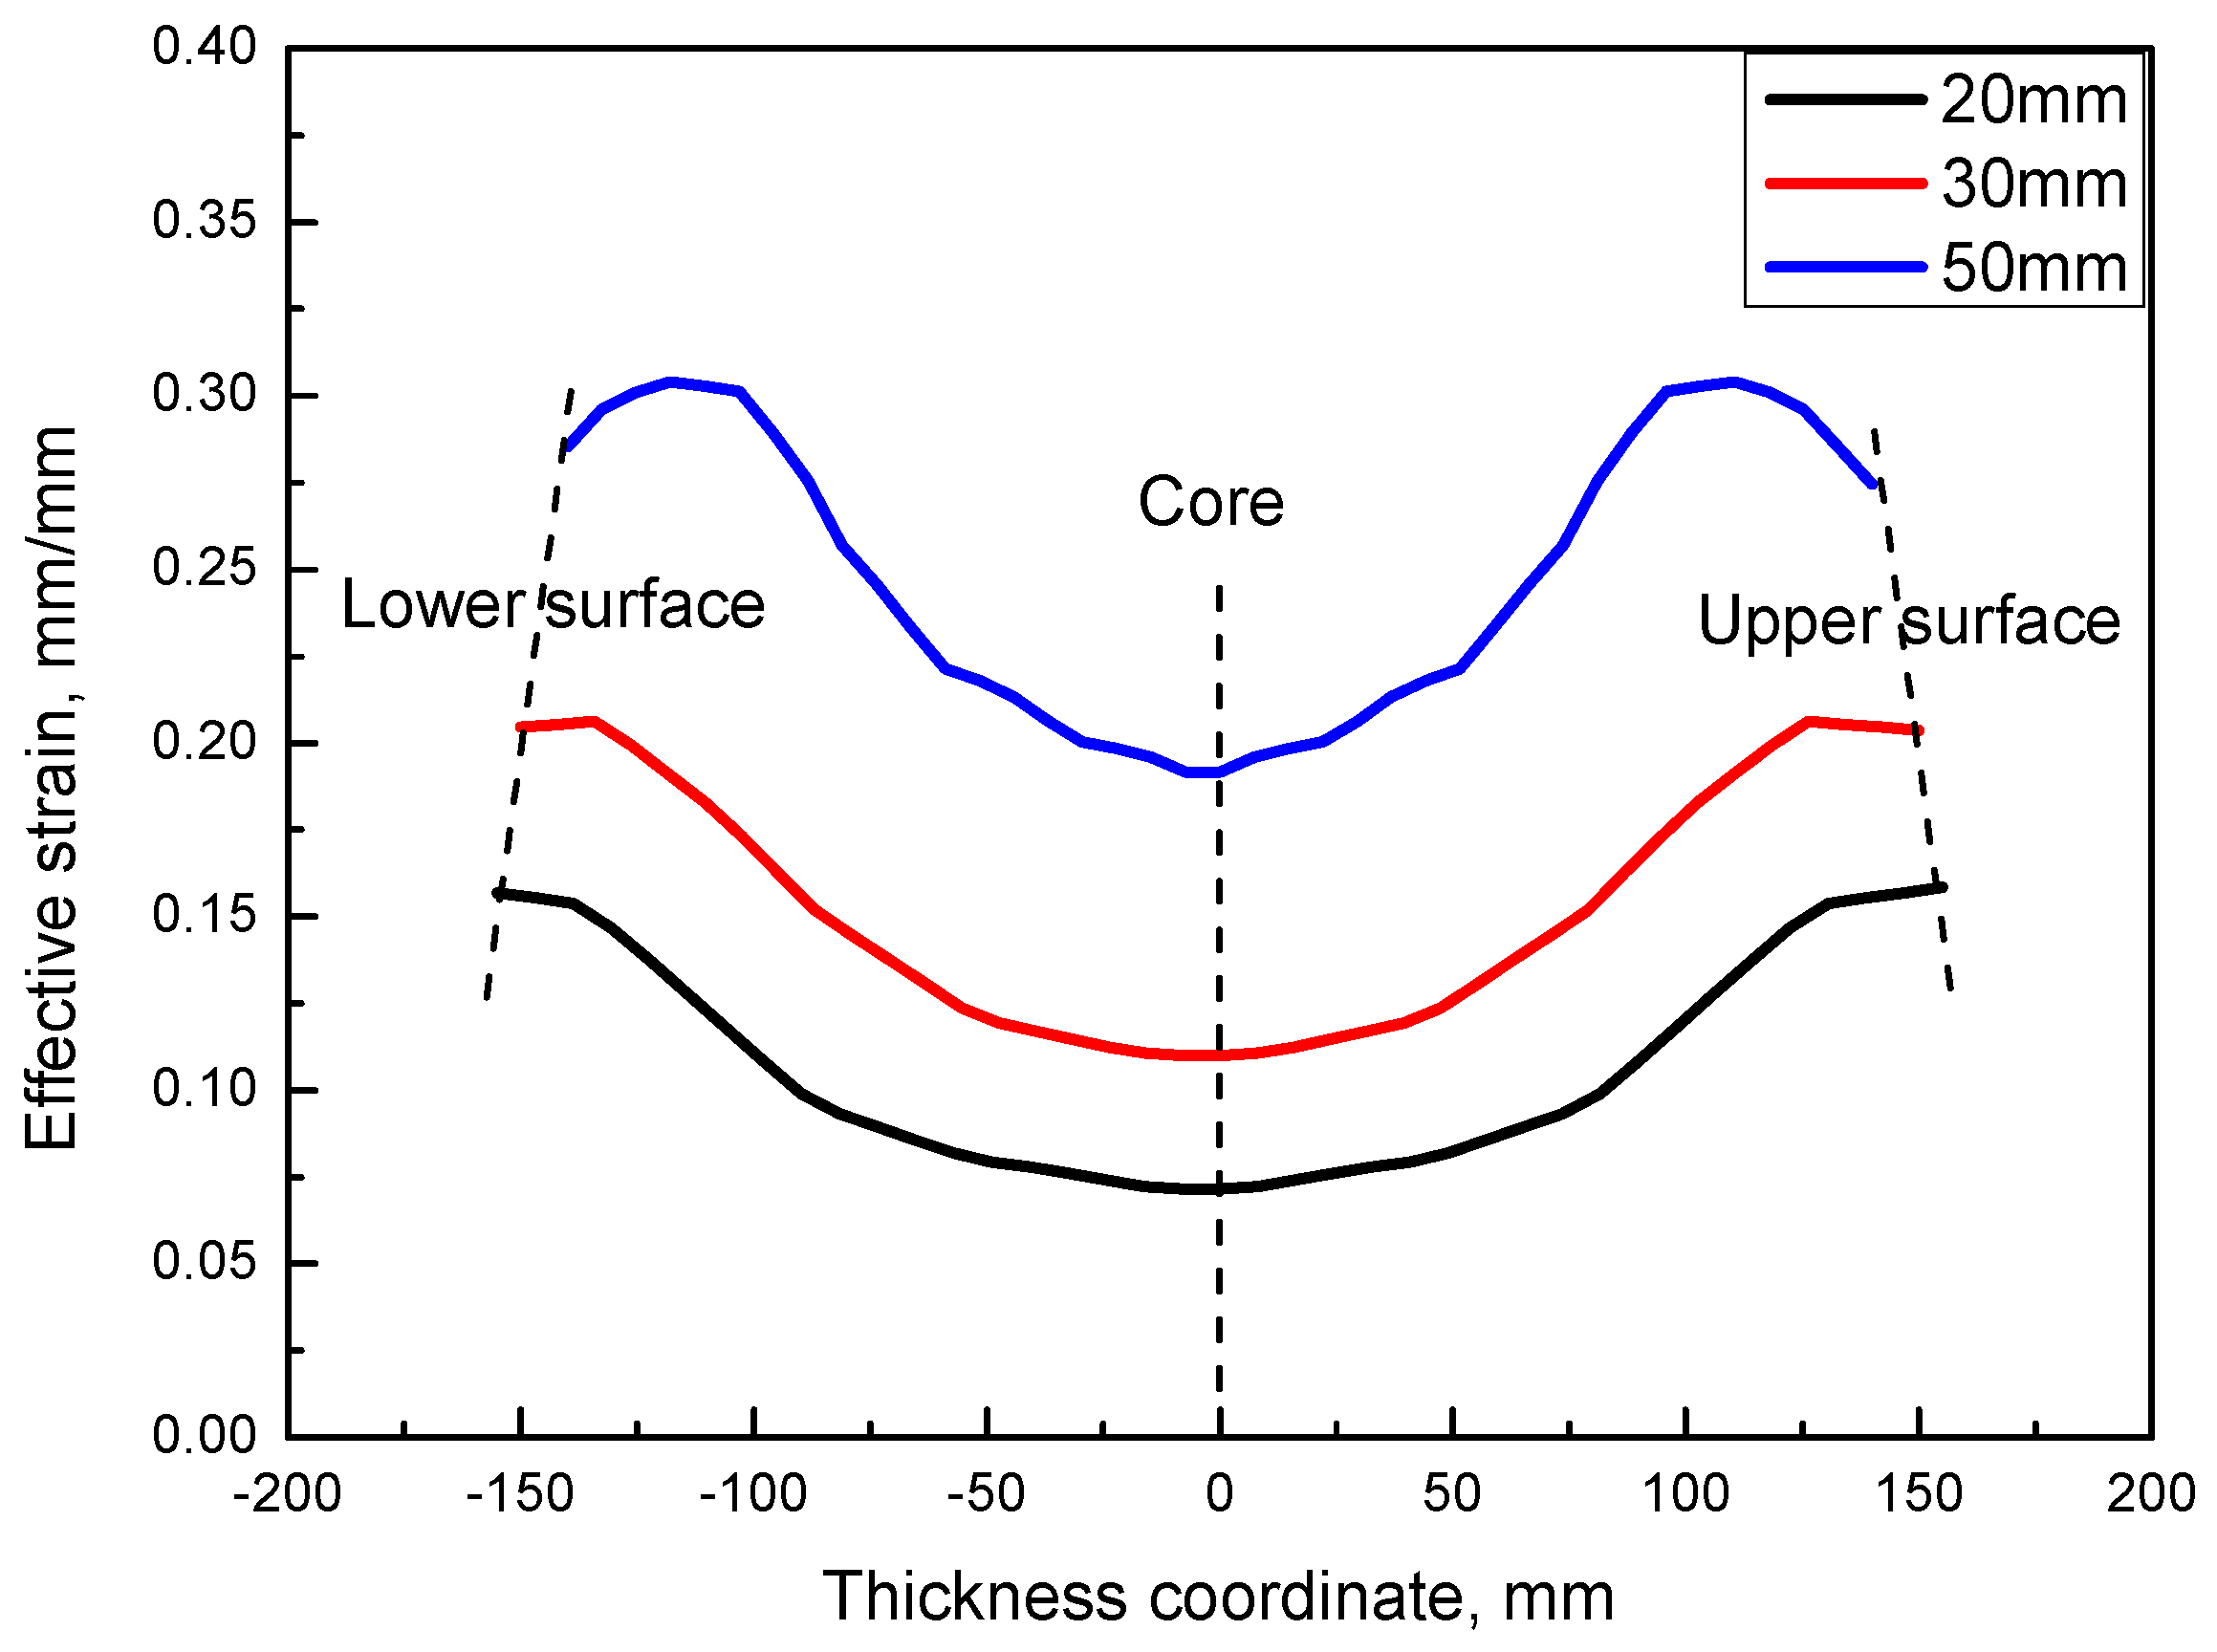
3.2. Strain and Strain Rate Distribution in Thickness during HHR2

Strain and strain rate are also the principal factors affecting the DRX in hot deformation, according to the DRX model. The distributions of effective strain are shown in Figure 7, corresponding to the slabs after the HHR2 process for different reduction amounts. In general, the level of effective strain increases with the rolling reduction amount. Meanwhile, the effective strain has the characteristic of stratified distribution along the thickness direction. After the HHR2 process, the values of effective strain along the thickness direction z = 0 are reveled in Figure 8. The maximum of effective strain is obtained at the upper and lower surfaces and adjacent areas of the slab, and the values continuously decrease from these positions to the core of the slab. Moreover, the strain range is 0.2–0.3 when the reduction is 50 mm; however, this range falls to 0.11–0.2 and 0.07–0.15 as the reduction amounts are 30 mm and 20 mm, respectively.
Different from the effective strain, the strain rate is not cumulative value, but instantaneous value during the HHR2 process. Three characteristic locations are selected to describe the evolution of strain rate in deformation, which are upper surface, 1/4 the thickness of the slab, and core of the slab, along the direction of z = 0, as shown in Figure 9. Generally, the strain rate increases first and then decreases in the hot rolling zone. Higher strain rates are obtained for higher reduction ratio of the slab. Meanwhile, greater values are observed at the upper and lower surfaces of the slab compared with the other characteristic locations.

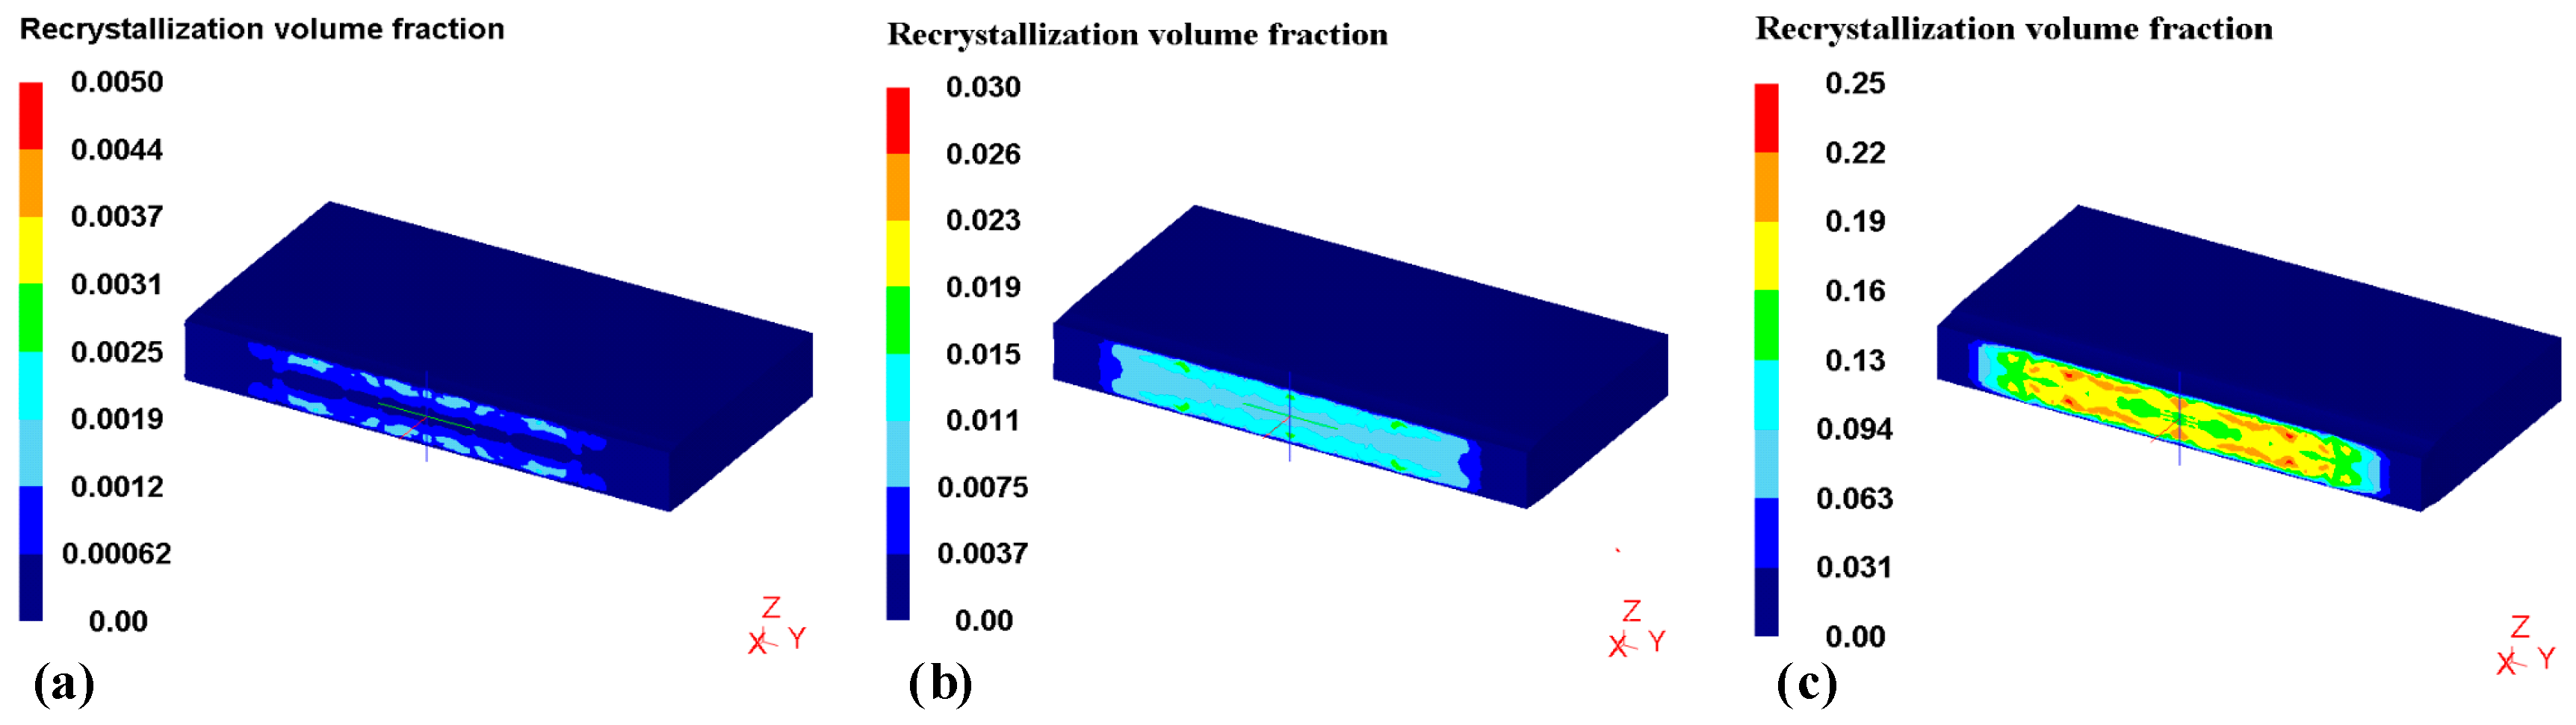
3.3. Analysis of DRX during HHR2

Based on the secondary development of DEFORM, the different reduction ratios for DRX of HHR2 are calculated. The distribution of the criteria for DRX initiation f at the exit of the mill is depicted in Figure 10. According to the functional relationship, f = 0 is the critical condition that determines when DRX is initiated. The locations where f > 0 are the regions of DRX, and the locations where f < 0 are the regions of non-DRX. Greater non-DRX zones are located at the edge of the slab, as the decrease of the reduction ratio. With the increase in the reduction ratio, the DRX region is enlarged. When the reduction amount of the mill are 20 mm, 30 mm, and 50 mm, the regions are 87.9%, 94.2%, and 98% of the cross-sectional area of the slab, respectively. DRX is triggered in most of the regions except the corners when the reduction increased to 50 mm.
Figure 11 shows the calculated distribution of the DRX volume fraction, which reflects the degree of DRX on the cross-section of the slab after HHR2. A higher DRX volume fraction is located near the upper and lower surfaces of the slabs; however, there is a huge difference between this value and the distinct reduction ratios during HHR2. When the reduction amount is 20 mm, the DRX volume fraction is almost negligible in the cross section of the slab, which means that the effective strain in HHR2 just reaches the critical strain. However, when the reduction amount increases to 50 mm, the DRX volume fraction increases to 12–25% along the thickness direction z = 0.
Based on the abovementioned calculations, the distribution of dynamic recrystallized grain size in the cross section is depicted in Figure 12. The DRX grain size increases from the surface to core of the slab, and this distribution characteristics is similar to that of temperature on the cross section of the slab. This means that temperature is a crucial factor that influences the DRX grain size during HHR2. The DRX grain size decreases with the increase of the reduction ratio. In addition, the proportions of different sizes in the DRX grains are depicted in Figure 12. The proportionality values are seen to have two peaks, especially when adequate DRX is obtained in the slab. For example, when the reduction amount is 50 mm during HHR2, the DRX grains with sizes 120 μm and 230 μm account for more significant percentage among all the DRX grains. The 120 μm ones located at the position near the surface of the slab that have the highest effective strain in promoting DRX. However, the grains with sizes 230 μm are distributed at the core of slab because the critical strain at the core is the lowest and the temperature is the highest.

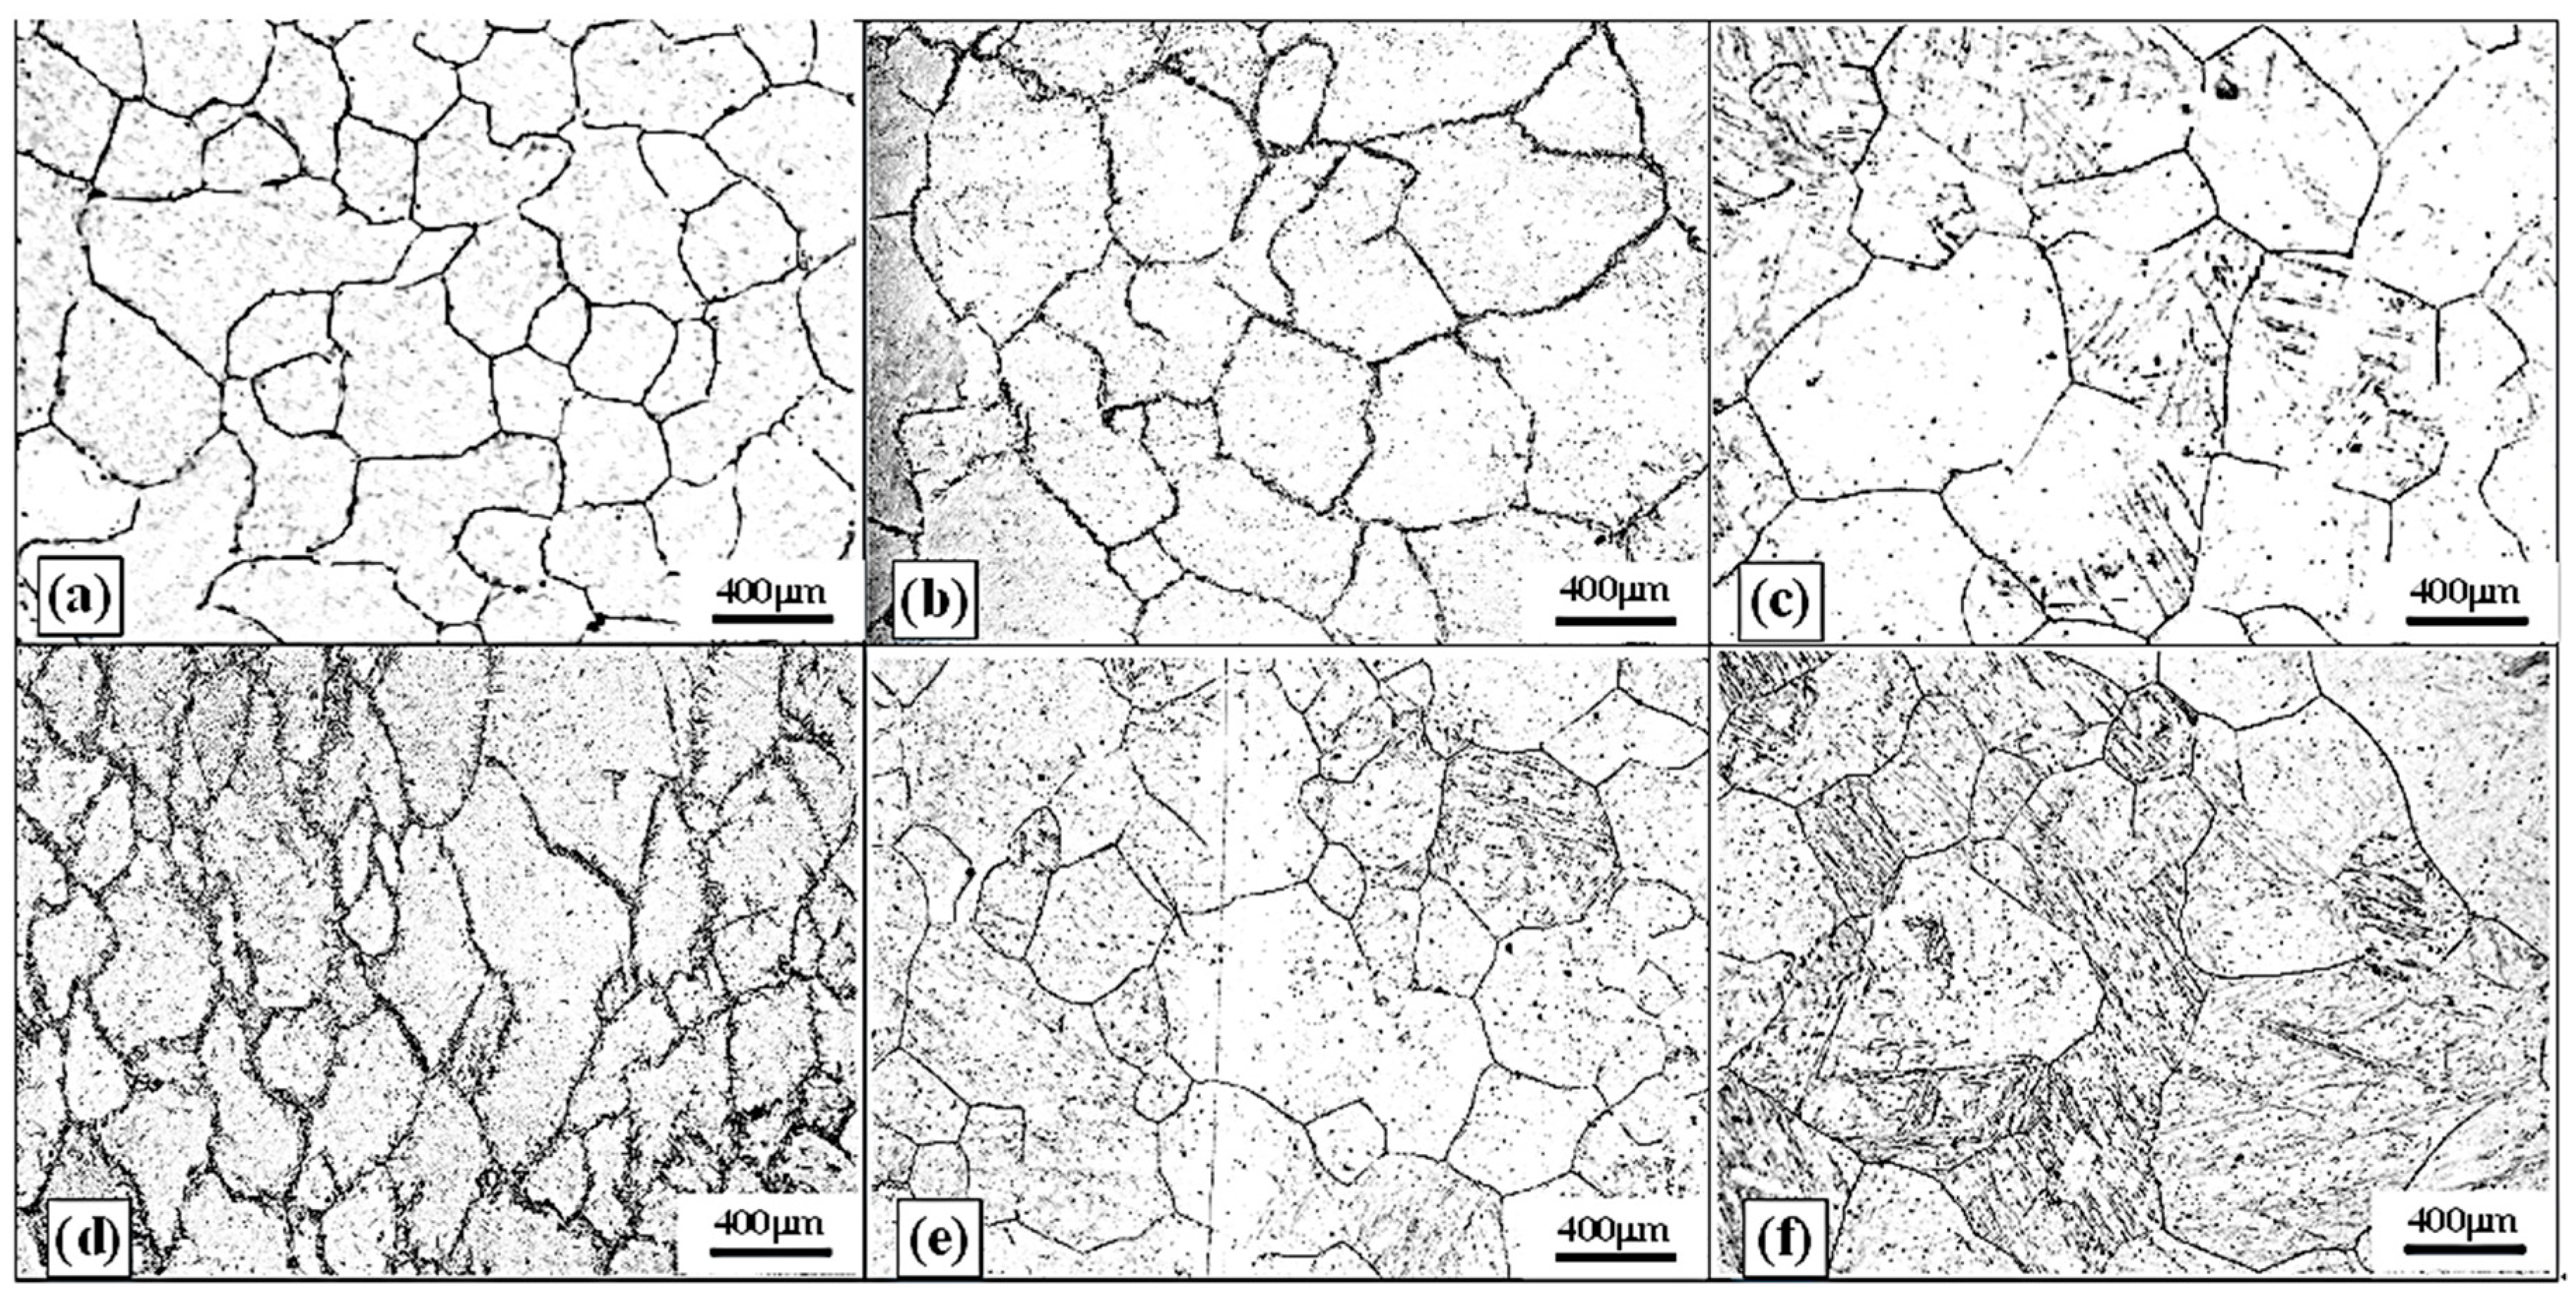
3.4. Microstructure Validation of HHR2 Process

To obtain the characteristics of austenite grains before and after HHR2, thermal simulation experiments were conducted considering the temperature, strain rate and strain evolution of the slab. The thermal–mechanical simulation is depicted in Figure 13. SA–SF were heated to 1400 °C with a heating rate of 10 °C/s, and the holding time, cooling rate, and deformation conditions are detailed in Table 3. SA–SC were quenched before the compressive tests to demonstrate the initial austenite state, and the quenched samples of SD–SF after HHR2 were used to study the effect of DRX on austenite.
Figure 14 shows the influence of HHR2 on the austenite structure. For the samples of SA–SC, the initial austenitic states corresponding to the surface, quarter, and core positions of the slab before HHR2 are depicted in Figure 14a–c. The temperature history is therefore a key factor that influences the initial austenitic states. From the surface to center of the slab, the initial austenite size increases continuously, the values for which are 445 μm, 574 μm, and 638 μm, corresponding to the surface, quarter, and core, respectively. Smaller austenites are formed near the surface of the slab because they are stabilized at a lower temperature by the synthetic effect of external cooling and internal heat supplementation. The biggest grain size is obtained at the core because the temperatures remain elevated over a long period of time in the core. Additionally, Figure 15 shows the relationship between the initial austenitic sizes and the thickness coordinates of this slab, which can be expressed as Equation (8).
d 0 = 628.65 + 5.45 × 10 17 z 0.00681 z 2 ( 165 mm z 165 mm )
Figure 14d–f illustrates the austenitic structure at the surface, quarter, and core of the slab after the HHR2 process with a 50 mm reduction. Statistically, the average austenite size changes to 435 μm, 497 μm, and 570 μm corresponding to the abovementioned locations, respectively. By comparing these values with those of the initial austenite size, it is found that HHR2 causes a clear refinement in the austenitic structure, and the difference in the average austenite grain size between the surface and core of the slab shows a clear decrease.
According to the calculations described above, the DRX grain size and average grain size with thickness (z = 0) is illustrated in Figure 16. In addition, when the reduction is large enough, an adequate amount of DRX is required to decrease the average grain size. However, if the reduction ratio is small, the average grain size is quite close to the initial grain size, which means that the effect of HHR2 is not evident on the refined grains through DRX. Additionally, when the reduction amount increases from 20 mm to 50 mm, the difference of average grain size between the core and surface reduces by 52%. Therefore, adequately increasing the reduction amount leads to the refinement of austenite grain through DRX and promotion of the microstructure uniformity of slab during HHR2.

4. Conclusions

The DRX model was coded in Fortran and embedded into the commercial software DEFORM-3D. Subsequently, the influence of the reduction amount on DRX and microstructure homogeneity in terms of thickness was investigated using finite-element analysis. The main conclusions of this study can be summarized as follows.
(1)
With the increase in the reduction ratio, the level of effective strain and strain rate are enhanced, and the DRX region on the cross section of slab is enlarged during HHR2. The non-DRX zone is mainly located on the edge and corner of the slab, where the temperatures are low.
(2)
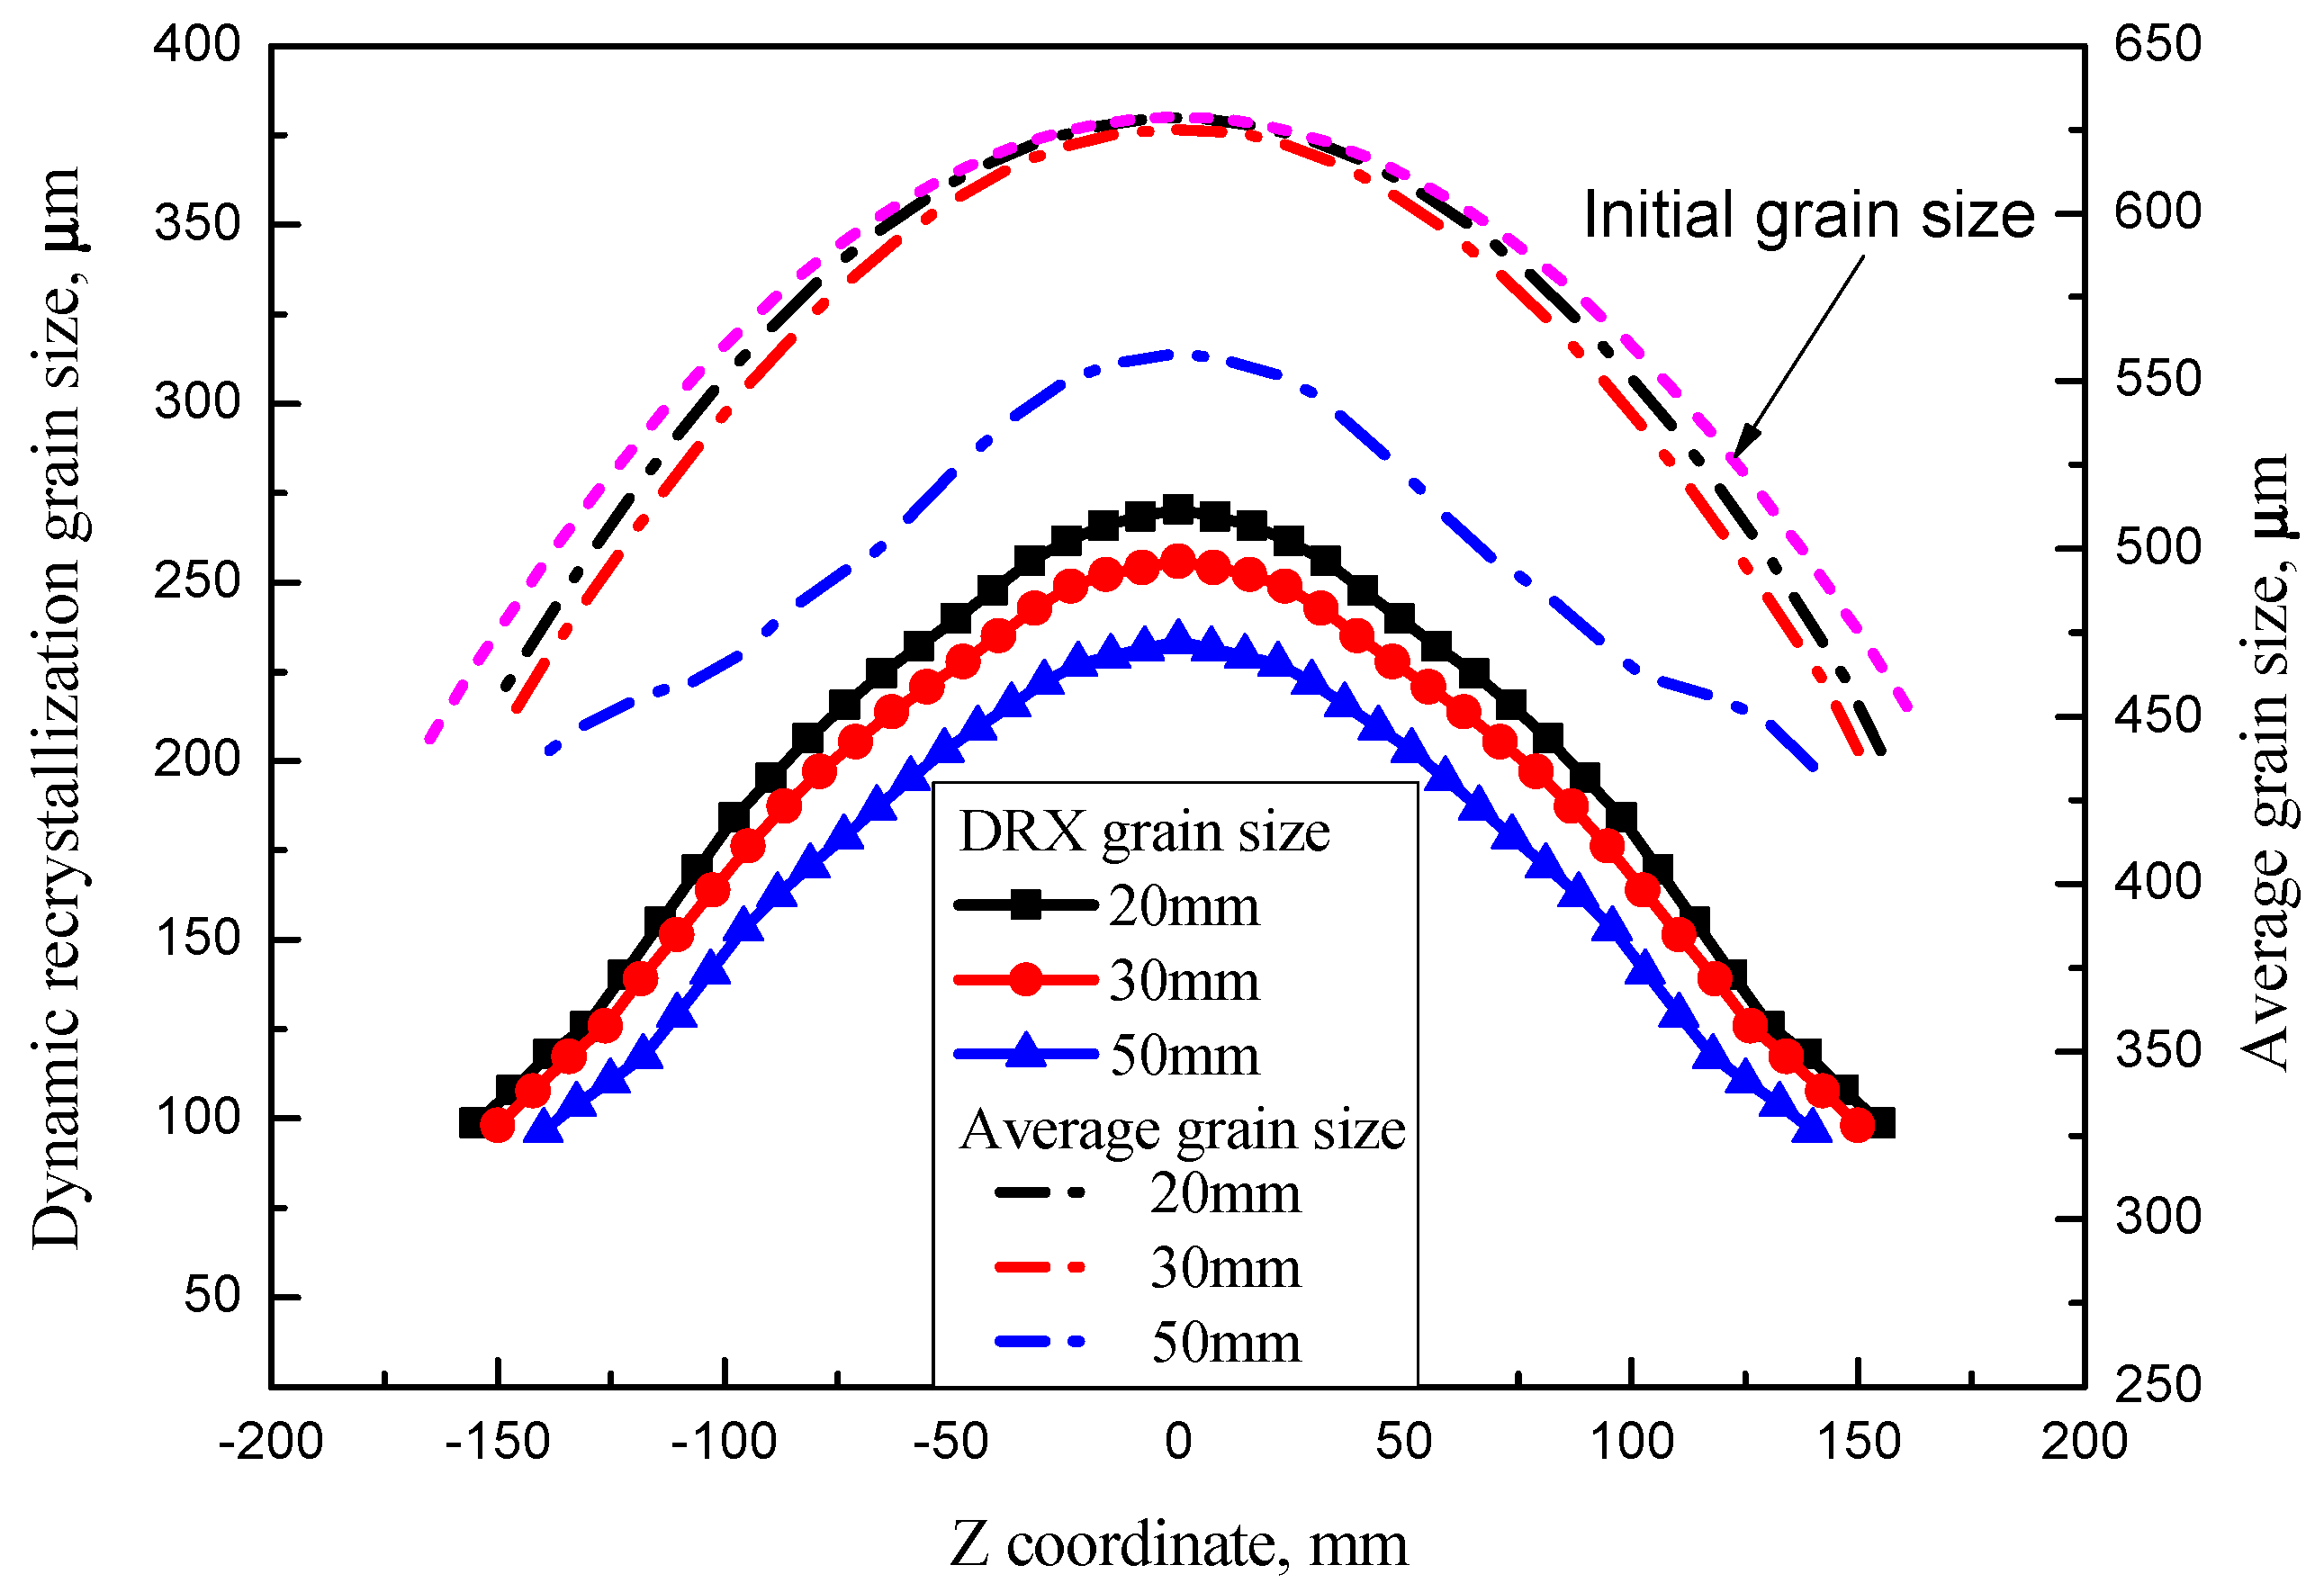
The DRX grain size increases from the surfaces to core of slab, which have distributions similar to the characteristics of temperature on the cross section of the slab. With the increase in the reduction amount from 20 mm to 50 mm, there is a decrease in the DRX grain size, and the DRX volume fraction increases from nearly 0% to 10–25%, which means that a higher reduction ratio can promote the formation of finer DRX grains.
(3)
When the reduction amount increases from 20 mm to 50 mm, sufficient DRX is required to decrease the average grain size, and the difference of average grain sizes between the core and surface reduces by 52%. This means that appropriate enhancement of the reduction ratio is advantageous to the reduction of the average austenite grain size through DRX and for the promotion of the microstructure uniformity of slab during the HHR2 process.

Author Contributions

H.L. designed the paper and guided the establishment of the finite element models; Z.W. and G.W. arranged the funding and revised the manuscript; T.L. completed the numerical simulation; M.G. helped in the experimental part; H.L. and T.L. wrote the manuscript. All authors have read and agreed to the published version of the manuscript.

Funding

This research was funded by National Key Research and Development Program of China (No. 2017YFB0305300) and the Fundamental Research Funds for the Central University of China (N170703010).

Conflicts of Interest

The authors declare no conflict of interest.

References

  1. Yim, C.H.; Park, J.K.; You, B.D.; Yang, S.M. The effect of soft reduction on center segregation in cc slab. ISIJ Int. 1996, 36, S231–S234. [Google Scholar] [CrossRef]
  2. Wu, M.; Domitner, J.; Ludwig, A. Using a two-phase columnar solidification model to study the principle of mechanical soft reduction in slab casting. Metall. Mater. Trans. A 2012, 43, 945–964. [Google Scholar] [CrossRef]
  3. Ji, C.; Luo, S.; Zhu, M. Analysis and application of soft reduction amount for bloom continuous casting process. ISIJ Int. 2014, 54, 504–510. [Google Scholar] [CrossRef] [Green Version]
  4. Ayata, K.; Koyama, S.; Nakata, H.; Kawasaki, S.; Ebina, K.; Hata, T. Improvement of Center Segregation in Continuously Cast Bloom by Hard Reduction Near the Crater End. In Proceedings of the Sixth International Iron and Steel Congress, Nagoya, Japan, 21–26 October 1990. [Google Scholar]
  5. Ebina, K.; Fujii, K.; Shimono, S.; Toyoshima, S.; Nakayama, K.; Takagi, I. Development of the hard reduction method in the No. 3 bloom caster at kobe works, kobe steel. Revue de Métallurgie 1992, 89, 783–792. [Google Scholar] [CrossRef]
  6. Reichert, A.; Tacke, K.; Harste, K.; Hecht, M.; Heilemann, J.; Ölmann, U.; Schwerdtfeger, K.; Barber, B.; Beaverstock, R.; Walmsey, R. ECSC Report EUR 20190; European Commission: Brussels, Belgium, 2002; pp. 1–154.
  7. Ogibayashi, S.; Uchimura, M.; Isobe, K.; Maede, H.; Nishihara, Y.; Sato, S. Improvement of center segregation in continuously cast blooms by soft reduction in the final stage of solidification, IISC. In Proceedings of the Sixth International Iron and Steel Congress, Nagoya, Japan, 21–26 October 1990; pp. 271–278. [Google Scholar]
  8. Isobe, K.; Kusano, Y.; Noguchi, S.; Ishiyama, K.; Yamanaka, A.; Horie, T.; Uehara, M. Improvement of segregation of continuously cast billets by soft reduction. Near-Net-Shape Cast. Minimills 1995, 12, 179–192. [Google Scholar]
  9. Thome, R.; Harste, K. Principles of billet soft-reduction and consequences for continuous casting. ISIJ Int. 2006, 46, 1839–1844. [Google Scholar] [CrossRef] [Green Version]
  10. Humes, D.M.; Korzi, M.J.; Kozak, B.A.; Laughlin, J.T. Dynamic soft reduction of continuously cast slabs. Iron Steel Tech. 2008, 5, 29–36. [Google Scholar]
  11. Araki, K.; Kohriyama, T.; Nakamura, M. Development of heavy section steel plates with improved internal properties through forging and plate rolling process using continuous casting slabs. Kawasaki Steel Tech. Rep. 1999, 40, 80–85. [Google Scholar]
  12. The Technical Society, the Iron and Steel Institute of Japan. Production and Technology of Iron and Steel in Japan during 2007. ISIJ Int. 2008, 48, 707–728. [Google Scholar] [CrossRef]
  13. Hiraki, S.; Yamanaka, A.; Shirai, Y.; Satou, Y.; Kumakura, S. Development of new continuous casting technology (pccs) for very thick plate. Mater. Jpn. 2009, 48, 20–22. [Google Scholar] [CrossRef] [Green Version]
  14. Ji, C.; Wu, C.-H.; Zhu, M.-Y. Thermo-mechanical behavior of the continuous casting bloom in the heavy reduction process. JOM 2016, 68, 3107–3115. [Google Scholar] [CrossRef] [Green Version]
  15. Won, Y.M.; Yeo, T.-J.; Seol, D.J.; Oh, K.H. A new criterion for internal crack formation in continuously cast steels. Metall. Mater. Trans. B 2000, 31, 779–794. [Google Scholar] [CrossRef]
  16. Rindler, W.; Kozeschnik, E.; Buchmayr, B. Computer simulation of the brittle-temperature-range (btr) for hot cracking in steels. Steel Res. 2000, 71, 460–465. [Google Scholar] [CrossRef]
  17. Zhao, X.; Zhang, J.; Lei, S.; Wang, Y. Finite-element analysis of porosity closure by heavy reduction process combined with ultra-heavy plates rolling. Steel Res. Int. 2014, 85, 1533–1543. [Google Scholar] [CrossRef]
  18. Li, T.; Li, H.; Li, R.; Wang, Z.; Wang, G. Work roll surface profile design and optimization for hot-core heavy reduction rolling process. ISIJ Int. 2019, 59, 1314–1322. [Google Scholar] [CrossRef] [Green Version]
  19. Gong, M.; Li, H.; Li, T.; Wang, B.; Wang, Z. Evolution of austenite grain size in continuously cast slab during hot-core heavy reduction rolling process based on hot compression tests. Steel Res. Int. 2018, 89, 1800025. [Google Scholar] [CrossRef]
  20. Humphreys, F. A unified theory of recovery, recrystallization and grain growth, based on the stability and growth of cellular microstructures—I. The basic model. Acta Mater. 1997, 45, 4231–4240. [Google Scholar] [CrossRef]
Figure 1. Layout of HHR2 process.
Metals 10 00181 g001
Figure 2. Infrared images collected by FLIR SC620 on the producing spot: (a) the exit of continuous caster and (b) the position after flame cutting.
Metals 10 00181 g002
Figure 3. Temperature evolution of the characteristic positions during the continuous casting process.
Metals 10 00181 g003
Figure 4. Finite element (FE) model and meshing for HHR2 process.
Metals 10 00181 g004
Figure 5. Temperature field of the slab at the mill entrance of HHR2.
Metals 10 00181 g005
Figure 6. Distributions of temperature and temperature gradient along the directions of thickness and width before the HHR2 process: (a) thickness z = 0; (b) width y = 0.
Metals 10 00181 g006
Figure 7. Distributions of effective strain after the HHR2 process with different reduction amounts: (a) 20 mm; (b) 30 mm; (c) 50 mm.
Metals 10 00181 g007
Figure 8. Values of effective strain after the HHR2 process at the thickness direction along z = 0.
Metals 10 00181 g008
Figure 9. Evolutions of strain rate at the characteristic locations during the HHR2 process.
Metals 10 00181 g009
Figure 10. Regions where dynamic recrystallization (DRX) was triggered on the cross section of the slab during HHR2.
Metals 10 00181 g010
Figure 11. Volume fraction of DRX after HHR2 with distinct reduction amounts: (a) 20mm; (b) 30 mm; (c) 50 mm.
Metals 10 00181 g011
Figure 12. Distribution of DRX grain sizes, and the proportion of different DRX grain sizes: (a) 20 mm; (b) 30 mm; (c) 50 mm.
Metals 10 00181 g012
Figure 13. Experimental plan corresponding to the temperature history of the HHR2 process.
Metals 10 00181 g013
Figure 14. Microstructure comparison of the feature points of slabs with and without the HHR2 process: before the HHR2 process, (a) surface, (b) 1/4 thickness, and (c) core; after the HHR2 process, (d) surface, (e) 1/4 thickness, and (f) core.
Metals 10 00181 g014
Figure 15. Comparison of the initial grain size between the experimental data and prediction, before the HHR2 process.
Metals 10 00181 g015
Figure 16. The DRX grain size and average grain size variation with the thickness of the slab.
Metals 10 00181 g016
Table 1. Main parameters of caster.
ParametersValue
Machine typeVertical bending
Number of strands1
Machine radius/m13
Metallurgical length/m30
Machine height/m13.5
Slab thickness/mm200/250/300/330
Slab width/mm1300~2400
Table 2. Main parameters of heavy reduction rolling mill.
ParametersValue
Machine type2-High mill
Roll dimension/mmΦ1350 × 2600
Maximum force/kN35,000
Motor power/kW400
Table 3. Temperature evolution and deformation conditions of the specimens.
No.Corresponding PositionsHolding Time (min)Cooling Rate (°C/s)Deformation Temperature (°C)Strain Rate (/s)True Strain
SASurface1.55950--
SBQuarter90.41150--
SCCore160.51300--
SDSurface1.559500.010.3
SEQuarter90.411500.010.25
SFCore160.513000.010.2

