Abstract
The microstructure and mechanical properties of cold-rolled Cu-2.7Be sheets under various annealing processes and conditions were investigated in this research. The increased beryllium content in the Cu-2.7Be alloy facilitates the formation of brittle secondary phases. Consequently, the study highlights the functionality of annealed Cu-2.7Be alloys as more favorable dynodes than the traditionally used Cu-2.0Be alloys. The mechanism of recrystallization used for the transformation of Cu-2.7Be alloys was that of continuous static recrystallization (cSRX). Moreover, the relationship between the orientation of the β phases and that of the surrounding Cu-matrix was determined to be (111)α∥(110)β and (011)α∥(001)β. The β phase has a body-centered cubic (bcc) structure with a = b = c = 0.281 nm. The β phase undergoes a morphology transformation from primitive lath-shaped β particles to quadrangle-shaped β particles during the annealing process. Such transformations could potentially have an effect on the mechanical properties of Cu-2.7Be sheets. There was a noticeable decline in the yield strength of the Cu-2.7Be after annealing, and the samples annealed at 770 °C for 15 min achieved the elongation with deep and uniform dimples caused by suitable β particle sizes, appropriate grain sizes, and the maximum volume fraction of ∑3 boundaries.
1. Introduction
Copper–beryllium alloys are extensively used as dynodes in electron multipliers and photomultiplier tubes, due to high, stable, and durable secondary electron emission (SEE) properties [1,2]. In 1947, Allen discussed the design and construction of a 13-stage electron multiplier tube. The electrodes synthesized from the Cu-2.0Be alloy sheets were applied and the method of activating these surfaces was described [3]. Furthermore, in the 1950s–1980s, the activation process played a key role in the investigation of Cu-2.0Be dynodes [1,2,3,4,5]. However, materials with high SEE properties, such as Ag-3Mg [6], Y2O3-Mo [7], MgO/Au composite film [8], H-terminated, and Cs-terminated chemical vapor deposition (CVD) diamond [9] have been developed, whereas minimal attention was placed on the Cu-Be dynodes. Nevertheless, due to the ultra-high thermal stability, the Cu-Be alloys are still utilized as primary SEE materials, which can be sealed in the electron multiplier when functioning as dynodes. Furthermore, upon thorough investigation of the SEE properties of Cu-2.7Be alloys, Wang observed that the Cu-2.7Be alloys possessed a higher SEE property than the traditional Cu-2.0Be alloys, thus suggesting the potential application of the former in Cu-Be dynodes [10]. However, when the Be content in the alloy exceeds 2.3 wt.%, hard and brittle secondary phases are generated. These secondary phases result in processing problems and limit the application of Cu-2.7Be alloys in dynodes. Consequently, it is imperative to study the evolution of the mechanical properties and microstructure of Cu-2.7Be alloys via heat treatment when considering its applicability or functionality in photomultipliers.
The mechanical properties of the alloy sheets are primarily influenced by factors such as textures [11], grain size [12,13], phase composition [14,15], and heat treatment conditions [16]. The phase transformation process of Cu-Be alloys during aging has been extensively researched and is confirmed to be: G.P. zones → γ″ ordered phase → γ′ body-centered tetragonal precipitates → equilibrium γ phase [17,18,19,20,21]. However, only a few reports detail the transformation process of β phases in the Cu-Be alloy. In this study, cold-rolled Cu-2.7Be sheets were obtained via hot-cross rolling. A series of thermal treatments were utilized to facilitate the β phase transition at a temperature higher than the general aging temperature, in order to avoid the hardening of Cu-2.7Be sheets. The evolution of the microstructure of Cu-2.7Be sheets was mainly characterized by electron backscattered diffraction (EBSD), scanning electron microscopy (SEM), and transmission electron microscopy (TEM).
2. Experimental Process
The alloy used in this work has a nominal composition of Cu-2.7Be (Be content in wt.%). The schematic diagram illustrating the mechanism by which the Cu-2.7Be sheets are processed is shown in Figure 1. After homogenization (800 °C; 20 h), ingots with 10 mm thickness were hot-cross rolled and low anisotropy Cu-2.7Be plates were obtained. Cold rolling was subsequently conducted in order to achieve the final thickness of Cu-2.7Be sheets (0.2 mm), as stipulated by our previous work [22,23]. In an effort to accomplish the objectives of phase transition control and static recrystallization, the cold-rolled sheets were annealed at 650 °C and 770 °C. Subsequently, the annealed specimens (50 mm × 50 mm) were cut using an electric spark wire-cutting machine. Rectangular tensile specimens were also cut with a gauge length of 80 mm and a cross-sectional area of 2 mm × 1 mm using an electric spark wire-cutting machine. The tensile specimens were machined from the quenched rolling plane of the sample with the longitudinal axis along the original rolling direction of the sheets. Electron backscattered scattering detection (EBSD) was conducted at a step size of 1 μm on an scanning electron microscope (SEM) (Sirion 200, Field Electron and Ion Co., Hillsboro, Oregon State, America) equipped with a Tsl-Oim data analysis software system that contained orientation information for each point. The samples for EBSD scanning with dimensions of 5 mm × 5 mm × 0.5 mm were prepared by electric spark cutting, mechanical polishing, and automatic twin-jet electropolishing using a solution of 25% nitric acid and 75% methanol at a potential of 40 V and a temperature of −30 °C. Based on the EBSD data, the grain size distribution was quantified using the commercial software package Image Pro. The transmission electron microscope (TEM) observation and selected area electron diffraction (SAED) were carried out using a Tecnai F20 transmission electron microscope (Field Electron and Ion Co., Hillsboro, Oregon State, America). The specimens were electro-polished in a similar manner as before.

Figure 1.
Schematic diagram of Cu-2.7Be sheets processing.
3. Results and Discussion
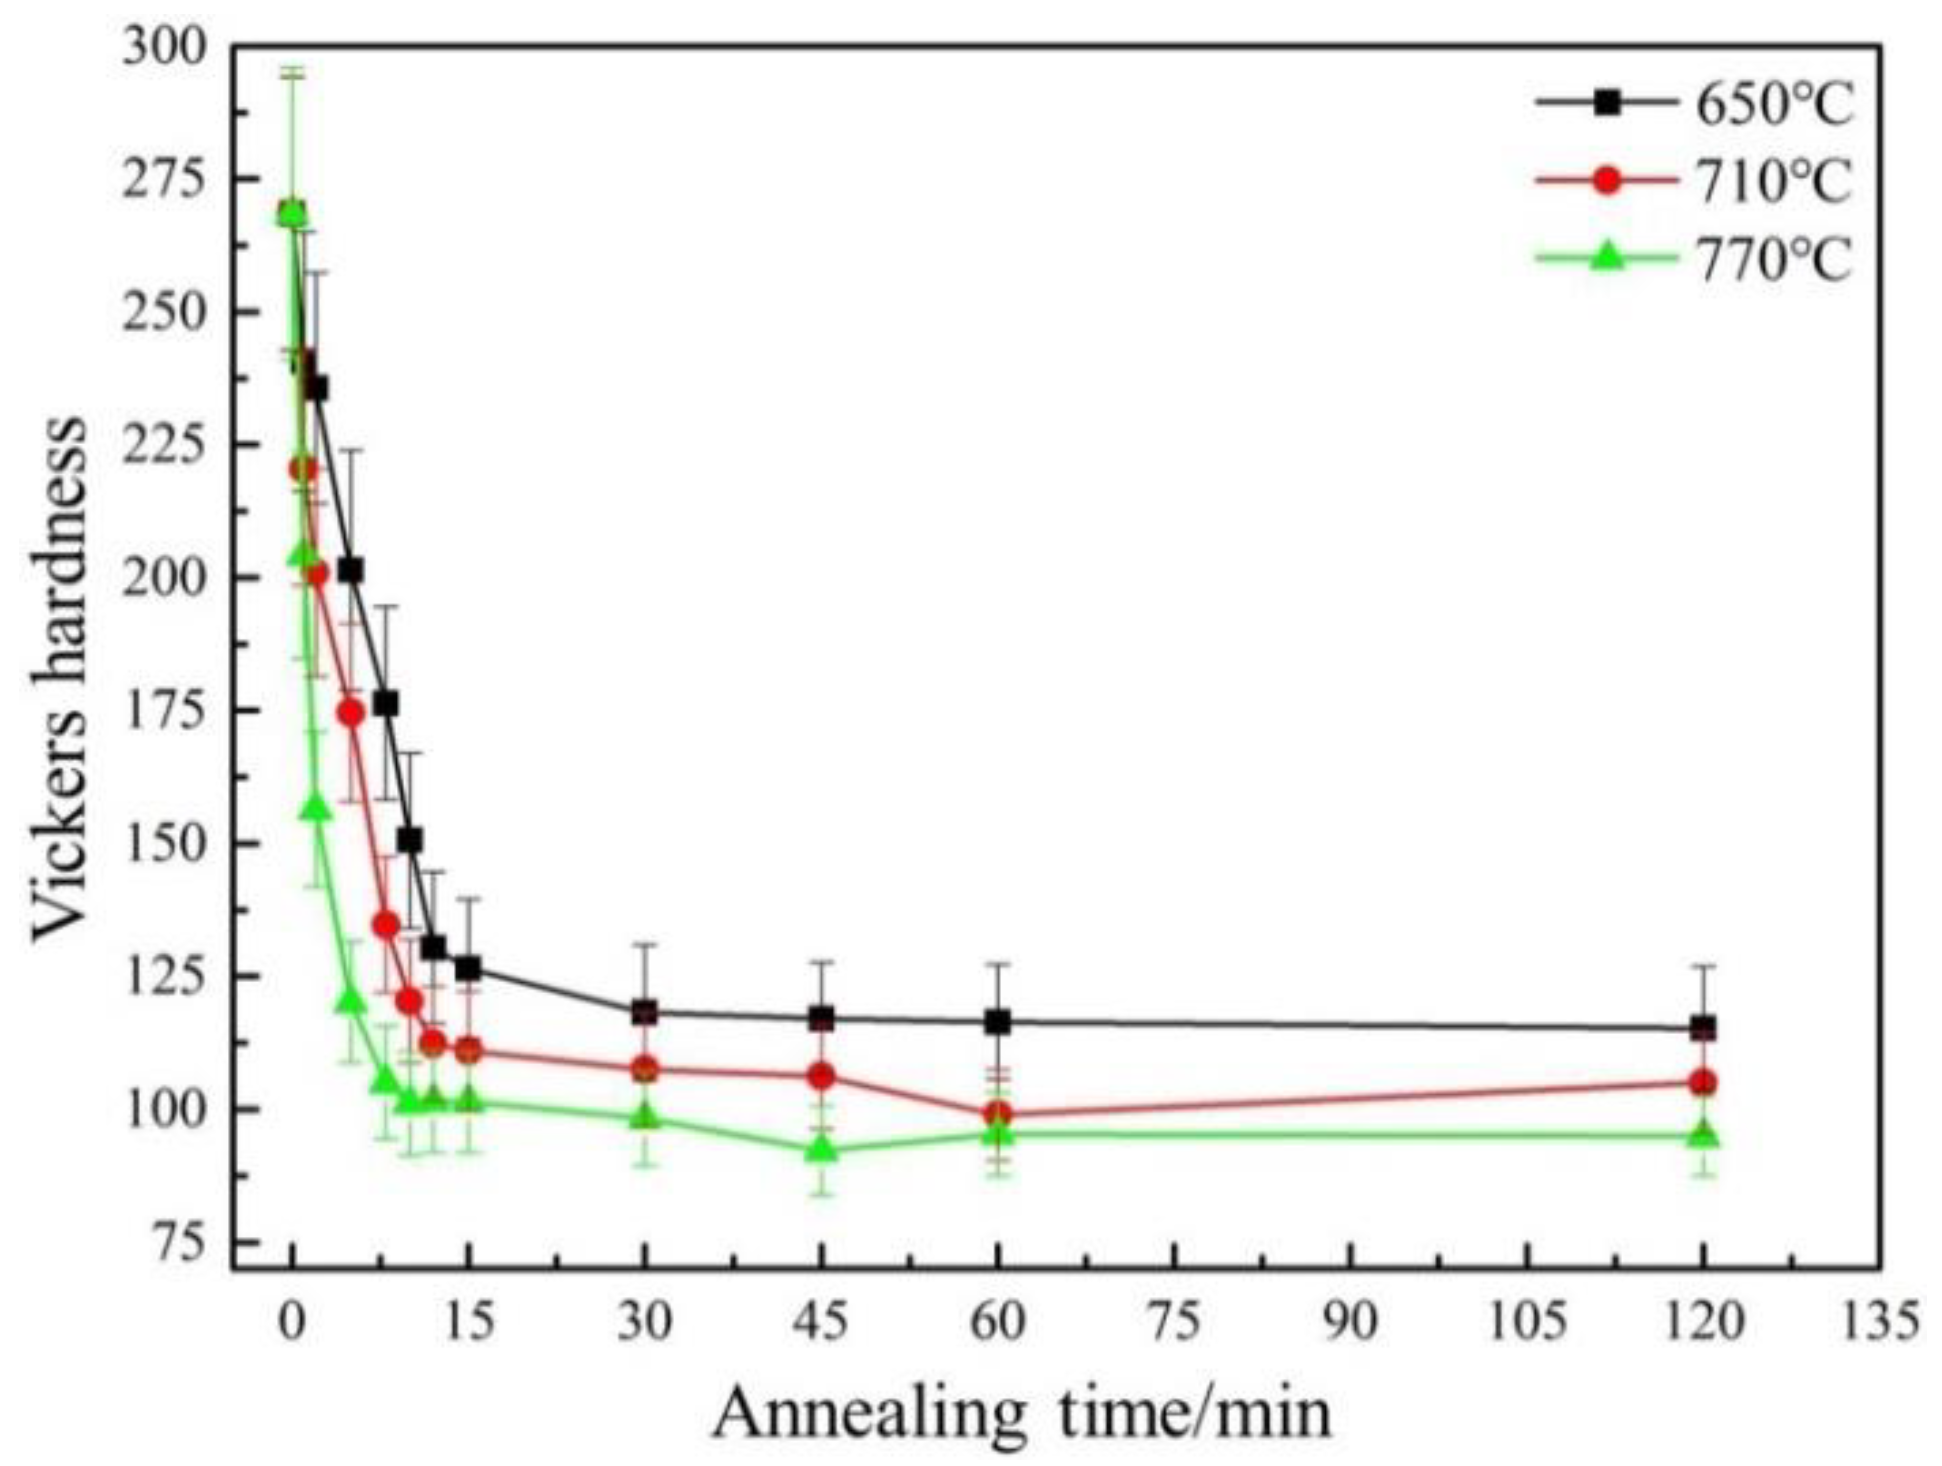
The process of deformed and annealed samples was studied by analyzing the measurements of Vickers Hardness as a function of the annealing temperature and annealing time (Figure 2). The load, with a weight of 4.9 N, was applied for 15 s. The hardness of the cold-rolled sample was established as the initial hardness for any annealing temperature. All the curves are found to consist of two stages, i.e., the subsequent drastic decrease in hardness induced by the preceding recrystallization, and the final steady stage indicating the completion of recrystallization. According to a previous study [24,25], the Vickers hardness exhibits a positive correlation with yield strength. During the process of annealing—which weakens the yield strength—the Vickers hardness of Cu-2.7Be samples decreased significantly (Figure 2) when the annealing time exceeded 10 min. The main microstructure evolution of low stacking fault energy alloys, such as Cu-2.7Be alloys, is recrystallization during annealing. Higher temperatures promote larger migration velocity of the grain boundaries, thus contributing to a larger grain size [26]. For this reason, higher annealing temperatures can achieve lower values of Vickers hardness (Figure 2). Hence, increasing the annealing temperature can shorten the recrystallization period by accelerating the recrystallization process of the Cu-2.7Be alloys.
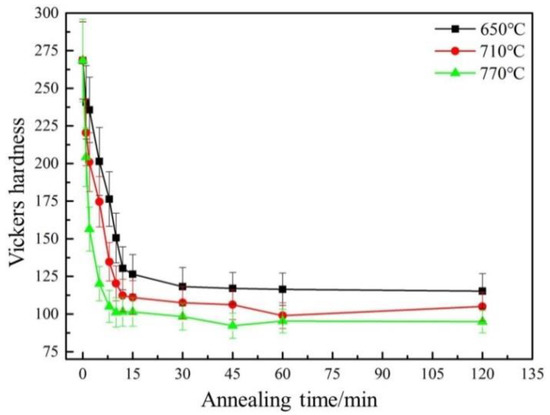
Figure 2.
Vickers hardness of Cu-2.7Be sheets annealed at 650 °C, 710 °C, 770 °C.
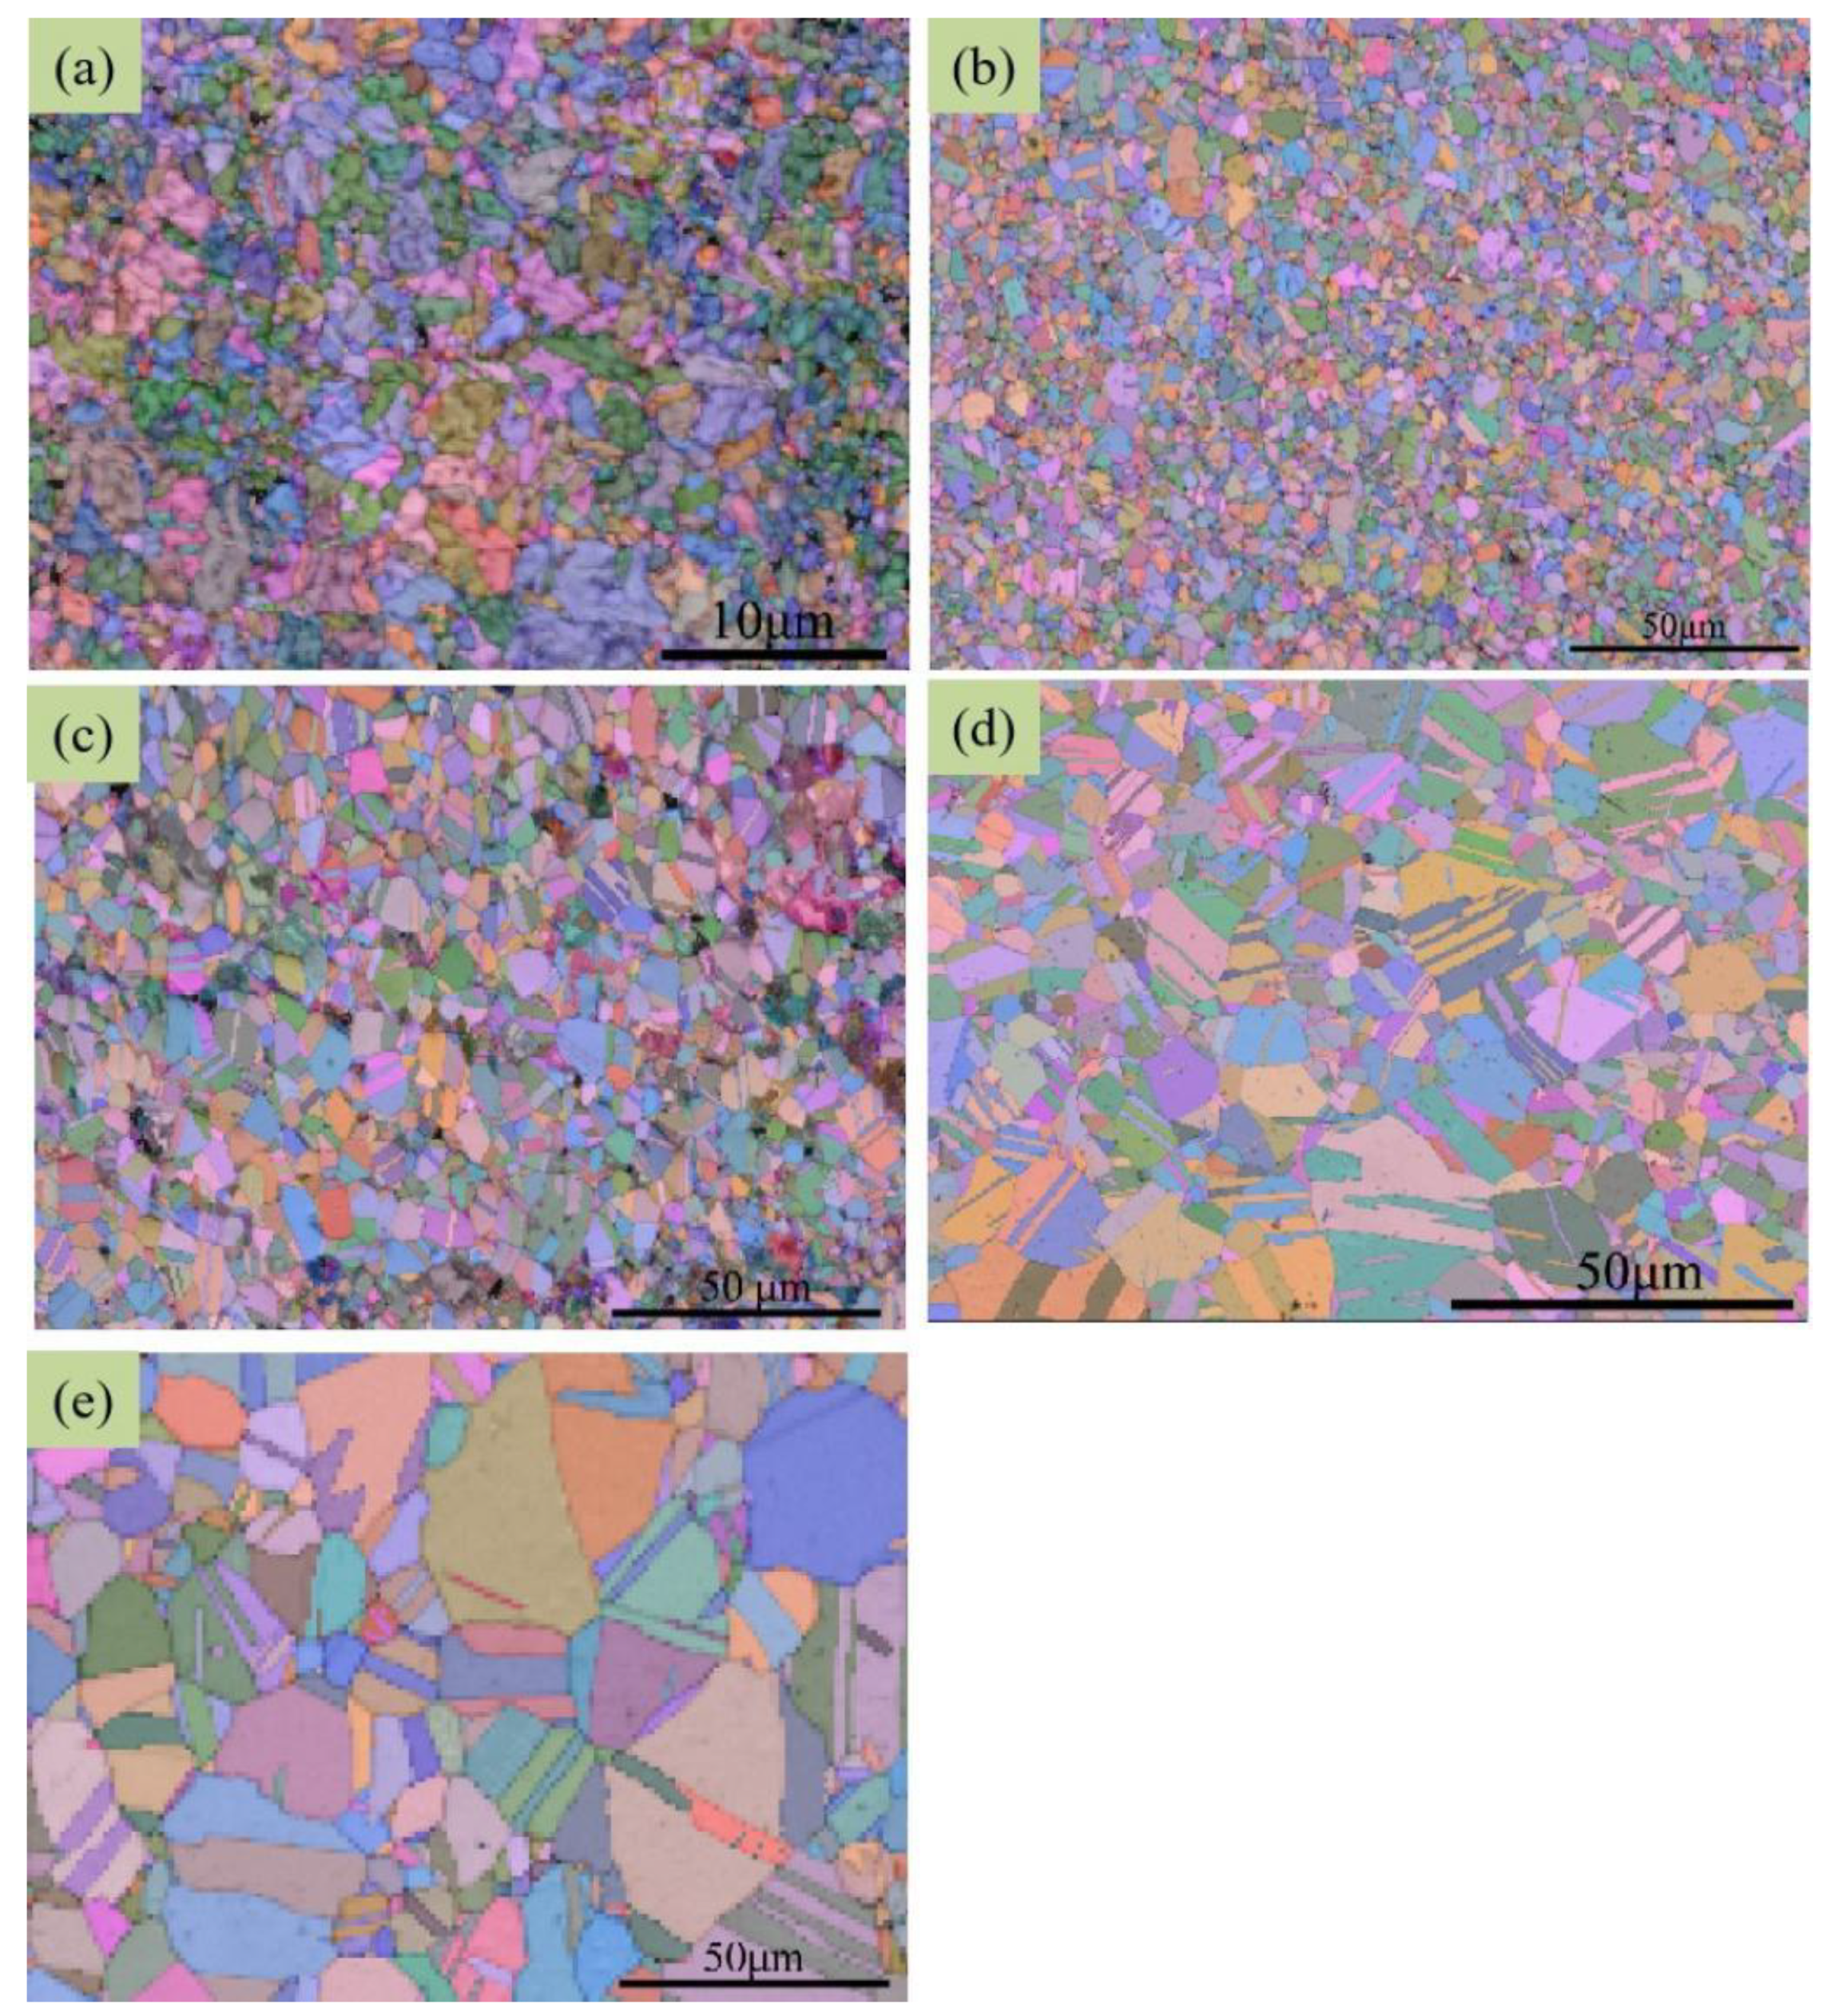
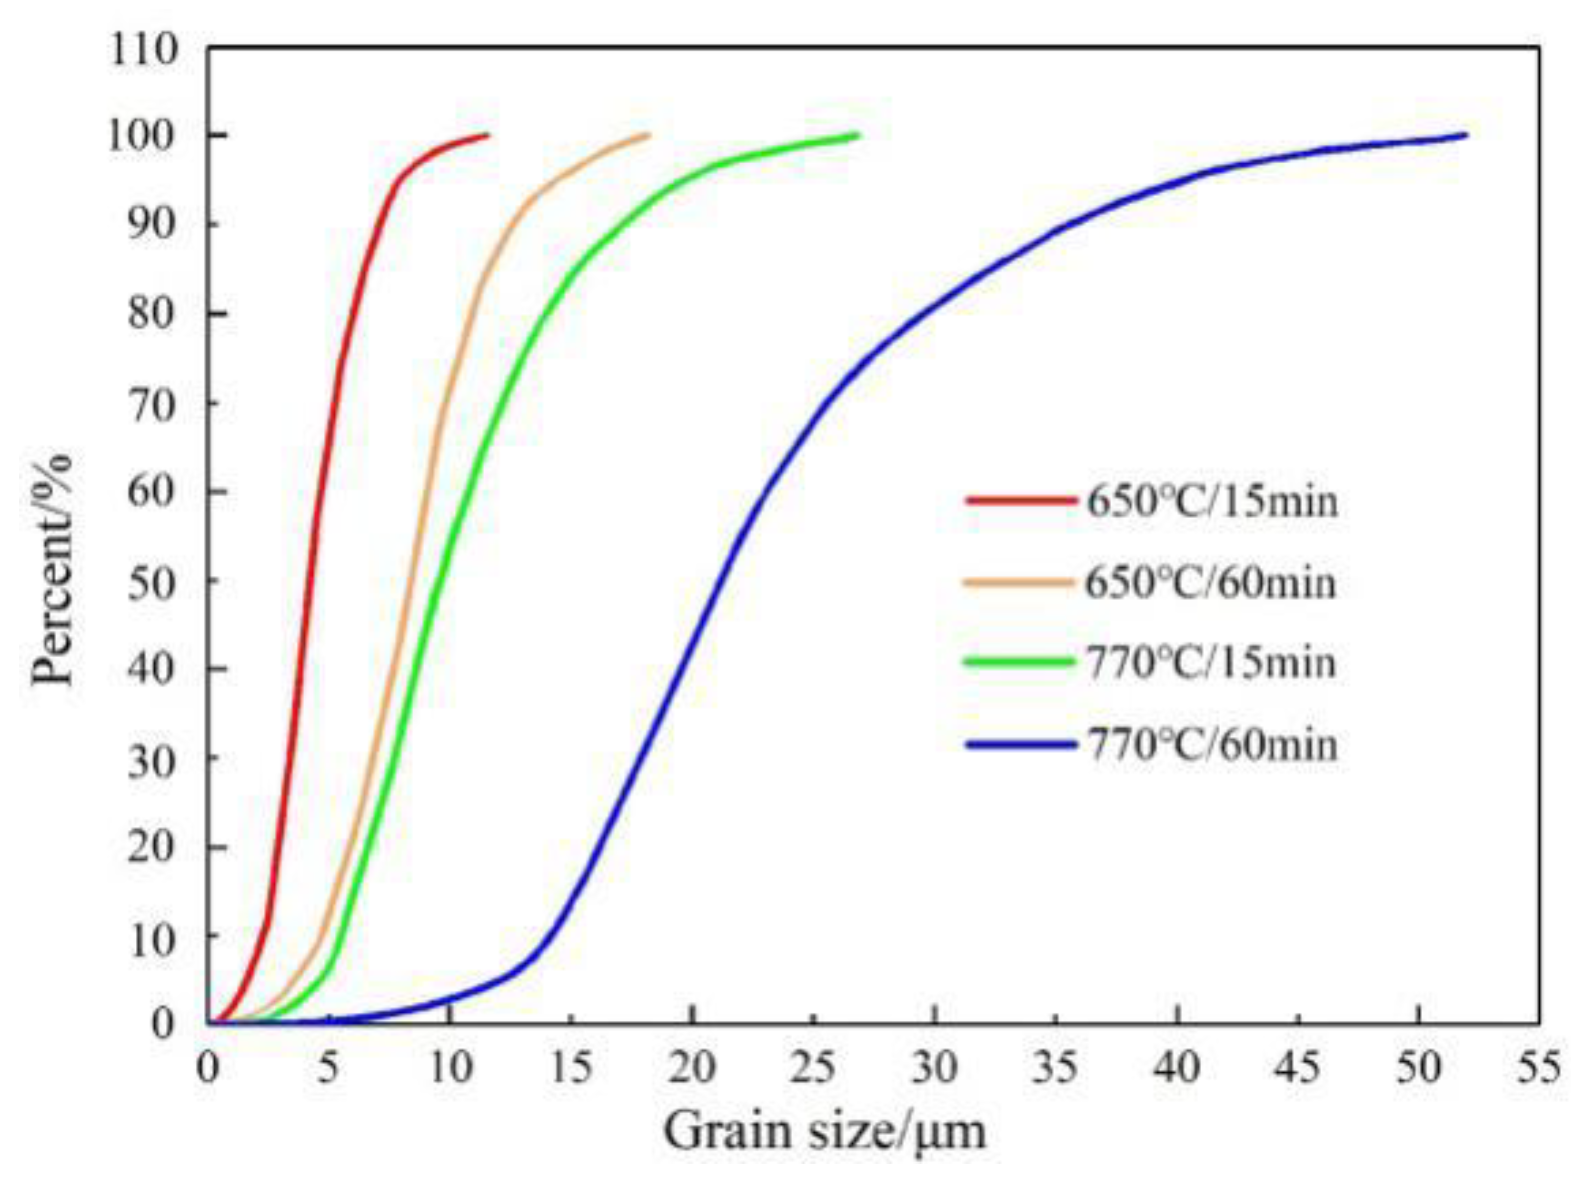
According to the Euler maps (Figure 3), the grain size of the annealed Cu-2.7Be sheets was noticeably increased, whereas the grain shape of the annealed sample tended to be equiaxed because of the recrystallization. Based on the grain size distribution of annealed samples (Figure 4 and Table 1), it is postulated that the growth rate of the grain size increased dramatically with the increase of annealing temperature.
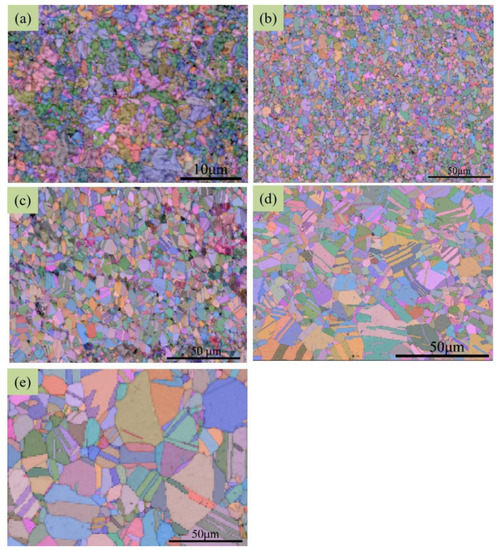
Figure 3.
Euler maps of cold-rolled and annealed Cu-2.7Be sheets: (a) Cold rolled, (b) 650 °C/15 min, (c) 650 °C/60 min, (d) 770 °C/15 min, (e) 770 °C/60 min.
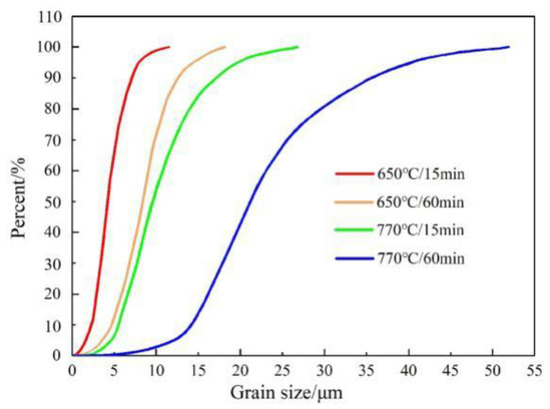
Figure 4.
Normalized cumulative frequency vs. grain size (including twin boundaries) of annealed Cu-2.7Be sheets.

Table 1.
The average grain size of Cu-2.7Be alloy at different annealing temperature and time calculated through Figure 4.
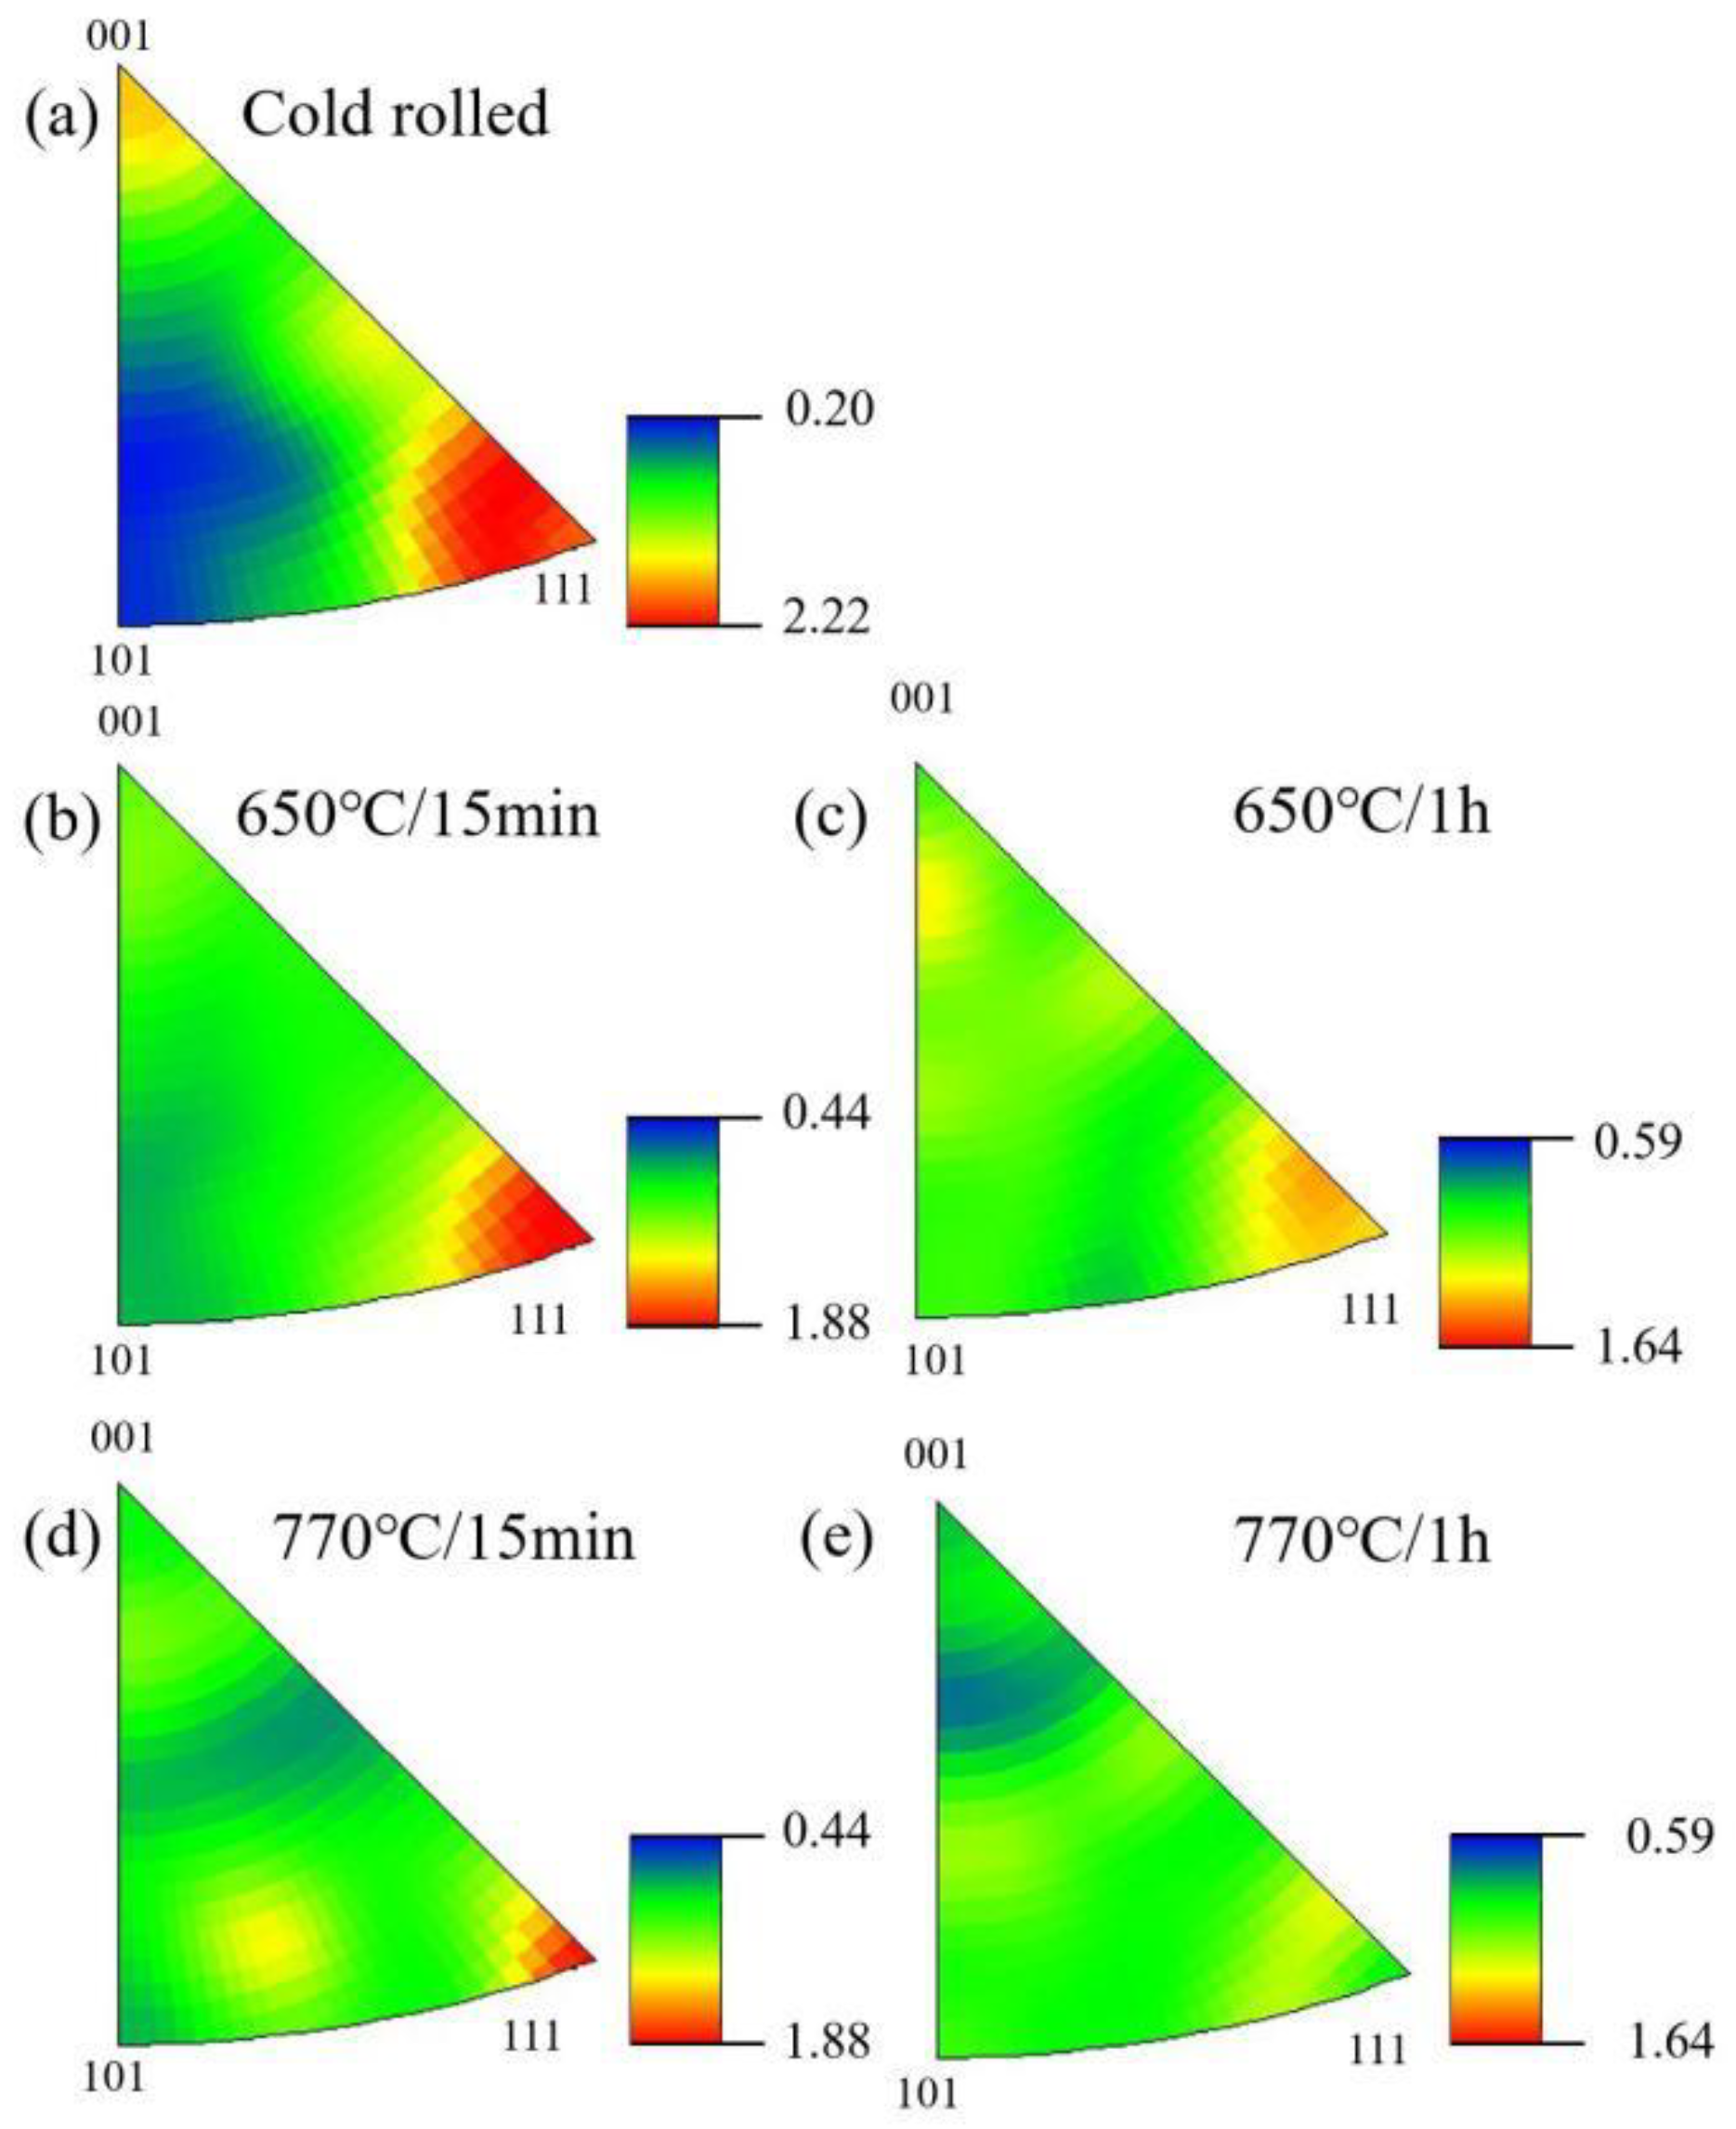
Figure 5 illustrates the inverse pole figures in the ND direction. The most abundant crystallographic orientations with intensified (111) planes occurred for the cold-rolled sample, as observed in Figure 5a. The change in the inverse pole figures depicts the evolution of texture during the annealing process. The inverse pole figure of the 650 °C/15 min sample (Figure 5b) demonstrated that the intensity of the (111) plane is weaker than that of the cold-rolled sample. As the annealing temperature and time were increased, the intensity of the (111) plane declined. Based on the aforementioned trend, the lowest intensity of the (111) plane was characteristic of the 770 °C/1 h sample (Figure 5e). The most densely packed crystallographic plane in a face center cubic (FCC) system is the (111) plane. The (111) < 110 > slip system is activated during the cold rolling process, thereby resulting in a strong (111) plane intensity, as seen in Figure 5a. The new recrystallized grains gradually replace the deformed grains thus causing the intensity of the (111) plane to decline (Figure 5b–e).
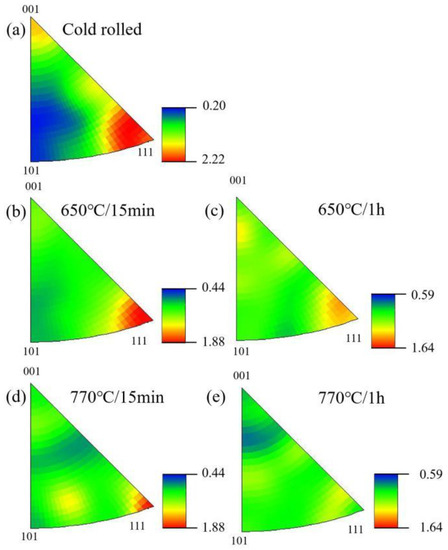
Figure 5.
Inverse pole figures of cold-rolled and annealed Cu-2.7Be sheets along the normal direction (ND): (a) Cold rolled, (b) 650 °C/15 min, (c) 650 °C/1 h, (d) 770 °C/15 min, (e) 770 °C/1 h.
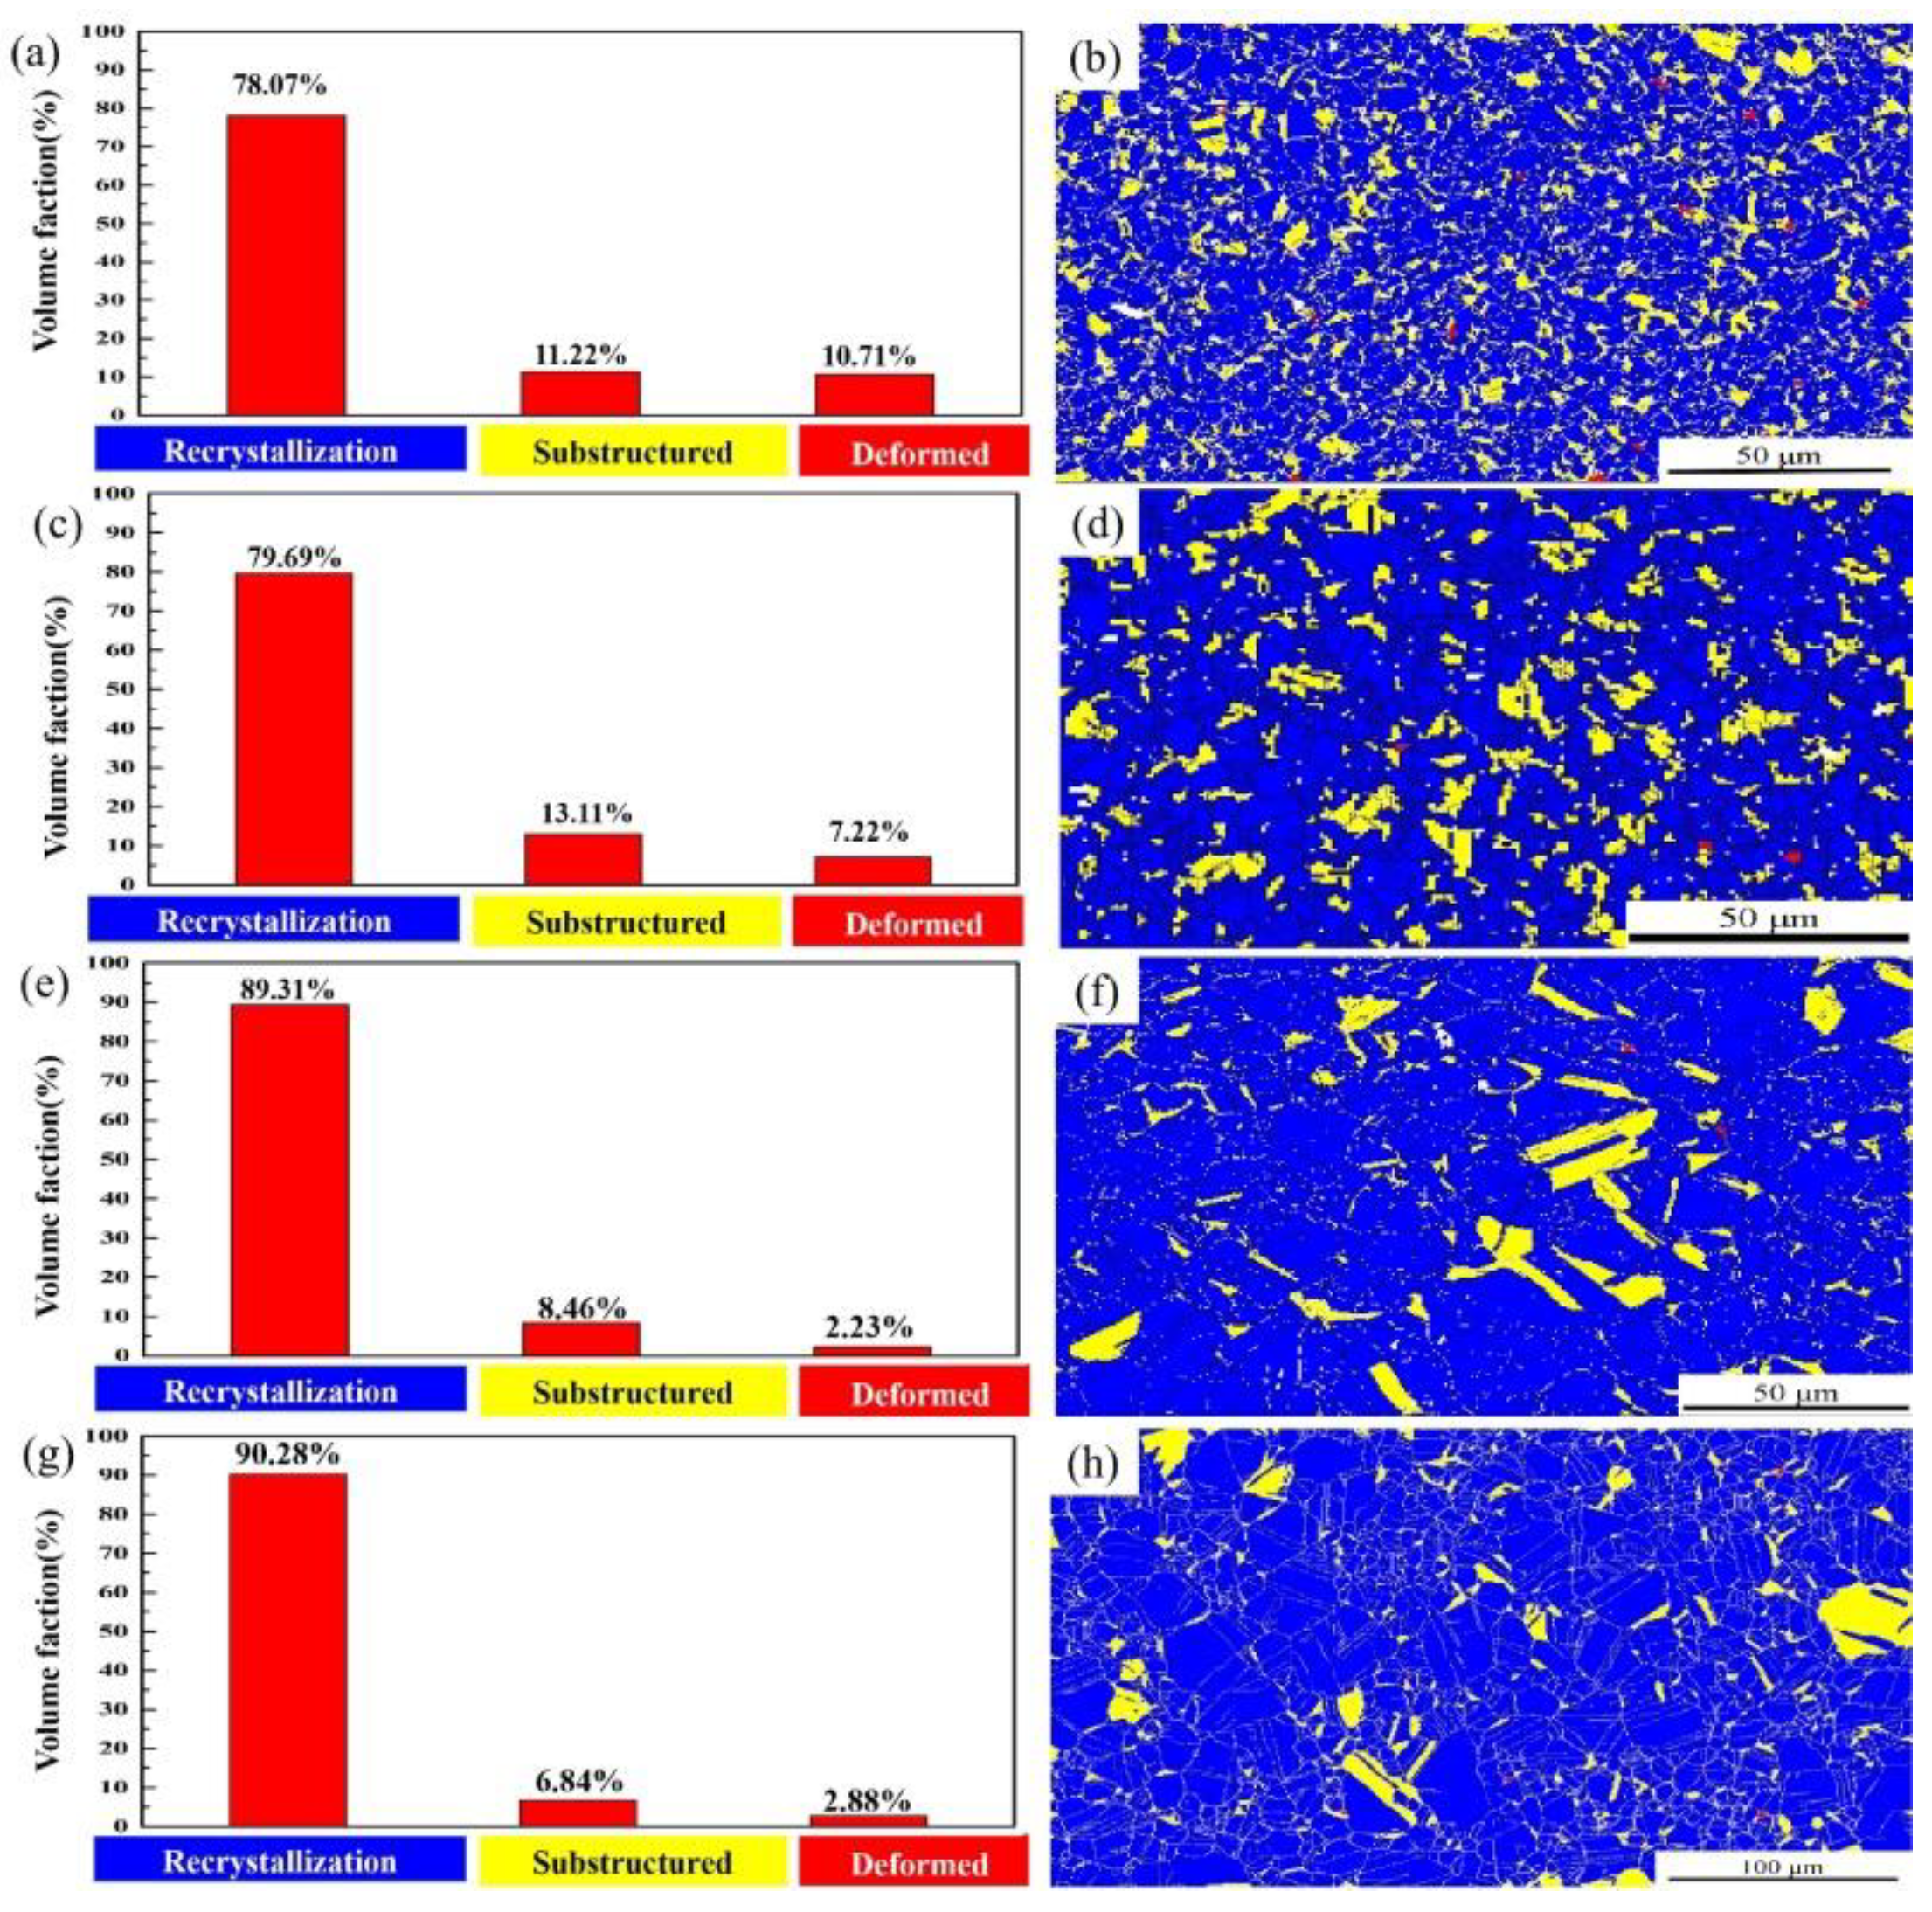
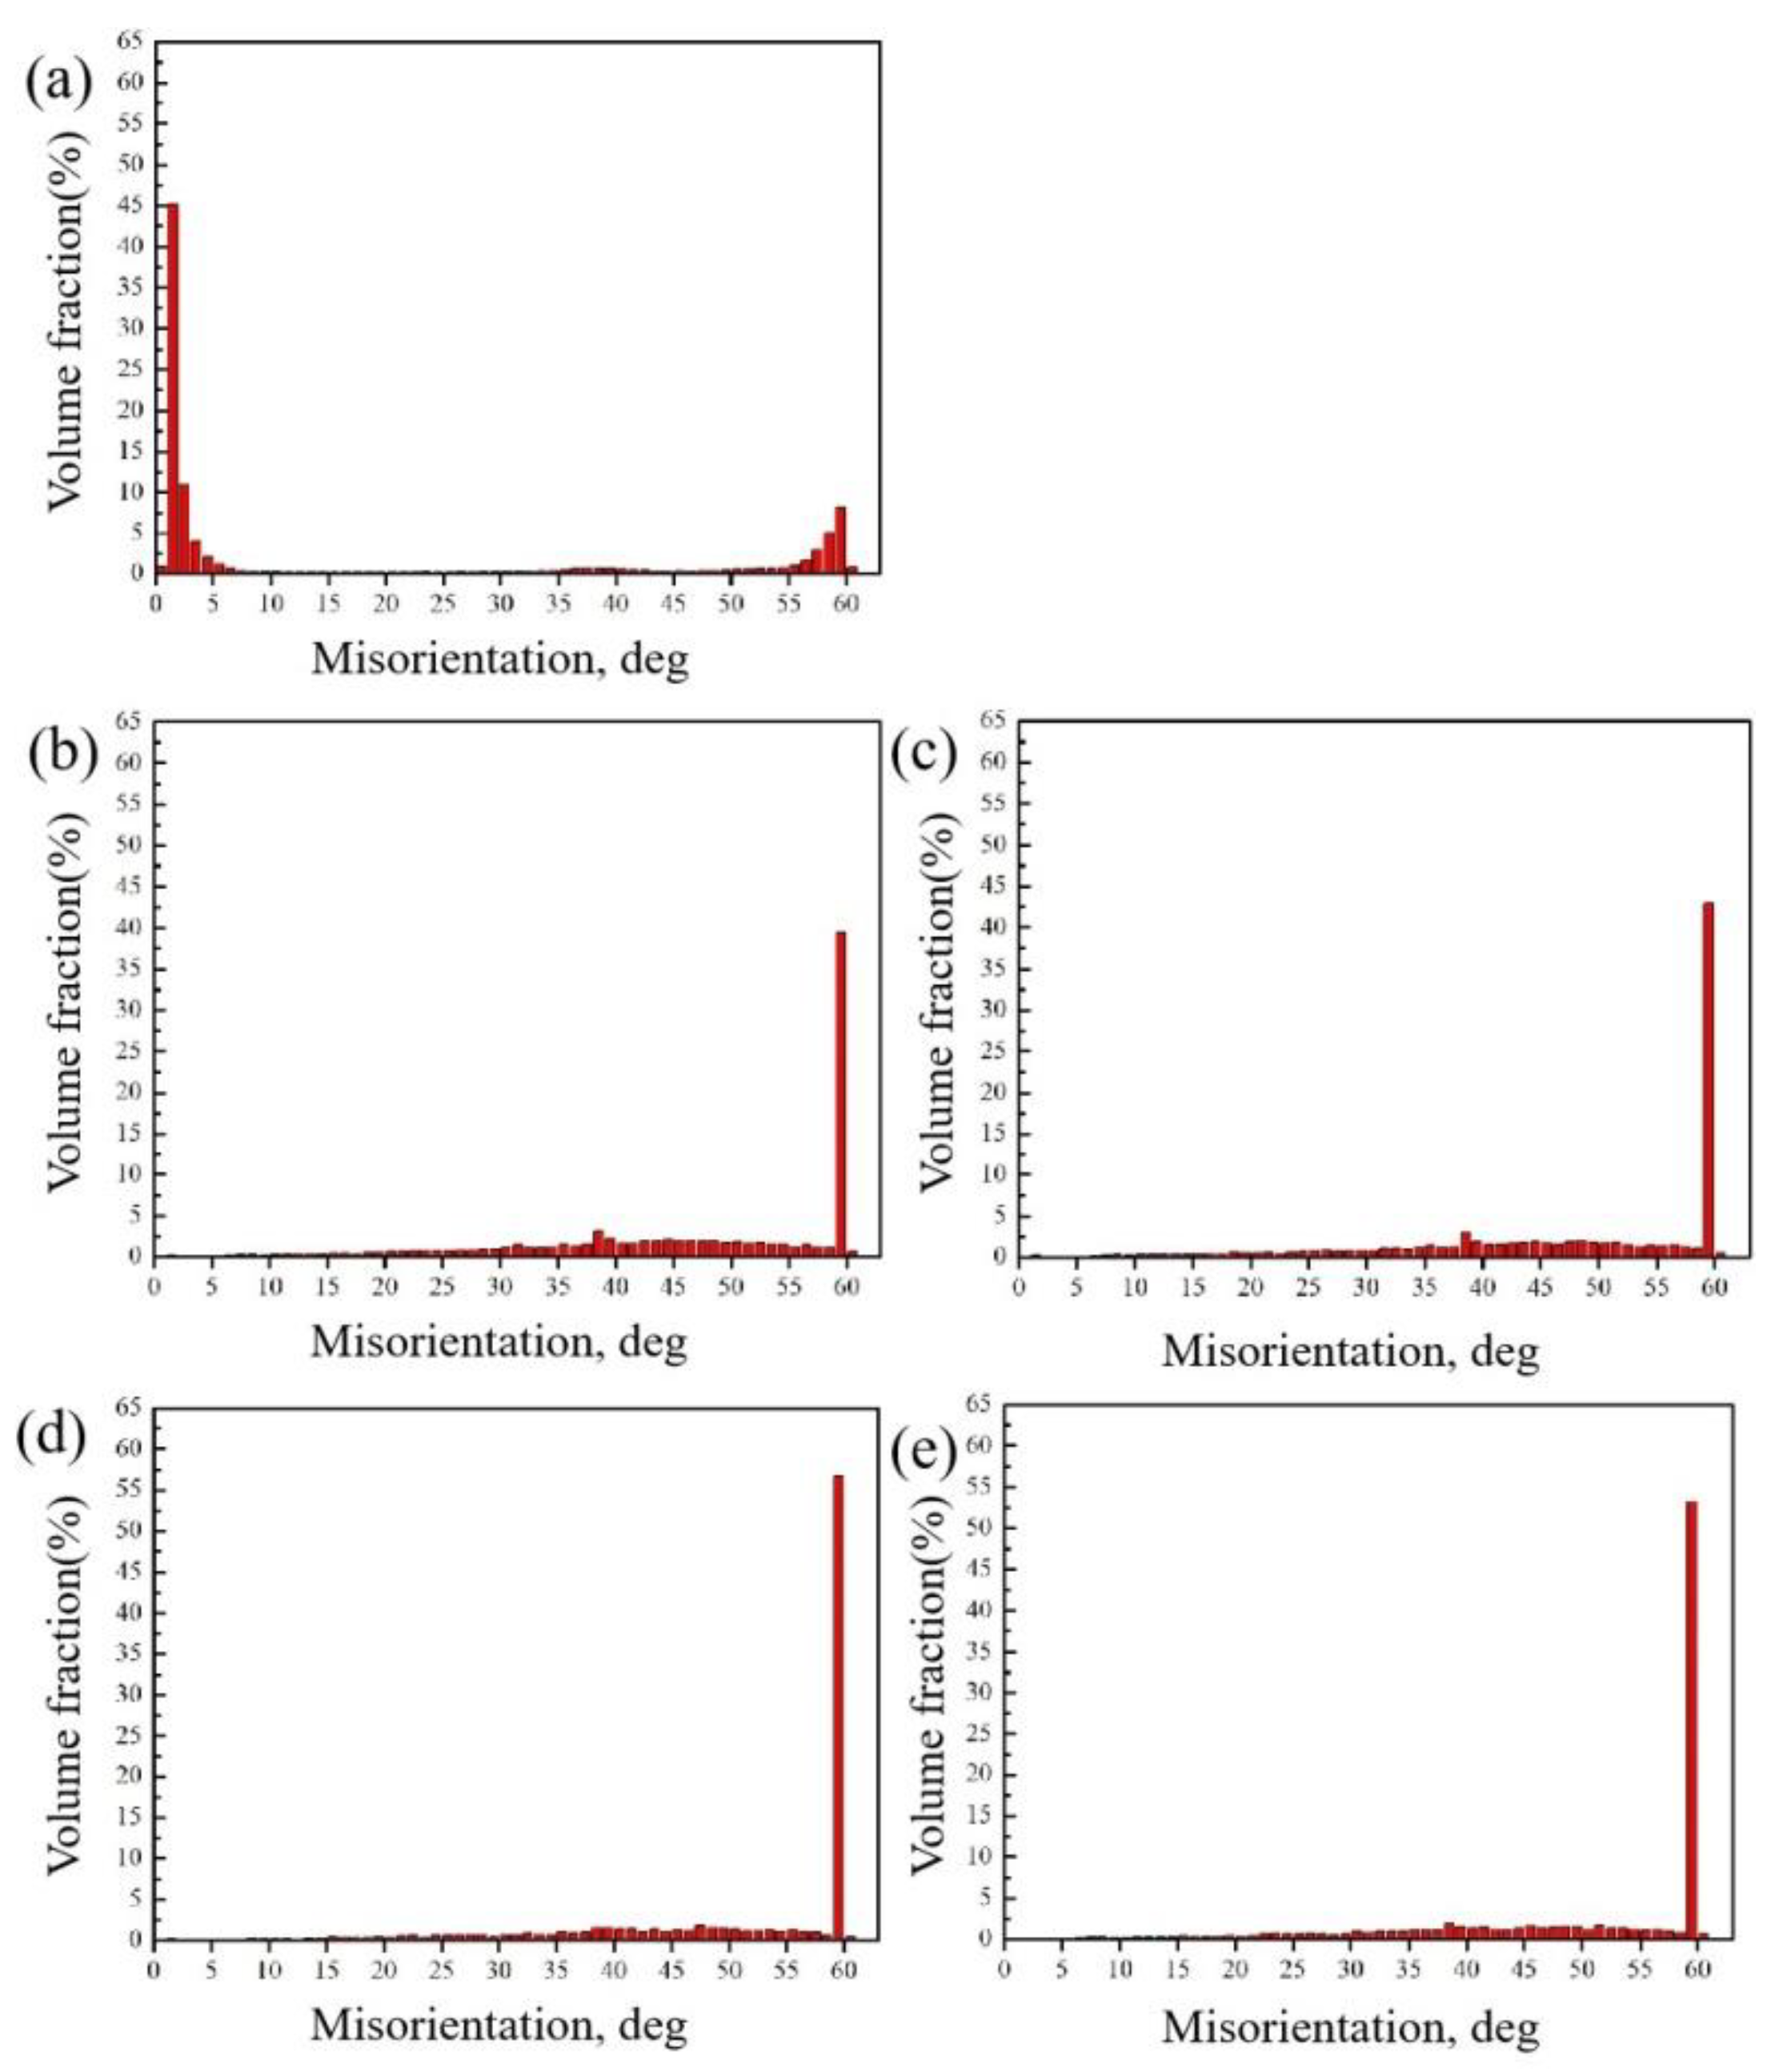
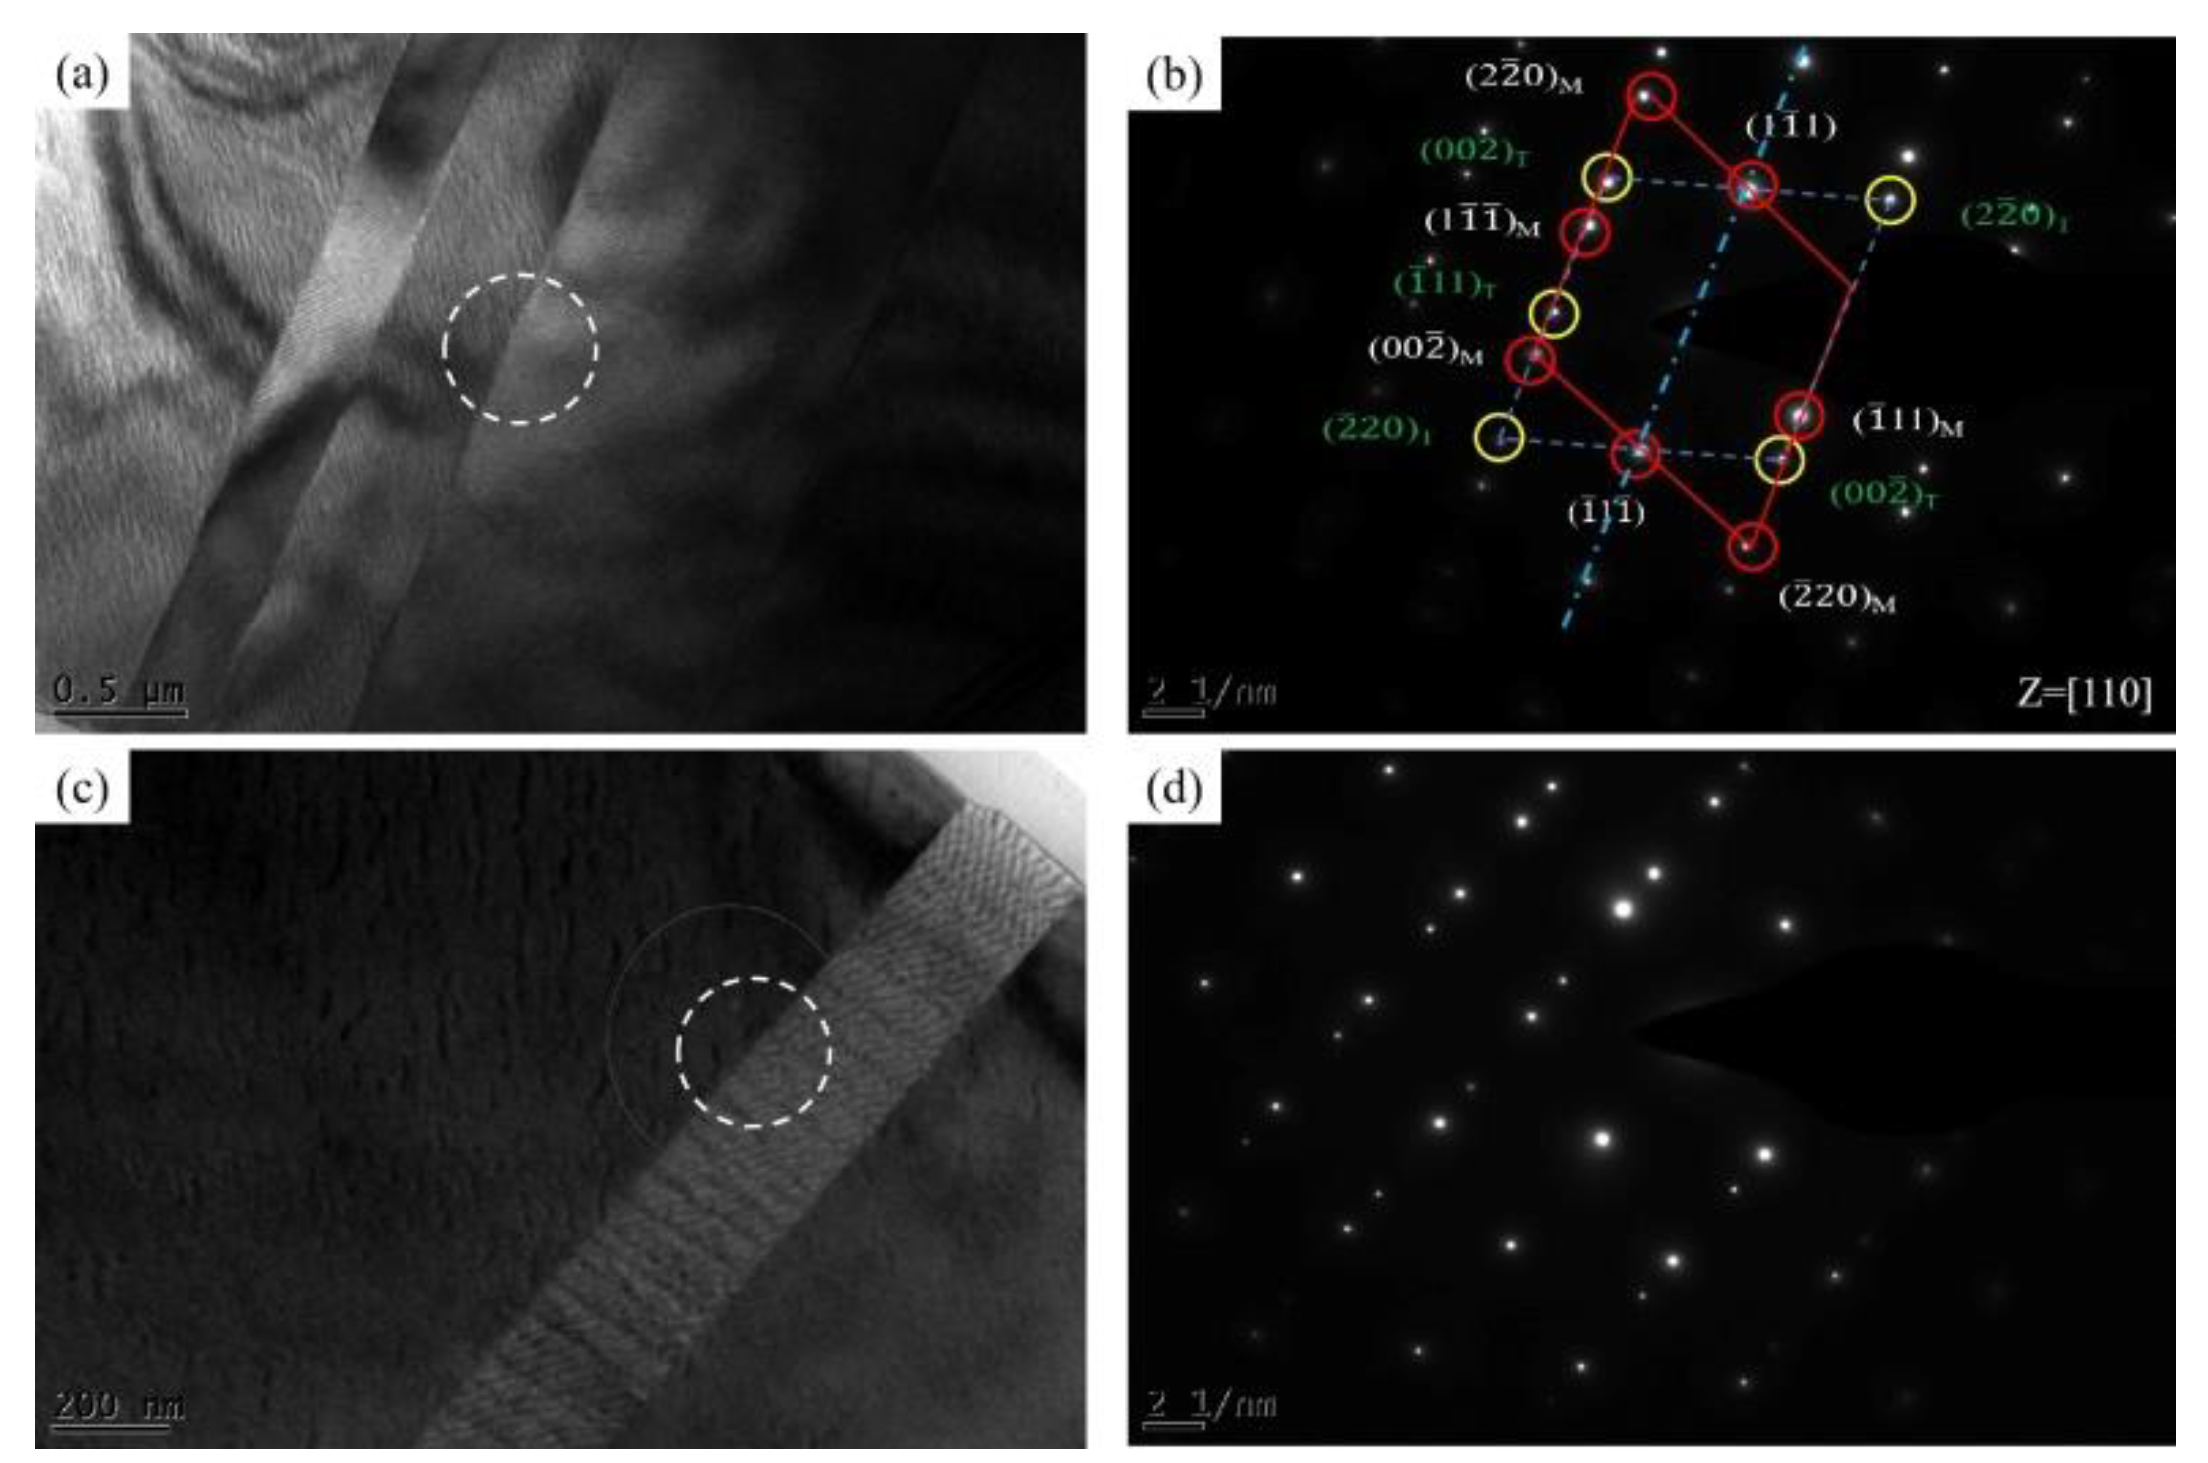
The recrystallization maps and the distribution of recrystallized fraction maps in Figure 6 illustrate that the fractions of the recrystallization grains increased along with the increase of annealing temperature and time. The newly formed recrystallization grains replaced the position of the previously deformed grains. Additionally, the recrystallization level of annealed samples corresponds to the variation trends of the (111) plane intensity in Figure 5. With the increase of recrystallization volume fraction (Figure 6), there is a decrease in the (111) plane intensity (Figure 5). The misorientation distribution in Figure 7 shows that the low angle grain boundaries (LAGBs) in cold rolled samples transformed into high angle grain boundaries (HAGBs) mostly after annealing. Based on the SAED results shown in Figure 8b,d, the 60° < 111 > twin boundaries—known as the ∑3 boundaries—constitute the vast majority of the boundary frictions in the annealed samples. The friction of the ∑3 boundaries increased significantly with increasing annealing temperature and time, thus guaranteeing good plasticity.
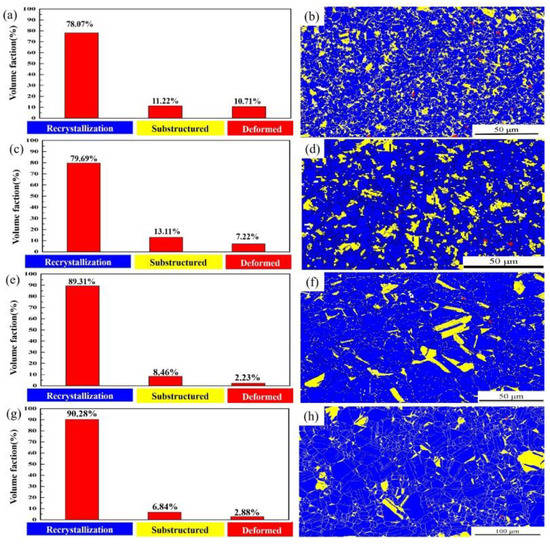
Figure 6.
Distribution of recrystallized fraction and recrystallization maps of annealed Cu-2.7Be samples: (a,b) 650 °C/15 min, (c,d) 650 °C/1 h, (e,f) 770 °C/15 min, (g,h) 770 °C/1 h.
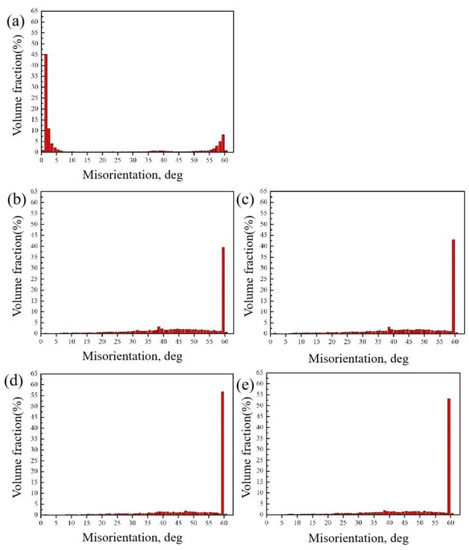
Figure 7.
Misorientation of cold-rolled and annealed Cu-2.7Be samples: (a) cold rolled; (b) 650 °C/15 min; (c) 650 °C/1 h; (d) 770 °C/15 min; (e) 770 °C/1 h.
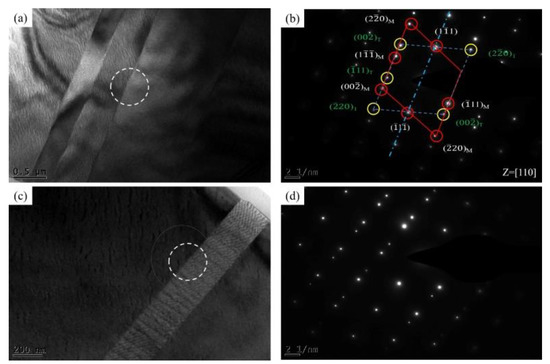
Figure 8.
TEM and SAED of annealing twins under different annealing temperature: (a) 770 °C/15 min samples; (b) SAED of 770 °C/15 min samples; (c) 650 °C/15 min samples; (d) SAED of 650 °C/15 min samples.
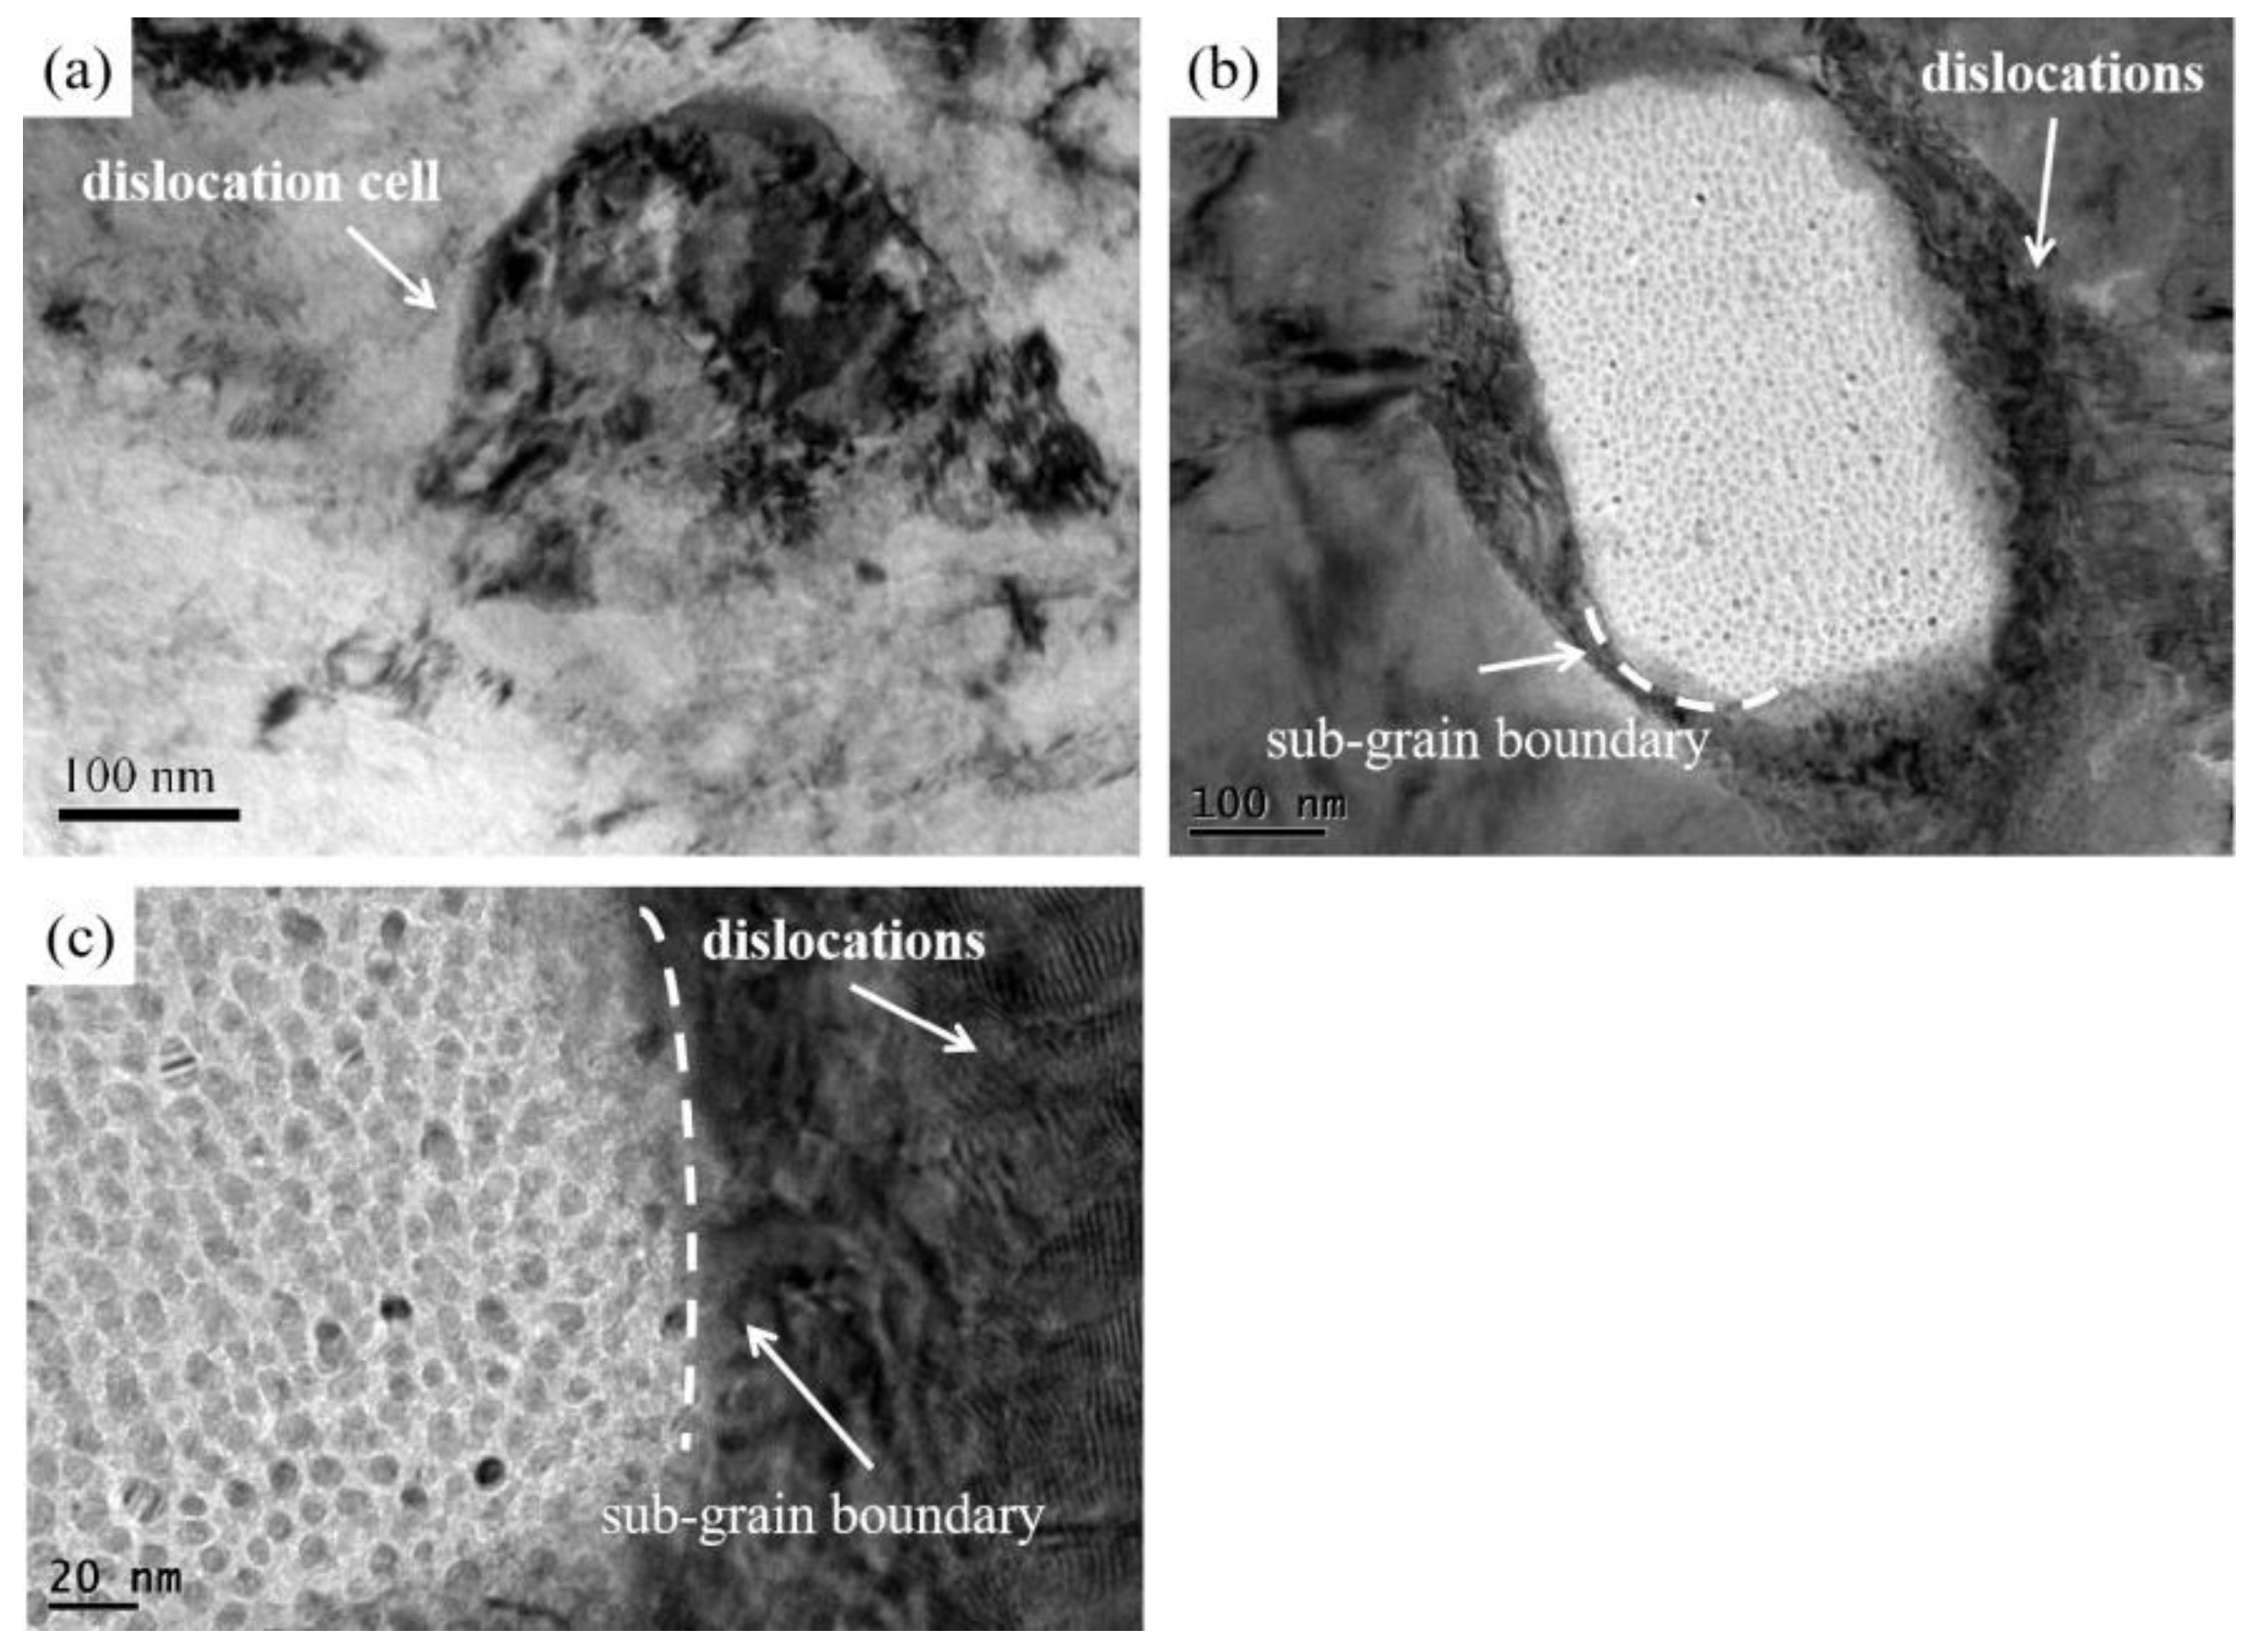
Based on the microstructures observed through TEM, there is a mass of dislocation cells within the high-density dislocation intersection areas as shown in Figure 9a. The cell walls are high-density dislocation walls. The motions and interactions of these dislocations are driven by thermodynamic factors and accelerate the transformation from dislocation walls to sub-grain boundaries, as shown in Figure 9b,c. The aforementioned transformation phenomenon that occurs is a typical continuous static recrystallization (cSRX) process [27]. As the grain boundary migration continued, recrystallized nuclei composed entirely of high angel grain boundaries were formed as the misorientation distribution shown in Figure 7b–e.
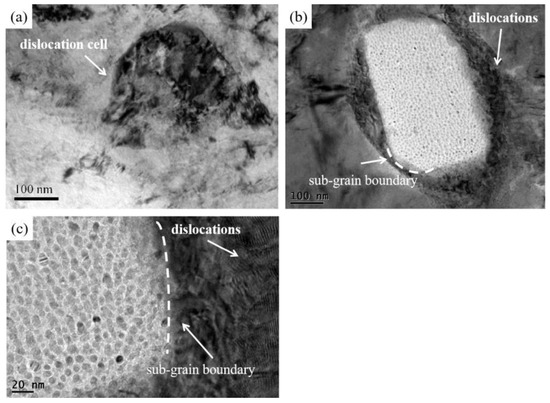
Figure 9.
The TEM micrograph of (a) the cold-rolled sample and (b), (c) CSRXed region samples observed under 650 °C/5 s.
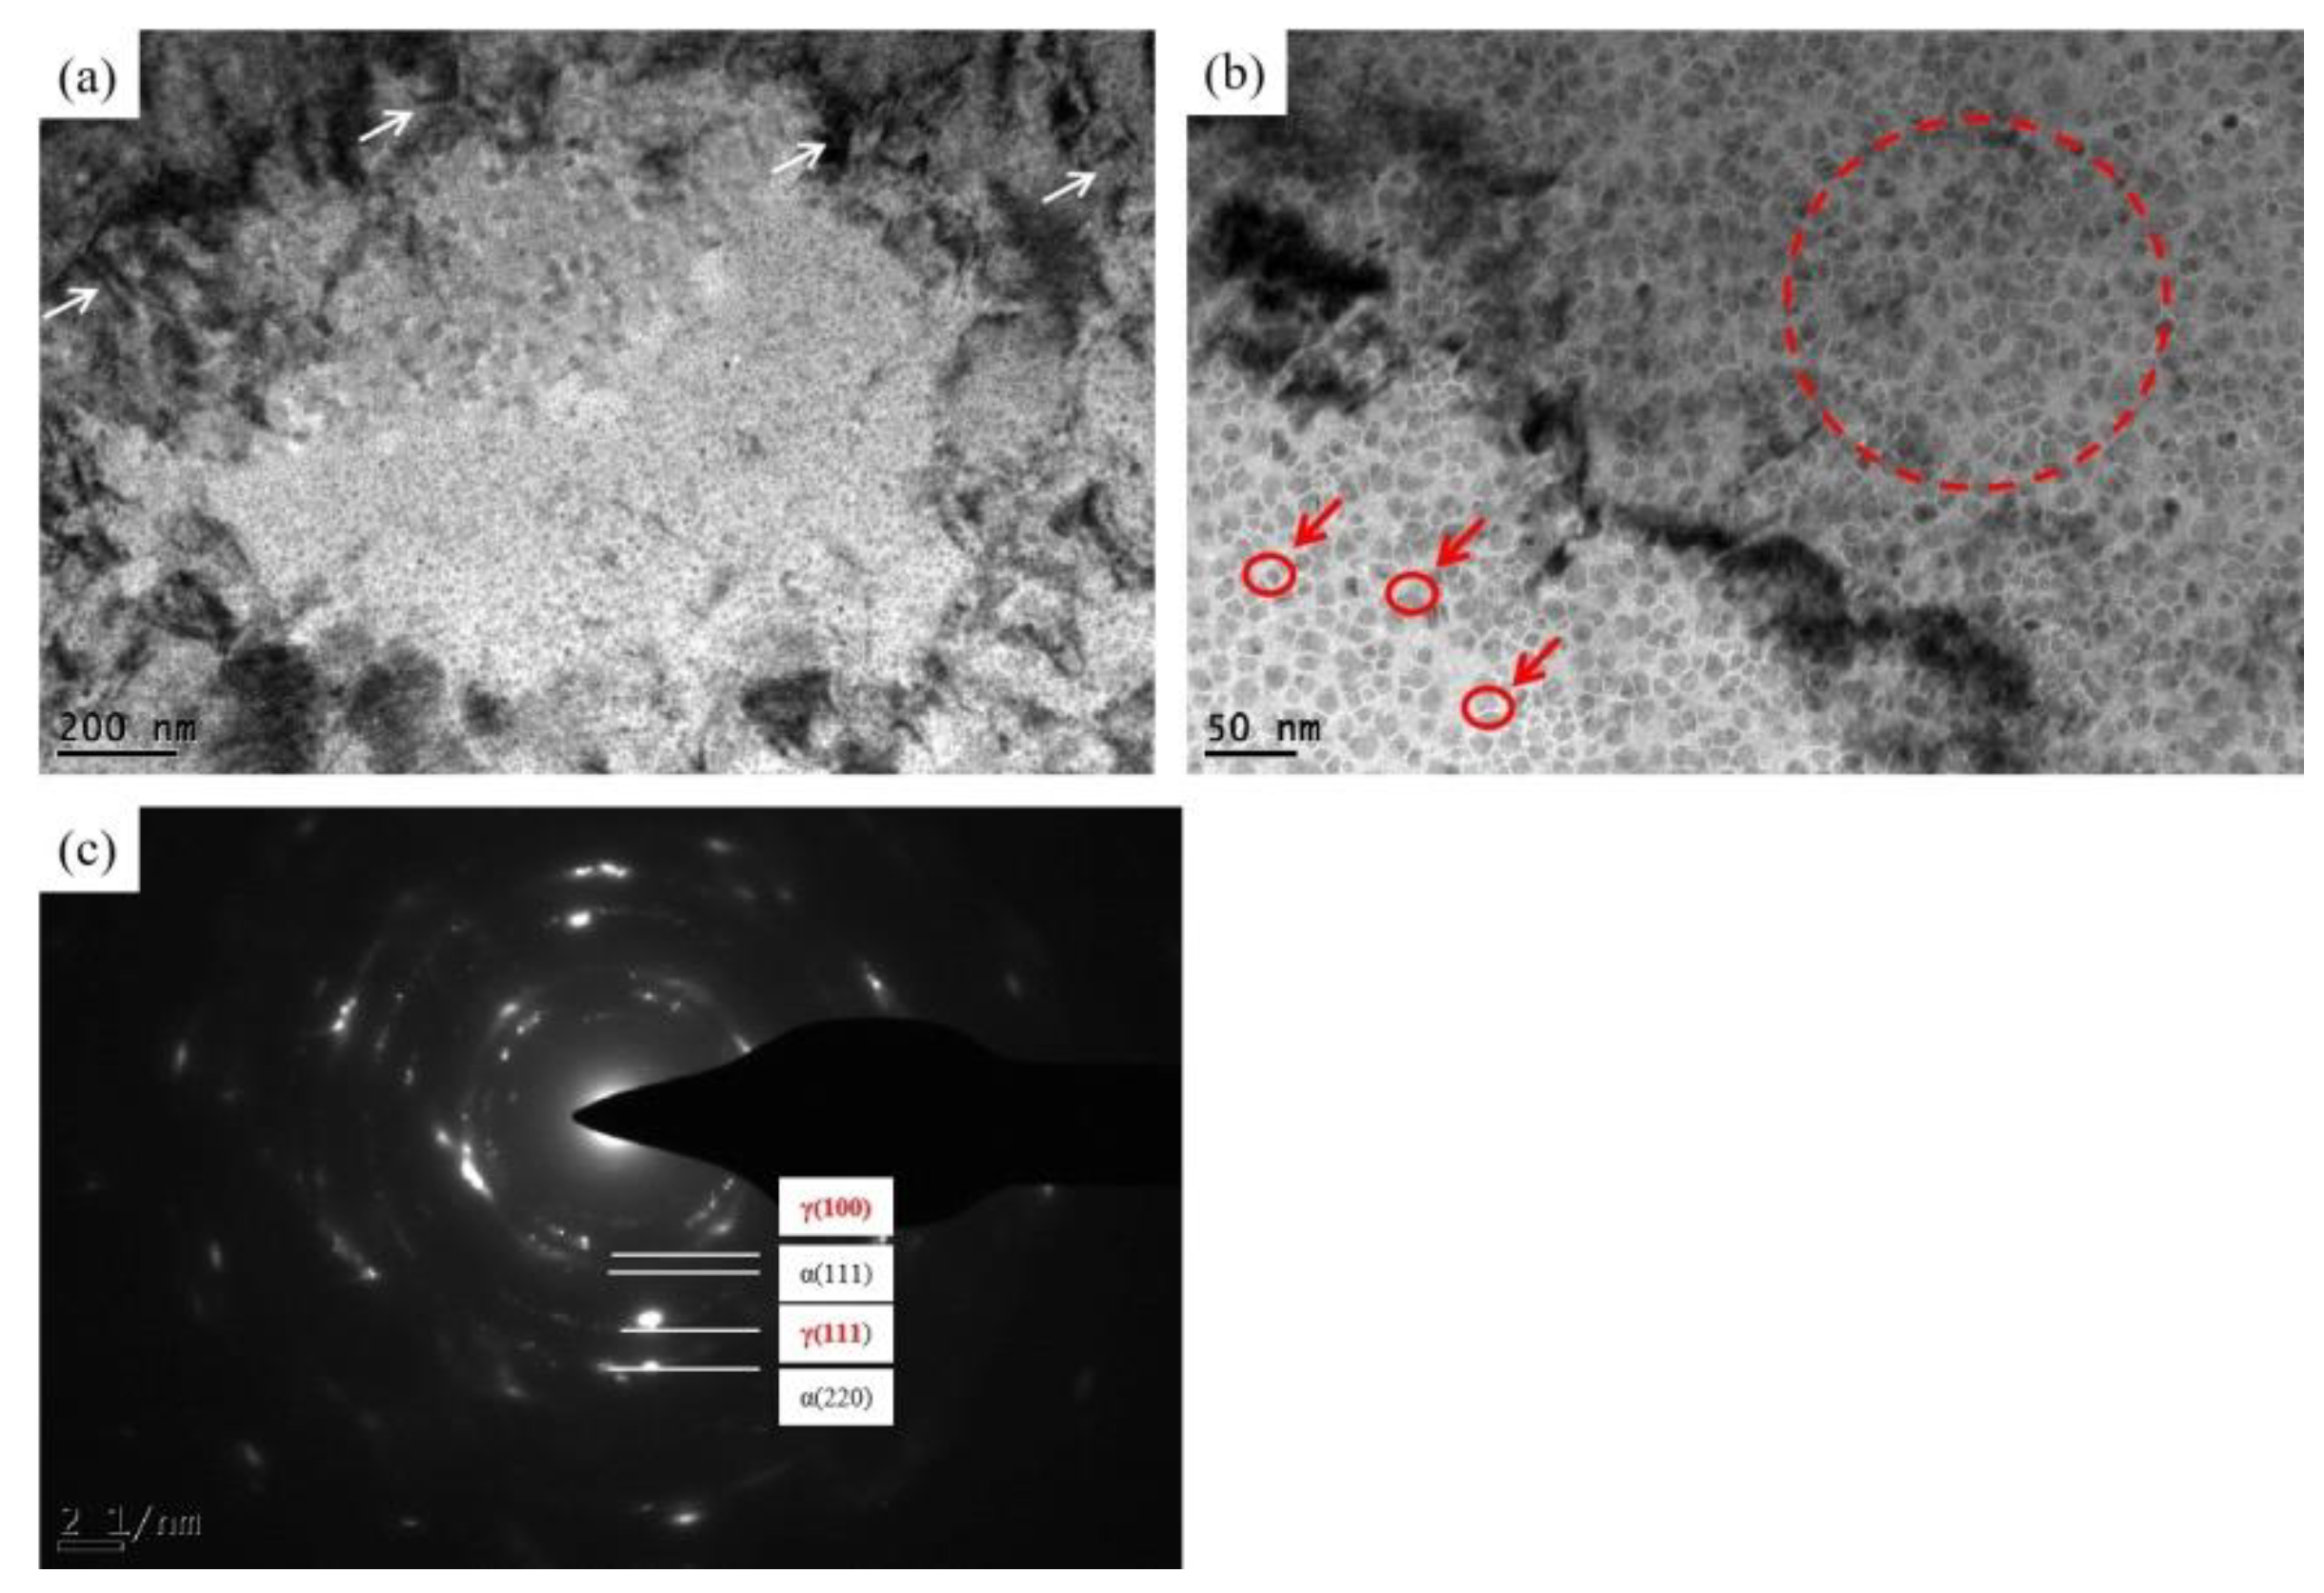
It is acknowledged that the high deformation induced by the cold rolling could introduce high-density defects such as dislocations, as shown in Figure 9a and Figure 10a. Moreover, a large number of secondary particles within 5–6 nm were found and indicated by the red circles shown in Figure 10b. From the SAED results shown in Figure 10c, these fine particles are the γ phase.
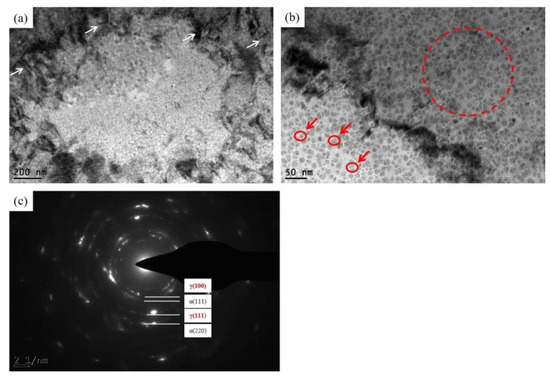
Figure 10.
TEM micrograph of (a), (b) secondary particles in the cold-rolled samples, and (c) the SAED of the red dashed circle.
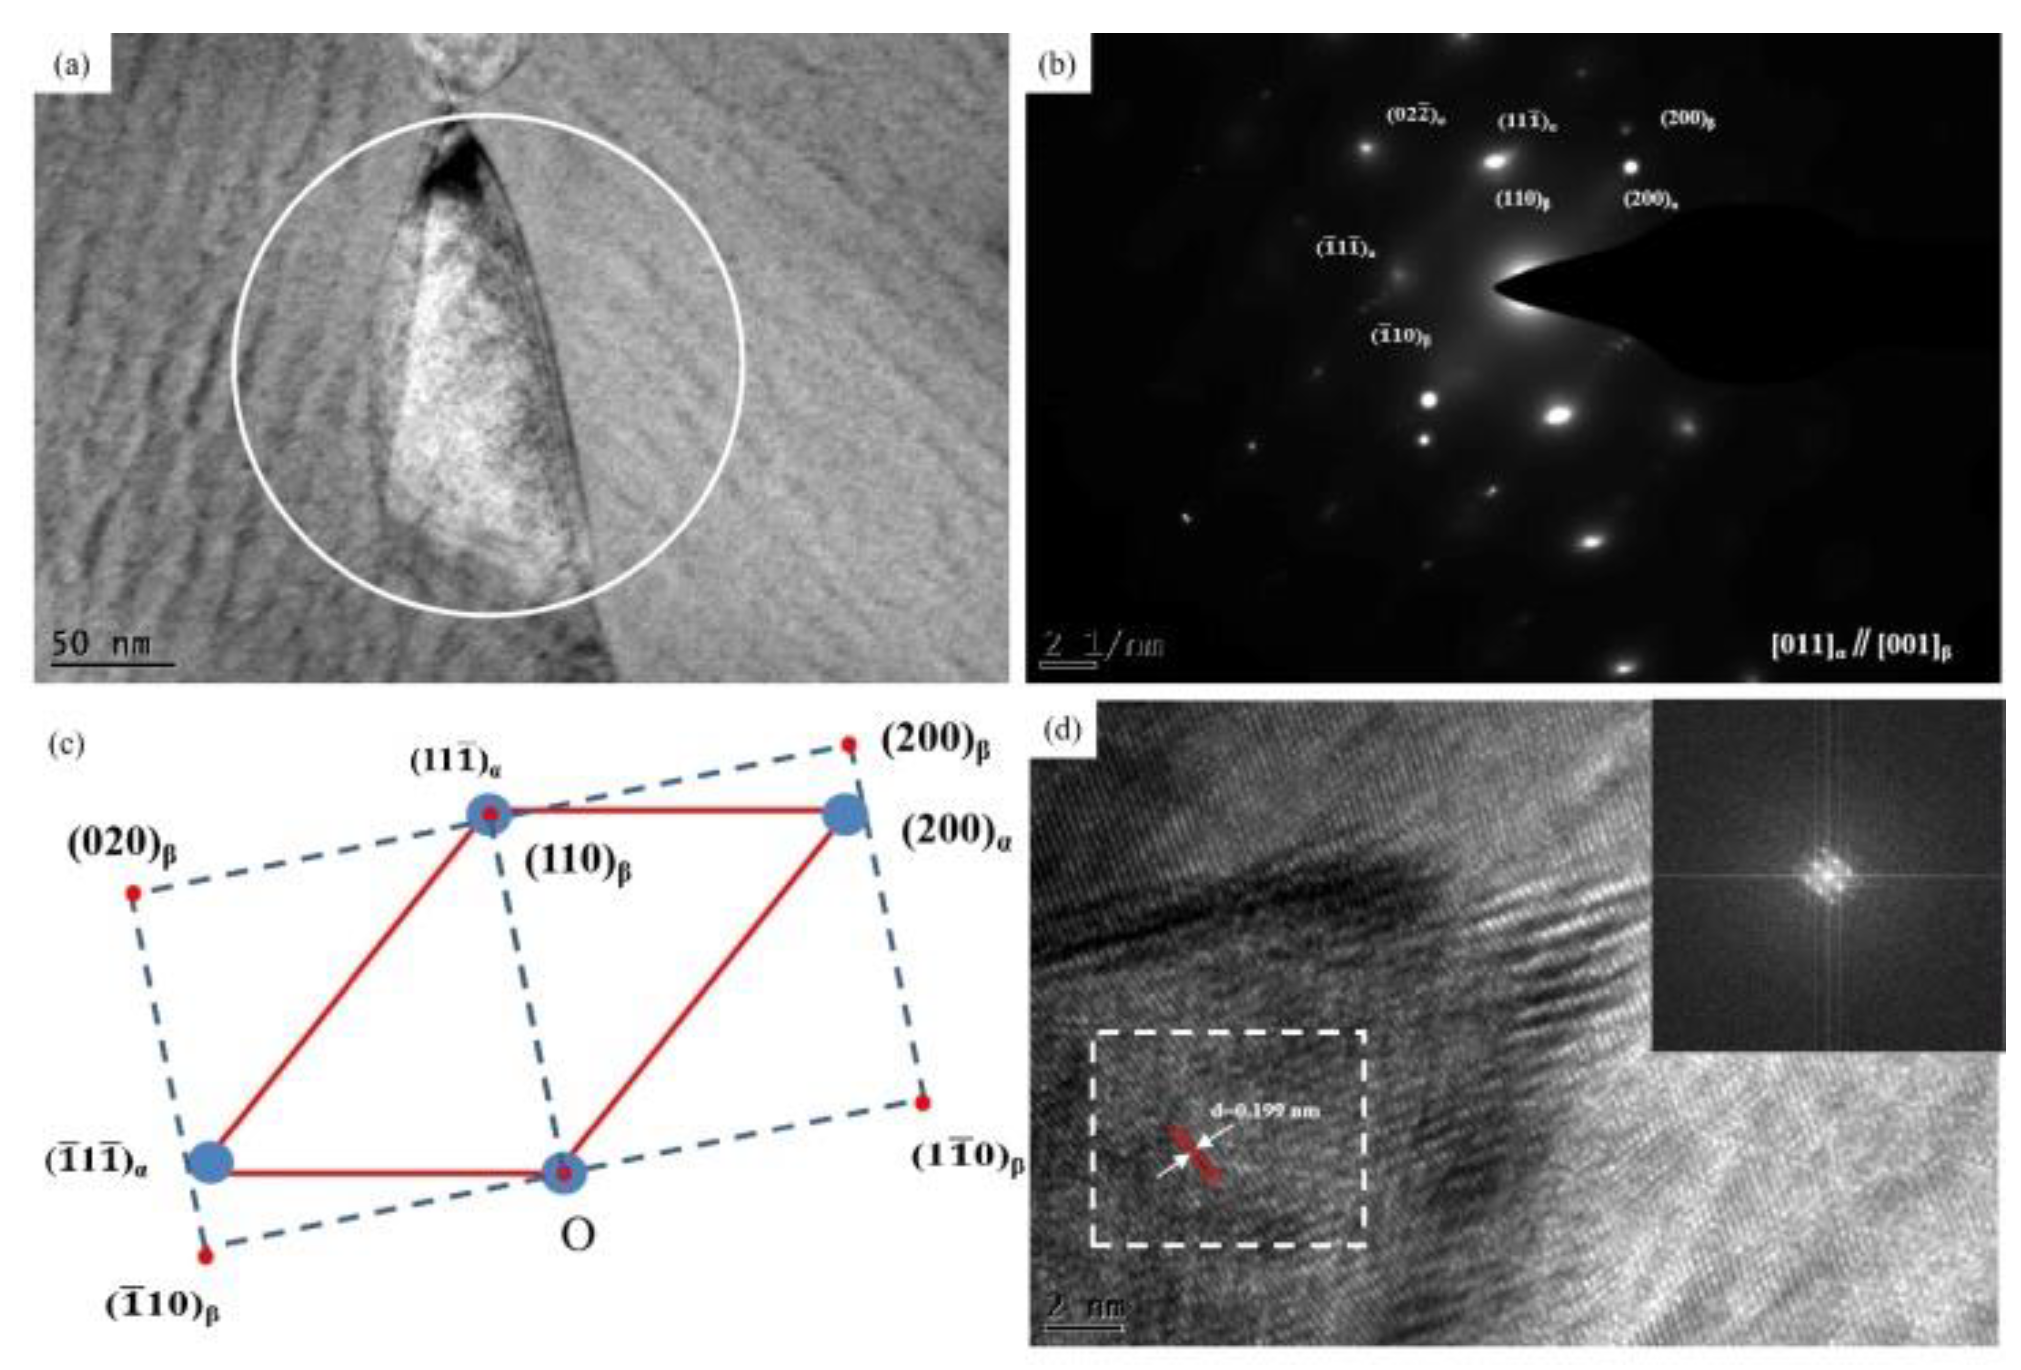
Figure 11a–d are the TEM, HRTEM images, and SAED of the Cu-2.7Be samples annealed at 650 °C for 2 min. When the annealing temperature was above 618 °C, the eutectoid reaction (α + γ→β) occurred, which resulted in the disappearance of the γ phase (Figure 10) and the production of the β phase. In Figure 11a, the lath-shaped β particles can be identified. In Figure 11b,c, the orientation relationship between β phases and the surrounding Cu-matrix is expressed as (111)α∥(110)β and (011)α∥(001)β. The β phase has a bcc) structure with a = b = c = 0.281 nm. The red arrows indicate that β particles obtain coherent relations with the matrix, as seen in Figure 11d.
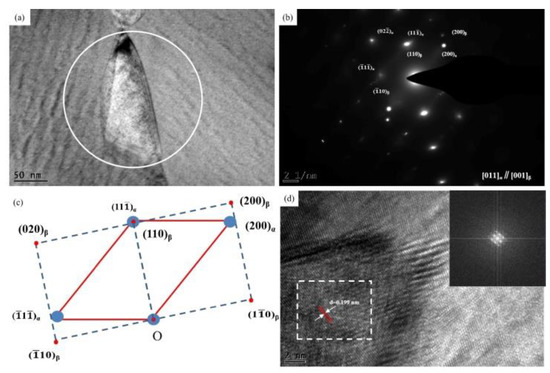
Figure 11.
Microstructure of the β phase in Cu-2.7Be samples annealed at 650 °C for 2 min: (a) TEM image; (b) the SAED of white circle area in (a); (c) schematic representation of (b); (d) high resolution transmission electron microscopy (HRTEM) image of (a), the inset show the Fast Fourier Transform (FFT) of rectangular region.
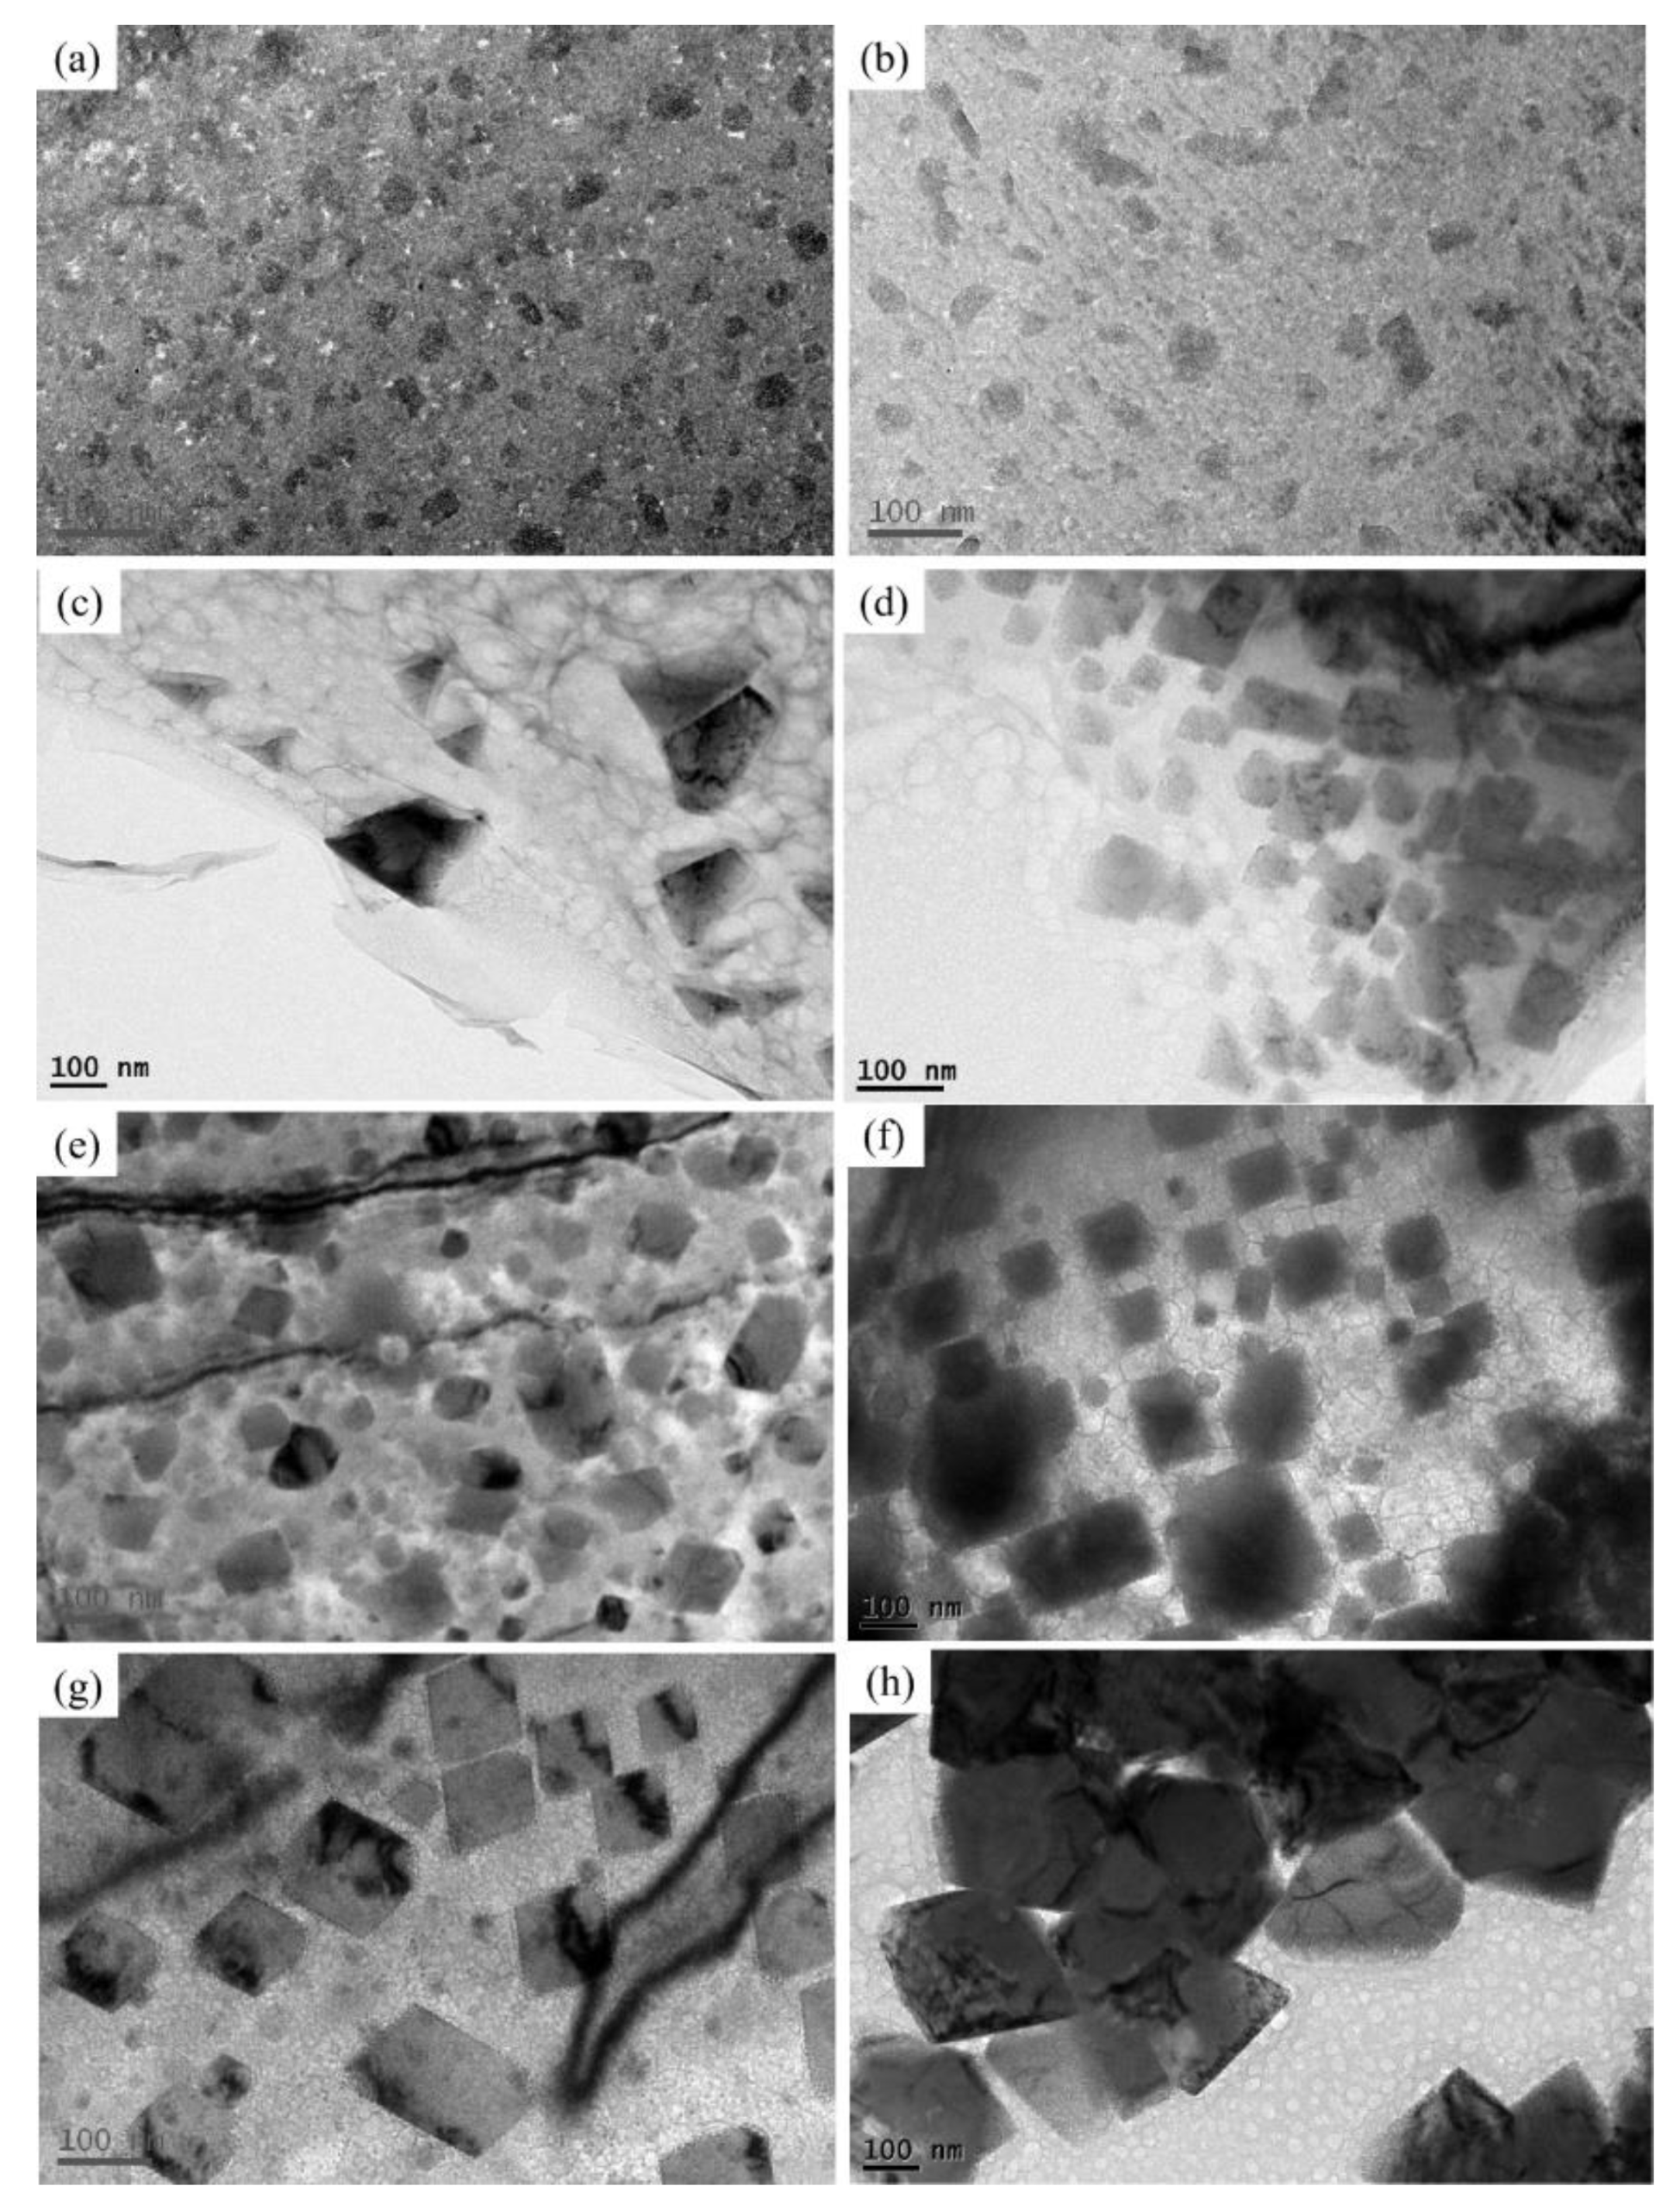
The TEM images of the β phases as a function of increasing annealing temperature and time are shown in Figure 12a–h. When compared with the lath-shaped β particles in Figure 11a, the shape of the β phases in Figure 12a–c exhibit an irregular polygon shape when the annealing temperature was 650 °C. The quadrangle-shaped β phases can be obtained when the annealing time is increased to 1 has shown in Figure 12d. Interestingly, at the annealing temperature of 770 °C, the morphologies of the β phases are all quadrangle-shaped and are similar to the morphologies in Figure 12d. Furthermore, the size of the β phases in Figure 12e–h increased as the annealing time increased.
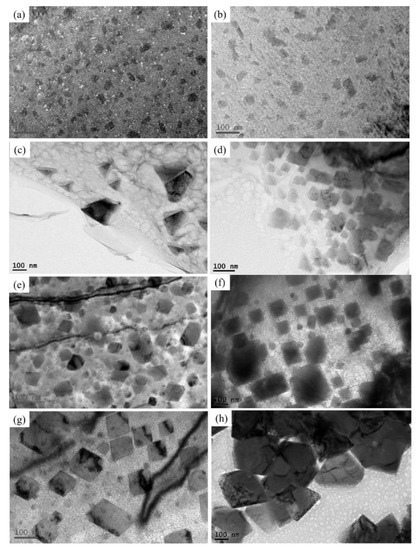
Figure 12.
TEM micrograph of β phases in Cu-2.7Be sheets annealed at (a) 650 °C/15 min, (b) 650 °C/30 min, (c) 650 °C/45 min, (d) 650 °C/1 h (e) 770 °C/15 min, (f) 770 °C/30 min, (g) 770 °C/45 min and (h) 770 °C/1 h respectively.
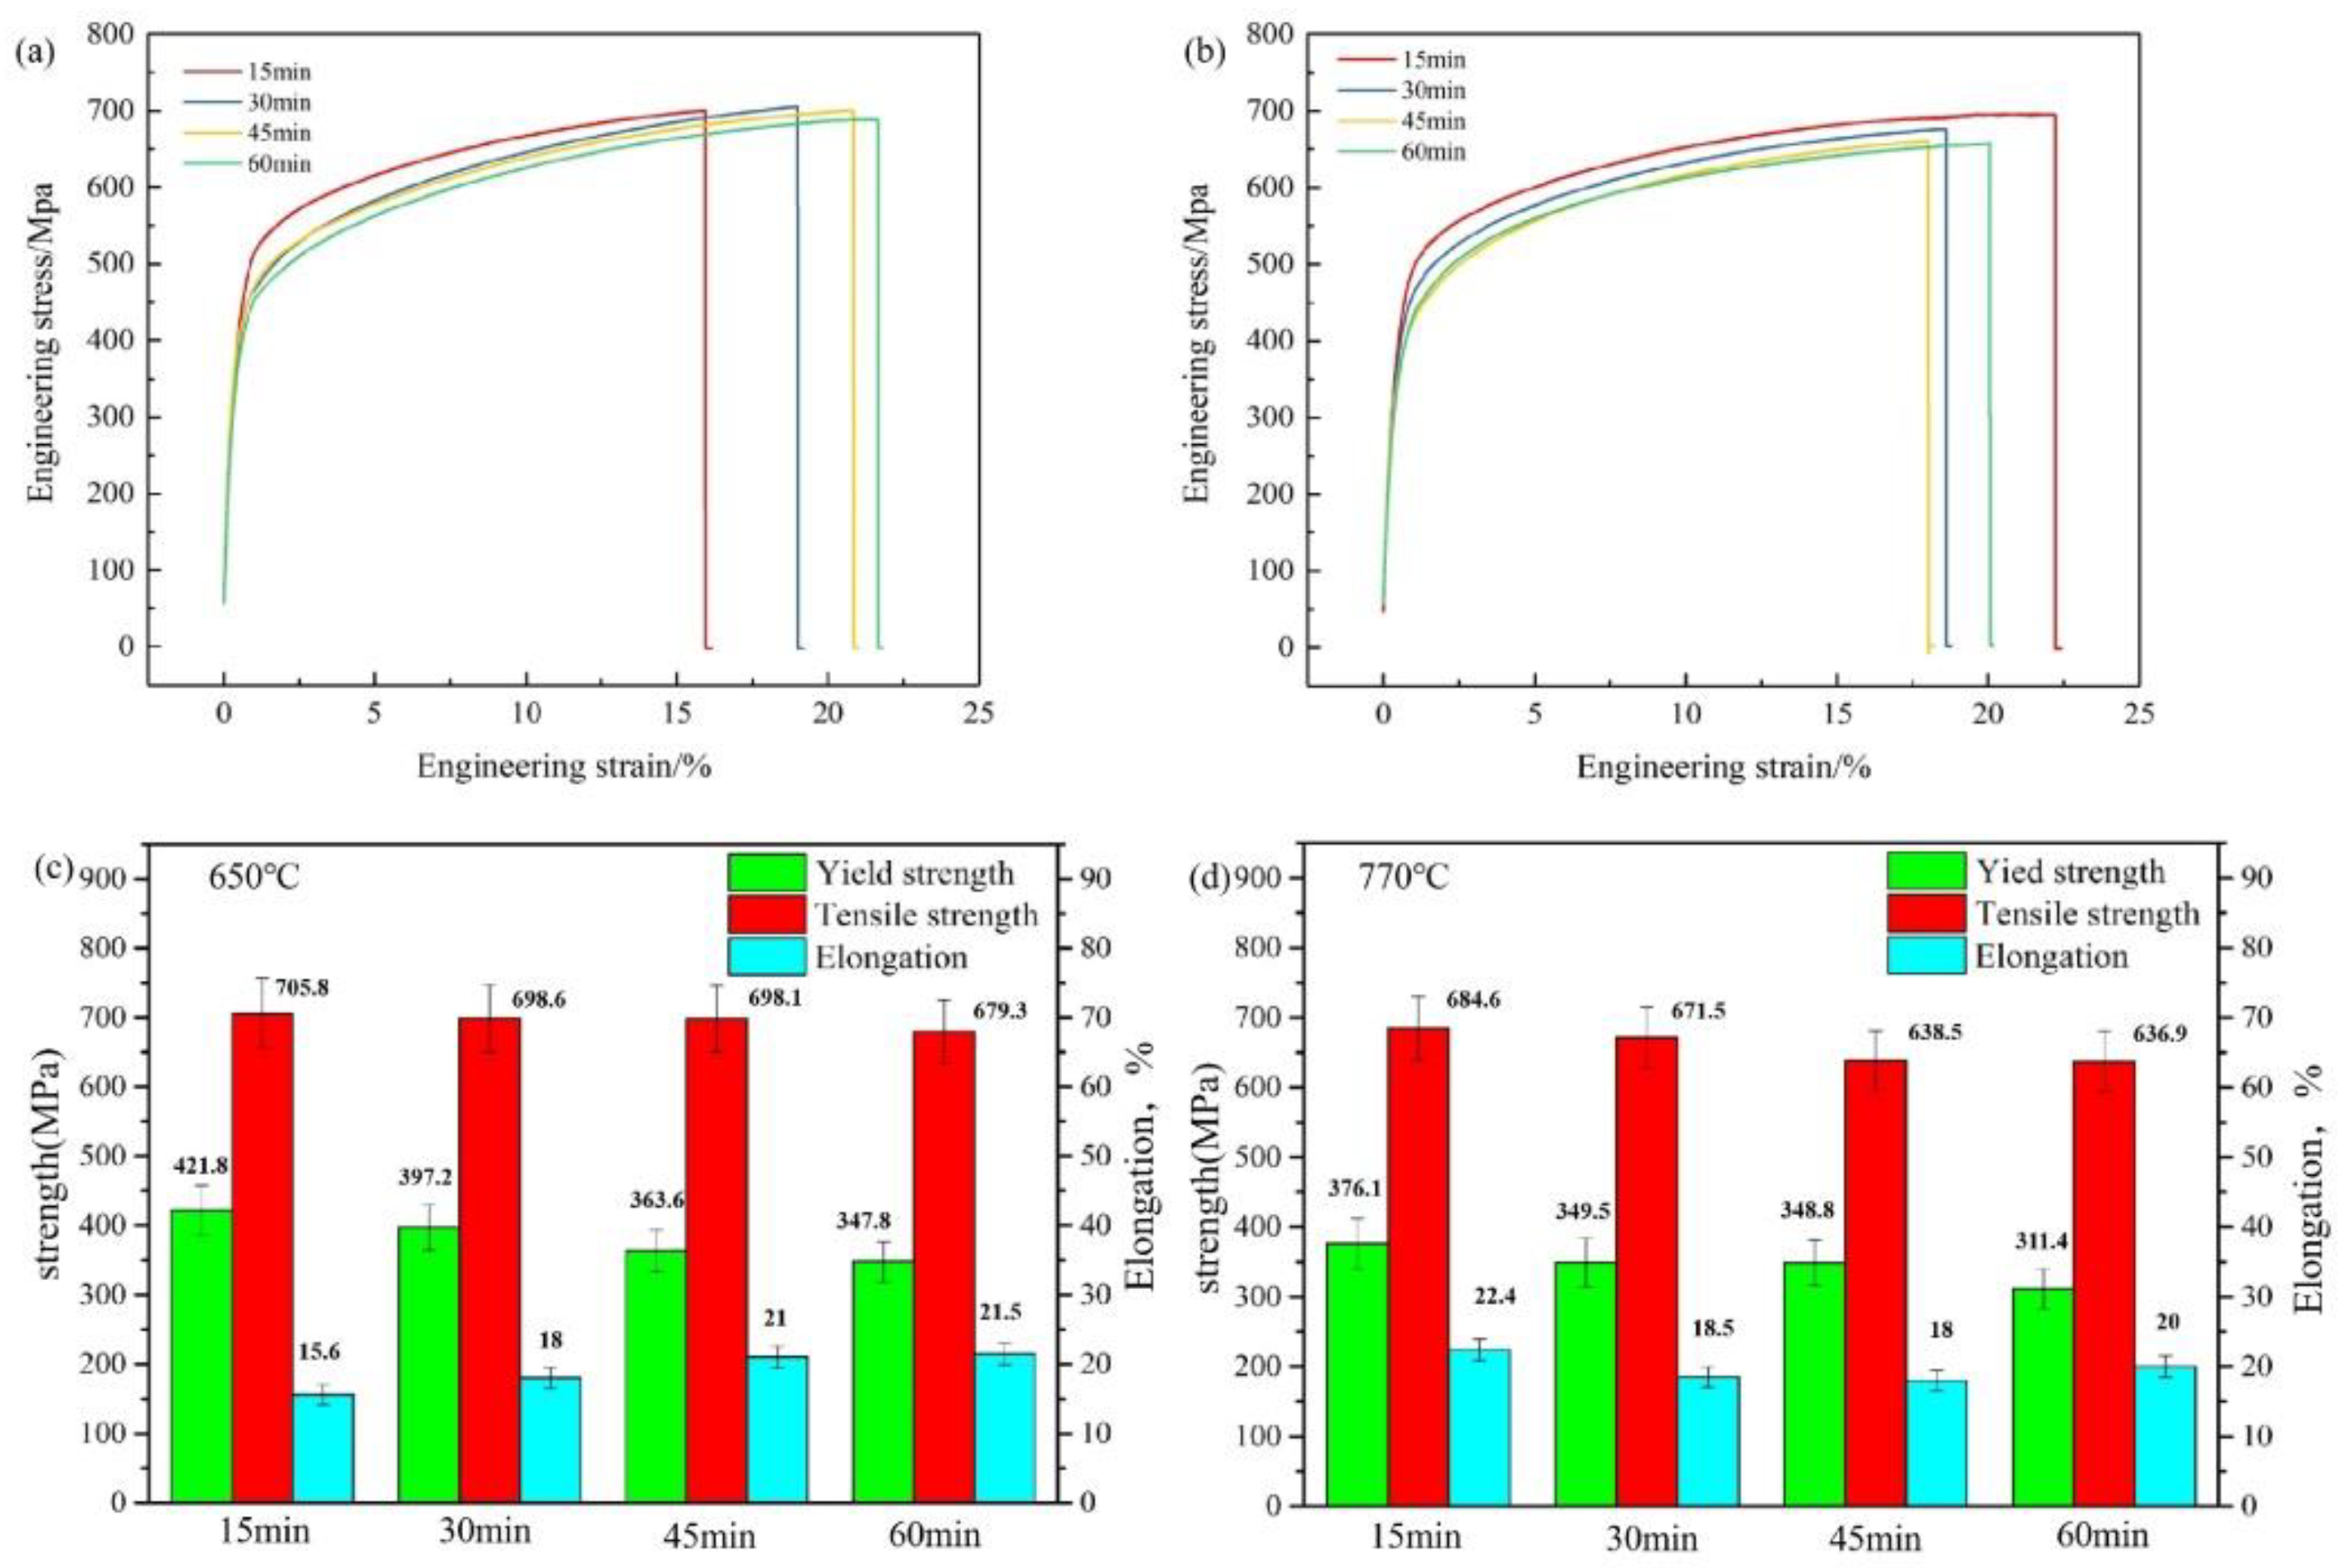
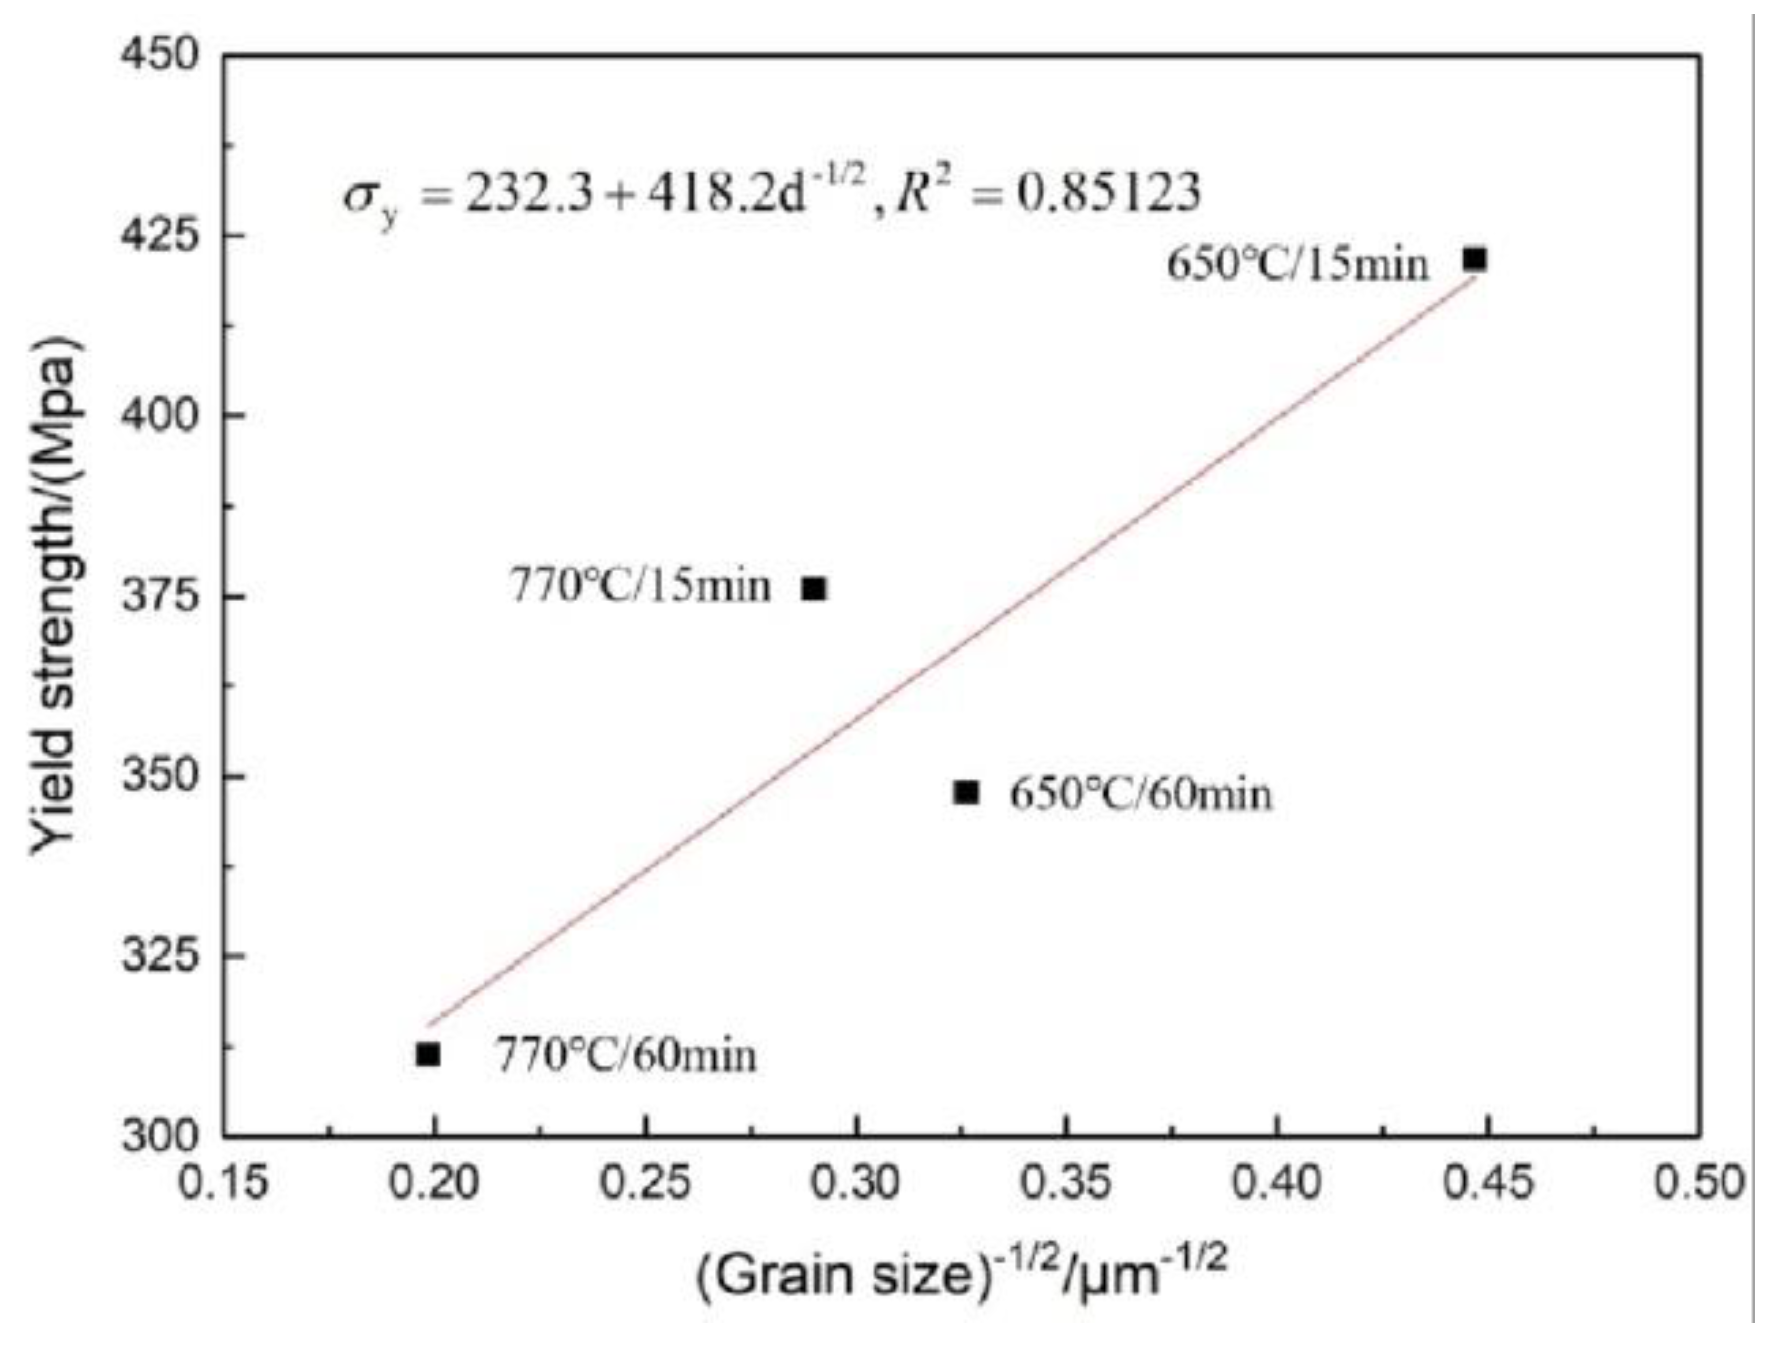
In Figure 13, the yield strength decreases gradually with the increase of annealing time at 650 °C in Figure 13a,c, and a similar pattern can be found in Figure 13b,d. The 650 °C/15 min sample obtained the highest yield strength, while the 770 °C/60 min sample got the lowest yield strength. Grain boundaries including twin boundaries can obstruct the motion of dislocations, which suggests that the contribution to the yield strength (σy) depends on the grain size. Therefore, the Hall-Petch equation is as followed [28]:
where d is the mean grain size, k is the Hall-Petch coefficient, and σ0 is the yield strength of the crystal. Based on the data of Table 1 and Figure 13, the least square fitting between σy and d−1/2 was made and the results were shown in Figure 14. The fitting goodness, R2, was about 0.85. The deviation of experimental results in Figure 14 could attribute to the secondary particles in Cu-2.7Be sheets. The Orowan mechanism which is also called the by-passing mechanism is usually believed to be the main strengthening mechanism when particles are hard to be deformed with the matrix. For the by-passing mechanism [21,29]:
where σp is the increase of yield strength caused by Orawan mechanism, M is proportional constant which is 3.06 for the fcc polycrystalline matrix, G is the shear modulus of Cu matrix, b is the Burgers vector, ν is the Poissons ratio, r is the mean radii of the particles and λ is the cutting distance of dislocations which can be determined by [29]:
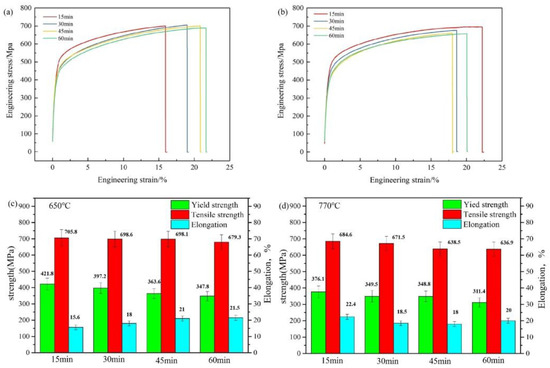
Figure 13.
Engineering tensile stress-strain curves and mechanical properties of Cu-2.7Be sheets annealed at (a), (c) 650 °C and (b), (d) 770 °C for different time.
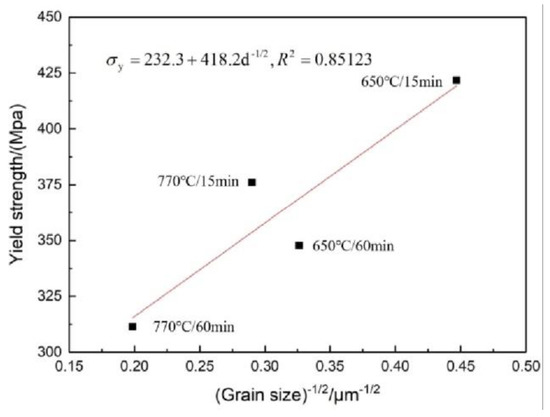
Figure 14.
Least-squares fitting results between yield strength and d−1/2.
In Equation (3), f is the volume fraction of the precipitates. Given M = 3.06, G = 5 × 10⁴ MPa, b = 0.255 nm, ν = 0.3, f = 0.0256 [21,29]. Based on the TEM observations in Figure 12, given r = 20–100 nm for β particles, the calculation results of σp is 165–43.65 MPa, which indicated that the strength contribution of secondary precipitations decreased with the increase of particle size. Thus, the experimental results can not agree with the Hall-Petch equation very well. Furthermore, the 650 °C/15 min sample obtained the highest yield strength due to the smallest particle size and average grain size, and the contribution of particle strengthening will be weakened as the increase of β particle size caused by the enhancement of annealing time.
The ductility of Cu-2.7Be sheets annealed at 650 °C increased with the increase of annealing time. However, the 770 °C/15 min sample possessed the maximum elongation after fracture and the remaining samples annealed at 770 °C were of similar ductility. Two factors could be considered: the ∑3 boundaries and the size and morphology of β phases. The vast majority of boundary friction in the annealed samples was located at the ∑3 boundaries (Figure 6). The samples annealed at 770 °C yielded more ∑3 boundaries than the samples annealed at 650 °C. This indicated that the samples annealed at 770 °C possessed better plastic potential than those annealed at 650 °C. The morphology of β in the 650 °C/15 min sample is that of an irregular polygon, which could generate stress concentration and lead to elongation reduction. With the increase of annealing time at 650 °C, quadrangle-shaped β and more ∑3 boundaries can be obtained, which could give rise to the elongation increase in the 650 °C annealing samples. The situation is different when the annealing temperature was 770 °C. The morphology of the β phases is similar (quadrangle-shaped), hence, the major distinction is the size of β phases. The β size of the 770 °C/15 min sample is the minimum size generated by the 770 °C annealing samples and is beneficial to the improvement in elongation. From the EBSD results, more ∑3 boundaries were obtained at 770 °C, these allowed further elongation improvement of the 770 °C/15 min samples than the other 650 °C annealing samples, and resulted in the optimum plasticity of the 770 °C/15 min samples.
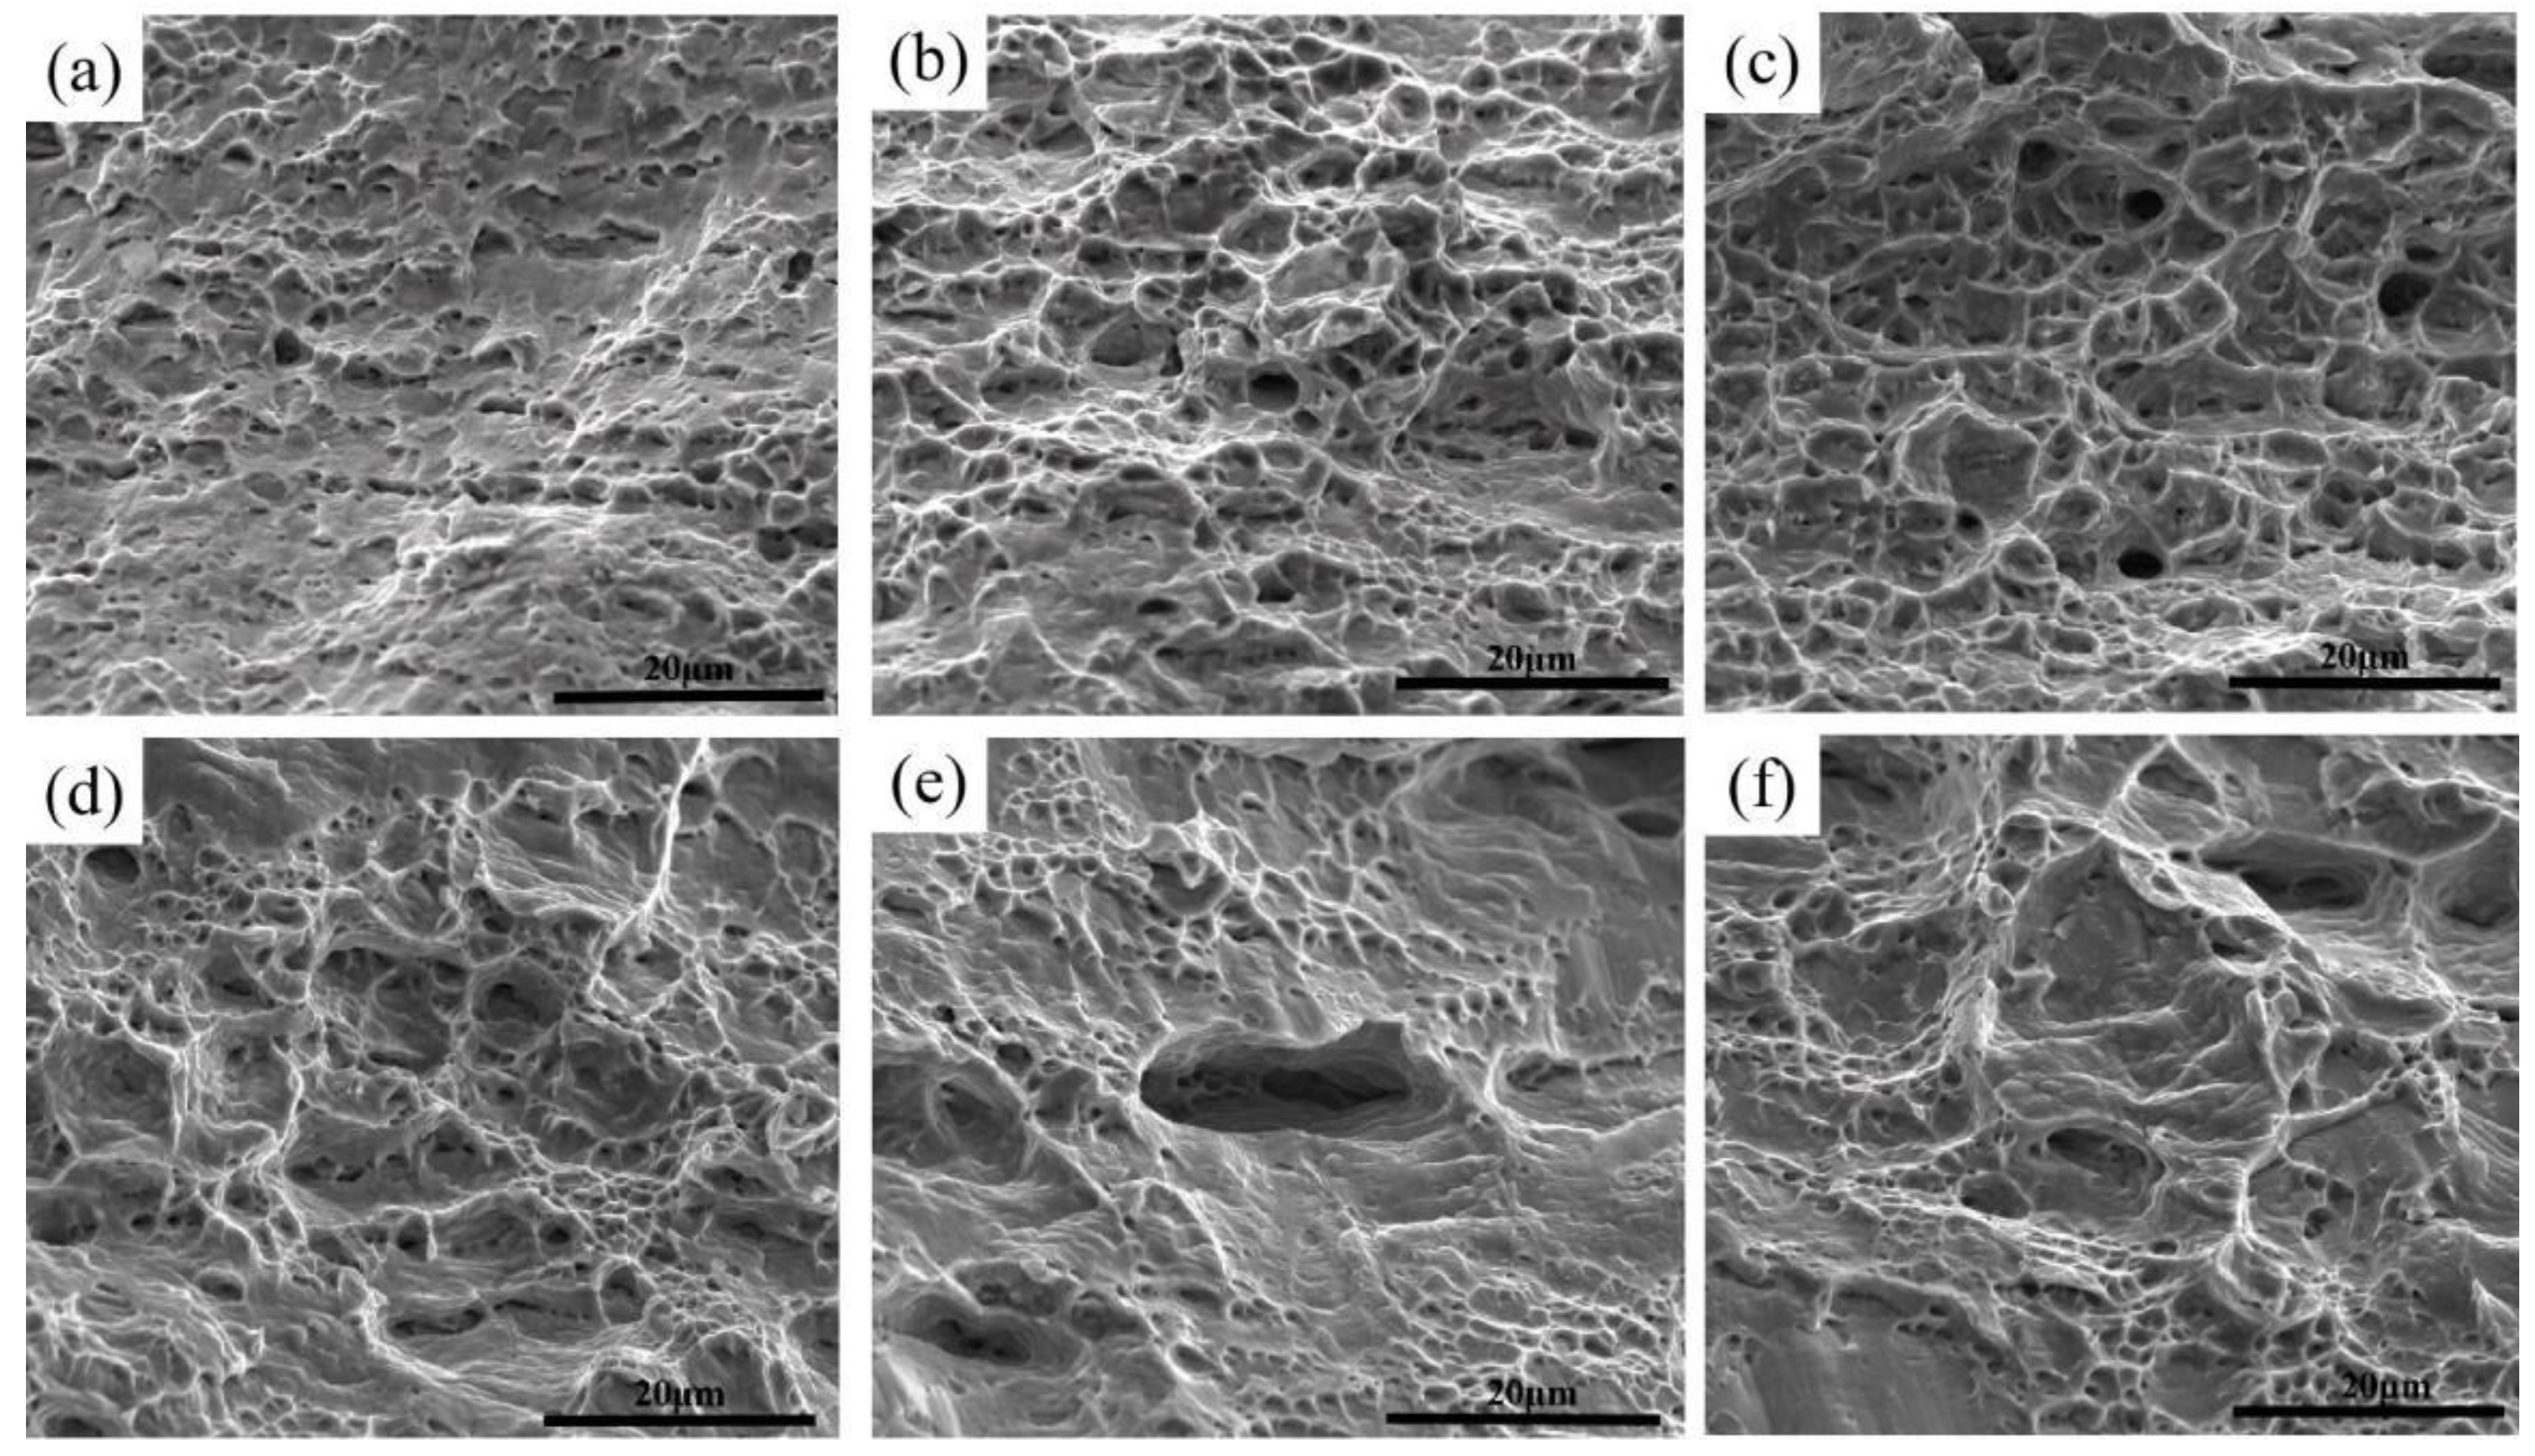
Figure 15 shows the SEM morphology of the annealing samples fracture surface. According to the mechanisms of the micro-crack initiation [30], it is highly likely that the initiation and propagation of cracks are closely related to the microstructure. The dislocation pile-up can lead to the stress concentration and the nucleation of micro-cracks at the grain boundary. Many equiaxed dimples appeared on the surface of the 650 °C/15 min samples. As the annealing time increased, deeper equiaxed dimples were observed in Figure 15b,c. It means that the formation of large size dimples is related to the brittle β particles and the larger average grain size. Irregular polygon β particles could cause shallower dimples compared with quadrangle-shaped β particles. Therefore, the elongation increased with annealing time when the annealing temperature was 650 °C. Large β particles and grain size could cause oversized deep dimples and lead to the reduction of elongation, which is shown in Figure 15e,f. Suitable β particle size and grain size can induce deep and uniform dimples and lead to better elongation, as illustrated in Figure 15d. Consequently, the 770 °C/15 min samples obtained the highest elongation.
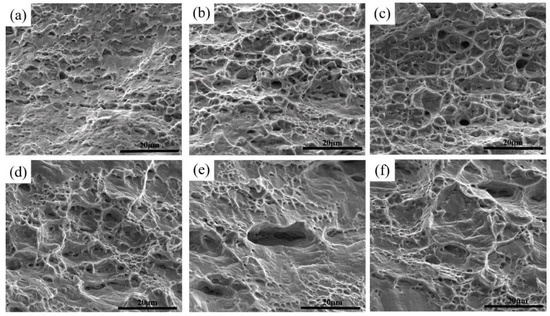
Figure 15.
SEM images of the fracture surface: (a) 650 °C/15 min; (b) 650 °C/30 min; (c) 650 °C/60 min; (d) 770 °C/15 min; (e) 770 °C/30 min; (f) 770 °C/60 min.
4. Conclusions
In summary, the grain size of annealed Cu-2.7Be sheets was noticeably increased, and the grain shape of the annealed sample tended to be equiaxed due to static recrystallization. The growth rate of grain size increased significantly, along with the increase of annealing temperature. The vast majority of boundary friction was located at the ∑3 boundaries in the annealed samples. Moreover, the friction at the ∑3 boundaries increased dramatically as the annealing temperature and time increased. The static recrystallization mechanism of Cu-2.7Be sheets was that of cSRX, and the orientation relationship between β phases and the surrounding Cu-matrix was determined to be (111)α∥(110)β and (011)α∥(001)β. The β phase has a bcc structure with a = b = c = 0.281 nm. During the heat treatment process of Cu-2.7Be sheets, lath-shaped β particles were formed primitively and then transformed into quadrangle-shaped β particles. The yield strength of Cu-2.7Be sheets declined significantly after annealing, and the 770 °C/15 min samples obtained the best elongation for its deep and uniform dimples caused by suitable β particle size and grain size.
Author Contributions
Data curation, Y.L., D.Z. and D.C.; Methodology, P.Z.; Resources, D.C.; Writing—original draft, Y.L. and Q.W.; Writing—review & editing, B.Y., D.Z. and P.Z. All authors have read and agreed to the published version of the manuscript.
Funding
This research was founded by the National Natural Science Foundation of China, grant number 51704258; the Natural science foundation of Hunan Province, China, grant number 2019JJ50587; the Science and Technology Foundation of Taicang, China, grant number TC2019JC04 and TC2019GY19.
Acknowledgments
This study was financially supported by the Natural science foundation of Hunan Province, China (Grant No. 2019JJ50587), the National Natural Science Foundation of China (Grant No. 51704258), and the Science and Technology Foundation of Taicang, China (Grant No. TC2019JC04 and TC2019GY19).
Conflicts of Interest
The authors declare there is no conflict of interest regarding the publication of this paper.
References
- Michijima, M. Secondary electron multiplier as a detector of very feeble ion current down to 10–19 Amperes. Jpn. J. Appl. Phys. 1962, 1, 110. [Google Scholar] [CrossRef]
- Ruttenberg, F.; Haas, T. Surface composition and morphology vs secondary-electron yield of Be–Cu dynodes. J. Vac. Sci. Technol. 1975, 12, 1043–1046. [Google Scholar] [CrossRef]
- Allen, J.S. An improved electron multiplier particle counter. Rev. Sci. Instrum. 1947, 18, 739–749. [Google Scholar] [CrossRef]
- Laurenson, L.; Koch, J. The secondary electron emission characteristics of clean and contaminated copper beryllium sheet. Br. J. Appl. Phys. 1965, 16, 889. [Google Scholar] [CrossRef]
- Salser, G.E. Rejuvenation of electron multipliers used in mass spectrometers. Rev. Sci. Instrum. 1966, 37, 674–675. [Google Scholar] [CrossRef]
- Zhang, Q.; Wang, J.; Zhou, F.; Liu, W.; Wang, F. Influence of activation parameters on the thickness of MgO thin film on Ag-3Mg alloy and its secondary electron emission property. Mater. Res. Bull. 2017, 96, 35–39. [Google Scholar] [CrossRef]
- Wang, J.; Liu, W.; Ren, Z.; Yang, F.; Wang, Y. Secondary electron emission of Y2O3–Mo cermet cathode. Mater. Res. Bull. 2010, 45, 324–328. [Google Scholar] [CrossRef]
- Li, J.; Hu, W.; Hao, L.; Wu, S. Influence of the substrate temperature on the microstructure and electron-induced secondary electron emission properties of MgO/Au composite film. Mater. Res. Bull. 2018, 100, 308–312. [Google Scholar] [CrossRef]
- Shih, A.; Yater, J.; Pehrsson, P.; Butler, J.; Hor, C.; Abrams, R. Secondary electron emission from diamond surfaces. J. Appl. Phys. 1997, 82, 1860–1867. [Google Scholar] [CrossRef]
- Wang, B.; Wu, E.; Wang, Y.; Xiong, L.; Liu, S. Activation treatment effects on characteristics of BeO layer and secondary electron emission properties of an activated Cu–Be alloy. Appl. Surf. Sci. 2015, 355, 19–25. [Google Scholar] [CrossRef]
- Yoshida, K.; Ishizaka, T.; Kuroda, M.; Ikawa, S. The effects of texture on formability of aluminum alloy sheets. Acta Mater. 2007, 55, 4499–4506. [Google Scholar] [CrossRef]
- Zhang, H.; Huang, G.; Wang, L.; Li, J. Improved formability of Mg–3Al–1Zn alloy by pre-stretching and annealing. Scr. Mater. 2012, 67, 495–498. [Google Scholar] [CrossRef]
- Huang, X.; Chino, Y.; Mabuchi, M.; Matsuda, M. Influences of grain size on mechanical properties and cold formability of Mg–3Al–1Zn alloy sheets with similar weak initial textures. Mater. Sci. Eng. A 2014, 611, 152–161. [Google Scholar] [CrossRef]
- Engler, O.; Hirsch, J. Texture control by thermomechanical processing of AA6xxx Al–Mg–Si sheet alloys for automotive applications—A review. Mater. Sci. Eng. A 2002, 336, 249–262. [Google Scholar] [CrossRef]
- Wang, R.; Shen, X.; Liu, Y.; Li, J. Effects of Ga Addition on the Formability of Main Phase and Microstructure of Hot-Deformed Ce-Fe-B Magnets. IEEE Trans. Magn. 2016, 52, 1–6. [Google Scholar] [CrossRef]
- Narayanasamy, R.; Ravindran, R.; Manonmani, K.; Satheesh, J. A crystallographic texture perspective formability investigation of aluminium 5052 alloy sheets at various annealing temperatures. Mater. Des. 2009, 30, 1804–1817. [Google Scholar] [CrossRef]
- Ota, S.; Muramatsu, N.; Sengoku, K.; Watanabe, C.; Monzen, R. Mechanical and electrical properties and microstructure in Cu-Ni-Bc alloys.Mechanical and electrical properties and microstructure in Cu-Ni-Bc alloys. J. Soc. Mater. Sci. 2007, 54, 531–536. [Google Scholar] [CrossRef]
- Yagmur, L. Effect of microstructure on internal friction and Young’s modulus of aged Cu–Be alloy. Mater. Sci. Eng. A 2009, 523, 65–69. [Google Scholar] [CrossRef]
- Monzen, R.; Shimada, Y.; Watanabe, C. Mechanical properties of Cu-Ni-Be system alloys. In Journal of Physics: Conference Series; IOP Publishing: Bristol, UK, 2010. [Google Scholar]
- Yagmur, L.; Duygulu, O.; Aydemir, B. Investigation of metastable γ′ precipitate using HRTEM in aged Cu–Be alloy. Mater. Sci. Eng. A 2011, 528, 4147–4151. [Google Scholar] [CrossRef]
- Guoliang, X.; Qiangsong, W.; Xujun, M.; Baiqing, X.; Lijun, P. The precipitation behavior and strengthening of a Cu–2.0 wt% Be alloy. Mater. Sci. Eng. A 2012, 558, 326–330. [Google Scholar] [CrossRef]
- Zhu, D.B.; Liu, C.; Liu, Y.D.; Han, T.; Gao, Y.H.; Jiang, S.H. Evolution of the texture, mechanical properties, and microstructure of Cu-2.7Be alloys during hot cross-rolling. Appl. Phys. A 2015, 120, 1605–1613. [Google Scholar] [CrossRef]
- Guan, Y.; Liu, C.Y.; Gao, Y.H.; Zhu, D.B.; Han, T.; Jiang, S.N. Effect of annealing on microstructure and tensile properties of cold-rolled Cu-2.7Be sheets. Mater. Charact. 2017, 129, 156–162. [Google Scholar] [CrossRef]
- Tekkaya, A.E.; Lange, K. An Improved Relationship between Vickers Hardness and Yield Stress for Cold Formed Materials and its Experimental Verification. CIRP Ann. 2000, 49, 205–208. [Google Scholar] [CrossRef]
- Schneider, J.-M.; Bigerelle, M.; Iost, A. Statistical analysis of the Vickers hardness. Mater. Sci. Eng. A 1999, 262, 256–263. [Google Scholar] [CrossRef]
- Humphreys, F.J.; Hatherly, M. Recrystallization and Related Annealing Phenomena, 2nd ed.; Elsevier: Amsterdam, The Netherlands, 2004. [Google Scholar]
- Takayama, A.; Yang, X.; Miura, H.; Sakai, T. Continuous static recrystallization in ultrafine-grained copper processed by multi-directional forging. Mater. Sci. Eng. A 2008, 478, 221–228. [Google Scholar] [CrossRef]
- Ghassemali, E.; MRiestra, M.; Bogdanoff, T.; Kumar, B.S.; Seifeddine, S. Hall-Petch equation in a hypoeutectic Al-Si cast alloy: Grain size vs. secondary dendrite arm spacing. Procedia Eng. 2017, 207, 19–24. [Google Scholar] [CrossRef]
- Huang, X.; Xie, G.; Liu, X.; Fu, H.; Shao, L.; Hao, Z. The influence of precipitation transformation on Young’s modulus and strengthening mechanism of a Cu–Be binary alloy. Mater. Sci. Eng. A 2020, 772, 138592. [Google Scholar] [CrossRef]
- Lang, Y.; Zhou, G.; Hou, L.; Zhang, J.; Zhuang, L. Significantly enhanced the ductility of the fine-grained Al–Zn–Mg–Cu alloy by strain-induced precipitation. Mater. Des. 2015, 88, 625–631. [Google Scholar] [CrossRef]
© 2020 by the authors. Licensee MDPI, Basel, Switzerland. This article is an open access article distributed under the terms and conditions of the Creative Commons Attribution (CC BY) license (http://creativecommons.org/licenses/by/4.0/).


