Article

Beneficial Effects of Vanadium Additions on the Corrosion of Ti6AlxV Alloys in Chloride Solutions

by
El-Sayed M. Sherif
1,2,*,
Hany S. Abdo
1,3 and
Nabeel H. Alharthi
1,4
1
Center of Excellence for Research in Engineering Materials (CEREM), King Saud University, P.O. Box 800, Al-Riyadh 11421, Saudi Arabia
2
Electrochemistry and Corrosion Laboratory, Department of Physical Chemistry, National Research Centre, El-Behoth St. 33, Dokki, 12622 Cairo, Egypt
3
Mechanical Design and Materials Department, Faculty of Energy Engineering, Aswan University, Aswan 81521, Egypt
4
Mechanical Engineering Department, King Saud University, P.O. Box 800, Al-Riyadh 11421, Saudi Arabia
*
Author to whom correspondence should be addressed.
Metals 2020, 10(2), 264; https://doi.org/10.3390/met10020264
Submission received: 7 January 2020 / Revised: 11 February 2020 / Accepted: 14 February 2020 / Published: 18 February 2020

Abstract

:
The beneficial effects of V addition on the corrosion of a newly manufactured Ti6AlxV (x = 2 wt %, 4 wt %, 6 wt %, and 8 wt %) alloys after various exposure periods in 3.5% NaCl solutions were reported. The Ti6AlxV were produced from their raw powders using mechanical alloying. Several electrochemical techniques such as electrochemical impedance spectroscopy, cyclic potentiodynamic polarization, and potentiodynamic current versus time at 300 mV experiments were conducted. The surface morphology and the elemental analysis were performed using scanning electron microscopy and energy dispersive X-ray analyses. All results were consistent with each other revealing that the increase of V content increases the resistance of the alloys against corrosion. The increase of corrosion resistance was achieved by the role of V in decreasing the rate of corrosion as a result of the formation of oxide films on the surface of the alloys. This effect was found to increase with prolonging the immersion time of the Ti6AlxV alloys in the test medium from 1 h to 24 h and further to 48 h.

Graphical Abstract

1. Introduction

Ti-base alloys have outstanding properties that enable them to be used in numerous applications [1,2,3,4]. These alloys have proven to be employed in the marine, military, offshore, medical, and many other applications [5,6,7,8,9]. The use of Ti-base alloys in various fields comes from its super biocompatibility, excellent mechanical properties, and great corrosion resistance in many aggressive environments [10,11,12,13,14]. The use of titanium alloys in offshore structures and marine applications results from it low density, superior strength, and extremely high resistance to corrosion [2,3,15,16,17,18,19,20]. Another important usage of titanium alloys is as an outstanding and strong material in the field of biomedical implantations [8,9,10,11,12,13,14,15,21].
Numerous titanium base alloys have been successfully employed in the area of biomedical applications [9,11,12,13,14,15,16,17,22,23]. A great number of these Ti-base alloys are being used as artificial joints of hips and knees, screws for fracture fixation, and bone plates to replace flawed parts in human bodies. The selection of elements, which must be nontoxic metallic materials, to be alloyed with Ti defines the application of the produced alloy. Amongst Ti alloys, Ti6Al4V alloy has proven to show great strength via its excellent mechanical and physical properties accompanied with high corrosion resistance. Therefore, this alloy has been selected to be the most employed alloy in many applications, particularly in implantation systems [24,25,26]. Other titanium alloys like Ti6Al7Nb and Ti13Cu4.5Ni, in addition to the Ti6Al4V alloy, have been selected as the only choice for the use in orthopedic implants [27]. It has also been reported [28,29,30,31,32,33,34] that resistance versus corrosion in-vitro to form a stable oxide film in harsh media is the main reason for these alloys to be popular and applicable in the field of biomedical applications.
In this work, we aimed to produce a series of Ti-base alloys, namely Ti6Al2V, Ti6Al4V, Ti6Al6V, and Ti6Al8V alloys, from its pure powders, and reported their corrosion after immersion in 3.5% NaCl solution for different periods of time, namely 1 h, 24 h, and 48 h. The effect of increasing V content within the fabricated alloys on their corrosion in the test solution was reported using various electrochemical techniques like polarization, electrochemical impedance spectroscopy, and potentiostatic current–time at 300 mV (Ag/AgCl). Other surface analysis methods, including scanning electron microscopy (SEM) images and energy dispersive X-ray (EDX) spectra, were performed to ensure the compositions, the surface morphology, and expected corrosion products that might be formed after corrosion due to the reaction between the surfaces of the alloys and the chloride test solution.

2. Experimental Details

2.1. The Fabrication of the Alloys

The pure powders of Ti, Al, and V (high purity ~99.9%) were obtained from Sigma-Aldrich, Glasgow, UK. The alloys 92Ti6Al2V, 90Ti6Al4V, 88Ti6Al6V, and 86Ti6Al8V (all in wt %) were manufactured by placing the required compositions of the powders of Ti, Al, and V in addition to some steel balls (5:1 ball-to-powder ratio) in 80 mL capacity steel jars. The jars were placed inside a desktop 220 V high energy vibratory ball mill, which was obtained from Across International Co. A speed of 2000 rpm was employed for 30 min as a milling time to give the mixture of powders a homogenous distribution. The powders were sintered in graphite dies that had a dimension of 2 cm length and 1 cm diameter. The sintering process was performed via placing the die, which had the mixed powders inside an induction heat sintering high frequency furnace. A temperature of 1200 °C was applied for 5 min for sintering with a pressure of 40 MPa. The sintered alloys were finally cooled down in the furnace to be safely used for the electrochemical and spectroscopic investigations. NaCl salt with 99.95% purity was purchased from Sigma-Aldrich, Glasgow, UK.

2.2. Electrochemical and Surface Characterization Techniques

For electrochemical measurements, a three electrode electrochemical cell accommodating 0.25 L solution was used. In this cell, the Ti6AlxV alloy, an Ag/AgCl, and a Pt sheet were used as the working reference and the counter electrodes, respectively. The Ti6AlxV alloys had an area of 0.785 cm2 and were prepared and employed in corrosion measurements as previously described [35,36]. An Autolab potentiostat (PGSTAT302N, Metrohm, Amsterdam, The Netherlands) was employed for measuring all electrochemical experiments. The cyclic potentiodynamic polarization (CPP) experiments were collected by scanning the potential between −800 mV and +800 mV, and the scanning rate was 1.66 mV/s. The electrochemical impedance spectroscopy (EIS) data were obtained from the value of the open-circuit potential (EOCP), and the range of frequency was between 100,000 Hz and 0.1 Hz. The EIS experiments were carried out by applying a ±5 mV amplitude sinusoidal wave perturbation at the corrosion potential (ECorr). The chronoamperometric current–time curves were recorded after immersing the titanium alloys in the NaCl solutions for 48 h before applying an amount of 500 mV for 40 min to measure the change of current with time. The SEM images along with the EDX profiles were acquired by the use of a JEOL SEM/EDX (Tokyo, Japan), which was working at 15 kV [35,36]. For ensuring the reproducibility of our measurements, each electrochemical experiment was performed in triplicate and was carried out on a new portion of the chloride solution at room temperature (25 ± 2 °C) and a new polished electrode surface.

3. Results and Discussion

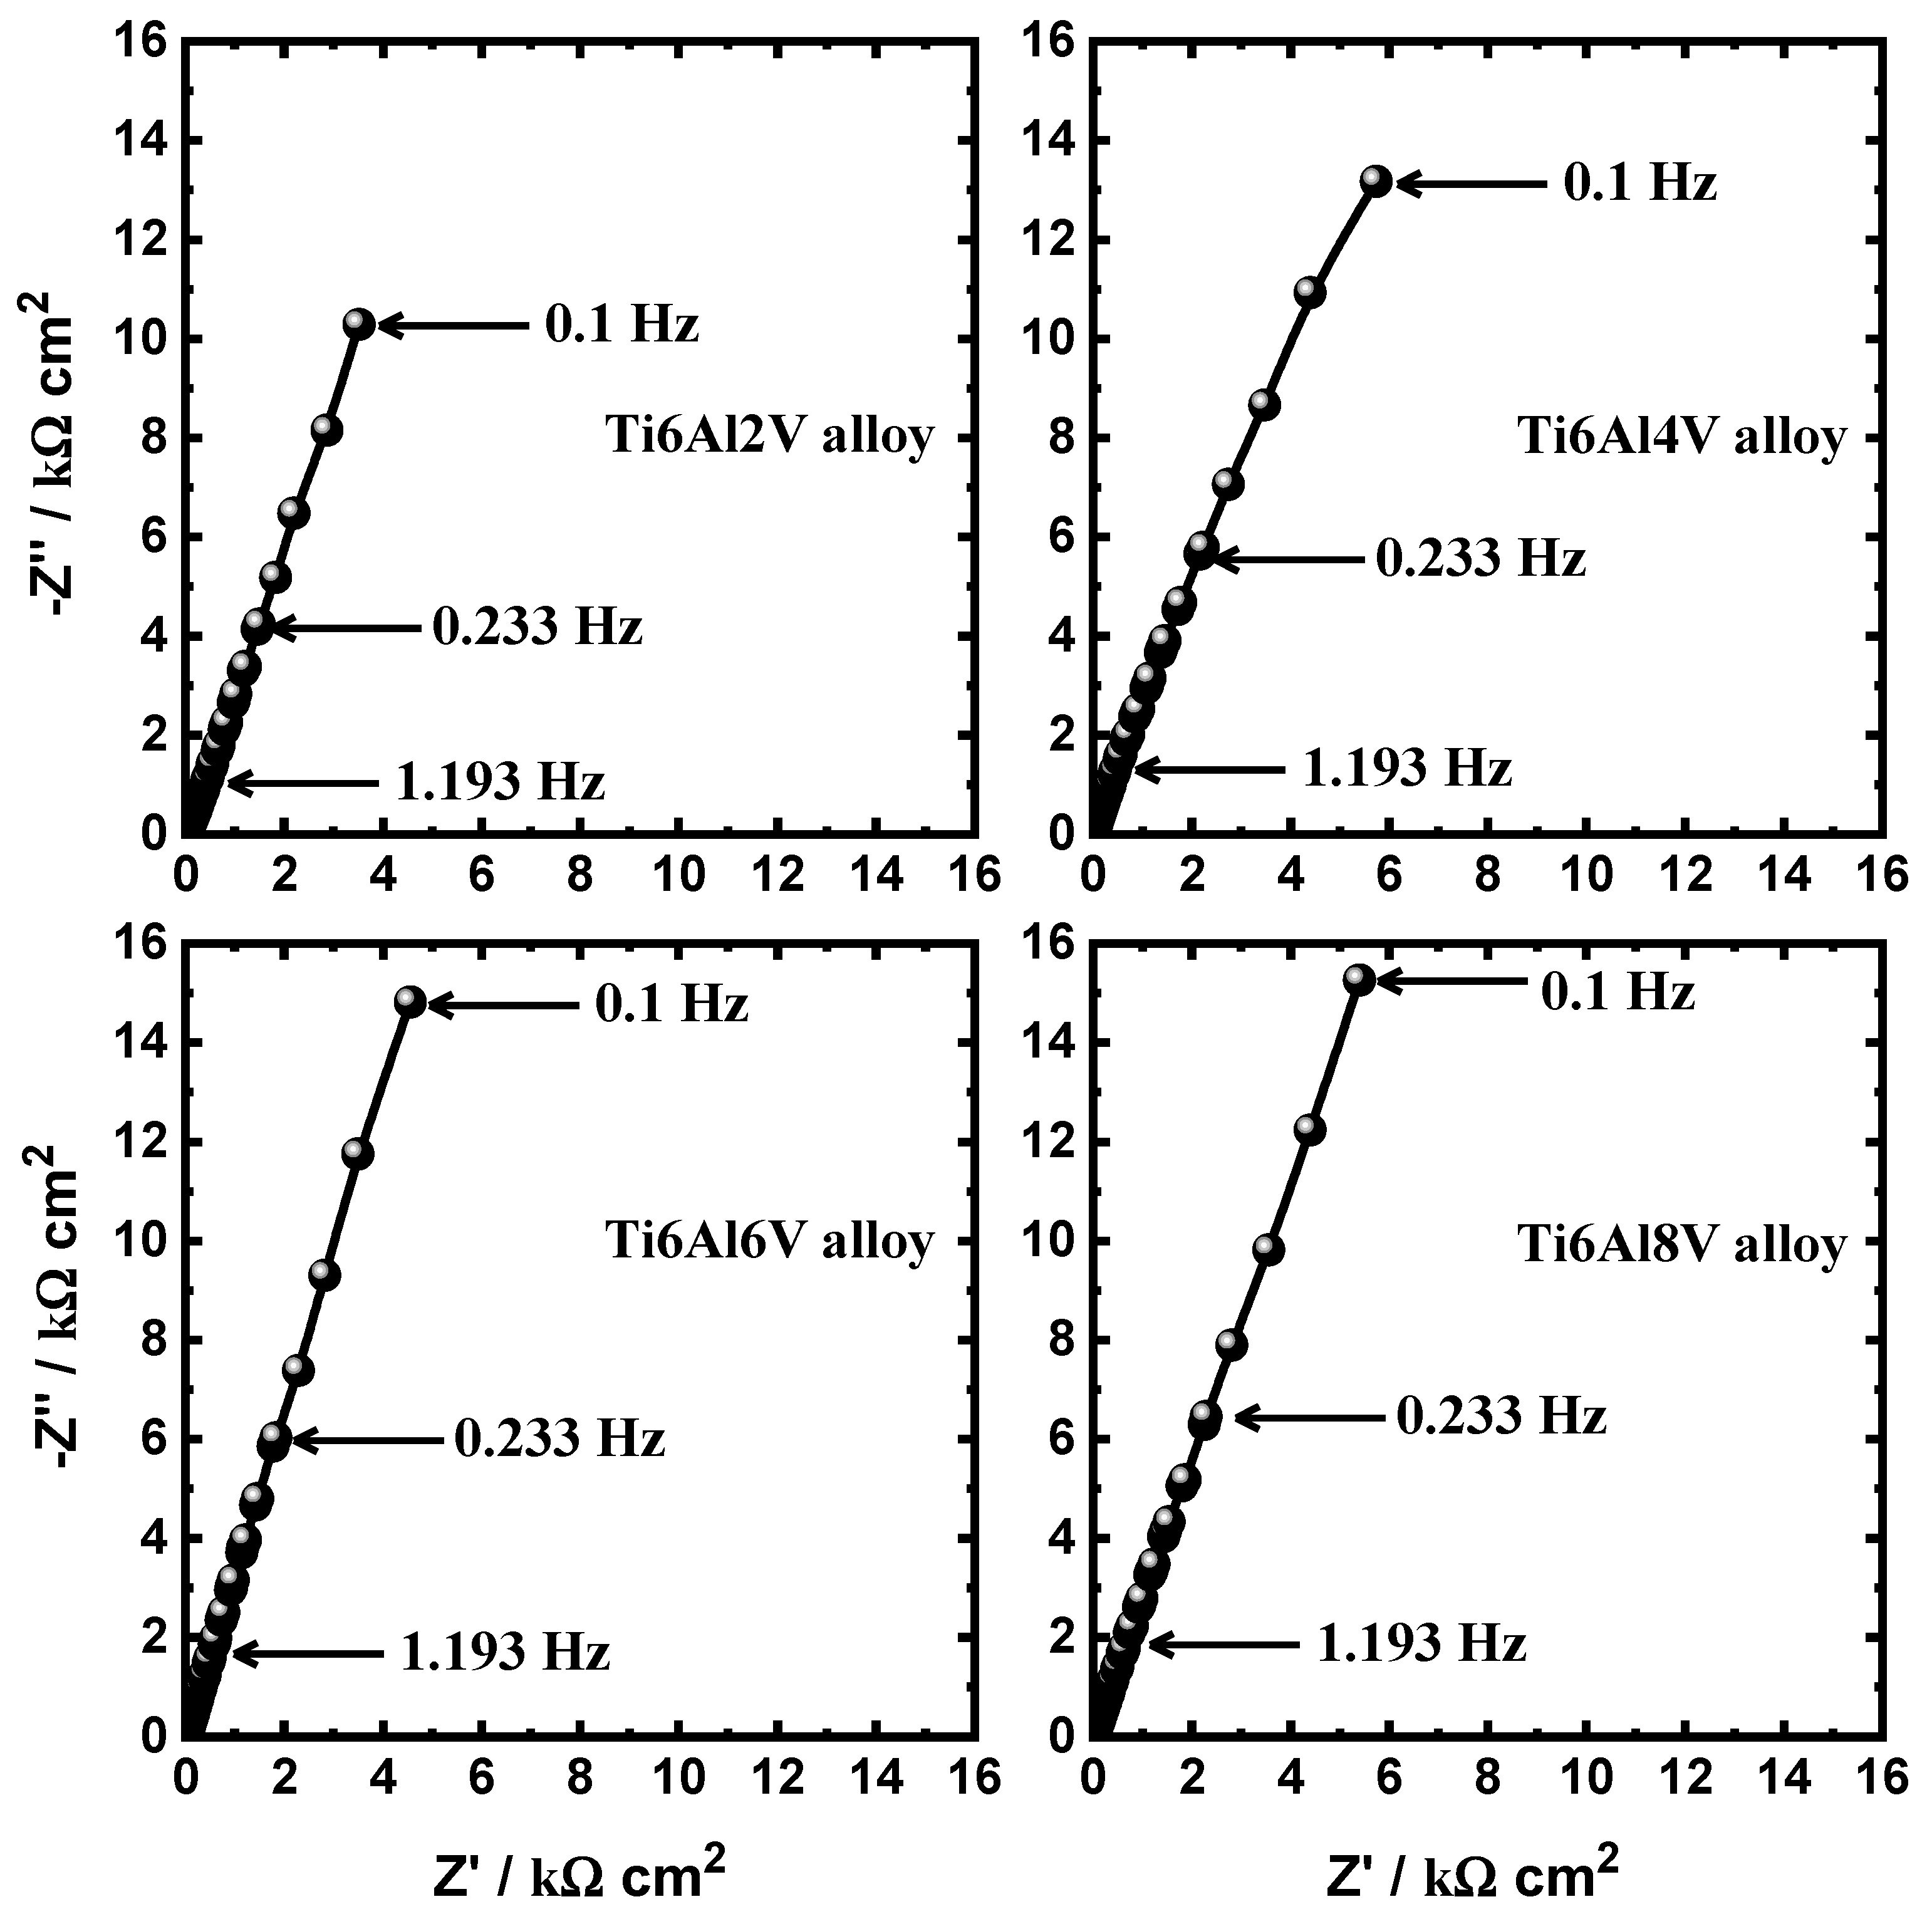
3.1. EIS Measurements

EIS measurements have been greatly used to explain the corrosion and corrosion protection phenomena [36]. Figure 1 shows the Nyquist plots collected for Ti6Al2V, Ti6Al4V, Ti6Al6V, and Ti6Al8V alloys after being immersed for 1 h in the 3.5% NaCl solutions. EIS spectra were performed also after longer periods of exposure, i.e., 24 h and 48 h, in the same solutions for these alloys, and the plots can be seen in Figure 2 and Figure 3, respectively. All EIS data were fitted, and the equivalent circuit is depicted in Figure 4. The impedance elements here were defined as the solution resistance (RS), the constant phase elements Q (YQ, CPEs), a first polarization resistance (RP1), a double layer capacitor (Cdl), and a second polarization resistance (RP2). The values of the elements of the circuit were collected and tabulated, as seen in Table 1.
The Nyquist spectra of Figure 1, which were obtained after 1 h exposure in 3.5% NaCl solutions for the different alloys, depicted the same behavior with which the values of Z′ and Z″ increased linearly. The only difference between these spectra was that the increase of V content led to the increase of both Z′ and Z″ values. In accordance with the impedance parameters recorded in Table 1, the increase of V content was proven to increase the corrosion resistance of the alloys, where the values of RS, RP1, and RP2 increased with the increase in the contents of V within the Ti alloys. According to the values of polarization resistances listed in Table 2, the increase of resistance was directly proportional to the values of RP1 and RP2 (total RP = RP1 + RP2). The presence of different time constants included in the equivalent circuit indicated that the formed films on the surface of the alloys were associated with a complex structure that consists of two layers, one is inner and the other is outer [37,38]. These two layers result from the dominant impedance at the high frequency region for the inner layer, while the impedance at the low frequency region is dominated by the outer layer, which is porous [37,38].
The value of n that accompanied the constant phase element, Q, was between 0.7 and 0.8, which means that Q represented a double layer capacitor with porosities. In addition to this, the presence of a Cdl itself confirmed the ability of V and the increase of its percentage in increasing the passivity of the different alloys in 3.5% NaCl aggressive media. Diamanti et al. investigated in their study that reporting the values of Q and Cdl tells much about the possible deviations from ideality in the capacitive response systems. According to Vera et al. [38], Zhang et al. [39], and Orazem and Tribollet [40], the admittance, impedance of a CPE, as well as the value of Q may be expressed via the following relations:
YCPE = −Y0(jω)n
ZCPE = −(1/Y0)(jω)n
ZCPE = (Q(2πfi)n)−1
The symbols found in these equations can be defined as follows: the modulus is “Y0”; the angular frequency is “ω”; the phase is “n”. Because the values of n cannot decrease further than zero and cannot be higher than one, it can be expressed as follows: 0 ≤ n ≤ 1. When n = 1, Q behaves as an ideal capacitor, and when n is 1 > n > 0.5, Q still behaves like a capacitor with some pores. If n value is around 0.5, the system is behaving like a Warburg (W) and usually indicates the passivation of the materials under investigation. If the value of n < 0.5, it is a conductance and is related to a current that is non-uniform and caused by the inhomogeneities of the films or surface roughness distribution [38].
The EIS data obtained for the different Ti-base alloys after prolonging the exposure time to 24 h in the NaCl medium are presented in Figure 2. It is seen from these Nyquist plots that the obtained spectra had higher real and imaginary resistances, namely Z′ and Z″ values for all alloys, compared to the values that are shown in Figure 1 for the alloys after 1 h exposure to the same NaCl solutions. This indicates that prolonging the time to 24 h increased the resistance to corrosion for all alloys, whether the content of V was 2% or even 8%. The values of parameters of Table 1 proved also that all resistances (RS, RP1, and RP2) gained higher values with increasing the immersion time to 24 h compared to their values that were recorded after only 1 h immersion. Further expanding the exposure periods of time to 48 h yielded higher Z′ and Z″, where the EIS spectra showed the highest values on the Nyquist plots. This reflects on the obtained values of all resistances (RS, RP1, and RP2), where it showed the highest values compared to their values that were obtained after shorter times, namely 24 h and 1 h. Prolonging the time of exposure was also reflected in the values of Q (YQ, n) and Cdl, where their values decreased with time, as seen in Table 1.
From the EIS data, it could be concluded that if V content increases in the Ti6AlV, alloys greatly increase their corrosion resistances. Additionally, expanding the time of immersion from 1 h to 24 h and even longer to 48 h considerably enhances the corrosion resistance via decreasing its general corrosion. The decrease of corrosion of the fabricated alloys with time came from the formation of oxide layers, which thickened with time and decreased the contact of the surfaces of the alloys with the surrounding environments, i.e., 3.5% NaCl solutions. The corrosion resistance decreased with the concentration of V as per the following order: Ti6Al8V > Ti6Al6V > Ti6Al4V > Ti6Al2V. The same trend was also confirmed for the alloys with prolonging of the time of immersion from 1 h to 48 h.

3.2. Cyclic Potentiodynamic Polarization (CPP) Data

The curves obtained from the CPP measurements for the TiAlV alloys after their immersions for 1 h in the chloride (3.5% NaCl) solutions are presented in Figure 5. The CPP experiments were also carried out after 24 h and 48 h, and the curves are depicted in Figure 6 and Figure 7, respectively. The values of the parameters as cathodic Tafel slope (βc), anodic Tafel slope (βa), corrosion potential (ECorr), corrosion current density (jCorr), corrosion rate (RCorr), and polarization resistance (RP), which were extracted from the plotted CPP curves, are recorded in Table 2. It is worth mentioning that the values of these parameters were collected as mentioned in our earlier research papers [35,36,41,42]. It is shown in Figure 5 that the produced current in the cathodic branch decreased with scanning the potential in the less negative direction as the result of oxygen reduction, as reported elsewhere [43].
1 2 O 2 + H 2 O + 2 e = 2 OH
It was also reported [43,44,45] that the reaction at the cathode takes place by oxygen reduction; then its adsorption as follows:
1 2 O 2 + H 2 O + 2 e = 2 OH
The anodic reaction is mostly a dissolution reaction that leads to corrosion in corrosive environments. In this work, the surface reaction of these Ti6AlV alloys at the anodic branch was probably a mixture of many reactions including the dissolution of Al (here, Al was the highest active element) and the formation of titanium oxide (TiO2), aluminum oxide (Al2O3), and vanadium oxide (V2O5). This expectation for the many reactions comes from the fact that Al and V, which are included within the alloys of Ti6AlV, share and take part in the reactions that occur on the surface of these alloys. The rise of current in the anodic branch resulted from the dissolution of Al, which may occur as follows [43,44,45,46]:
Al = Al3+ + 3eˉ
Applying the potential in the anodic branch towards the less negative values leads to a slowdown in the increase of current because of the adsorption of the hydroxide ions on the active Al surface to form Al(OH)3.
Al ( S ) + 3 OH = Al ( OH ) 3 , ads + 3 e
The Al(OH)3 rapidly transforms to Al2O3·3H2O, which is not stable and is formed as per the following equation [10]:
2 Al ( OH ) 3 , ads = Al 2 O 3 · 3 H 2 O
The passivation of these alloys is also related to the tendency of the titanium alloys to form a spontaneous titanium oxide passive film (TiO2) layer, particularly when their surfaces are in contact with air or an aerated solution that contains water [47,48].
Ti = Ti2+ + 2eˉ
2Ti(S) + 4OHˉ = 2Ti(OH)2 + 4eˉ
2Ti(S) + 2O2ˉ = 2TiO2(S) + 4eˉ
The formation of TiO2 played a main role in the passivation of the surface of the alloys, causing the slowdown in the current values, causing a passive region on the curves of the polarization measurements. One more factor that could have helped in the passivation of the current alloys was the presence of V, where increasing its percentage was proved to enhance the corrosion resistance of the tested Ti6AlV alloys. The presence of V provides more passivation via the formation of a vanadium pentoxide (V2O5) film that adds another protective layer, which helps in decreasing the aggressive nature of the chloride solution via magnifying the corrosion resistance for the alloys, particularly when the content of V is increased.
Al within the alloys played an essential role in the occurrence of pitting corrosion for these alloys due to its dissolution at more negative potential values (see Equation (6)). Here, the continuous application of the potential led to a rapid increase in the current values due to the dissolution of the formed oxide layers causing a rapid dissolution, then pitting corrosion. This was further indicated by reversing the applied potential in the reverse way that led to the creation of a large area of a hysteresis loop, particularly for the Ti6Al2V alloy, as depicted in Figure 5, Figure 6 and Figure 7. The appearance of this hysteresis loop was confirmed for all alloys but decreased with the V content. Therefore, the occurrence of pitting corrosion was also confirmed for all alloys, and its intensity increased with the time of exposure, namely 24 h and further to 48 h.
The polarization curves presented in Figure 5, Figure 6 and Figure 7 indicate that the Ti6Al2V alloy had the highest values of the corrosion parameters. These parameters were the value of cathodic current, anodic current, jCorr and RCorr, and the lowest value of RP, as also listed in Table 2. At the same conditions, the largest area of the hysteresis loop appeared for the Ti6Al2V alloy, indicating that this alloy suffered also the highest pitting corrosion. As for alloy Ti6Al4V, by increasing the content of V to 4% it was found to have a decreased value of jCorr and RCorr, as well as a smaller size of the hysteresis loop and an increased value of RP. Raising the content of V to 6% and 8% within the TiAlV alloy produced the lowest uniform and pitting corrosion. The polarization curves along with the data seen in Table 2 showed that the increase of V content enhanced the resistance to corrosion for the tested alloys by minimizing the values of the cathodic and anodic currents, jCorr and RCorr, and the area of the hysteresis loop as well as raising the values of RP. The increase of the immersion time from 1 h to 24 h, and 48 h of the tested alloys in 3.5% NaCl solutions indicated also reduction of both the uniform corrosion and the pitting attack. This was proven by the data collected from the CPP curves and Table 2, where the values of jCorr, RCorr, and the size of the hysteresis loop decreased as well as the values of RP increased. To conclude the results of the polarization measurements, it was found that the increase of the concentration of vanadium in the Ti-base alloy remarkably decreased the corrosion of these alloys and increased their corrosion resistance. This effect was found to extremely increase with the prolonging of the time of exposure from 1 h to 24 h and further to 48 h.

3.3. Potentiostatic Current–Time Measurements

In order to shed more light on the effect of V content as well as the immersion time on the uniform and pitting corrosion of the Ti6AlV alloy in 3.5% NaCl solutions, the potentiostatic current–time experiments were performed. The current–time curves obtained at 0.30 V (Ag/AgCl) for (a) Ti6Al2V, (b) Ti6Al4V, (c) Ti6Al6V, and (d) Ti6Al8V alloys after 1 h immersion in 3.5% NaCl solutions are shown in Figure 8. The same curves were also collected after prolonging the exposure periods of time to 24 h and 48 h, as shown in Figure 9 and Figure 10, respectively. The highest absolute currents were recorded for Ti6Al2V alloy as can be seen from the curves of Figure 8. The currents recorded for all Ti6AlV alloys were noticed to decrease in the first few minutes, which was due to the presence of an oxide layer resulted from the preimmersion time in the chloride solution before applying the active potential at 0.3 V. For Ti6Al2V alloy, the current increased again after its initial decreases, and some fluctuations appeared. This behavior indicates that the alloy suffered pitting corrosion as well as it corroded via uniform attack. Increasing the content of V to 4%, the alloy Ti6Al4V lowered the obtained current, which recorded a minimum compared to all other tested alloys. In addition, the current decreased with time, and there did not appear any fluctuations. This indicated that Ti6Al4V did not corrode via pitting attack. Further increasing the concentration of V to 6% and 8% slightly increased the current values as compared to the current obtained from Ti6Al4V alloy but lower than that recorded for Ti6Al2V alloy. The current–time experiments performed after 1 h thus confirmed that only Ti6Al2V alloy had pitting corrosion besides the highest dissolution via uniform corrosion.
Prolonging the time of exposure to 24 h before fixing the potential to 0.3 V (Figure 9) was found to decrease the absolute currents obtained for all Ti6AlV alloys as compared to the currents obtained after only 1 h (Figure 8). All currents were increasing in the first few minutes of immersion due to the dissolution of the film formed on the surface of the alloy before applying the anodic potential. It is seen from this figure that the increase of current for Ti6Al2V was continuous and proved that this alloy suffered sever pitting corrosion. This was also indicated by the appearance of fluctuations on the curve, and its current values were the highest. Increasing the content of V showed that the currents were almost similar without any indications of the occurrence of pitting corrosion. The currents recorded for all alloys except Ti6Al2V alloy had almost similar values, which were steady almost the whole time of the experiment. The current–time measurements after 24 h immersion in the chloride solutions proved that only Ti6Al2V alloy had pitting corrosion, and other alloys did not show any, with a slight possibility for a uniform corrosion to occur.
Further increasing the exposure period of time to 48 h, as can be seen from Figure 10, showed that the currents recorded with time were the lowest as compared to the currents obtained for the same alloys after only 1 h and 24 h exposure to the chloride solutions. Here also, Ti6Al2V alloy showed the highest absolute current amongst all other alloys, and its intensity was increasing with time until the end of the run. Ti6Al2V alloy showed also that some fluctuations in the currents were accompanied by increases in the current values. As for the other Ti alloys, Ti6Al4V, Ti6Al6V, and Ti6Al8V, the currents recorded the lowest as compared to those currents obtained after 1 h and 24 h. The behavior of the change of current with time for these alloys indicated that these alloys suffered no pitting corrosion. It is thus worth reporting that the decrease of currents with prolonging the time of exposure was due to the accumulation of corrosion product layer(s) and/or oxide film(s) as a result of the long immersion periods for the alloys in the solution before applying the constant value of the potential. The results of the potentiostatic current–time at constant potential thus confirmed the data obtained by EIS and polarization methods that the increase of V content decreased the corrosion of the investigated alloys via increasing its corrosion resistance, and this effect greatly increased with prolonging the time of exposure in the chloride test solutions.

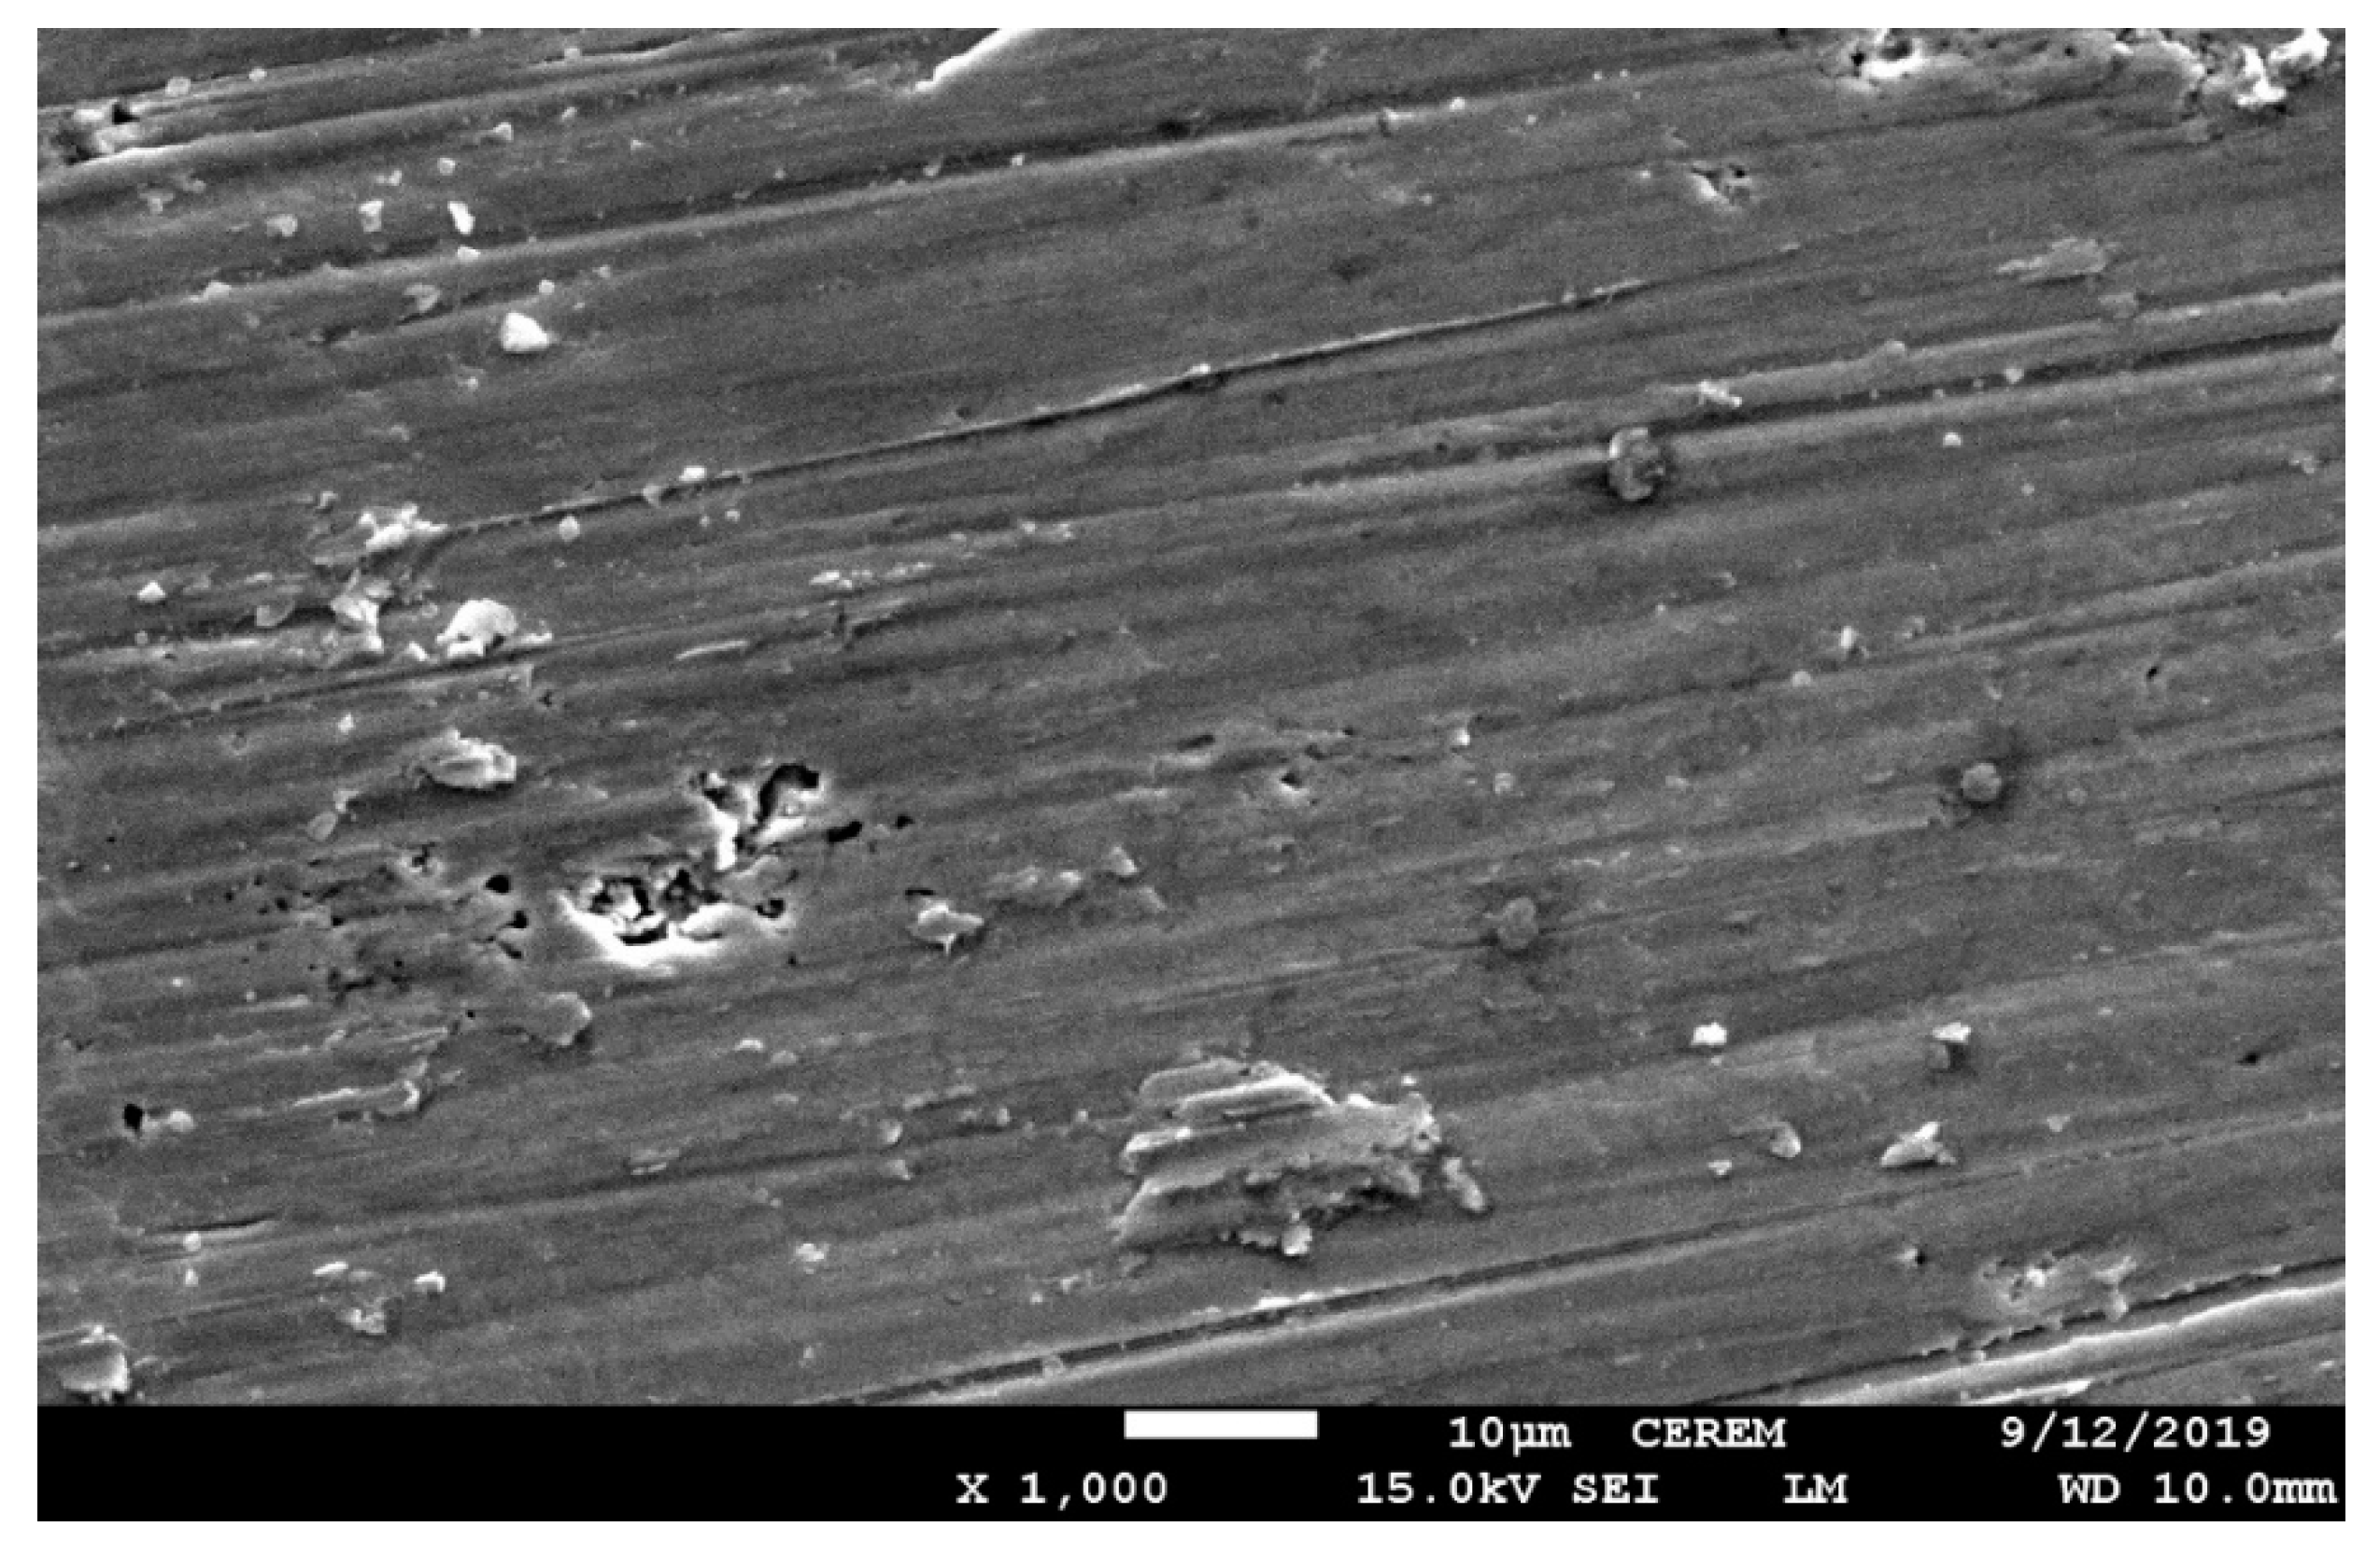
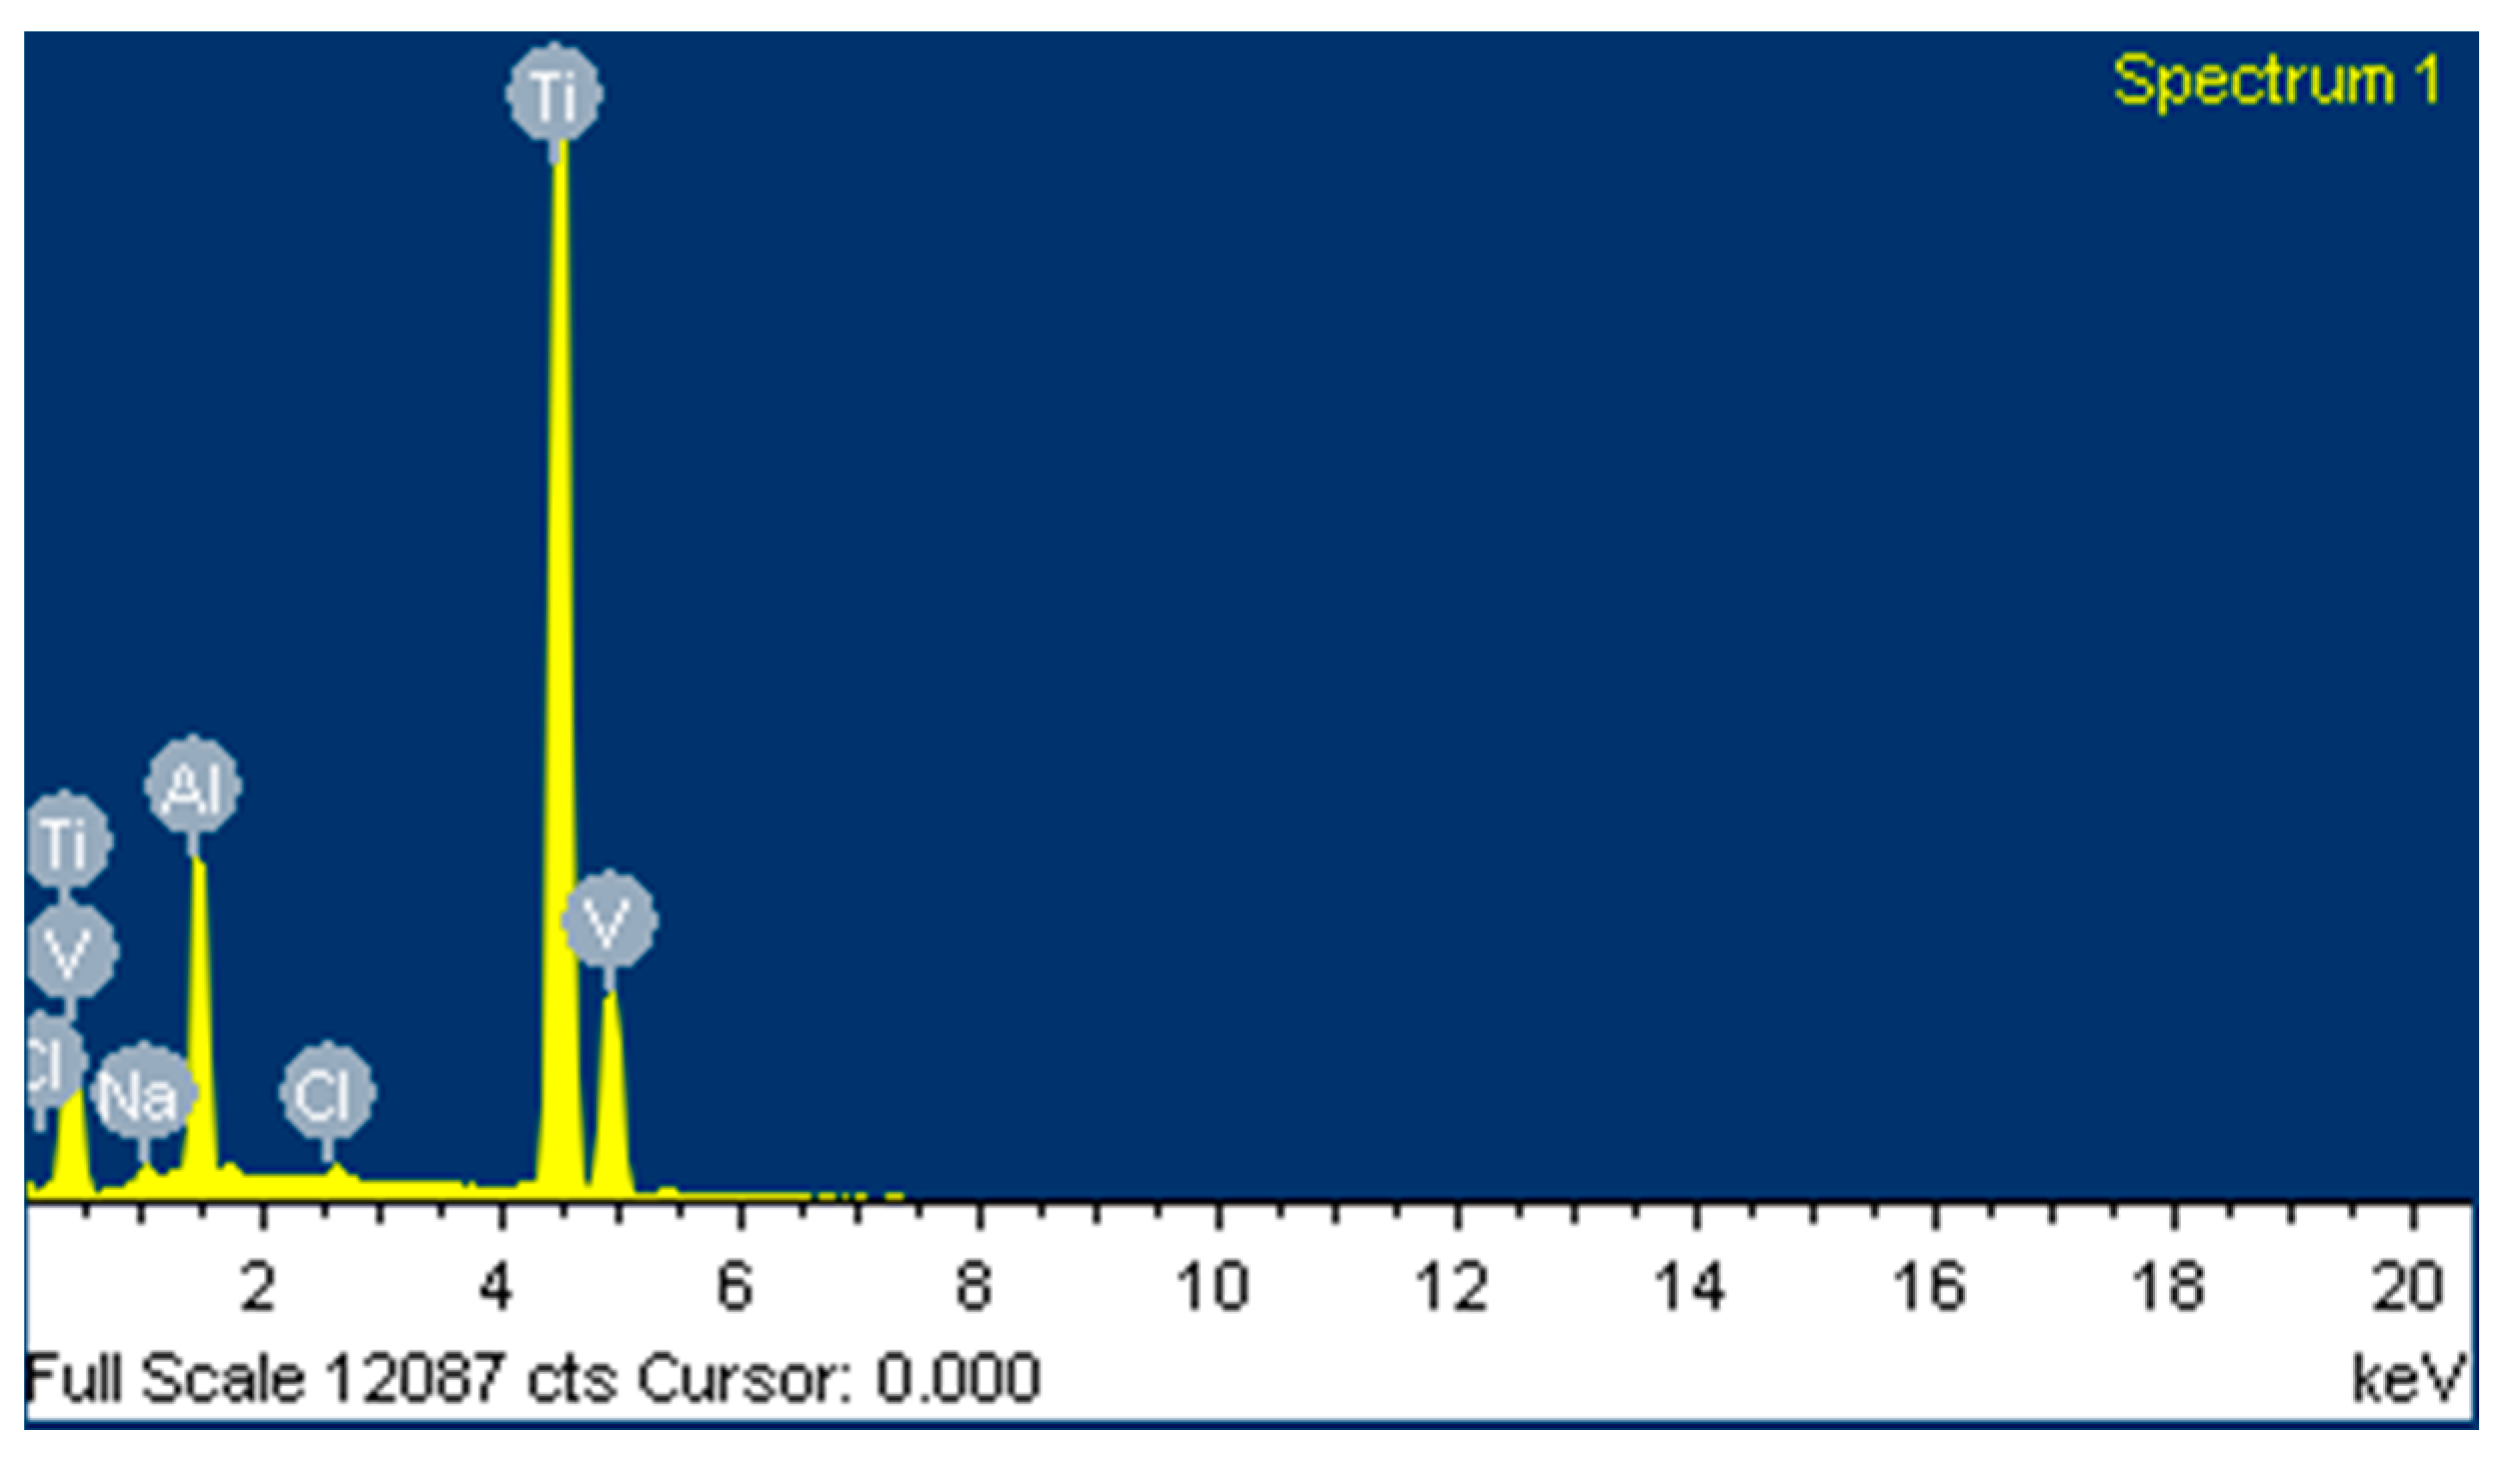
3.4. SEM and EDX Analyses

The morphology of the surfaces of the current alloys was taken using SEM, and the elemental analysis for these surfaces was collected using EDX analysis. Figure 11 shows the SEM micrograph and the EDX spectra obtained for the surface of Ti6Al2V after its immersion for 48 h before applying a potential value of 300 mV (Ag/AgCl) for 40 min. The same tests were performed at the same conditions for Ti6Al8V alloy, and the SEM image and the EDX profile are shown in Figure 12. It is clear from Figure 11 that the surface of Ti6Al2V had few pits that were filled with corrosion products. This confirms the data obtained by the cyclic polarization (CPP) and the change of current with time that was recorded at the same applied potential of 300 mV. In order to report the expected compounds, which may be formed on the surface at this condition, the EDX elemental analysis was performed. The weight percentages (wt %) obtained from the surface shown in Figure 11 recorded via the EDX analysis were as follows: Ti = 82.61%, Al = 11.96%, and V = 5.42%. The wt % for Ti was lower than expected, while Al and V showed higher values than their initial percentages. The higher percentage recorded for Al indicated that the surface was enriched with Al as a result of its dissolution and the formation of Al compounds as a corrosion product layer. The formation of AlCl4 may occur according to the following equation [43]:
Al3+ + 4Cl = AlCl4
The oxychloride complex, Al(OH)2Cl2, may be formed as per the following equation [43,49,50]:
2Al3+ + 2Cl + 2OH = Al(OH)2Cl2
It is well known that the presence of Cl ions causes a breakdown and dissolution of Al2O3, which leads to the production of the compound of the oxychloride complex produced in Equation (13). Figure 12 presents the SEM/EDX taken after completing the current–time experiment shown in Figure 9 (curve 4) for Ti6Al8V alloy. It is seen that the surface was completely smooth and fully covered with a layer of corrosion products. The SEM micrograph did not show any pits, which indicates that the alloy had higher corrosion resistance against pitting attack. This is in a complete agreement with the current–time behavior that the alloy does not suffer any pitting corrosion up to the applied anodic potential of 300 mV (Ag/AgCl). Additionally, applying this value of potential for 40 min in the chloride test solution could not cause any flawed regions in the formed layer on the surface. As compared to Ti-6Al-2V alloy, the surface of Ti-6Al8V alloy was more passivated as a result of the increase of V content. The wt % for the elements found on the surface depicted in the SEM via EDX analysis were Ti = 80.47%, Al = 8.71%, V = 9.54%, Na = 0.69%, and Cl = 0.4%. The presence of a higher percentage of Al was due to the formation of a thick corrosion product layer, most probably from Al compounds. These Al compounds could be AlCl3 (see Equation (6)), Al2O3 (see Equation (8)), AlCl4 (see Equation (12)), Al(OH)2Cl2 (see Equation (13)), etc. Moreover, the presence of Ti with a lower percentage compared to its original amount, which must be 86%, indicated that the chemical compositions of the surface of the alloy were definitely different from the composition of the alloy itself. This was mostly due to the formation of a corrosion product layer that was mainly composed of oxides like Al2O3, TiO2, and V2O5, which are protective. The results of the SEM and EDX analyses were thus in good agreement with the data collected by the EIS, CPP, and current–time experiments. All data confirmed that the increase of the content of V increased the protection of the alloy against corrosion in the chloride (3.5% NaCl) solutions.

4. Conclusions

Manufacturing of Ti6Al2V, Ti6Al4V, Ti6Al6V, and Ti6Al8V alloys were carried out using a mechanical alloying technique. The raw powders were mixed in a high energy ball mill for 30 min at a speed of 2000 rpm and under 40 MPa pressure, and finally the alloys were sintered at 1200 °C for 5 min before being cooled down and prepared for electrochemical measurements. The effect of increased V contents on the protection from corrosion after 1 h, 24 h, and 48 h immersion in 3.5% NaCl solutions was reported. The work was done using various electrochemical techniques such as CPP, EIS, and current–time at 300 mV (Ag/AgCl) along with characterization methods like SEM and EDX analysis. The electrochemical measurements confirmed that the increase of V content remarkably decreases the corrosion of the Ti-base alloys under investigations via reducing their measured values of jCorr and RCorr. The addition of V also increases the values of RP, where it causes a large decrease in the polarization and solution resistances as indicated by the CPP and EIS obtained results. The increase of V content was also found to minimize the uniform corrosion and eliminate the occurrence of pitting corrosion as was indicated with the current–time measurements. Prolonging the exposure periods of time from 1 h to 24 h and further to 48 h was also found to greatly increase the corrosion resistance against uniform attack. The morphological and elemental analysis experiments done by the use of SEM and EDX techniques indicated that the increase of V concentration within the tested alloys highly decreases the uniform corrosion, while preventing the occurrence of pitting attack; only Ti6Al2V showed some pits on its surface. The results together were in good agreement with each other and confirmed clearly that the increase of V additions as well as prolonging the exposure period of time in the chloride solutions remarkably increase the corrosion resistance of the Ti6AlV alloys.

Author Contributions

Conceptualization, E.-S.M.S. and H.S.A.; methodology, E.-S.M.S. and H.S.A.; software, E.-S.M.S. and H.S.A.; validation, E.-S.M.S. and H.S.A.; formal analysis, E.-S.M.S. and H.S.A.; investigation, E.-S.M.S. and H.S.A.; writing—original draft preparation, E.-S.M.S.; writing—review and editing, E.-S.M.S.; supervision, N.H.A. All authors have read and agreed to the published version of the manuscript.

Funding

This work was funded by the Deanship of Scientific Research at King Saud University via the Research Group Project No. RGP-160.

Acknowledgments

The authors would like to extend their sincere appreciation to the Deanship of Scientific Research at King Saud University for its funding of this research through the Research Group Project No. RGP-160.

Conflicts of Interest

The authors declare no conflict of interest.

References

  1. Zhang, L.C.; Attar, H. Selective Laser Melting of Titanium Alloys and Titanium Matrix Composites for Biomedical Applications: A Review. Adv. Eng. Mater. 2016, 18, 463–475. [Google Scholar] [CrossRef]
  2. Zhang, H.; Kou, H.; Yang, J.; Huang, D.; Nan, H.; Li, J. Microstructure evolution and tensile properties of Ti-6.5Al-2Zr-Mo-V alloy processed with thermo hydrogen treatment. Mater. Sci. Eng. A 2014, 619, 274–280. [Google Scholar] [CrossRef]
  3. Pang, J.; Blackwood, D.J. Corrosion of titanium alloys in high temperature near anaerobic seawater. Corros. Sci. 2016, 105, 17–24. [Google Scholar] [CrossRef]
  4. Simka, W.; Sadkowski, A.; Warczak, M.; Iwaniak, A.; Dercz, G.; Michalska, J.; MacIej, A. Characterization of passive films formed on titanium during anodic oxidation. Electrochim. Acta 2011, 56, 8962–8968. [Google Scholar] [CrossRef]
  5. da Silva, L.L.G.; Ueda, M.; Silva, M.M.; Codaro, E.N. Corrosion behavior of Ti-6Al-4V alloy treated by plasma immersion ion implantation process. Surf. Coat. Technol. 2007, 201, 8136–8139. [Google Scholar] [CrossRef]
  6. Erinosho, M.F.; Akinlabi, E.T.; Pityana, S. Microstructure and Corrosion Behaviour of Laser Metal Deposited Ti6Al4V/Cu Composites in 3.5% Sea Water. Mater. Today Proc. 2015, 2, 1166–1174. [Google Scholar] [CrossRef]
  7. Ho, W.F. Effect of omega phase on mechanical properties of Ti-Mo alloys for biomedical applications. J. Med. Biol. Eng. 2008, 28, 47–51. [Google Scholar]
  8. Al Otaibi, A.; Sherif, E.S.M.; Zinelis, S.; Al Jabbari, Y.S. Corrosion behavior of two cp titanium dental implants connected by cobalt chromium metal superstructure in artificial saliva and the influence of immersion time. Int. J. Electrochem. Sci. 2016, 11, 5877–5890. [Google Scholar] [CrossRef]
  9. Sakaguchi, N.; Mitsuo, N.; Akahori, T.; Saito, T.; Furuta, T. Effects of alloying elements on elastic modulus of Ti-Nb-Ta-Zr system alloy for biomedical applications. Mater. Sci. Forum 2004, 449–452, 1269–1272. [Google Scholar] [CrossRef]
  10. Koizumi, H.; Takeuchi, Y.; Imai, H.; Kawai, T.; Yoneyama, T. Application of titanium and titanium alloys to fixed dental prostheses. J. Prosthodont. Res. 2019, 63, 266–270. [Google Scholar] [CrossRef]
  11. He, G.; Hagiwara, M. Ti alloy design strategy for biomedical applications. Mater. Sci. Eng. C 2006, 26, 14–19. [Google Scholar] [CrossRef]
  12. Hussein, A.H.; Gepreel, M.A.H.; Gouda, M.K.; Hefnawy, A.M.; Kandil, S.H. Biocompatibility of new Ti-Nb-Ta base alloys. Mater. Sci. Eng. C 2016, 61, 574–578. [Google Scholar] [CrossRef]
  13. Niinomi, M. Recent metallic materials for biomedical applications. Metall. Mater. Trans. A 2002, 33, 477. [Google Scholar] [CrossRef]
  14. Bangera, M.; D’Costa, V. Titanium and its alloys: properties and applications for use as an oral biomaterial: a review. J. Res. Dent. 2015, 3, 592–599. [Google Scholar] [CrossRef] [Green Version]
  15. Yu, S.Y.; Scully, J.R. Corrosion and Passivity of Ti-13% Nb-13% Zr in Comparison to Other Biomedical Implant Alloys. Corros. Eng. 1997, 15, 965–976. [Google Scholar] [CrossRef]
  16. Hrabe, N.; Quinn, T. Effects of processing on microstructure and mechanical properties of a titanium alloy (Ti-6Al-4V) fabricated using electron beam melting (EBM), part 1: Distance from build plate and part size. Mater. Sci. Eng. A 2013, 573, 264–270. [Google Scholar] [CrossRef]
  17. Hrabe, N.; Quinn, T. Effects of processing on microstructure and mechanical properties of a titanium alloy (Ti-6Al-4V) fabricated using electron beam melting (EBM), Part 2: Energy input, orientation, and location. Mater. Sci. Eng. A 2013, 573, 271–277. [Google Scholar] [CrossRef]
  18. Khalil, K.A.; Sherif, E.S.M.; Nabawy, A.M.; Abdo, H.S.; Marzouk, W.W.; Alharbi, H.F. Titanium carbide nanofibers-reinforced aluminum compacts, a new strategy to enhance mechanical properties. Materials (Basel) 2016, 9, 399. [Google Scholar] [CrossRef]
  19. Ahn, H.; Lee, D.; Lee, K.M.; Lee, K.; Baek, D.; Park, S.W. Oxidation behavior and corrosion resistance of Ti-10Ta-10Nb alloy. Surf. Coat. Technol. 2008, 202, 5784–5789. [Google Scholar] [CrossRef]
  20. Narayanan, R.; Seshadri, S.K. Point defect model and corrosion of anodic oxide coatings on Ti-6Al-4V. Corros. Sci. 2008, 50, 1521–1529. [Google Scholar] [CrossRef]
  21. Martins Júnior, J.R.S.; Matos, A.A.; Oliveira, R.C.; Buzalaf, M.A.R.; Costa, I.; Rocha, L.A.; Grandini, C.R. Preparation and characterization of alloys of the Ti–15Mo–Nb system for biomedical applications. J. Biomed. Mater. Res. B Appl. Biomater. 2018, 106, 639–648. [Google Scholar] [CrossRef] [PubMed]
  22. Ohkubo, C.; Hanatani, S.; Hosoi, T. Present status of titanium removable dentures—A review of the literature. J. Oral Rehabil. 2008, 35, 706–714. [Google Scholar] [CrossRef] [PubMed]
  23. Afzali, P.; Ghomashchi, R.; Oskouei, R.H. On the corrosion Behaviour of low modulus titanium alloys for medical implant applications: A review. Metals 2019, 9, 878. [Google Scholar] [CrossRef] [Green Version]
  24. Mogoda, A.S.; Ahmad, Y.H.; Badawy, W.A. Corrosion behaviour of Ti-6Al-4V alloy in concentrated hydrochloric and sulphuric acids. J. Appl. Electrochem. 2004, 34, 873–878. [Google Scholar] [CrossRef]
  25. Amerio, O.N.; Rosenberger, M.R.; Favilla, P.C.; Alterach, M.A.; Schvezov, C.E. Prótesis Valvular Cardíaca Trivalva Asociada a Última Generación de Materiales Hemo-Biocompatibles. Rev. Argentina Cirugía Cardiovasc. 2006, 4, 65–76. [Google Scholar]
  26. El-Bagoury, N.; Ahmed, S.I.; Ahmed Abu Ali, O.; El-Hadad, S.; Fallatah, A.M.; Mersal, G.A.M.; Ibrahim, M.M.; Wysocka, J.; Ryl, J.; Boukherroub, R.; et al. The Influence of Microstructure on the Passive Layer Chemistry and Corrosion Resistance for Some Titanium-Based Alloys. Materials 2019, 12, 1233. [Google Scholar] [CrossRef] [Green Version]
  27. Geetha, M.; Singh, A.K.; Asokamani, R.; Gogia, A.K. Ti based biomaterials, the ultimate choice for orthopaedic implants—A review. Prog. Mater. Sci. 2009, 54, 397–425. [Google Scholar] [CrossRef]
  28. McKay, P.; Mitton, D.B. An Electrochemical Investigation of Localized Corrosion on Titanium in Chloride Environments. Corrosion 1985, 41, 52–62. [Google Scholar] [CrossRef]
  29. Liu, X.; Chu, P.K.; Ding, C. Surface modification of titanium, titanium alloys, and related materials for biomedical applications. Mater. Sci. Eng. R Rep. 2004, 47, 49–121. [Google Scholar] [CrossRef] [Green Version]
  30. Oh, K.T.; Kim, K.N. Electrochemical properties of suprastructures galvanically coupled to a titanium implant. J. Biomed. Mater. Res. B Appl. Biomater. 2004, 70B, 318–331. [Google Scholar] [CrossRef]
  31. Chapala, P.; Sunil Kumar, P.; Joardar, J.; Bhandari, V.; Acharyya, S.G. Effect of alloying elements on the microstructure, coefficient of friction, in-vitro corrosion and antibacterial nature of selected Ti-Nb alloys. Appl. Surf. Sci. 2019, 469, 617–623. [Google Scholar] [CrossRef]
  32. Rack, H.J.; Qazi, J.I. Titanium alloys for biomedical applications. Mater. Sci. Eng. C 2006, 26, 1269–1277. [Google Scholar] [CrossRef]
  33. Long, M.; Rack, H.J. Titanium alloys in total joint replacement - A materials science perspective. Biomaterials 1998, 19, 1621–1639. [Google Scholar] [CrossRef]
  34. Li, Y.; Qu, L.; Wang, F. The electrochemical corrosion behavior of TiN and (Ti,Al)N coatings in acid and salt solution. Corros. Sci. 2003, 45, 1367–1381. [Google Scholar] [CrossRef]
  35. Sherif, E.S.M.; Abdo, H.S.; Latief, F.H.; Alharthi, N.H.; Zein El Abedin, S. Fabrication of Ti–Al–Cu new alloys by inductive sintering, characterization, and corrosion evaluation. J. Mater. Res. Technol. 2019, 8, 4302–4311. [Google Scholar] [CrossRef]
  36. Sherif, E.S.M.; Latief, F.H.; Abdo, H.S.; Alharthi, N.H. Electrochemical and Spectroscopic Study on the Corrosion of Ti–5Al and Ti–5Al–5Cu in Chloride Solutions. Met. Mater. Int. 2019, 25, 1511–1520. [Google Scholar] [CrossRef]
  37. Diamanti, M.V.; Bolzoni, F.; Ormellese, M.; Pérez-Rosales, E.A.; Pedeferri, M.P. Characterisation of titanium oxide films by potentiodynamic polarisation and electrochemical impedance spectroscopy. Corros. Eng. Sci. Technol. 2010, 45, 428–434. [Google Scholar] [CrossRef]
  38. Vera, M.L.; Linardi, E.; Lanzani, L.; Mendez, C.; Schvezov, C.E.; Ares, A.E. Corrosion resistance of titanium dioxide anodic coatings on Ti-6Al-4V. Mater. Corros. 2015, 66, 1140–1149. [Google Scholar] [CrossRef]
  39. Zhang, Z.; Chen, S.; Li, Y.; Li, S.; Wang, L. A study of the inhibition of iron corrosion by imidazole and its derivatives self-assembled films. Corros. Sci. 2009, 51, 291–300. [Google Scholar] [CrossRef]
  40. Orazem, M.E.; Tribollet, B. Electrochemical Impedance Spectroscopy; John Wiley & Sons: Hoboken, NJ, USA, 2008; ISBN 9780470041406. [Google Scholar]
  41. Alharthi, N.; Sherif, E.S.M.; Abdo, H.S.; El Abedin, S.Z. Effect of Nickel Content on the Corrosion Resistance of Iron-Nickel Alloys in Concentrated Hydrochloric Acid Pickling Solutions. Adv. Mater. Sci. Eng. 2017, 2017, 1–8. [Google Scholar] [CrossRef] [Green Version]
  42. Sherif, E.S.M. Effects of exposure time on the anodic dissolution of Monel-400 in aerated stagnant sodium chloride solutions. J. Solid State Electrochem. 2012, 16, 891–899. [Google Scholar] [CrossRef]
  43. Badawy, W.A.; Al-Kharafi, F.M.; El-Azab, A.S. Electrochemical behaviour and corrosion inhibition of Al, Al-6061 and Al-Cu in neutral aqueous solutions. Corros. Sci. 1999, 41, 709–727. [Google Scholar] [CrossRef]
  44. Mazhar, A.A.; Badawy, W.A.; Abou-Romia, M.M. Impedance studies of corrosion resistance of aluminium in chloride media. Surf. Coatings Technol. 1986, 29, 335–345. [Google Scholar] [CrossRef]
  45. Sherif, E.M.; Park, S.M. Effects of 1,4-naphthoquinone on aluminum corrosion in 0.50 M sodium chloride solutions. Electrochim. Acta 2006, 51, 1313–1321. [Google Scholar] [CrossRef]
  46. Tomcsányi, L.; Varga, K.; Bartik, I.; Horányi, H.; Maleczki, E. Electrochemical study of the pitting corrosion of aluminium and its alloys-II. Study of the interaction of chloride ions with a passive film on aluminium and initiation of pitting corrosion. Electrochim. Acta 1989, 34, 855–859. [Google Scholar] [CrossRef]
  47. Rinner, M.; Gerlach, J.; Ensinger, W. Formation of titanium oxide films on titanium and Ti6A14V by O2-plasma immersion ion implantation. Surf. Coatings Technol. 2000, 132, 111–116. [Google Scholar] [CrossRef]
  48. Butt, A.; Hamlekhan, A.; Patel, S.; Royhman, D.; Sukotjo, C.; Mathew, M.T.; Shokuhfar, T.; Takoudis, C. A novel investigation of the formation of titanium oxide nanotubes on thermally formed oxide of Ti-6Al-4V. J. Oral Implantol. 2015, 41, 523–531. [Google Scholar] [CrossRef]
  49. Wall, F.D.; Martinez, M.A.; Vandenavyle, J.J. Relationship between induction time for pitting and pitting potential for high-purity aluminum. J. Electrochem. Soc. 2004, 151, 354–358. [Google Scholar] [CrossRef]
  50. Diggle, J.W.; Downie, T.C.; Goulding, C.W. The dissolution of porous oxide films on aluminium. Electrochim. Acta 1970, 15, 1079–1093. [Google Scholar] [CrossRef]
Figure 1. Nyquist plots measured for the different TiAlV alloys after their immersion in NaCl solutions for 1 h.
Metals 10 00264 g001
Figure 2. Nyquist plots measured for the different TiAlV alloys after 24 h exposure in the NaCl solution.
Metals 10 00264 g002
Figure 3. Nyquist plots measured for the different TiAlV alloys after 48 h exposure to NaCl solutions.
Metals 10 00264 g003
Figure 4. The equivalent-circuit model that fits the collected impedance data.
Metals 10 00264 g004
Figure 5. The cyclic potentiodynamic polarization (CPP) plots of the different TiAlV alloys after 1 h immersion in the NaCl solution.
Metals 10 00264 g005
Figure 6. The CPP plots recorded for the TiAlV alloys after their immersion for 24 h in 3.5% NaCl solution.
Metals 10 00264 g006
Figure 7. The CPP plots collected for TiAlV alloys after their immersion in 3.5% NaCl solution for 48 h.
Metals 10 00264 g007
Figure 8. Current–time curves collected at 0.30 V (Ag/AgCl) for (1) Ti6Al2V, (2) Ti6Al4V, (3) Ti6Al6V, and (4) Ti6Al8V alloys after 1 h immersion in 3.5% NaCl solution, respectively.
Metals 10 00264 g008
Figure 9. Current–time curves collected at 0.30 V (Ag/AgCl) for (1) Ti6Al2V, (2) Ti6Al4V, (3) Ti6Al6V, and (4) Ti6Al8V alloys after 24 h immersion in 3.5% NaCl solution, respectively.
Metals 10 00264 g009
Figure 10. Current–time curves collected at 0.30 V (Ag/AgCl) for (1) Ti6Al2V, (2) Ti6Al4V, (3) Ti6Al6V, and (4) Ti6Al8V alloys after 48 h immersion in 3.5% NaCl solution, respectively.
Metals 10 00264 g010
Figure 11. SEM micrograph and EDX spectrum obtained for Ti6Al2V alloy after its immersion for 48 h before stepping the potential to 300 mV (Ag/AgCl) for 40 min.
Metals 10 00264 g011aMetals 10 00264 g011b
Figure 12. SEM micrograph and EDX spectrum obtained for Ti6Al8V alloy after its immersion for 48 h before stepping the potential to 300 mV (Ag/AgCl) for 40 min.
Metals 10 00264 g012aMetals 10 00264 g012b
Table 1. Impedance data collected for the tested Ti alloys at the different conditions.
AlloyImpedance Data
RS/Ω cm2QRP1/Ω cm2Cdl/F cm2RP2/Ω cm2
YQ/S*s^nn
Ti6Al2V (1 h)17.830.0001080.805550.0001812267
Ti6Al4V (1 h)19.910.0001120.736090.0001805497
Ti6Al6V (1 h)23.190.0001230.807640.0002218232
Ti6Al8V (1 h)25.520.0001410.728460.00017010,325
Ti6Al2V (24 h)19.340.0008370.758030.0007464361
Ti6Al4V (24 h)21.070.0006780.789810.0001906185
Ti6Al6V (24 h)22.650.0008840.7410790.0001217237
Ti6Al8V (24 h)23.930.0001240.7713030.0008898537
Ti6Al2V (48 h)23.530.0001110.7133770.0004777634
Ti6Al4V (48 h)24.580.0001260.7742030.0001148035
Ti6Al6V (48 h)25.610.0001420.7442900.0001359150
Ti6Al6V (48 h)26.520.0001330.7543340.0001529847
Table 2. Summary for the polarization data for the Ti alloys in 3.5% NaCl solutions.
AlloyParameter
βc/mV/dec−1ECorr/mVβa/mV·dec−1jCorr/µA·cm−2Rp/Ω·cm2RCorr/mpy
Ti6Al2V (1 h)100–400900.2582380.0218
Ti6Al4V (1 h)90–380820.2284800.0192
Ti6Al6V (1 h)85–400780.1992510.0165
Ti6Al8V (1 h)80–422750.15112210.0131
Ti6Al2V (24 h)110–4471200.19131330.0165
Ti6Al4V (24 h)105–3401100.17137390.0148
Ti6Al6V (24 h)95–395900.15133960.0131
Ti6Al8V (24 h)90–375800.12153450.0105
Ti6Al2V (48 h)120–4301250.17156580.0148
Ti6Al4V (48 h)115–4001250.15173610.0131
Ti6Al6V (48 h)110–4701270.13197140.0113
Ti6Al6V (48 h)110–4101300.11235510.0096

