Article

A New 3D Creep-Fatigue-Elasticity Damage Interaction Diagram Based on the Total Tensile Strain Energy Density Model

1
Department of Engineering Mechanics, School of Aerospace Engineering, Tsinghua University, Beijing 100084, China
2
School of Energy, Power and Mechanical Engineering, North China Electric Power University, Beijing 102206, China
*
Author to whom correspondence should be addressed.
Metals 2020, 10(2), 274; https://doi.org/10.3390/met10020274
Submission received: 15 January 2020 / Revised: 13 February 2020 / Accepted: 14 February 2020 / Published: 20 February 2020

Abstract

:
Fatigue damage, creep damage, and their interactions are the critical factors in degrading the integrity of most high-temperature engineering structures. A reliable creep-fatigue damage interaction diagram is a crucial issue for the design and assessment of high-temperature components used in power plants. In this paper, a new three-dimensional creep-fatigue-elasticity damage interaction diagram was constructed based on a developed life prediction model for both high-temperature fatigue and creep fatigue. The total tensile strain energy density concept is adopted as a damage parameter for life prediction by using the elastic strain energy density and mean stress concepts. The model was validated by a great deal of data such as P91 steel at 550 °C, Haynes 230 at 850 °C, Alloy 617 at 850 and 950 °C, and Inconel 625 at 815 °C. The estimation values have very high accuracy since nearly all the test data fell into the scatter band of 2.0.

1. Introduction

Many mechanical components for petrochemical and nuclear power plants are operated under very high temperatures and pressures conditions, high-temperature fatigue damage combined with creep damage introduced by the dwell time are the main challenges in the structural design and evaluation stages. Moreover, high reliability and long service life have been continuously pursued in fossil-fired and nuclear power plants, and reliable creep-fatigue and high-temperature fatigue design codes from low- to high-cycle fatigue regime (fatigue life is larger than 104 cycles) is strongly demanded. The damage interaction diagram plays a crucial role in the strength design and reliability assessment of many high-temperature components. The planar damage diagrams are often adopted in many high-temperature design codes, such as the ASME-NH [1], RCC-MR [2], and R5 [3]. The creep damage calculated in ASME-NH and RCC-MR are based on the time fraction rule [4] while the ductility exhaustion method [5] is adopted in R5. However, a large prediction discrepancy is observed when using these two methods [6,7], and a large safety margin is needed to ensure the structural integrity, which may lead to overdesign. Since the determination of failure envelope depends on the definition of creep and fatigue damage, a reliable damage interaction diagram, which can serve as a design tool, should rely on a creep-fatigue life prediction model with high prediction performance. In order to establish an efficient fatigue life prediction model with high accuracy, the damage mechanism at elevated temperatures were revealed after extensive research. It is well recognized that the creep damage is time-dependent, whereas the fatigue damage is time-independent. The effects of hold time and hold position on the fatigue performance depend strongly on the material properties. For most high-temperature alloys, such as 316 stainless steel [8], P91 steel [7], and P92 steel [9], the fatigue life decreases with increasing duration time, in general, but the hold position effect is not as the same as the duration time. For materials such as P91 and P92 steels [7,9], hold position at valley strain is more deleterious. But for 316 steel [10], the tension hold is more damaging. Compressive strain hold induces a tensile mean stress, whereas a compressive mean stress is introduced by tensile strain hold. Date et al. [11] investigated the environmental effect on the fatigue and creep-fatigue behavior of 316 fire-resistant steel, longer fatigue lives were obtained in sodium than in air, and the hold position also affected the fracture behavior. In addition to environment and hold position effects, the influences of dynamic strain aging [12], strain rate [13], strain amplitude [14], and microstructural changes due to long-term service [15,16] were also pronounced in many cases. Since the material degradation under high-temperature fatigue loading possesses a very complex interaction process, modeling a reliable lifetime is still a challenging issue.
Many fatigue and creep-fatigue life evaluation methods have been proposed in the past decades, and the time fraction [4] and ductility exhaustion [5] methods, which are based on the traditional linear cumulative damage in nature, were developed and incorporated in many high-temperature design codes. However, as mentioned above, there was a large prediction discrepancy between experimental data and model predictions. Moreover, the time fraction rule and ductility exhaustion method are not suitable for pure high-temperature fatigue conditions. The inelastic strain is also often adopted in the life evaluation of fatigue and creep-fatigue, such as the frequency-modified Coffin–Manson equation [17,18] and strain range partition method [19]. Though these methods can account for the loading waveform effect, the damage interaction diagram, which is very crucial in the design and safety assessment of high-temperature structures, cannot be established. Since experiments and theory [20,21] have revealed that a stable value of hysteresis energy is arrived after a short initial cycle, even the materials possess the cyclic hardening or softening behavior, many energy-based fatigue life prediction methods have been proposed, and good prediction accuracy is obtained [22,23,24,25,26,27,28]. For example, Wang et al. [26,27] proposed a modified strain energy density exhaustion model for creep-fatigue life prediction in which the mean stress effect is considered. Zhu et al. [29] established an energy damage function model which can account for the frequency and mean stress effects, and better prediction performance was observed compared to some traditional models. Fan et al. [30] proposed an energy-based life evaluation method for both fatigue and creep-fatigue, and a good correlation was observed between model predictions and experimental data. Though the energy-based methods mentioned above can give good predictions at some conditions, some limitations are also observed. Some of them are just applicable to creep-fatigue life evaluation, and there are many parameters that need to be determined. Moreover, the fitting procedures are very complicated in many cases. More importantly, many energy-based methods are mainly applicable to low-cycle fatigue (LCF), and the damage interaction diagram, which is indispensable in engineering application, cannot be constructed. Hence, in this paper, a new total tensile strain energy-based damage parameter for both high-temperature fatigue and creep-fatigue was established, and a three-dimensional (3D) damage interaction diagram was constructed.
In the present investigation, a new 3D damage interaction diagram was constructed based on a newly developed fatigue and creep-fatigue life evaluation model. The paper was constructed as follows: Firstly, a total tensile strain energy-based damage parameter for both high-temperature fatigue and creep-fatigue was developed, in which the elastic strain energy density and mean stress effect were considered. Then, a new 3D damage interaction diagram, in which the virtual elastic damage was introduced, was constructed. In addition, the fatigue damage and creep damage was constructed based on the developed model. Finally, the proposed method was verified by using fatigue and creep-fatigue data of four materials with various loading waveforms.

2. The Proposed Total Tensile Strain Energy-Based Life Prediction Model

In many energy-based models, only the inelastic component is considered as a damage parameter. However, a very low inelastic strain energy density was induced in the high-cycle fatigue regime, and the corresponding inelastic strain energy density even tended to be zero. In such case, though the deformation that occurred at the microstructural level may be plastic, mechanical response at the macroscopic level was quasi-elastic. Hence, the traditional plastic strain energy density concept may not be a suitable damage parameter for both low- and high-cycle fatigue life evaluation. Ellyin et al. [31,32,33] proposed a new damage parameter (i.e., total strain energy density) for both low- and high-cycle fatigue life evaluation, and the total strain energy density is the sum of the cyclic plastic strain energy density and the tensile elastic strain energy density. Moreover, the new damage parameter can describe the fatigue crack initiation and subsequent growth phases, i.e., the fatigue crack initiation is associated with plastic strain energy density while the tensile elastic strain energy density can facilitate crack propagation [32,33]. Since the long and even ultra-long service life of many high-temperature components is continuously pursued, a unified low- and high-cycle fatigue damage parameter is also needed for the reliability assessment of high-temperature components. Hence, the total strain energy density concept is introduced in this paper to evaluate the fatigue and creep-fatigue life at elevated temperatures.
It is well recognized that the hold position will affect the creep-fatigue behavior, and the compressive hold strain induces a tensile mean stress while a compressive mean stress is introduced by the tensile hold strain. Studies have shown that the mean stress can account for the hold position effect [34,35], hence the mean stress effect should be taken into account. More importantly, the damage interaction diagram can be constructed to guide the strengthen design at elevated temperature when the creep damage occurs. Moreover, since the number of cycles to creep-fatigue failure decreases with the introduction of hold duration, for some materials the decrease is very large. However, the change of the area of hysteresis loop was little in our present investigation. Hence, considering the above factors, only part of the hysteresis loop was adopted for damage evaluation, which is similar to the Ostergren damage function model [36]. Considering the mean stress effect and the construction of damage interaction diagram, a fatigue damage stress, σd, is introduced and only the hysteresis loop above σd is considered to contribute to the fatigue damage, i.e., shaded area in Figure 1. It can be seen from Figure 1 that the fatigue damage stress, σd, is very similar to the crack open stress concept in crack closure theory. The σd is defined as
σ d = λ σ m = λ σ max + σ min 2
where σm is the mean stress, and σmax and σmin are the peak tensile stress and peak valley stress, respectively. The λ is a material parameter and it can be a positive or negative, and λ is assumed to be a positive in Figure 1.
For creep-fatigue, the mean stress and elastic strain energy density concepts were employed in addition to the plastic strain energy density, as shown in Figure 1. In the present investigation, the total tensile strain energy density was divided into three components, i.e., plastic component Δwp+, creep component Δwc+, and elastic component Δwe+, as shown in Figure 1. The partition of the total tensile strain energy density into different components makes it convenient and possible to calculate creep, fatigue, and elastic damages, respectively.
For the tension-hold creep-fatigue, the plastic component Δwp+, as shown in Figure 1a, can be calculated by
Δ w p + = 1 - n 1 + n σ max Δ ε p - σ d Δ ε p
where σd∆εp is the mean stress correction term, △εp is the plastic strain range, and n’ is the cyclic hardening exponent and can be determined by the cyclic stress and strain relation, i.e.,
Δ σ 2 = K ( Δ ε p 2 ) n
where K’ is the cyclic hardening coefficient.
The Δwc+ can be considered as creep component [24], and is expressed as
Δ w c + = σ 0 2 - σ r 2 2 E + σ d ( Δ ε in - Δ ε p )
where σ0 and σr is the stress at the start and final stage of the stress relaxation, respectively. E is the elastic modules.
The elastic component Δwe+ is calculated by
Δ w e + = ( σ r - σ d ) 2 2 E
For the compression-hold creep-fatigue, the plastic component ∆wp+ is calculated by
Δ w p + = 1 - n 1 + n σ max Δ ε p - σ d Δ ε p
The creep component ∆wc+ can be expressed by
Δ w c + = ( σ max - σ d ) ( Δ ε in - Δ ε p ) 2
where ∆εin is the inelastic strain range.
The elastic component Δwe+ is given by
Δ w e + = ( σ max - σ d ) 2 2 E
For symmetry-hold condition, the calculation of total tensile strain energy density is similar to that in tension-hold and compression-hold conditions. The total tensile strain energy density ∆wt+ is the sum of ∆wp+, ∆wc+, and ∆we+.
A power law relation was assumed between total tensile strain energy density and fatigue life, which is consistent with the traditional energy-based model, and the relation is written as
N = a ( Δ w t + ) b
where a and b are model constants and can be fitted by experimental data.

3. Construction of 3D Damage Interaction Diagram

The creep-fatigue damage diagram accompanied with life prediction model is indispensable for engineering application. Figure 2 is the damage diagram of P91 steel in time fraction model, and it can be seen that bilinear damage envelopes were adopted by the ASME-NH [1] and RCC-MR [2] design codes. At high-temperature components design stage, all the calculated damage data should be below the failure envelope to ensure the structural safety in their service life. The failure envelope is determined based on the creep and fatigue test data. The common way to determine the failure envelope is to plot the creep damage and fatigue damage calculated by the corresponding definition in the life evaluation approach, and the lower bound line is chosen as the failure envelope. It should be noted that the differences in determining the failure envelope are mainly due to the different definitions of creep and fatigue damage. Moreover, a reliable failure envelope should be chosen based on a large set of failure data.
Since the damage diagram plays a key role in the structural integrity assessment, a three-dimensional damage diagram was constructed based on the present model in which the virtual elastic damage was introduced in addition to fatigue and creep damages. The fatigue damage df per cycle is defined as
d f = 1 N f
where Nf is the pure fatigue life obtained at the same test condition as the creep-fatigue test.
The creep damage dc per cycle is defined as
d c = Δ w c + Δ W c
where ∆Wc is the creep failure energy density and can be calculated by
Δ W c = σ a ε r
where σa is the applied stress and εr is the creep rupture elongation obtained at the same test temperature.
In this paper, the elastic strain energy was also assumed to contribute to the fatigue damage. Hence, the virtual elastic damage should be introduced and defined in addition to fatigue and creep damages. It can be seen from Equations (10) and (11) that the definitions of fatigue and creep damage are mainly based on the linear cumulative damage theory. Hence, the linear cumulative damage theory was also employed in defining the virtual elastic damage per cycle. Moreover, considering the dimensional consistency and engineering measurability, the material toughness, which is defined as the product of ultimate tensile strength σu and fracture elongation εf, was adopted in determining the virtual elastic damage. It assumed that the material failure occurs when the accumulated elastic strain energy density reaches the material toughness. Hence, the virtual elastic damage per cycle can be calculated by
d e = Δ w e + σ u ε f
It should be added that since the effects of temperature and strain rate on the tensile properties cannot be neglected [37,38], the ultimate tensile strength, σu, and fracture elongation, εf, should be obtained at the same temperature and strain rate as the creep-fatigue test. The accumulated fatigue damage, Df, creep damage, Dc, and virtual elastic damage, De, can be obtained by multiplying df, dc, and de by creep-fatigue life, respectively, and the total damage, Dt, is the sum of Df, Dc, and De.

4. Results and Discussions

4.1. Data Collection

The fatigue and creep-fatigue data of four materials (P91 steel at 550 °C [39,40], Inconel 625 at 815 °C [41], Alloy 617 at 850 °C [42,43], and Haynes 230 at 850 °C [43]) were collected to verify the prediction results of the proposed model, as shown in Table 1. It should be added that the testing data of cyclic stress amplitude and cyclic plastic strain amplitude, which are used to determine the cyclic hardening exponent n’, were also available in the above reference. T, C, and S in Table 1 represent tension-hold, compression-hold, and symmetry-hold, respectively. It can be seen from Table 1 that different loading waveforms were incorporated in the present investigation. The creep data and tensile properties of P91 steel [40,44], Inconel 625 [45,46], and Alloy 617 [43,47] were also collected for calculating creep and virtual elastic damages. Since the elastic modules of Inconel 625 at 815 °C was not available in [41], the elastic modulus was assumed to be a linear function of temperature, as shown in Figure 2 [48]. A value of 157 GPa was derived from Figure 3 at 815 °C for Inconel 625.

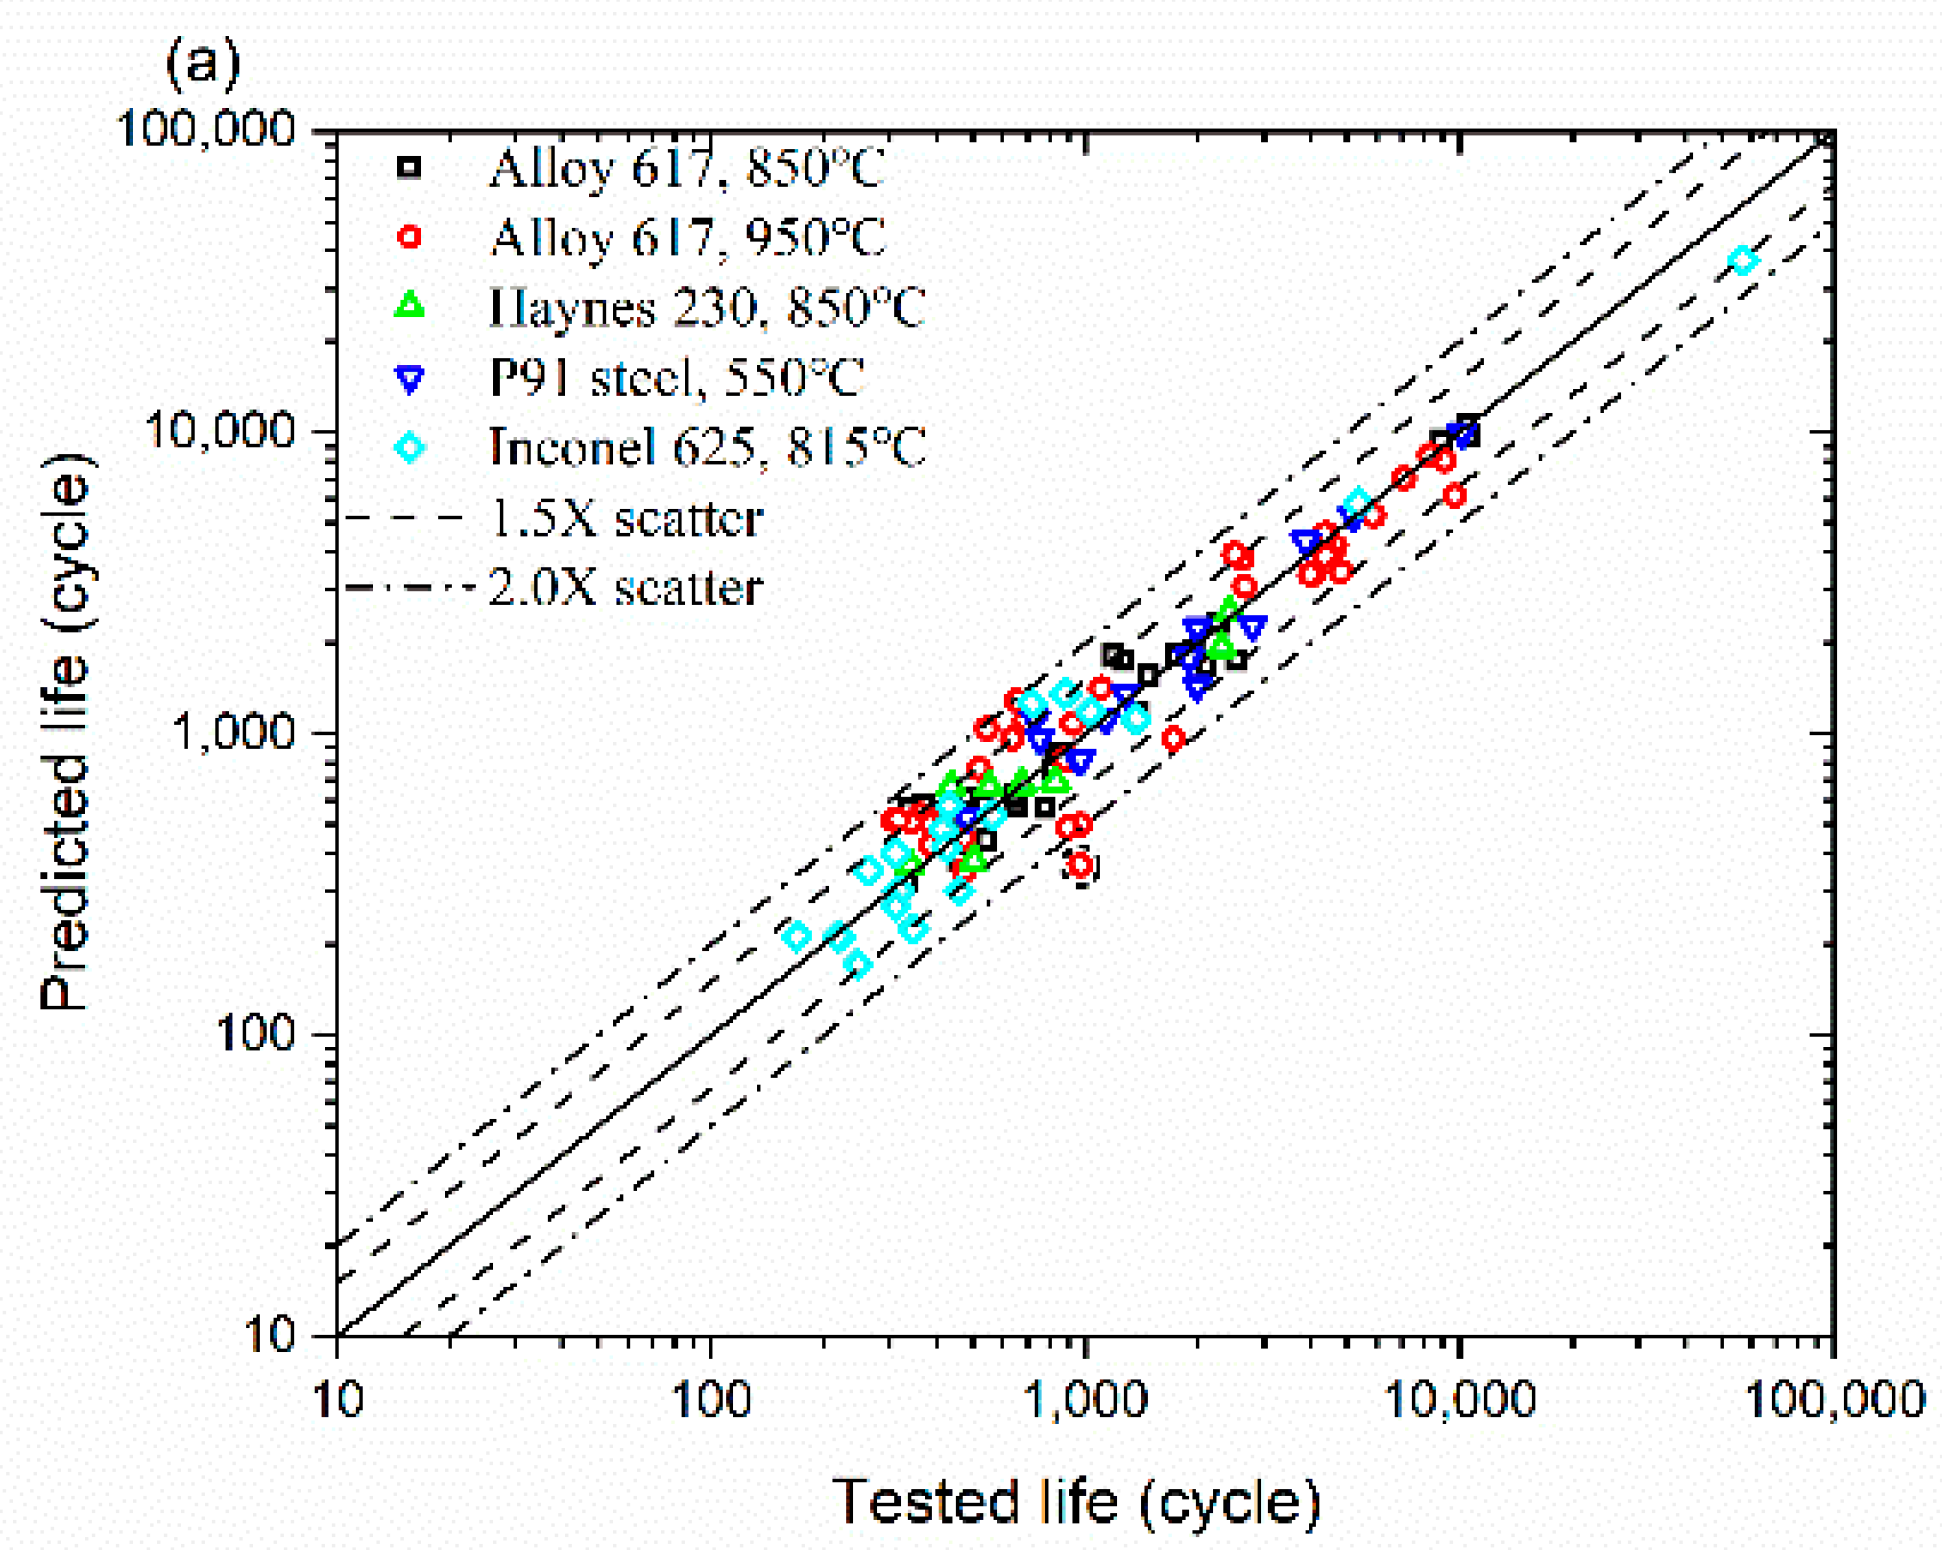
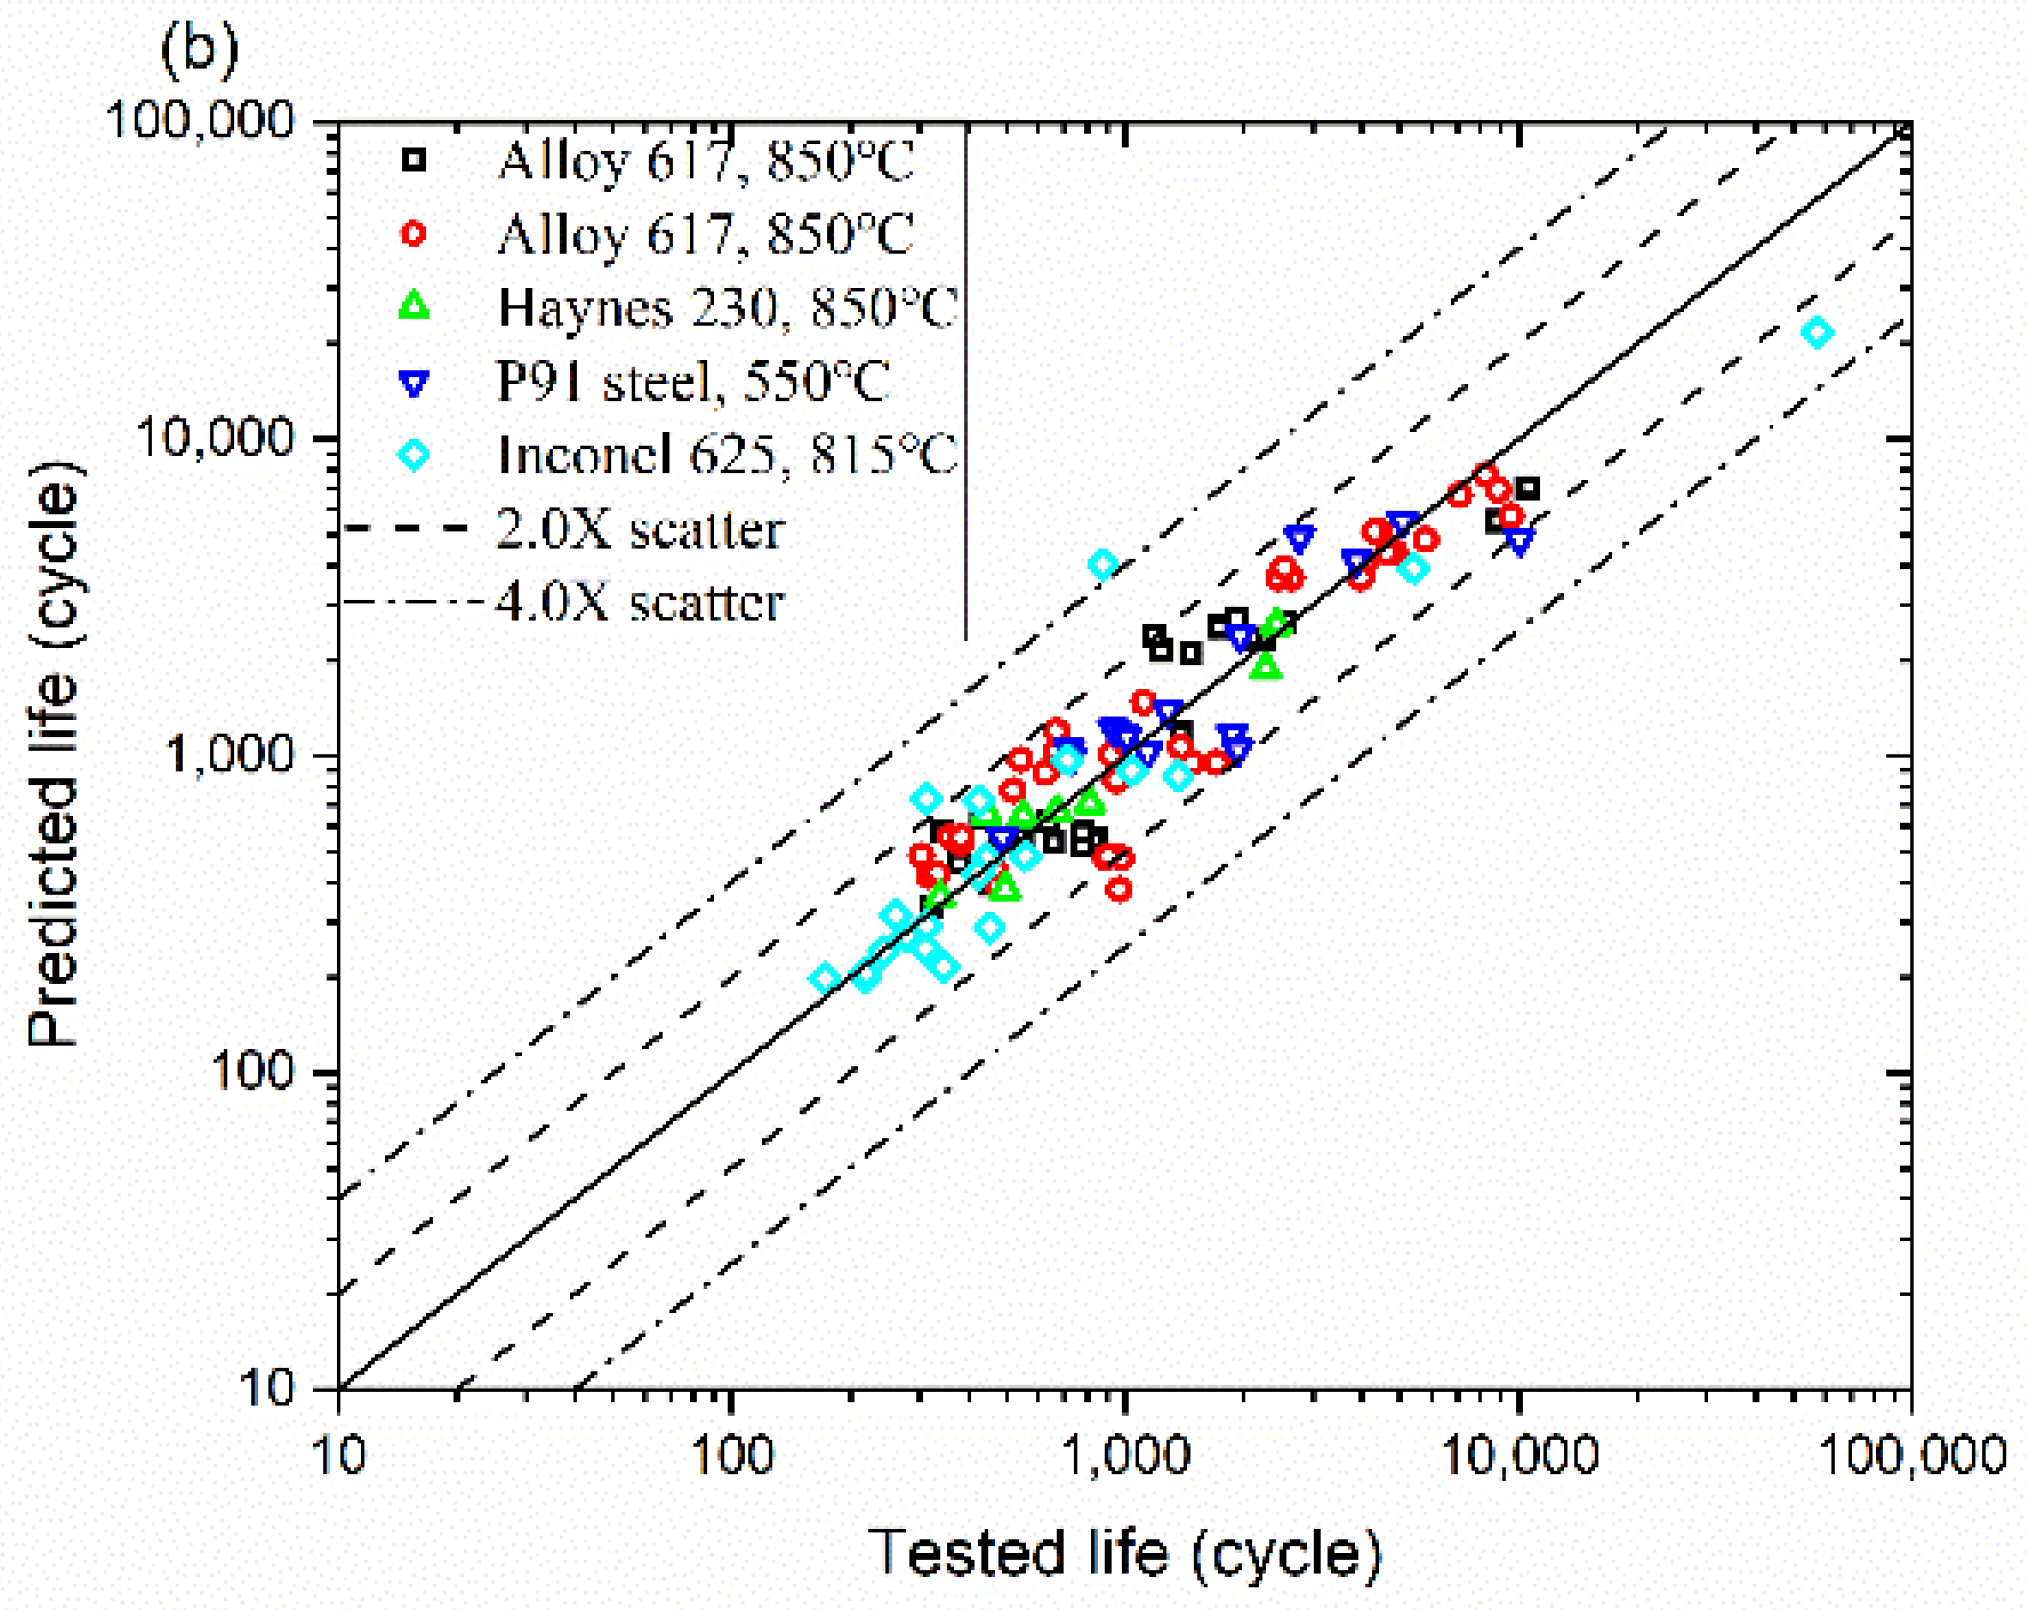
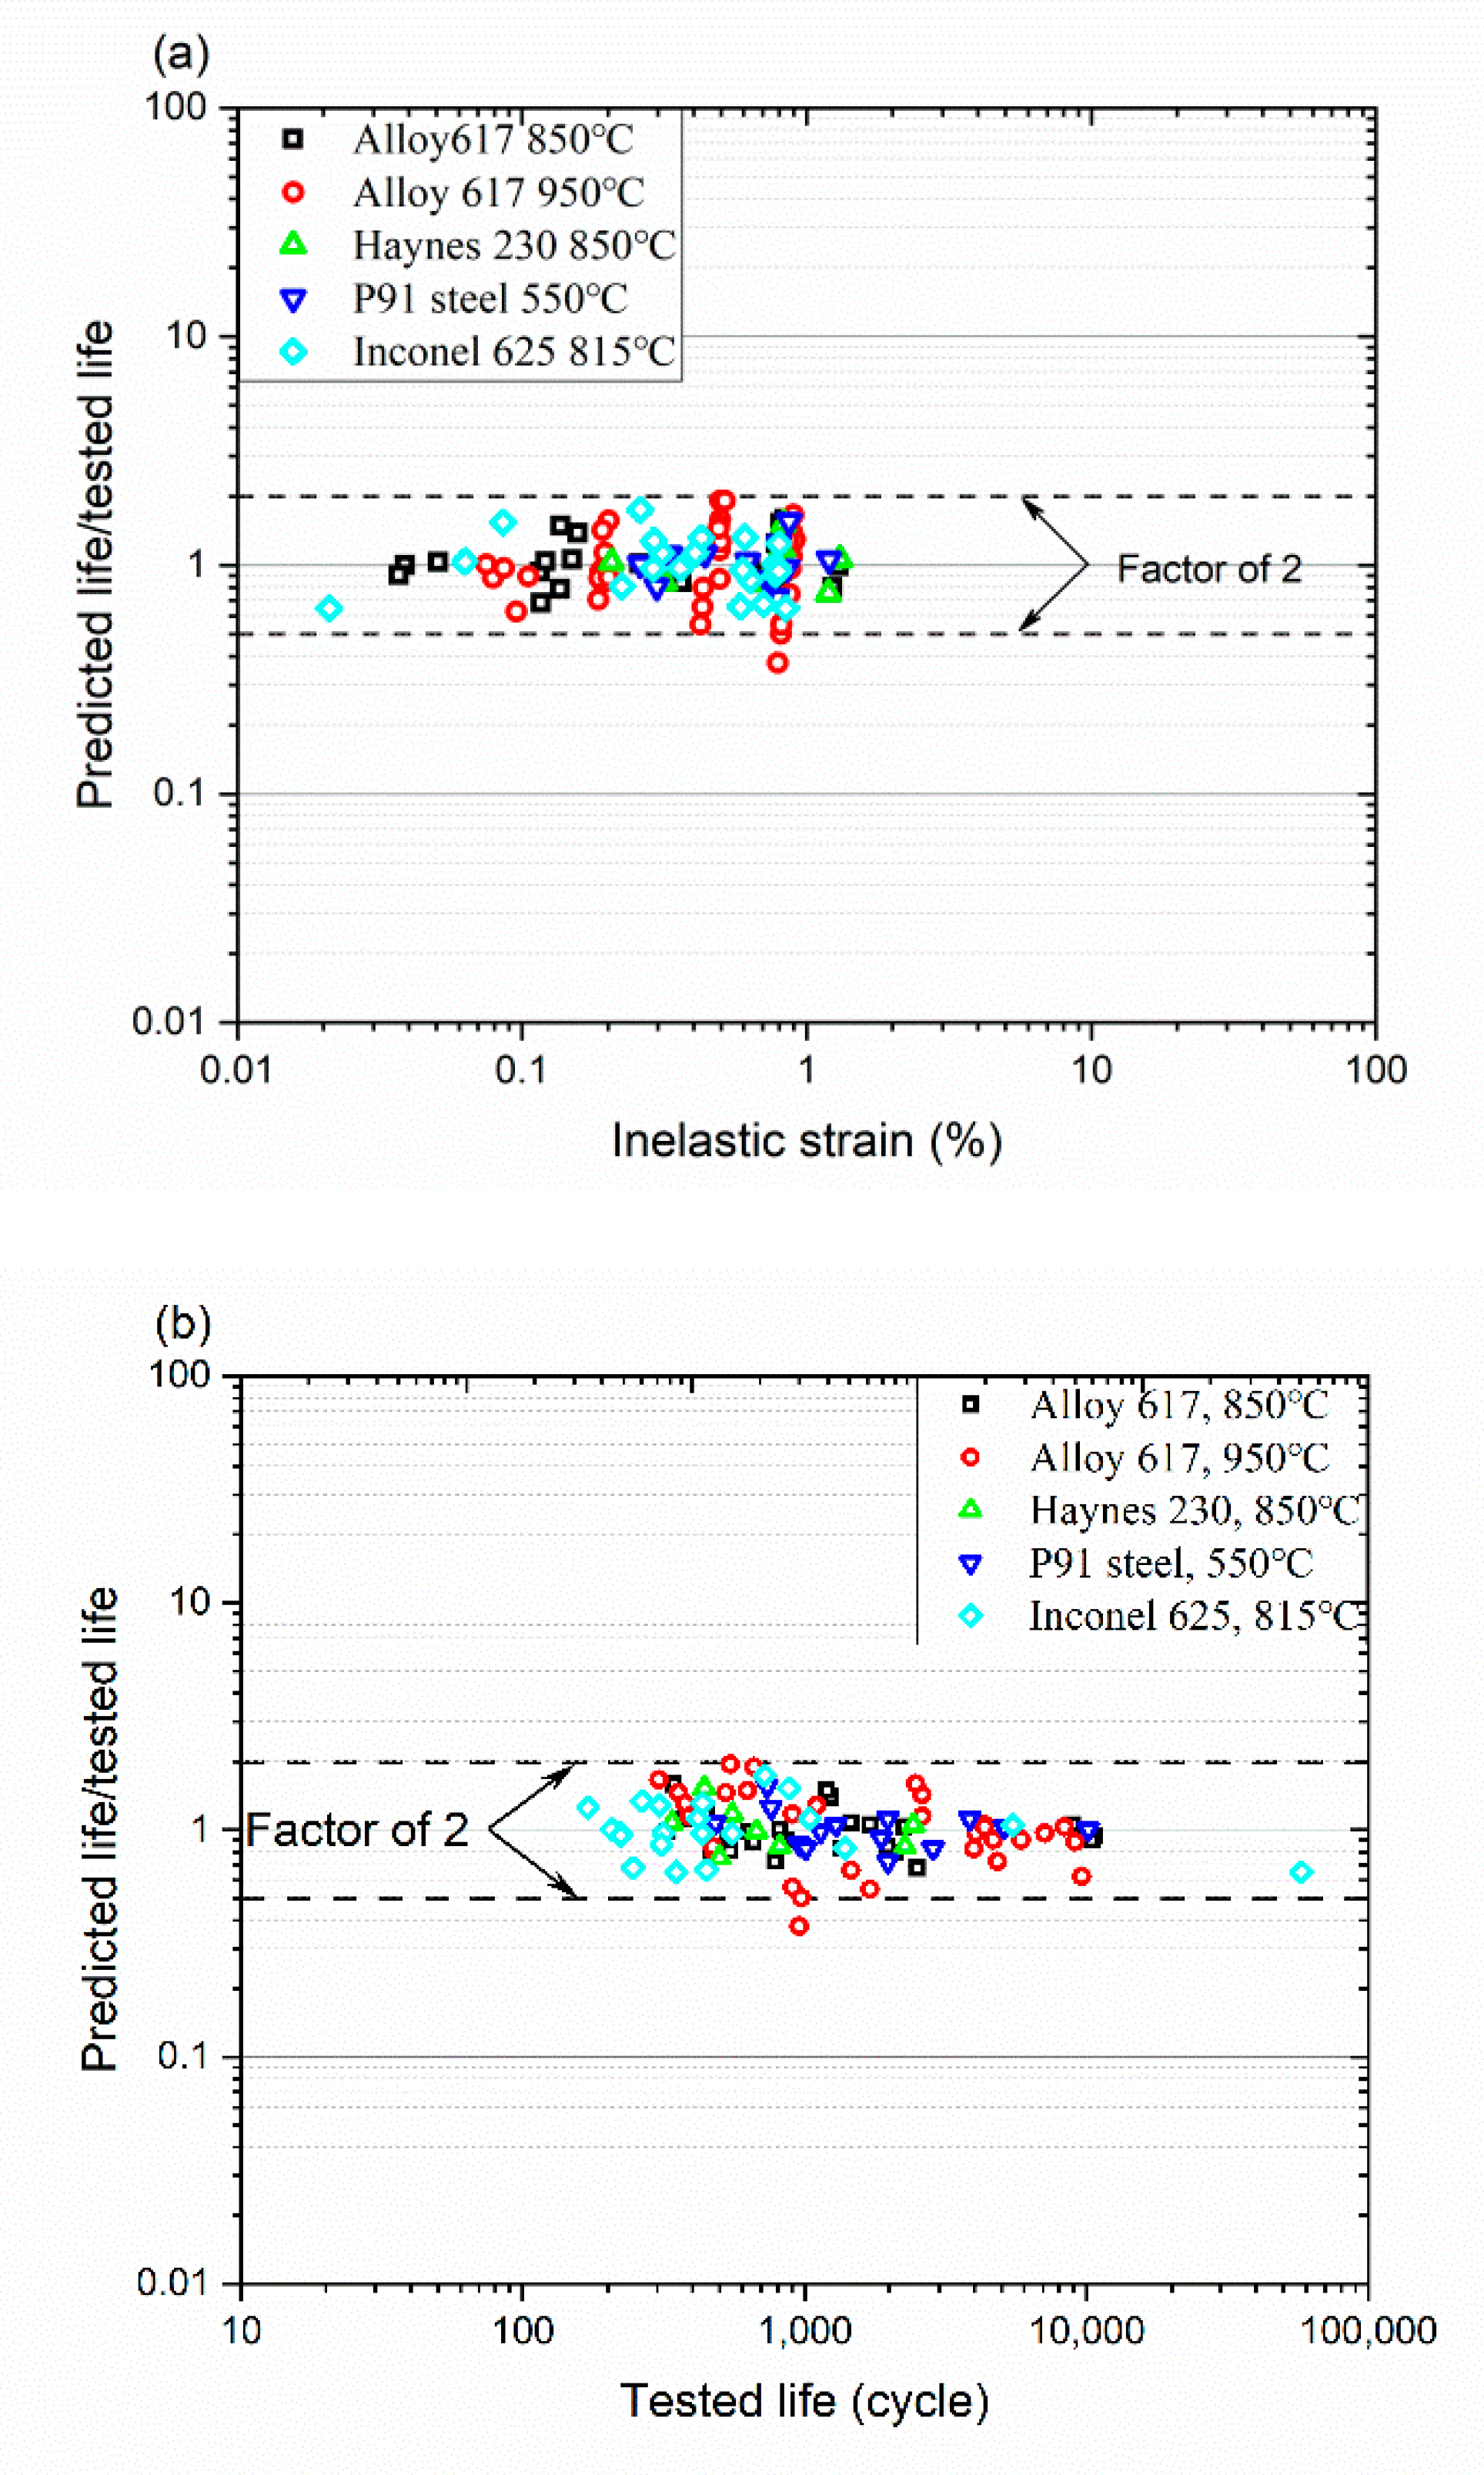
4.2. Fitting Procedure and Prediction Results

The cyclic hardening exponent n’ should be determined first by Equation (3) in order to calculate strain energy density. Figure 4 shows the cyclic stress and strain relation of Inconel 625 at 815 °C, where n’ is 0.171. The values of n’ and K’ for all the materials investigated are summarized in Table 2. The model constant γ was determined by trial and error when the optimum fit was achieved. Figure 5 shows the relation between fatigue life and total tensile strain energy density. The optimum fit was obtained when γ was chosen as 0.3, and the corresponding model constants a and b were 672.0 and −1.218, respectively. All the model constants employed in the present model are listed in Table 3. The model prediction results by the present model are shown in Figure 6a, in which 82% of the data points fall a scatter band of 1.5, and only one data point among the total 111 points lies outside the scatter band of 2.0. Hence, the present method can give reliable prediction results. The prediction result by the traditional energy method, in which the total hysteresis loop area was employed as a damage parameter, was also added for comparison and is shown in Figure 6b. Large prediction discrepancy can be observed, especially for Inconel 625, as shown in Figure 6b, since the predicted lives even were outside the scatter band of 4.0. Figure 6b indicates that the entire hysteresis loop was not a suitable damage parameter for both fatigue and creep-fatigue life evaluation. The main reason for the large prediction discrepancy may be attributed to the different damage mechanism at low- and high-cycle fatigue regime, since the life cycles of Inconel 625 investigated in this paper ranged from 170 to 57,342. The plastic strain was mainly applicable to low-cycle fatigue regime. The elastic strain energy component should be not neglected when they are adopted for both low- and high-cycle fatigue life evaluation.
The ratios of predicted life to tested life were adopted and calculated to evaluate the applicability, and the results were plotted against inelastic strain and test life, as shown in Figure 7. The inelastic strain range of the investigated deformed materials ranged from 0.00021 to 0.01308, and the life cycles ranged from 170 to 57,342. The lowest inelastic strain and life cycles were two orders of magnitude smaller than that at the highest values. However, good prediction performance was achieved with a wide range of inelastic strains and life cycles, which indicates the robustness and applicability of the proposed model.

4.3. Damage Interaction Diagram by the Present Model

The creep failure energy density ΔWc calculated by Equation (12) and applied stress amplitude σa is plotted in Figure 8, and a good linear relation was obtained between ΔWc and σa within a certain stress range. Hence, the ΔWc in this paper was assumed as a linear function of σa for calculation simplification. The results of accumulated fatigue damage, creep damage, and virtual elastic damage are plotted in Figure 9. The x axis, y axis, and z axis in Figure 9 represent the accumulated creep damage Dc, the accumulated fatigue damage Df, and the accumulated virtual elastic damage De, respectively. The accumulated creep damage for P91 steel at 550 °C and Alloy 617 at 850 °C in Figure 9 was significant since most creep damage values were larger than 1. The values of accumulated virtual elastic damage for P91 steel at 950 °C and Inconel 625 at 815 °C were relatively very small compared with that of Alloy 617 at 850 °C and P91 steel at 550 °C. The failure envelope surface was determined based on the test data and the definition of fatigue, creep, and virtual elastic damages. For Alloy 617 at 850 °C and 950 °C and Inconel 625 at 815 °C, the failure envelope surface Dc + Df + De = 0.5 can be adopted as a lower bound since all the data points were outside the proposed envelope surface, as shown in Figure 9a. For P91 steel at 550 °C, the surface Dc + Df + De = 1 can be adopted as the failure envelope surface, as shown in Figure 9b. It should be noted that a reliable and conservative failure envelope surface was chosen based on a large set of failure data, and the chosen failure envelope surface should be different for different materials.
The total damages were also calculated and plotted against the creep-fatigue life in Figure 10. The total damages for all the materials investigated tended to increase with increasing creep-fatigue life, and a linear relation was observed between total damage and creep-fatigue life for Alloy 617 at 850 and 950 °C. Several reasons can account for the above phenomenon. The fatigue damage per cycle, i.e., Equation (10), at a given test condition was invariable. Hence, the accumulated fatigue damage df was proportional to creep-fatigue life. The creep damage per cycle dc in this paper was defined as the ratio of creep energy density per cycle to accumulated creep failure energy density, and the values of dc were plotted against creep-fatigue life in Figure 11. The four bold, dashed lines in Figure 11 are the average values of dc. Though the values of dc fluctuated with creep-fatigue life, the fluctuation range was relatively very small for most data points, which can be seen in Figure 11. Moreover, the fatigue damage and creep damage accounted for a major part of total damage for the materials investigated. All of these may account for the increased total damage with increasing creep-fatigue life.

5. Conclusions

A new 3D creep-fatigue-elasticity damage interaction diagram was constructed based on a total tensile strain energy-based life prediction model for both high-temperature fatigue and creep-fatigue. The following conclusions can be concluded:
A new 3D creep-fatigue-elasticity damage interaction diagram was established based on a total tensile strain energy life prediction model, and the virtual elastic damage which can account for the high-cycle regime at elevated temperature was introduced. The total damage tended to increase with increasing creep-fatigue life.
The availability of 3D creep-fatigue-elasticity damage interaction diagram was verified by many high-temperature materials (Alloy 617 at 850 °C and 950 °C, Haynes 230 at 850 °C, P91 steel at 550 °C, and Inconel 625 at 815 °C).
The elastic strain energy component and mean stress effect were considered in the newly developed model, and good prediction performance was obtained since 82% of the data points fell a scatter band of 1.5, and nearly all the data points fell into a scatter band of 2.0.
The proposed model showed good prediction accuracy with a wide ranges of life cycles and inelastic strain, which indicate the applicability and robustness of the present method.

Author Contributions

Conceptualization, X.W. and N.Z.; Funding acquisition, X.W.; Investigation, Q.W.; Methodology, Q.W.; Supervision, X.W. and N.Z.; Validation, Q.W.; Writing—Original draft, Q.W.; Writing—Review & editing, X.W. and N.Z. All authors have read and agreed to the published version of the manuscript.

Funding

The present research was supported by the Natural Science Foundation of China (Nos. 11572170, 11872225).

Conflicts of Interest

The authors declare no conflict of interest.

References

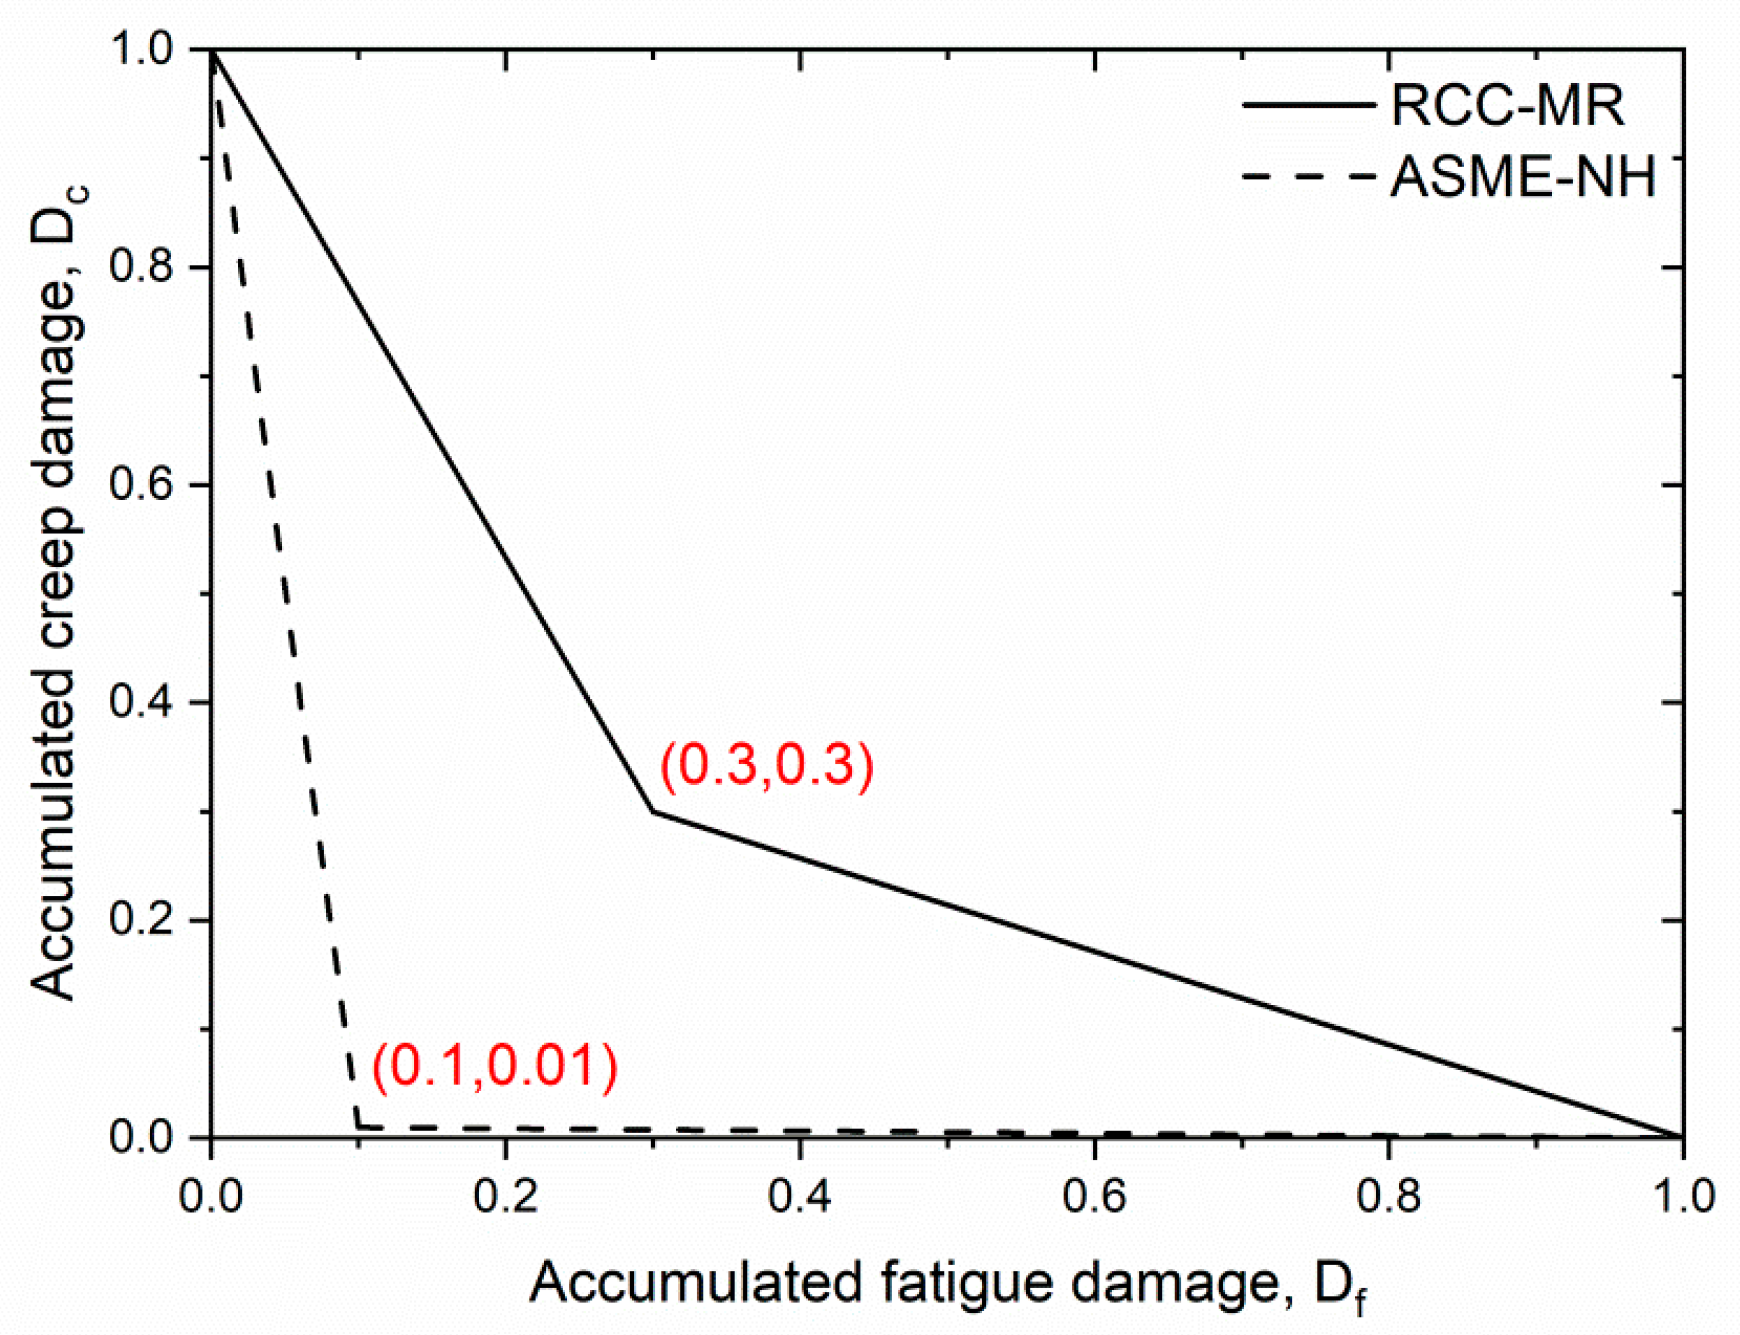
  1. ASME. Section III, Division 1, Subsection NH; ASME: New York, NY, USA, 2007. [Google Scholar]
  2. RCC-MR. Construction Rules for Mechanical Components of FBR Nuclear Islands; RCC-MR, Appendix A: Paris, France, 2002. [Google Scholar]
  3. Ainsworth, R.A. R5: Assessment Procedure for the High Temperature Response of Structures; British Energy Generation Ltd.: London, UK, 2003. [Google Scholar]
  4. Robinson, E.L. Effect of Temperature Variation on the Long-Time Rupture Strength of Steels; Trans. ASME: New York, NY, USA, 1952. [Google Scholar]
  5. Priest, R.H.; Ellison, E.G. A combined deformation map-ductility exhaustion approach to creep-fatigue analysis. Mater. Sci. Eng. 1981, 49, 7–17. [Google Scholar] [CrossRef]
  6. Asayama, T.; Tachibana, Y. Collect Available Creep-Fatigue Data and Study Existing Creep-Fatigue Evaluation Procedures for Grade 91 and Hastelloy XR; ASME Standards Technology, LLC.: New York, NY, USA, 2007. [Google Scholar]
  7. Takahashi, Y. Study on creep-fatigue evaluation procedures for high-chromium steels—Part I: Test results and life prediction based on measured stress relaxation. Int. J. Press. Vessels. Pip. 2008, 85, 406–422. [Google Scholar] [CrossRef]
  8. Yan, X.L.; Zhang, X.C.; Tu, S.T.; Mannan, S.L.; Xuan, F.Z.; Lin, Y.C. Review of creep–fatigue endurance and life prediction of 316 stainless steels. Int. J. Press. Vessels. Pip. 2015, 126, 17–28. [Google Scholar] [CrossRef]
  9. Wang, X.W.; Zhang, W.; Gong, J.M.; Wahab, M.A. Low cycle fatigue and creep fatigue interaction behavior of 9Cr-0.5 Mo-1.8 WV-Nb heat-resistant steel at high temperature. J. Nucl. Mater. 2018, 505, 73–84. [Google Scholar] [CrossRef]
  10. Mannan, S.L.; Valsan, M. High-temperature low cycle fatigue, creep–fatigue and thermomechanical fatigue of steels and their welds. Int. J. Mech. Sci. 2006, 48, 160–175. [Google Scholar] [CrossRef]
  11. Date, S.; Ishikawa, H.; Otani, T.; Takahashi, Y.; Nakazawa, T. Study on environmental effect on fatigue and creep-fatigue strength of 316FR stainless steel in sodium at elevated temperature. Nucl. Eng. Des. 2008, 238, 353–367. [Google Scholar] [CrossRef]
  12. Carroll, L.J.; Lloyd, W.R.; Simpson, J.A.; Wright, R.N. The influence of dynamic strain aging on fatigue and creep-fatigue characterization of nickel-base solid solution strengthened alloys. Mater. High. Temp. 2010, 27, 313–323. [Google Scholar] [CrossRef]
  13. Reddy, G.P.; Mariappan, K.; Kannan, R.; Sandhya, R.; Sankaran, S.; Rao, K.B.S. Effect of strain rate on low cycle fatigue of 316LN stainless steel with varying nitrogen content: Part-II fatigue life and fracture. Int. J. Fatigue 2015, 81, 309–317. [Google Scholar] [CrossRef]
  14. Wang, X.; Zhang, W.; Gong, J.; Jiang, Y. Experimental and numerical characterization of low cycle fatigue and creep fatigue behaviour of P92 steel welded joint. Fatigue Fract. Eng. Mater. Struct. 2018, 41, 611–624. [Google Scholar] [CrossRef]
  15. Golanski, G.; Zielinska-Lipiec, A.; Zielinski, A.; Sroka, M. Effect of long-term service on microstructure and mechanical properties of martensitic 9% Cr Steel. J. Mater. Eng. Perform. 2017, 26, 1101–1107. [Google Scholar] [CrossRef] [Green Version]
  16. Zieliński, A.; Dobrzański, J.; Purzyńska, H.; Golański, G. Properties, structure and creep resistance of austenitic steel Super 304H. Mater. Test. 2015, 57, 859–865. [Google Scholar] [CrossRef]
  17. Coffin, J.L. Fatigue at high temperature-prediction and interpretation. Proc. Inst. Mech. Eng. 1974, 188, 109–127. [Google Scholar] [CrossRef]
  18. Coffin, J.L. Fatigue at High Temperature, Fatigue at Elevated Temperatures; ASTM International: New York, NY, USA, 1973. [Google Scholar]
  19. Halford, G.R.; Hirschberg, M.H.; Manson, S.S. Creep fatigue analysis by strain-range partitioning. In Proceedings of the First symposium on design for elevated temperature environment, San Francisco, CA, USA, 10–12 May 1971; pp. 12–28. [Google Scholar]
  20. Callaghan, M.D.; Humphries, S.; Law, M.; Ho, M.; Bendeich, P.; Li, H.; Yeung, W. Energy-based approach for the evaluation of low cycle fatigue behaviour of 2.25 Cr–1Mo steel at elevated temperature. Mater. Sci. Eng. A 2010, 527, 5619–5623. [Google Scholar] [CrossRef]
  21. Lee, K.O.; Hong, S.G.; Lee, S.B. A new energy-based fatigue damage parameter in life prediction of high-temperature structural materials. Mater. Sci. Eng. A 2008, 496, 471–477. [Google Scholar] [CrossRef]
  22. Oldham, J.; Abou-Hanna, J. A numerical investigation of creep-fatigue life prediction utilizing hysteresis energy as a damage parameter. Int. J. Press. Vessels. Pip. 2011, 88, 149–157. [Google Scholar] [CrossRef]
  23. Payten, W.M.; Dean, D.W.; Snowden, K.U. A strain energy density method for the prediction of creep–fatigue damage in high temperature components. Mater. Sci. Eng. A 2010, 527, 1920–1925. [Google Scholar] [CrossRef]
  24. Skelton, R. The energy density exhaustion method for assessing the creep-fatigue lives of specimens and components. Mater. High. Temp. 2013, 30, 183–201. [Google Scholar] [CrossRef]
  25. Takahashi, Y.; Dogan, B.; Gandy, D. Systematic evaluation of creep-fatigue life prediction methods for various alloys. J. Press. Vessel. Technol. 2013, 135, 061204. [Google Scholar] [CrossRef]
  26. Wang, R.Z.; Zhang, X.C.; Tu, S.T.; Zhu, S.P.; Zhang, C.C. A modified strain energy density exhaustion model for creep–fatigue life prediction. Int. J. Fatigue 2016, 90, 12–22. [Google Scholar] [CrossRef]
  27. Wang, R.Z.; Zhu, X.M.; Zhang, X.C.; Tu, S.T.; Gong, J.G.; Zhang, C.C. A generalized strain energy density exhaustion model allowing for compressive hold effect. Int. J. Fatigue 2017, 104, 61–71. [Google Scholar] [CrossRef]
  28. Zhu, S.P.; Huang, H.Z.; He, L.P.; Liu, Y.; Wang, Z. A generalized energy-based fatigue–creep damage parameter for life prediction of turbine disk alloys. Eng. Fract. Mech. 2012, 90, 89–100. [Google Scholar] [CrossRef]
  29. Zhu, S.P.; Huang, H.Z. A generalized frequency separation–strain energy damage function model for low cycle fatigue–creep life prediction. Fatigue Fract. Eng. Mater. Struct. 2010, 33, 227–237. [Google Scholar] [CrossRef]
  30. Fan, Y.N.; Shi, H.J.; Tokuda, K. A generalized hysteresis energy method for fatigue and creep-fatigue life prediction of 316L (N). Mater. Sci. Eng. A 2015, 625, 205–212. [Google Scholar] [CrossRef]
  31. Ellyin, F.; Kujawski, D. An energy-based fatigue failure criterion. Microstruct. Mech. Behav. Mater. 1985, 2, 591–600. [Google Scholar]
  32. Golos, K.; Ellyin, F. A total strain energy density theory for cumulative fatigue damage. J. Press. Vessel. Technol. 1988, 110, 36–41. [Google Scholar] [CrossRef]
  33. Golos, K.; Ellyin, F. Total Strain Energy Density as a Fatigue Damage Parameter; Advances in Fatigue Science and Technology; Springer: Dordrecht, The Netherlands, 1989; pp. 849–858. [Google Scholar]
  34. Fournier, B.; Sauzay, M.; Caës, C.; Noblecourt, M.; Mottot, M.; Bougault, A.; Rabeau, V.; Pineau, A. Creep-fatigue-oxidation interactions in a 9Cr–1Mo martensitic steel. Part II: Effect of compressive holding period on fatigue lifetime. Int. J. Fatigue 2018, 30, 663–676. [Google Scholar] [CrossRef]
  35. Li, S.X.; Smith, D.J. High temperature fatigue-creep behaviour of single crystal SRR99 nickel base superalloys: Part ii—Fatigue-creep life behaviour. Fatigue Fract. Eng. Mater. Struct. 1995, 18, 631–643. [Google Scholar] [CrossRef]
  36. Ostergren, W. A damage function and associated failure equations for predicting hold time and frequency effects in elevated temperature, low cycle fatigue. J. Test. Eval. 1976, 4, 327–339. [Google Scholar]
  37. Choudhary, B.K.; Christopher, J. Influence of temperature and strain rate on tensile deformation and fracture behaviour of boron added P91 steel. Int. J. Press. Vessels. Pip. 2019, 171, 153–161. [Google Scholar] [CrossRef]
  38. Choudhary, B.K.; Srinivasan, V.S.; Mathew, M.D. Influence of strain rate and temperature on tensile properties of 9Cr–1Mo ferritic steel. Mater. High. Temp. 2011, 28, 155–161. [Google Scholar] [CrossRef]
  39. Führer, U.; Aktaa, J. Modeling the cyclic softening and lifetime of ferritic-martensitic steels under creep-fatigue loading. Int. J. Mech. Sci. 2018, 136, 460–474. [Google Scholar] [CrossRef]
  40. Ruggles, M.; Ogata, T. Creep-Fatigue Criteria and Inelastic Behavior of Modified 9Cr-1Mo Steel at Elevated Temperatures; Final Report; Oak Ridge National Lab, Electric Power Research Instituion: Palo Alto, CA, USA, 1994. [Google Scholar]
  41. Bui-Quoc, T.; Gomuc, R.; Biron, A.; Nguyen, H.; Masounave, J. Elevated Temperature Fatigue-Creep Behavior of Nickel-Base Superalloy IN 625, Low Cycle Fatigue; ASTM International: West Conshohocken, PA, USA, 1988. [Google Scholar]
  42. Carroll, L.; Carroll, M. Creep-Fatigue Behavior of Alloy 617 at 850 and 950; Idaho National Laboratory (INL): Idaho Falls, ID, USA, 2013. [Google Scholar]
  43. Chen, X. High Temperature Creep-Fatigue Behavior of Alloy 617 and Alloy 230; University of Illinois at Urbana-Champaign: Illinois, IL, USA, 2012. [Google Scholar]
  44. Dundulis, G.; Janulionis, R.; Grybėnas, A.; Makarevičius, V.; Dundulis, R. Numerical and experimental investigation of low cycle fatigue behaviour in P91 steel. Eng. Fail. Anal. 2017, 79, 285–295. [Google Scholar] [CrossRef]
  45. Purohit, A.; Burke, W.F. Elevated Temperature Creep Behavior of Inconel Alloy 625; Argonne National Lab.: Illinois, IL, USA, 1984. [Google Scholar]
  46. Special Metals Corporation. Available online: https://www.specialmetals.com/assets/smc/documents/alloys/inconel/inconel-alloy-625.pdf (accessed on 13 August 2013).
  47. Kim, W.G.; Park, J.Y.; Lee, G.G.; Hong, S.D.; Kim, Y.W. Temperature effect on the creep behavior of alloy 617 in air and helium environments. Nucl. Eng. Des. 2014, 271, 291–300. [Google Scholar] [CrossRef]
  48. Wang, Z.Q.; Denlinger, E.; Michaleris, P.; Stoica, A.D.; Ma, D.; Beese, A.M. Residual stress mapping in Inconel 625 fabricated through additive manufacturing: Method for neutron diffraction measurements to validate thermomechanical model predictions. Mater. Des. 2017, 113, 169–177. [Google Scholar] [CrossRef] [Green Version]
Figure 1. Schematic illustration of total tensile strain energy density in different loading waveforms. (a): tension-hold creep-fatigue loading; (b): compression-hold creep-fatigue loading.
Metals 10 00274 g001
Figure 2. Damage interaction diagram of P91 steel in time fraction method.
Metals 10 00274 g002
Figure 3. The relation between elastic modulus and temperature of Inconel 625.
Metals 10 00274 g003
Figure 4. The cyclic stress strain relation of Inconel 625 at 815 °C.
Metals 10 00274 g004
Figure 5. The relation between fatigue life and total tensile strain energy density of Inconel 625.
Metals 10 00274 g005
Figure 6. Model predictions by (a) present model and (b) traditional energy-based model.
Metals 10 00274 g006aMetals 10 00274 g006b
Figure 7. Predicted life/tested life versus (a) inelastic strain and (b) tested life.
Metals 10 00274 g007
Figure 8. The relation between creep failure density and applied stress.
Metals 10 00274 g008
Figure 9. Damage interaction diagrams (a) Alloy 617 at 850 °C and 950 °C, Inconel 625 at 815 °C and (b) P91 steel at 550 °C.
Metals 10 00274 g009
Figure 10. Total damage vs. creep-fatigue life.
Metals 10 00274 g010
Figure 11. Creep damage per cycle versus creep-fatigue life.
Metals 10 00274 g011
Table 1. Collected high-temperature fatigue and creep-fatigue test data.
MaterialT (°C)∆εt (%)th (min)Life Ranges (cycles)Reference
TCS
P91 steel5500.50–1.500/10/6010/6010/60488–10120[39,40]
Inconel 6258150.37–1.220/1/5/10/15/305/150170–57342[41]
Alloy 6178500.30–1.500/3/10/3000332–10631[42,43]
Alloy 6179500.30–1.000/3/10/30/15000308–9641[42]
Haynes 2308500.50–1.500/3/10/3000340–2295[43]
Table 2. Cyclic hardening exponents and coefficients.
MaterialT (°C) ε   ˙ ( % / s ) n’K’
P91 steel 5500.10.0899479.38
Inconel 6258151.00.17101338.40
Alloy 6178500.10.0645360.34
Alloy 6178500.0250.0352294.48
Alloy 6179500.1−0.1100117.77
Haynes 2308500.0250.0463376.02
Table 3. Model constants in the present model.
MaterialT (°C) ε   ˙ ( % / s ) γab
P91 steel 5500.1−2.22450.4−1.392
Inconel 6258151.00.3672.0−1.218
Alloy 6178500.111.71156.1−0.800
Alloy 6178500.02530.01766.9−0.861
Alloy 6179500.13.2658.4−1.365
Haynes 2308500.0250.11243.5−1.047

