Abstract
Fatigue–creep interaction (FCI) responses of P92 steel are investigated experimentally and numerically. A series of isothermal FCI experiments with tensile dwell time ranging from 60 to 600 s were conducted at two temperatures under strain-controlled trapezoidal waveform. The experimental responses demonstrate that the peak stress is influenced by temperature and dwell time. In other words, creep-mechanism-influenced stress relaxation during dwell time influences the peak stress and fatigue life (Nf). In addition, effects of strain range on peak stress and fatigue life under fatigue–creep loading are evaluated. Towards developing a simulation-based design methodology for high temperature components, first a conventional unified constitutive model is evaluated against the P92 steel experimental responses. Based on the simulation deficiency of the conventional model, a modified static recovery term incorporated in the kinematic hardening rule is proposed and satisfactory simulations of the P92 steel FCI responses are demonstrated. The experimental responses of P92 steel and strengths and deficiencies of the conventional and modified Chaboche models are elaborated identifying the important FCI phenomena and progress in constitutive model development for FCI response simulation.
1. Introduction
ASME grade P92 steel is widely used as steam pipes and header components in ultra-supercritical (USC) fossil power plants due to its outstanding thermo-mechanical properties, good weldability and corrosion resistance [1,2,3,4]. In recent years, USC power plants have experienced start-up and shutdown at a higher rate than originally designed because of increased availability of renewable energy [5]. In USC power plants, creep damage accumulates during steady operation at elevated temperature, whereas start-up and shut-down induce fatigue damage, resulting in fatigue–creep damage interactions [6,7,8]. These complex damage interactions often lead to premature failure of high temperature USC power plant components, which were originally designed for steady creep only [9]. In order to assess remaining fatigue life of existing USC plants with increased number of start-up and shut-down cycles, it is essential to understand the fatigue–creep failure mechanisms and develop robust constitutive models towards developing a simulation-based life estimation and high temperature design methodologies.
Experimental investigations on fatigue–creep failures of various alloys have been conducted by employing tension and/or compression peak strain dwell loading cycles [10,11]. For 316L stainless steel, Srinivasan [12] observed that loading cycle with dwell period leads to reduction of cyclic stresses. They also demonstrated that at elevated temperature, stress relaxation occurs during the strain-controlled dwell period, and the fatigue life decreases with the increase in dwell period. Shankar [13] reported that the stress relaxation response of a Ferritic-Martensitic steel is dependent on strain amplitude. Barrett [14] performed a series of strain-controlled cyclic experiments with compressive strain dwell at seven different temperatures and concluded that stress relaxation of Haynes 230 is influenced by temperature. However, experimental studies on fatigue–creep interaction, damage accumulation and fatigue life on P92 steel are limited. Zhang [15] and Wang [16] performed various fatigue and fatigue–creep experiments on P92 steel to demonstrate cyclic softening and relaxation responses. In addition, the available fatigue–creep data in the literature are extremely limited in terms of developing a simulation-based design methodology, and therefore, this study made an effort to develop a complimentary set of fatigue–creep data on P92 steel with the objective of investigating fatigue–creep interaction responses and thereby facilitate the development of a simulation-based life estimation methodology.
In order to simulate cyclic responses of various alloys, e.g., cyclic hardening/softening, relaxation and ratcheting unified viscoplastic models have been proposed [17,18]. In general, cyclic hardening/softening is modeled by introducing isotropic hardening variables, which primarily simulates yield surface evolutions through increase/decrease of its size. Yaguchi and Takahashi [19] reported that cyclic softening of 9Cr-1Mo (P91) steel at different temperatures and strain ranges can be simulated by isotropic hardening rules. Kang [20] modified the simulation of cyclic hardening of 304 stainless steel by including a term in dynamic recovery of the kinematic hardening rule. Yang [21] modified the isotropic rule by incorporating the maximum inelastic strain to simulate cyclic hardening as well as hardening during monotonic tensile loading. It is noted that Barrett [14] and Krishna [22] reported the yield surface sizes of HA230 and SS304, respectively, remain unchanged under cyclic loading. Consequently, cyclic hardening/softening of HA230 and SS304 can be simulated through evolution of kinematic hardening variables without introducing any isotropic hardening parameters [22,23]. Similarly, Zhou [24] employed a new kinematic coefficient, which is dependent on accumulated inelastic strain to describe cyclic hardening.
The modeling of stress relaxation or viscous (creep) deformation during dwell period is important to investigate the fatigue–creep interaction and corresponding damage accumulation. Several model development investigations demonstrated that static recovery term in kinematic variables can improve the simulation of stress relaxation [23,25]. Yaguchi and Takahashi [19] employed static recovery term in the kinematic hardening rule to capture creep and stress relaxation behaviors of modified 9Cr-1Mo steel. Kan [26] also demonstrated that the static recovery term plays an important role in simulating time-dependent ratchetting at room to high temperatures. Even when the viscosity is not significant, the stress relaxation during fatigue–creep interaction loading can still be simulated with the aid of static recovery term [23]. Recently, Chen [27] extended a constitutive model with a static recovery term to capture the creep and stress relaxation under alternate stress and strain dwell. However, different materials exhibit different cyclic responses [13,14,28], which motivates us to investigate P92 fatigue–creep interaction responses and corresponding constitutive modeling.
In this study, first, a set of strain-controlled isothermal experiments were conducted to investigate the fatigue–creep responses of P92 steel. Next, a conventional Chaboche constitutive model was evaluated in simulating these cyclic responses to determine the deficiencies of the model. To overcome the deficiencies, a modified constitutive model with cycle-dependent static recovery term was developed, and a set of optimal parameters were determined. The simulation capability of the modified constitutive model was demonstrated through comparing the experimental and simulated responses. In addition, the experimental and simulated responses were critically evaluated in order to reveal the current state knowledge and progresses made in constitutive modeling of FCI responses of for P92 steel.
2. Material, Specimens and Experiments
The P92 steel specimens were extracted from a pipe with 105 mm outer diameter and 25 mm thickness. The specimens were heat treated at 1040 °C for 20 min (normalized) followed by 780 °C for 120 min (tempered). The chemical compositions of P92 steel are listed in Table 1. The tempered martensitic structure with prior austenite grains, packets, blocks, martensitic laths and subgrains, as shown in Figure 1, contributes to the excellent high temperature performance of P92 steel [29,30]. Cylindrical dogbone specimens with 25 mm gauge length and 8 mm gauge diameter, as shown in Figure 2, were used to conduct the fatigue–creep tests by prescribing trapezoid loading waveform with dwell times ranging from 60 to 600 s, strain range of 0.8% or 1.2%, with a constant strain rate of 1 × 10⁻³ s−1 at 600 or 650 °C as shown in Table 2.

Table 1.
Chemical compositions of P92 steel (wt. %).
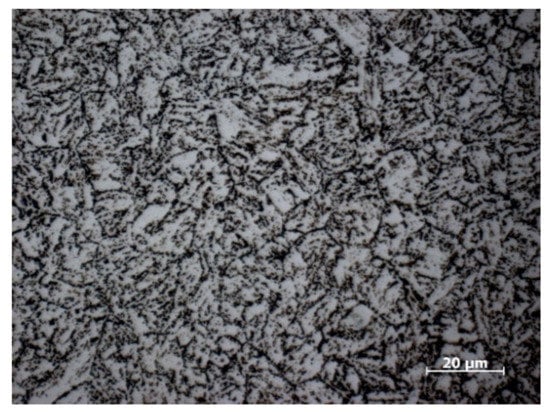
Figure 1.
Optical micrograph of the investigated P92 steel.
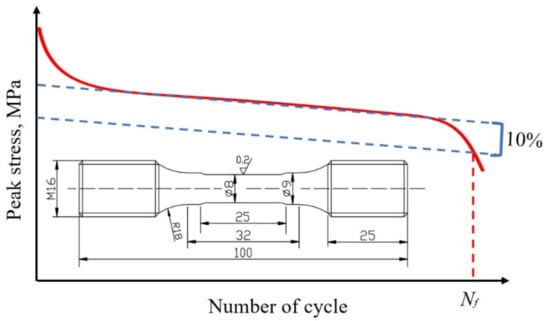
Figure 2.
Geometry of specimen (inset figure) and determination of fatigue life (Nf).
Table 2.
Fatigue–creep tests performed, test parameters prescribed and fatigue life determined.
All experiments were performed in air using a fatigue test machine with a heating furnace. During test period, the temperature along the gauge section was controlled within ±2 °C of the desired temperature, which was measured by three K-type thermocouples tied to the specimen surface. Strain was measured using a high temperature extensometer.
3. Experimental Observations
3.1. Dwell Time Effect
Figure 3 shows the peak stress evolution under fatigue–creep loading at different dwell times. Note in this figure that the cyclic softening exhibits three stages, which are rapid softening due to dislocation annihilation during initial stage; linear softening due to coarsening of laths and subgrains during intermediate stage; and finally, the accelerated softening due to macro cracking (also observed by Wang [32]). This mode of cyclic softening remains unchanged with the increase of dwell time, but the magnitude of cyclic softening is increased with dwell time. To further explore the cyclic softening response of P92 steel, a parameter called “softening ratio” is defined as the ratio of peak tensile stress at half fatigue life, Nhalf-life (Nf/2), to the peak tensile stress in the first cycle and plotted in Figure 4. This figure indicates that with increase of dwell time the softening ratio or cyclic softening of P92 steel gradually increases for both temperatures studied.
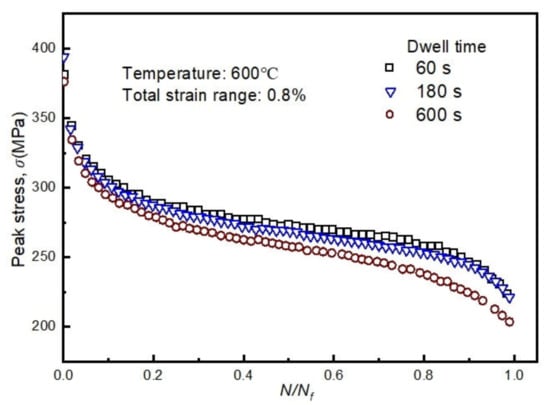
Figure 3.
Cyclic softening curves of P92 steel at different dwell times.
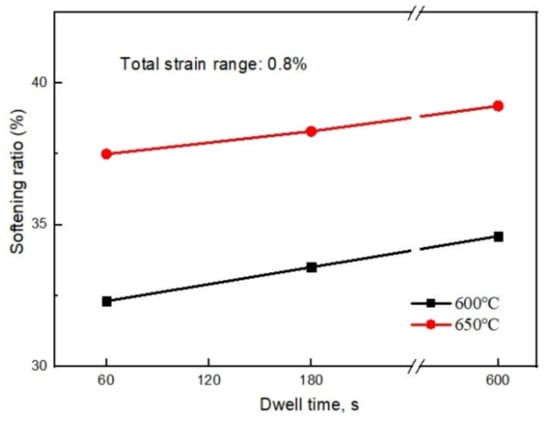
Figure 4.
Variation of softening ratio at different dwell times and different temperatures.
It is well known that stress relaxation occurs during strain dwell as shown in Figure 5, and the total relaxed stress is determined as the stress difference between start and end of strain dwell. Figure 5 demonstrates the evolution of relaxed stress against the number of cycles. Again, three stages of relaxation, similar to cyclic softening stages, are observed in Figure 5 despite that the experimental data are scattered. Interestingly, the qualitative nature of cyclic softening and stress relaxation trends with cycle are similar and share almost identical transition points (20% Nf) observed by comparing responses in Figure 3 and Figure 5. This indicates a strong correlation between cyclic softening and stress relaxation behaviors. Notably, the stress relaxation increases with strain dwell time. Moreover, it is noted in Figure 5 that similar stress relaxation responses are achieved with dwell times of 180 and 600 s, which indicates that the relaxed stress of P92 steel reaches the saturation with 180 s of dwell time. That means that any further increase in dwell time will not have any effect on the relaxed stress of P92 steel with 0.8% strain range at 600 °C.
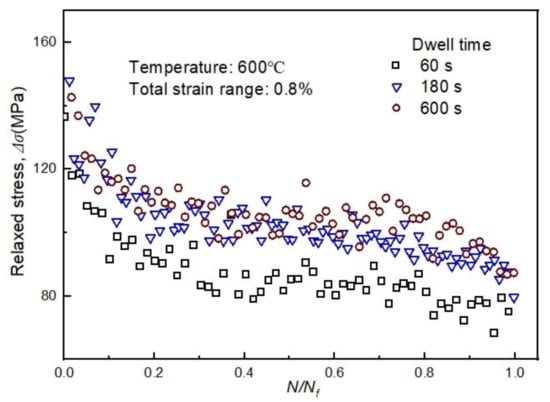
Figure 5.
The evolution of relaxed stress at different dwell times.
Finally, fatigue life data in Table 2 indicates that the life decreases with an increase in dwell time. In this regard, it is interesting to note that as dwell time is increased from 60 to 180 s, not much difference in cyclic softening is observed (Figure 3), but small reduction in stress relaxation and small reduction in fatigue life are observed. When dwell time is increased from 180 to 600 s, small reduction in cyclic softening is observed (Figure 3), and the stress relaxation response is almost overlapped (Figure 5), but the fatigue life is reduced from 1190 to 675 cycles at 600 °C, and from 853 to 625 cycles at 650 °C. This complex fatigue–creep interaction influence on fatigue life is still unknown and hence warrants relevant macro- and microstructural investigations.
3.2. Temperature Effect
The evolution of peak stress and relaxed stress responses from 600 and 650 °C tests with 0.8% strain range and different dwell times are plotted in Figure 6. In this figure, it is observed that the peak stress responses are reduced with temperature, which has been demonstrated in earlier literature [14,33,34]. However, it is worth noting that the slope of linear stage of cyclic softening curve is unaffected by the temperature (Figure 6). Moreover, despite the significant difference in peak stress response, the relaxed stress responses are very similar under different temperatures. Stress relaxation is known to be influenced by temperature increase, at the same time, stress relaxation is also dependent on the peak stress at the inception of relaxation. Hence, low stress peaks at high temperature reduce stress relaxation. Consequently, influences of these two stress relaxation parameters counteract to result in similar stress relaxation responses, which seems temperature insensitive, as shown in Figure 6.
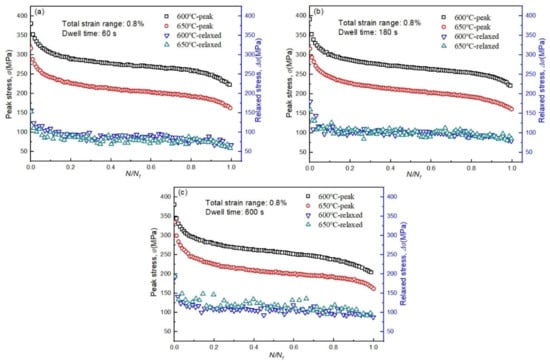
Figure 6.
The evolution of peak stress and relaxed stress at different temperatures 600 and 650 °C, and dwell times (a) 60 s, (b) 180 s and (c) 600 s.
The influence of temperature on fatigue life is observed in Table 2, where the reduction in fatigue life with increase in temperature is more significant for 0.8% strain range than that for 1.2% strain range.
3.3. Strain Range Effect
Figure 7 shows the effect of strain range on cyclic softening and stress relaxation responses. Again, the two cyclic softening curves at strain ranges of 0.8% and 1.2% in Figure 7a have similar shape. Despite significant scatter in stress relaxation responses, Figure 7b shows small effect of strain range on stress relaxation. The influence of strain range on fatigue life can be observed in Table 2.
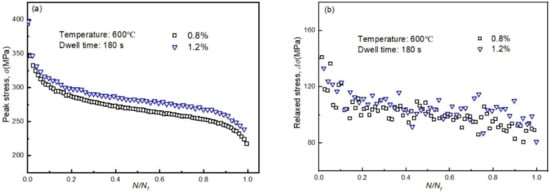
Figure 7.
The evolution of, (a) peak stress and (b) relaxed stress showing the influence of strain range with 180 s dwell time at 600 °C.
The fatigue–creep experimental data developed in this study demonstrated the complex interaction of dwell time, temperature and strain range on fatigue life. Consequently, estimating fatigue life of P92 steel under fatigue–creep loading is a significant challenge. Hence, this study has the long-term goal of developing a constitutive model simulation-based fatigue life estimation methodology. With this goal, a conventional and a modified constitutive models are evaluated below for simulating the P92 steel responses observed.
4. Unified Viscoplastic Constitutive Model
4.1. Conventional Chaboche Model
The constitutive equations of the conventional Chaboche viscoplastic model [35] used in this study are shown in Table 3. First, the total strain is assumed to be decomposed into elastic () and inelastic () components, as expressed in Equation (1).
Table 3.
Constitutive equations of the conventional Chaboche viscoplastic model.
The elastic strain is calculated using Hooke’s law (not shown), and the rate of inelastic strain using the viscoplastic flow rule in Equation (2). It determines the rate of viscous overstress relaxation towards the yield surface with time during the dwell time [23]. The Macaulay bracket (< >) in Equation (2) is defined as <x> = 0 if x < 0 and <x> = x if x ≥ 0. The sign function (sgn) is defined as sgn(x) = −1 if x < 0 and sgn(x) = 1 if x ≥ 0. Z and n are material constants used to describe the time-dependent deformation. Equation (4) is the von Mises yield function. In Equation (5), back stress χ is the center of yield surface and mainly responsible for the depiction of Bauschinger phenomenon during cycling. Two decomposed terms of kinematic hardening variables are used in this study. Variable describes the initial hardening, while describes the hardening at large strain. The classical Armstrong–Frederick form of kinematic hardening rule is employed to describe individual back stress, as expressed in Equation (6), which incorporates linear hardening term and dynamic recovery term; ai and Ci are material parameters, which represent stable value of each kinematic variable and the rate to reach the stable value. Equation (7) depicts the relationship between and . is the accumulated inelastic strain rate. Isotropic hardening parameter R in Equation (4) is used to describe the cyclic hardening or softening behavior through increase or decrease of yield surface size. The rate of yield surface size change is given by Equation (8), where the material parameter Q is the asymptotic value of saturated R, and b controls the rate to reach the saturation to cyclic hardening/softening.
4.2. Simulation Capability of the Conventional Chaboche Model
The simulations by the conventional Chaboche model [35] compared against the experimental data of 0.8% strain range with 180 s tensile dwell time at 600 °C are shown in Figure 8. In Figure 8a, it is observed that both the first and half-life hysteresis loops are simulated very well, however, the intermediate loops are not simulated well as can be realized from the peak stress responses in Figure 8d. The experimental and simulated stress relaxation responses during the tensile dwell time are compared in Figure 8b, where it is observed that the first cycle response is simulated reasonably, but the half-life cycle is overestimated. This overestimation for the subsequent to initial cycles is clearly depicted in Figure 8c. As discussed in Section 3, the relaxed stress reduces rapidly during the initial cycles before saturation; however, the simulated relaxed stress with cycle is almost unchanged as shown in Figure 8c. Moreover, the conventional model also demonstrated drawbacks in capturing peak stress evolution (Figure 8d). The P92 steel shows non-saturated cyclic softening response [16,36,37] as shown in Figure 8d, which the conventional model is unable to simulate. Such drawbacks in the simulating fatigue–creep responses motivated us in modifying the Chaboche model as presented and discussed below.
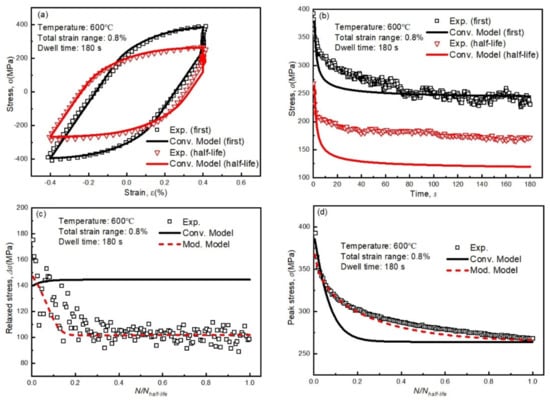
Figure 8.
Comparison of simulated and experimental responses for 0.8% total strain range with 180 s tensile dwell time at 600 °C, (a) hysteresis loops at the first and half-life cycles; (b) stress relaxation during dwell time at the first and half-life cycles; (c) relaxed stress evolution with cycle; (d) peak tensile stress evolution with cycle.
4.3. Modification of Constitutive Model
Fatigue–creep loading for many critical high temperature components is a more realistic loading compared to pure fatigue or pure creep loading. Hence, simulation of stress relaxation and hysteresis loop responses under fatigue–creep loading are critical for developing a simulation-based life estimation technique [38,39]. Simulation of the peak stress evolution is critical, because most life estimation techniques are based on peak stress [10,37]. To improve the fatigue–creep response simulations by the conventional Chaboche model, the following model modifications are made.
4.3.1. Modification of the Kinematic Hardening Rule
It has been demonstrated that during the dwell time stress relaxation, annihilation of dislocation, recrystallization and coarsening take place [27]. Chaboche and Nouailhas [40] suggested constitutive modeling to imitate influence of microstructural evolution on macroscale responses. Along that line, Ahmed [23] reported that once the viscous overstress during the dwell time is completely relaxed, additional time recovery is not possible without incorporating a static recovery term in the kinematic hardening rule. Chaboche [35] reported that the static recovery term described stress relaxation responses, as well as, other responses influenced by thermally activated mechanisms. Hence, Equation (6) is modified by incorporating a static recovery term, the 3rd nonlinear hardening term in Equation (9). The introduction of static recovery term in each back stress allows additional viscosity, which is able to simulate the additional relaxation and creep deformation under low-strain rate [23]. However, this study observed that the static recovery term with constant coefficient, has a certain limitation in simulating the stress relaxation. Hence, the coefficient in Equation (9), was modified to a variable as shown in Equation (10), where the first term corresponds to saturated stress relaxation and the second term as a function of accumulated inelastic strain describes the initial rapid reduction of relaxed stress (Figure 8b). The parameter q in Equation (10) is a rate parameter controlling the rate to stabilization. Note that each static recovery term in the modified kinematic hardening rule shares the same static recovery coefficients as shown in Equation (11) [41].
4.3.2. Modification of the Isotropic Hardening Rule
During dwell time, the recovery of kinematic hardening variable plays an important role in describing the stress relaxation during each cycle. However, the effect is eliminated by the dynamic recovery term, the 2nd term in Equation (9), during the subsequent inelastic loading [23,40,42]. Hence, the static recovery term in kinematic hardening rule shows no obvious effect on the simulation of peak stress evolution. To improve the simulation of peak stress evolution, the isotropic hardening variable is modified by introducing a recovery term in the isotropic hardening rule, the 2nd term in Equation (12), as per Chaboche and his coworker [17,43]. The recovery term coefficient in Equation (12) is a function of accumulated inelastic strain (see Equation (13)) to represent the magnitude of cycle-dependent recovery effects. The parameter Qr describes incomplete recovery of isotropic hardening [40]. The third term in Equation (12) is a linear term [37,44] to represent the 2nd linear cyclic softening stage of P92 steel (see Figure 3).
5. Determination of Material Parameters
There are twenty parameters in the modified Chaboche model. These parameters were determined by using a gradient-based Levenberg–Marquardt algorithm (LSQNONLIN in MATLAB) to find the local minimum differences of the parameters while simulating selected experimental responses using the modified Chaboche model, whose procedure is detailed as follows. First, the elastic parameters (E and k), the viscous parameters (Z and n) in Equation (2), and the kinematic hardening parameters (ai and Ci) in Equation (9) are determined by simulating a half-life hysteresis curve. Then, isotropic hardening parameters, which influence the simulation of peak tensile stress in each cycle, were determined. Next, the coefficients of static recovery term, Equations (10) and (11), in the kinematic hardening rule are determined in simulating the relaxed stress data acquired during dwell time. Finally, all constants are optimized together for improved simulation of all the experimental data in parameters determination. It is worth noting that only the test results with 0.8% strain range and 180 s dwell time are used to determine parameters while the rest are used to validate the modified model. The determined material parameters for 600 and 650 °C are listed in Table 4.
Table 4.
Material parameters for the modified model at 600 and 650 °C.
6. Simulation and Discussion
6.1. Simulation of Fatigue–Creep Responses at 600 °C
Figure 8c shows the comparison of simulated and experimental relaxed stress for the test with 180 s dwell time. The relaxed stress evolution of the modified model matches the experimental response quite well. The peak stress evolution as shown in Figure 8d is also simulated quite well by the modified model. To quantify the simulation capability of the conventional and modified models, the mean relative error (MRE) was calculated using Equation (14), where Ve and Vs represent the experimental and the simulated values, respectively, and N is the number of half-life cycle. The mean relative errors are plotted in Figure 9. It is clearly observed in Figure 9 that the simulation capability of the modified model improves compared to the conventional model in simulating both the relaxed stress and peak stress. These results demonstrate significances of the modifications proposed for the static recovery term in the kinematic hardening rule (Equation (9)) and isotropic hardening rule (Equation (12)), in addition to incorporating the linear isotropic hardening term in Equation (12).
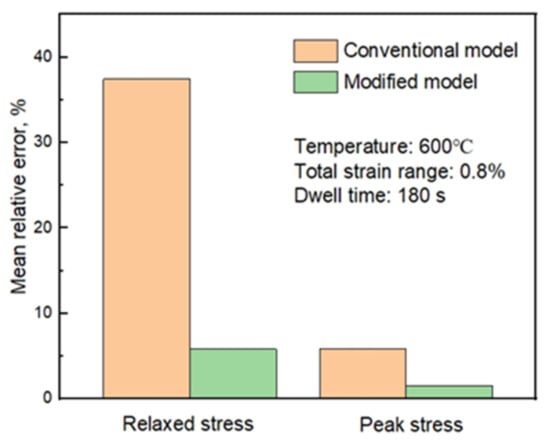
Figure 9.
The simulation capability of the conventional and modified models for relaxed stress and peak stress.
The modified model is further validated by simulating the responses of remaining 600 °C experiments in Table 2. The capability of the modified model to predict the evolution of peak and relaxed stress under different dwell times is shown in Figure 10. In this figure, it can be seen that the predicted results are in a good agreement with the experimental data at different dwell times. It is observed in Figure 10 that the evolutions of experimental peak and relaxed stresses show rapid reduction during initial cycles followed by a stabilized rate of reduction, which are well captured by the modified model.
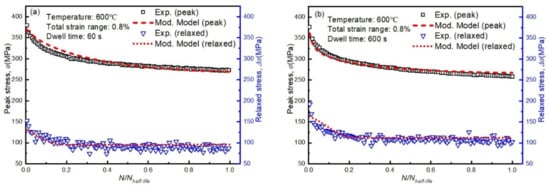
Figure 10.
Comparison of simulated peak stress and relaxed stress by modified model and experimental results at 0.8% total strain range at 600 °C with two different dwell times, (a) 60 s and (b) 600 s.
To further validate the ability of the modified model, the stress relaxation during 60 and 600 s peak strain dwell are simulated by the conventional and modified model as shown in Figure 11. Figure 11a,c demonstrates that the conventional model is unable to capture the stress relaxation responses, especially in the large number of cycles. This deficiency is mainly due to the lack of static recovery, which delays the saturation of relaxation. Consequently, the modified model with a gradually saturated static recovery term improves the simulation of stress relaxation during dwell time as shown in Figure 11b,d, where it is observed that both the magnitude and the rate of stress relaxation are simulated well by the modified model for dwell times of 60 to 600 s. Moreover, the mean relative error was calculated to evaluate the models’ predictions of stress relaxation. It is noting that for these calculations, N in Equation (14) equals to dwell time. In other words, the sampling interval is 1 s. As shown in Figure 12, the prediction accuracy of the modified model is three times higher than that of the conventional model, regardless of dwell time.
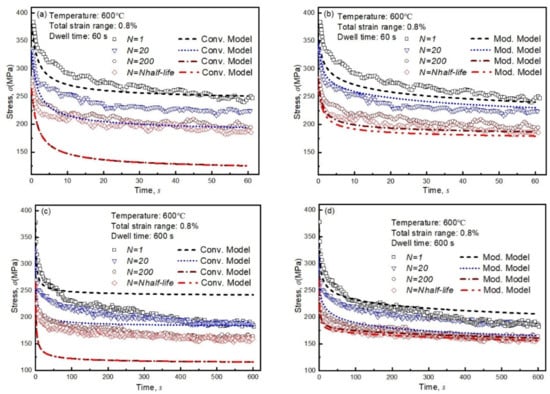
Figure 11.
Comparison of simulated stress relaxation during dwell time and experimental results at 0.8% total strain range with different dwell times under 600 °C: (a) 60 s dwell time simulated by the conventional model, (b) 60 s dwell time simulated by the modified model, (c) 600 s dwell time simulated by the conventional model, (d) 600 s dwell time simulated by the modified model.
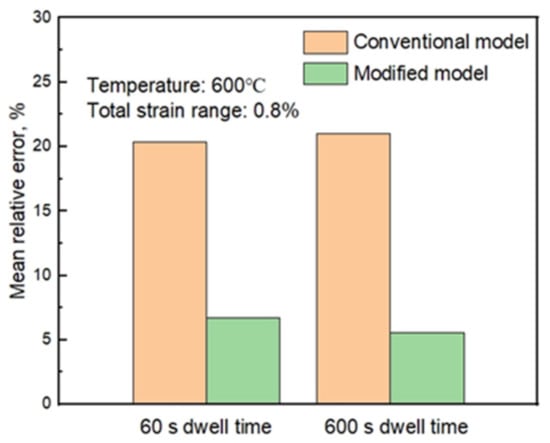
Figure 12.
The simulation capability of the conventional and modified models for stress relaxation.
In addition, the ability of modified model to predict the stress–strain hysteresis responses of P92 steel are shown in Figure 13. It is observed in this figure that the modified viscoplastic model with static recovery is capable of simulating the hysteresis shape evolution quite well.
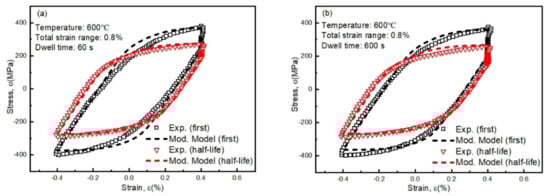
Figure 13.
Comparison of simulated hysteresis loops of first and half-life cycles and experimental results at 0.8% total strain range with different dwell times under 600 °C: (a) 60 s and (b) 600 s.
6.2. Simulation of Fatigue–Creep Loading at 650 °C
The modified model parameters of P92 steel at 650°C are listed in Table 4. These model parameters, which were determined based on the experimental responses of 0.8% strain range and 180 s dwell time under 650 °C, are used to simulate the remaining 650 °C tests. As shown in Figure 14, the simulations of cyclic softening, stress relaxation and hysteresis loops agree well with experimental data for the test with 600 s dwell time at 650 °C. This demonstrates that the modified constitutive model can simulate all the fatigue–creep responses under 650 °C.
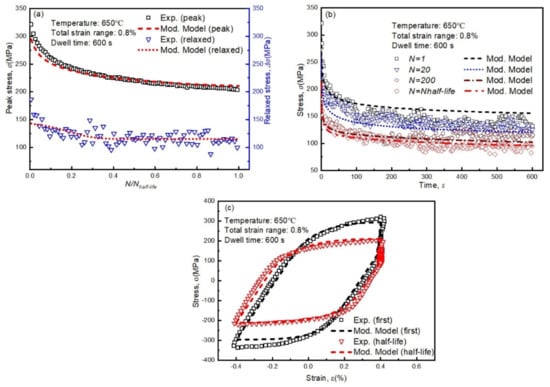
Figure 14.
Comparison of simulated data and experimental results at 0.8% total strain range with 600 s peak tensile strain under 650 °C: (a) evolution of peak stress and relaxed stress, (b) stress relaxation during dwell time, (c) hysteresis loops of first and half-life cycles.
6.3. Simulation of Fatigue–Creep Responses for Different Strain Ranges
Figure 15 shows the simulated results of P92 steel at 1.2% total strain range with 180 s dwell time at 600 °C. The readers are referred to Figure 10 and Figure 11 for 0.8% total strain range response simulations. In Figure 10, Figure 11 and Figure 15, it is observed that the cyclic softening curves with linear evolution in the second stage for both the strain ranges are simulated reasonably by the modified isotropic hardening variable (Equation (12)). In addition, the stress relaxation responses for both the strain ranges are captured by modified model.
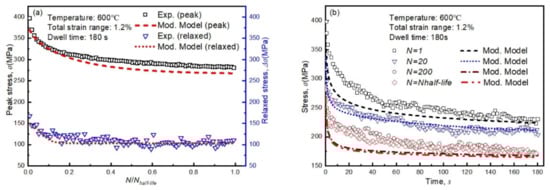
Figure 15.
Comparison of simulated and experimental peak and relaxed stresses at 1.2% total strain range with 180 s peak tensile strain dwell at 600 °C: (a) evolution of peak stress and relaxed stress, (b) stress relaxation during dwell time at various cycles.
Simulated responses of P92 steel under fatigue–creep loading at 1.2% total strain range in Figure 16 and those at 0.8% in Figure 14 at 650 °C demonstrated the applicability of the modified model to different strain ranges at higher temperature. As presented in Figure 16a, the computed cyclic softening curve coincides well with the experimental results at different cycles up to half life satisfactorily. Hence, the presented simulations validate the modified model satisfactorily for fatigue–creep response simulations with different strain ranges.
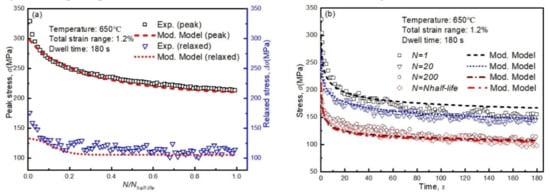
Figure 16.
Comparison of simulated and experimental responses at 1.2% total strain range with 180 s peak tensile strain dwell at 650 °C, (a) evolution of peak stress and relaxed stress; (b) stress evolution during dwell time at various cycles.
7. Conclusions
This study made an effort to investigate the fatigue–creep interaction (FCI) responses experimentally and numerically. Literature review indicates that there is a lack of experimental data on FCI, especially for P92 steel, and consequently a lack of knowledge on FCI responses. Hence, a set of strain-controlled FCI experiments were conducted to investigate the cyclic responses of P92 steel. Influence of temperature, dwell time and strain range on peak stress (cyclic softening); stress relaxation during dwell time and fatigue life are evaluated. It is also demonstrated that the conventional Chaboche model is unable to simulate the FCI responses of P92 steel. Hence, a modified viscoplastic model incorporating a new static recovery term is proposed to improve simulation of the whole set of P92 steel responses using a single set of model parameters. The primary findings of the study are:
(1) Experimental finding: The cyclic softening and stress relaxation responses of P92 steel under FCI loading are influenced by the dwell time, temperature and strain range. The amount of relaxed stress in each cycle and its evolution with cycle are influenced by the dwell time, but saturation of relaxed stress at long dwell time is also observed.
(2) Novel model development: The conventional Chaboche model is unable to simulate all the FCI responses, especially the stress relaxation during the tensile peak strain dwell time. The drawback of the conventional model is traced to the isotropic hardening rule and lack of a static recovery term in the kinematic hardening rule. It was also determined that with the conventional static recovery term with constant parameters, the model is unable to simulate the P92 steel FCI responses. Hence, a modified isotropic hardening rule and a novel static recovery term are incorporated to the Chaboche model to successfully simulate the whole set of P92 steel FCI responses with very good accuracy.
It is noted here that the complexity of FCI responses would increase under stress-controlled and/or multiaxial loading. The complexity further increases with anisothermal loading, which is realistic for most high temperature components. Hence, additional efforts, both experimental and analytical, are needed by the research community to resolve the design issue of high temperature components.
Author Contributions
T.Z. performed the calculations and wrote the manuscript; X.W. and J.G. supervised the findings of this work. T.Z. and W.Z. assisted in the experiments and prepared the test specimens. T.H. was consulted on the experimental studies and constitutive model development. All authors discussed the results and contributed to the final manuscript. All authors have read and agreed to the published version of the manuscript.
Funding
The authors gratefully acknowledge the financial support of the National Key R&D Program of China (No. 2018YFC0808800), National Natural Science Foundation of China (No. 51905261) and Natural Science Foundation of Jiangsu Province (No. BK20190678).
Conflicts of Interest
The authors declare no conflict of interest.
References
- Li, M.; Barrett, R.A.; Scully, S.; Harrison, N.M.; Leen, S.B.; O’Donoghue, P.E. Cyclic plasticity of welded P91 material for simple and complex power plant connections. Int. J. Fatigue 2016, 87, 391–404. [Google Scholar] [CrossRef]
- Farragher, T.P.; Scully, S.; O’Dowd, N.P.; Leen, S.B. Development of life assessment procedures for power plant headers operated under flexible loading scenarios. Int. J. Fatigue 2013, 49, 50–61. [Google Scholar] [CrossRef]
- Viswanathan, R.; Henry, J.F.; Tanzosh, J.; Stanko, G.; Shingledecker, J.; Vitalis, B.; Purgert, R.U.S. program on materials technology for ultra-supercritical coal power plants. J. Mater. Eng. Perform. 2005, 14, 281–292. [Google Scholar] [CrossRef]
- Swindeman, R.W.; Santella, M.L.; Maziasz, P.J.; Roberts, B.W.; Coleman, K. Issues in replacing Cr–Mo steels and stainless steels with 9Cr–1Mo–V steel. Int. J. Press. Vessels Pip. 2004, 81, 507–512. [Google Scholar] [CrossRef]
- Zhang, W.; Wang, X.W.; Li, X.; Gong, J.M.; Wahab, M.A. Influence of prior low cycle fatigue on microstructure evolution and subsequent creep behavior. Int. J. Fatigue 2018, 109, 114–125. [Google Scholar] [CrossRef]
- Mannan, S.L.; Valsan, M. High-temperature low cycle fatigue, creep–fatigue and thermomechanical fatigue of steels and their welds. Int. J. Mech. Sci. 2006, 48, 160–175. [Google Scholar] [CrossRef]
- Sakasegawa, H.; Hirose, T.; Kohyama, A.; Katoh, Y.; Harada, T.; Asakura, K. Microstructural stability of reduced activation ferritic/martensitic steels under high temperature and stress cycling. Fusion Eng. Des. 2002, 61–62, 671–675. [Google Scholar] [CrossRef]
- Vaillant, J.C.; Vandenberghe, B.; Hahn, B.; Heuser, H.; Jochum, C. T/P23, 24, 911 and 92: New grades for advanced coal-fired power plants—Properties and experience. Int. J. Press. Vessels Pip. 2008, 85, 38–46. [Google Scholar] [CrossRef]
- Islam, N.; Dewees, D.; Hassan, T. Unified Viscoplasticity Modeling Features Needed for Simulation of Grade 91 Creep and Fatigue Responses. In Proceedings of the ASME 2016 Pressure Vessels and Piping Conference, Vancouver, BC, Canada, 17–21 July 2016. [Google Scholar]
- Fournier, B.; Sauzay, M.; Caës, C.; Noblecourt, M.; Mottot, M.; Bougault, A.; Rabeau, V.; Pineau, A. Creep–fatigue–oxidation interactions in a 9Cr–1Mo martensitic steel. Part I: Effect of tensile holding period on fatigue lifetime. Int. J. Fatigue 2008, 30, 649–662. [Google Scholar] [CrossRef]
- Chen, X.; Sokolov, M.A.; Sham, S.; Erdman, D.L.; Busby, J.T.; Mo, K.; Stubbins, J.F. Experimental and modeling results of creep–fatigue life of Inconel 617 and Haynes 230 at 850 °C. J. Nucl. Mater. 2013, 432, 94–101. [Google Scholar] [CrossRef]
- Srinivasan, V.S.; Nagesha, A.; Valsan, M.; Rao, K.B.S.; Mannan, S.L.; Sastry, D.H. Effect of hold-time on low cycle fatigue behaviour of nitrogen bearing 316L stainless steel. Int. J. Press. Vessels Pip. 1999, 76, 863–870. [Google Scholar] [CrossRef]
- Shankar, V.; Mariappan, K.; Sandhya, R.; Laha, K.; Bhaduri, A.K. Long term creep-fatigue interaction studies on India-specific reduced activation ferritic-martensitic (IN-RAFM) steel. Int. J. Fatigue 2017, 98, 259–268. [Google Scholar] [CrossRef]
- Barrett, P.R.; Ahmed, R.; Menon, M.; Hassan, T. Isothermal low-cycle fatigue and fatigue-creep of Haynes 230. Int. J. Solids Struct. 2016, 88–89, 146–164. [Google Scholar] [CrossRef]
- Zhang, S.; Xuan, F.Z. Interaction of cyclic softening and stress relaxation of 9–12% Cr steel under strain-controlled fatigue-creep condition: Experimental and modeling. Int. J. Plast. 2017, 98, 45–64. [Google Scholar] [CrossRef]
- Wang, X.W.; Zhang, W.; Gong, J.M.; Jiang, Y. Experimental and numerical characterization of low cycle fatigue and creep fatigue behaviour of P92 steel welded joint. Fatigue Fract. Eng. Mater. Struct. 2018, 41, 611–624. [Google Scholar] [CrossRef]
- Chaboche, J.L.; Rousselier, G. On the Plastic and Viscoplastic Constitutive Equations—Part I: Rules Developed With Internal Variable Concept. J. Press. Vessel Technol. 1983, 105, 153–158. [Google Scholar] [CrossRef]
- Chaboche, J.L. Constitutive equations for cyclic plasticity and cyclic viscoplasticity. Int. J. Plast. 1989, 5, 247–302. [Google Scholar] [CrossRef]
- Yaguchi, M.; Takahashi, Y. A viscoplastic constitutive model incorporating dynamic strain aging effect during cyclic deformation conditions. Int. J. Plast. 2000, 16, 241–262. [Google Scholar] [CrossRef]
- Kang, G.Z.; Gao, Q.; Yang, X.J. A visco–plastic constitutive model incorporated with cyclic hardening for uniaxial/multiaxial ratcheting of SS304 stainless steel at room temperature. Mech. Mater. 2002, 34, 521–531. [Google Scholar] [CrossRef]
- Yang, X.J. A viscoplastic model for 316L stainless steel under uniaxial cyclic straining and stressing at room temperature. Mech. Mater. 2004, 36, 1073–1086. [Google Scholar] [CrossRef]
- Krishna, S.; Hassan, T.; Naceur, I.B.; Sai, K.; Cailletaud, G. Macro Versus Micro Scale Cyclic Plasticity Models in Simulating Nonproportional Cyclic and Ratcheting Responses of Stainless Steel 304. Int. J. Plast. 2009, 25, 1910–1949. [Google Scholar] [CrossRef]
- Ahmed, R.; Barrett, P.R.; Hassan, T. Unified viscoplasticity modeling for isothermal low-cycle fatigue and fatigue-creep stress–strain responses of Haynes 230. Int. J. Solids Struct. 2016, 88–89, 131–145. [Google Scholar] [CrossRef]
- Zhou, J.; Sun, Z.; Kanouté, P.; Retraint, D. Experimental analysis and constitutive modelling of cyclic behaviour of 316L steels including hardening/softening and strain range memory effect in LCF regime. Int. J. Plast. 2018, 107, 54–78. [Google Scholar] [CrossRef]
- Yaguchi, M.; Takahashi, Y. Ratchetting of viscoplastic material with cyclic softening, part 2: Application of constitutive models. Int. J. Plast. 2005, 21, 835–860. [Google Scholar] [CrossRef]
- Kan, Q.H.; Kang, G.Z.; Zhang, J. Uniaxial time-dependent ratchetting: Visco-plastic model and finite element application. Theor. Appl. Fract. Mech. 2007, 47, 133–144. [Google Scholar] [CrossRef]
- Chen, W.; Kitamura, T.; Feng, M. Creep and fatigue behavior of 316L stainless steel at room temperature: Experiments and a revisit of a unified viscoplasticity model. Int. J. Fatigue 2018, 112, 70–77. [Google Scholar] [CrossRef]
- Alsmadi, Z.Y.; Alomari, A.; Kumar, N.; Murty, K.L. Effect of hold time on high temperature creep-fatigue behavior of Fe–25Ni–20Cr (wt.%) austenitic stainless steel (Alloy 709). Mater. Sci. Eng. A 2020, 771, 138591. [Google Scholar] [CrossRef]
- Zhang, W.; Wang, X.W.; Gong, J.M.; Jiang, Y.; Huang, X. Experimental and simulated characterization of creep behavior of P92 steel with prior cyclic loading damage. J. Mater. Sci. Technol. 2017, 33, 1540–1548. [Google Scholar] [CrossRef]
- Kimura, M.; Yamaguchi, K.; Hayakawa, M.; Kobayashi, K.; Kanazawa, K. Microstructures of creep-fatigued 9–12% Cr ferritic heat-resisting steels. Int. J. Fatigue 2006, 28, 300–308. [Google Scholar] [CrossRef]
- Wang, X.W.; Gong, J.M.; Zhao, Y.P.; Wang, Y.F.; Yu, M.H. Characterization of low cycle fatigue performance of new ferritic P92 steel at high temperature: Effect of strain amplitude. Steel Res. Int. 2015, 86, 1046–1055. [Google Scholar] [CrossRef]
- Wang, X.W.; Zhang, W.; Gong, J.M.; Wahab, M.A. Low cycle fatigue and creep fatigue interaction behavior of 9Cr-0.5 Mo-1.8 WV-Nb heat-resistant steel at high temperature. J. Nucl. Mater. 2018, 505, 73–84. [Google Scholar] [CrossRef]
- Lu, Y.L.; Chen, L.J.; Wang, G.Y.; Benson, M.L.; Liaw, P.K.; Thompson, S.A.; Blust, J.W.; Browning, P.F.; Bhattacharya, A.K.; Aurrecoechea, J.M.; et al. Hold time effects on low cycle fatigue behavior of HAYNES 230® superalloy at high temperatures. Mater. Sci. Eng. A 2005, 409, 282–291. [Google Scholar] [CrossRef]
- Jürgens, M.; Olbricht, J.; Fedelich, B.; Skrotzki, B. Low Cycle Fatigue and Relaxation Performance of Ferritic–Martensitic Grade P92 Steel. Metals 2019, 9, 99. [Google Scholar] [CrossRef]
- Chaboche, J.L. A review of some plasticity and viscoplasticity constitutive theories. Int. J. Plast. 2008, 24, 1642–1693. [Google Scholar] [CrossRef]
- Saad, A.A.; Hyde, T.H.; Sun, W.; Hyde, C.J. Characterization of viscoplasticity behaviour of P91 and P92 power plant steels. Int. J. Press. Vessels Pip. 2013, 111, 246–252. [Google Scholar] [CrossRef]
- Wang, X.W.; Jiang, Y.; Gong, J.M.; Zhao, Y.P.; Huang, X. Characterization of low cycle fatigue of ferritic–martensitic P92 steel: Effect of temperature. Steel Res. Int. 2016, 87, 761–771. [Google Scholar] [CrossRef]
- Nam, S.W. Assessment of damage and life prediction of austenitic stainless steel under high temperature creep–fatigue interaction condition. Mater. Sci. Eng. A 2002, 322, 64–72. [Google Scholar] [CrossRef]
- Yan, X.L.; Zhang, X.C.; Tu, S.T.; Mannan, S.L.; Xuan, F.Z.; Lin, Y.C. Review of creep–fatigue endurance and life prediction of 316 stainless steels. Int. J. Press. Vessels Pip. 2015, 126, 17–28. [Google Scholar] [CrossRef]
- Chaboche, J.L.; Nouailhas, D. A unified constitutive model for cyclic viscoplasticity and its applications to various stainless steels. J. Eng. Mater. Technol. 1989, 111, 424–430. [Google Scholar] [CrossRef]
- Ding, J.; Kang, G.Z.; Kan, Q.H.; Liu, Y.J. Constitutive model for uniaxial time-dependent ratcheting of 6061-T6 aluminum alloy. Comput. Mater. Sci. 2012, 57, 67–72. [Google Scholar] [CrossRef]
- Yaguchi, M.; Yamamoto, M.; Ogata, T. A viscoplastic constitutive model for nickel-base superalloy, part 1: Kinematic hardening rule of anisotropic dynamic recovery. Int. J. Plast. 2002, 18, 1083–1109. [Google Scholar] [CrossRef]
- Chaboche, J.L. Cyclic viscoplastic constitutive equations, part I: A thermodynamically consistent formulation. J. Appl. Mech. 1993, 60, 813–821. [Google Scholar] [CrossRef]
- Kyaw, S.T.; Rouse, J.P.; Lu, J.W.; Sun, W. Determination of material parameters for a unified viscoplasticity-damage model for a P91 power plant steel. Int. J. Mech. Sci. 2016, 115–116, 168–179. [Google Scholar] [CrossRef]


© 2020 by the authors. Licensee MDPI, Basel, Switzerland. This article is an open access article distributed under the terms and conditions of the Creative Commons Attribution (CC BY) license (http://creativecommons.org/licenses/by/4.0/).