Article

Effect of Pore Defects on Mechanical Properties of Graphene Reinforced Aluminum Nanocomposites

1
School of Materials Science and Engineering, Nanchang Hangkong University, Nanchang 330063, China
2
School of Mechanical and Electrical Engineering, Army Engineering University of PLA, Nanjing 210016, China
3
Department of Mechanical and Electrical Engineering, Nanjing University of Aeronautics and Astronautics, Nanjing 210016, China
*
Authors to whom correspondence should be addressed.
Metals 2020, 10(4), 468; https://doi.org/10.3390/met10040468
Submission received: 28 February 2020 / Revised: 22 March 2020 / Accepted: 24 March 2020 / Published: 2 April 2020
(This article belongs to the Special Issue Graphene Reinforced Metal Matrix Nanocomposites)

Abstract

:
Pore defects have an important effect on the mechanical properties of graphene reinforced aluminum nanocomposites. The simulation study found that the pores affect the stress distribution in the matrix of the composite. Along the stretching direction, the larger stress appears on both sides of the pore, which is the source of potential cracks. It results in a sharp decrease in the mechanical properties of the composite. The higher the porosity, the greater the tendency of pore aggregation, and the risk of material failure is higher. The stress distribution in the matrix becomes more uneven as the pore size increases, and the large strain area around the pores also increases. Composites with circular pores have a higher strength than other irregularly shaped pores. The failure mode might be pore cracking, while composites with other shape pores are more prone to interface detachment. The simulation value of the stress-strain of the composite material is in good agreement with the experimental value, but the finite element simulation value is larger than the experimental value.

1. Introduction

Graphene has broad application prospects in the field of composite materials due to its excellent thermal conductivity, mechanical properties, and electrical conductivity [1,2,3,4,5,6,7,8]. Presently, the research of graphene reinforced composites mainly focuses on the experimental preparation of inorganic ceramic-based and polymer-based and a small amount of metal-based composites [9,10,11,12,13,14]. The preparation process of graphene reinforced aluminum nanocomposites (GRANs) is relatively complicated. The prepared composites generally have structural defects, such as cracks, gaps, scratches, segregation, and inclusions, and pores are the most common small defects. Porosity is closely related to the properties of composite materials, and it will reduce the mechanical properties of composite materials, such as interlayer shear strength, tensile and compressive strength, transverse bending strength, and fatigue strength. Even small porosity can have a significant impact on the life of composites [15,16,17,18]. The shape, size and distribution of the pores of the composites are also different and very complex due to the different manufacturing processes of GRANs. It is difficult to quantitatively study the effect of pores on the mechanical properties of GRANs, and theoretical derivation is also difficult, due to the long experimental preparation period, high cost and data dispersion. In this paper, a pore defect model of GRANs is established, and the effects of porosity, pore size, and pore shape on the mechanical behavior of composites are simulated. At the same time, experimental research is carried out, and comparative analysis with simulation results.

2. Methods

The simplification of the finite element model is as follows: (1) GRANs are isotropic materials; (2) in the elastoplastic finite element analysis, it is assumed that graphene is a linear elastic material and the aluminum matrix is an elastoplastic material; (3) there is no interface phase between the reinforced graphene and the aluminum matrix, and the interface bonding method is mechanical bonding. The elastic modulus of the aluminum matrix is Em = 69 GPa and the Poisson’s ratio is 0.33. Graphene has an elastic modulus Ep = 1050 GPa and a Poisson’s ratio = 0.186. Graphene has a thickness of 15 nm, an aspect ratio of 2:1, a short diameter of 2 μm, and a volume fraction of 2%.
The microstructure of GRANs is more complex. We usually use a typical unit cell model to replace the entire composite in order to simulate the stress-strain curve of the composite. In the unit cell model, the average stress and strain of the composite material are calculated by the volume average method, as follows:
σ c   = 1 V c k N c σ c k V c k
ε c   = 1 V c k N c ε c k V c k
where V c is the total volume of the cell model, V c k is the volume of the k cell in the cell model, σ c k is the average stress of the k cell in the cell model, ε c k is the average strain of the k cell in the cell model, and Nc is the total number of cells in the unit cell model.

3. Results and Discussions

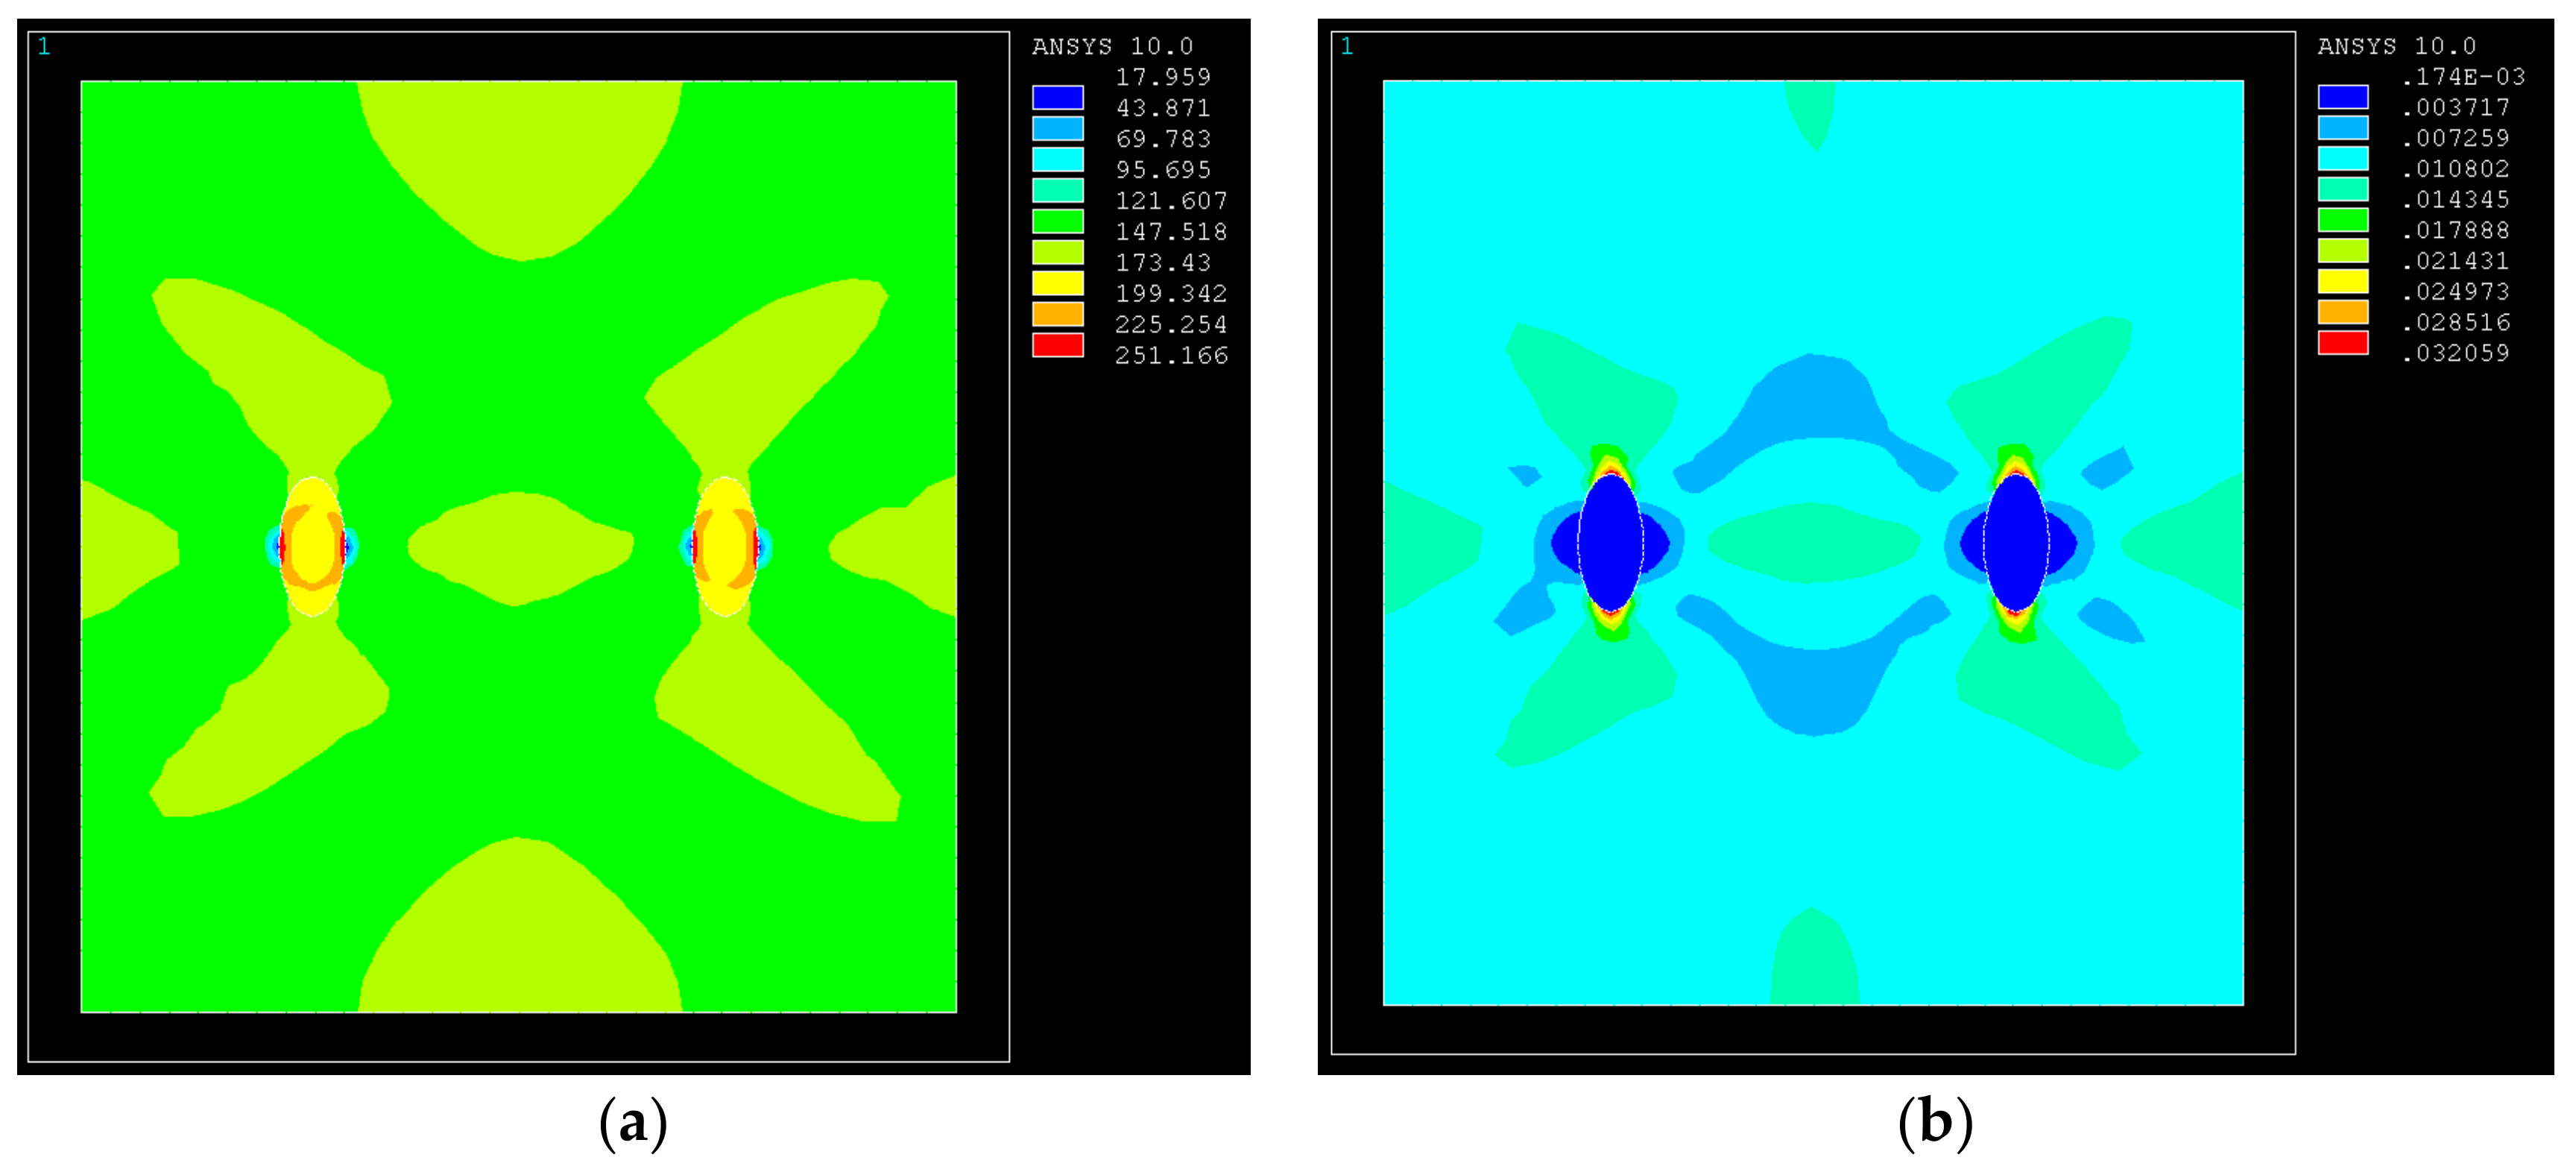
3.1. Effect of Porosity on Mechanical Behavior of GRANs

Numerical simulations were carried out on the composites with no defects and pores. Figure 1 is a von Mises stress-strain diagram of a central plane in the direction of parallel stretching ( ε c = 1%). The pores were set to be spherical, with a diameter of 2 μm and a porosity of 1.2%.
From Figure 1a,b, it was found that, when compared with GRANs without void defects, the stress distribution of GRANs with pores under an additional 1% displacement load has changed, and the stress near the center of GRANs is significantly smaller than the outside, and the matrix stress near the top of the reinforcement is slightly reduced, but the value is still large. The stress distribution that is near the pores is also different. Large stresses appear on both sides of the pores. Stress concentration on both sides of the pores might cause the pores to grow and form microcracks. Figure 1c,d shows that in addition to the large strain near the top of the reinforcement, the strain on the two sides of the pores is relatively larger, and it stretches in a direction of 45° with the stretching direction. At the center of the boundary, the maximum strain value reaches 0.133 and a large amount of plastic deformation occurs, which is a potential source of cracks. The occurrence of pores in the composite material will cause stress concentration and large plastic deformation. When the stress and plastic deformation reach a certain value, micro-cracks will be induced, and the material will eventually fracture. Therefore, the pores cause the mechanical properties of GRANs to sharply decrease.

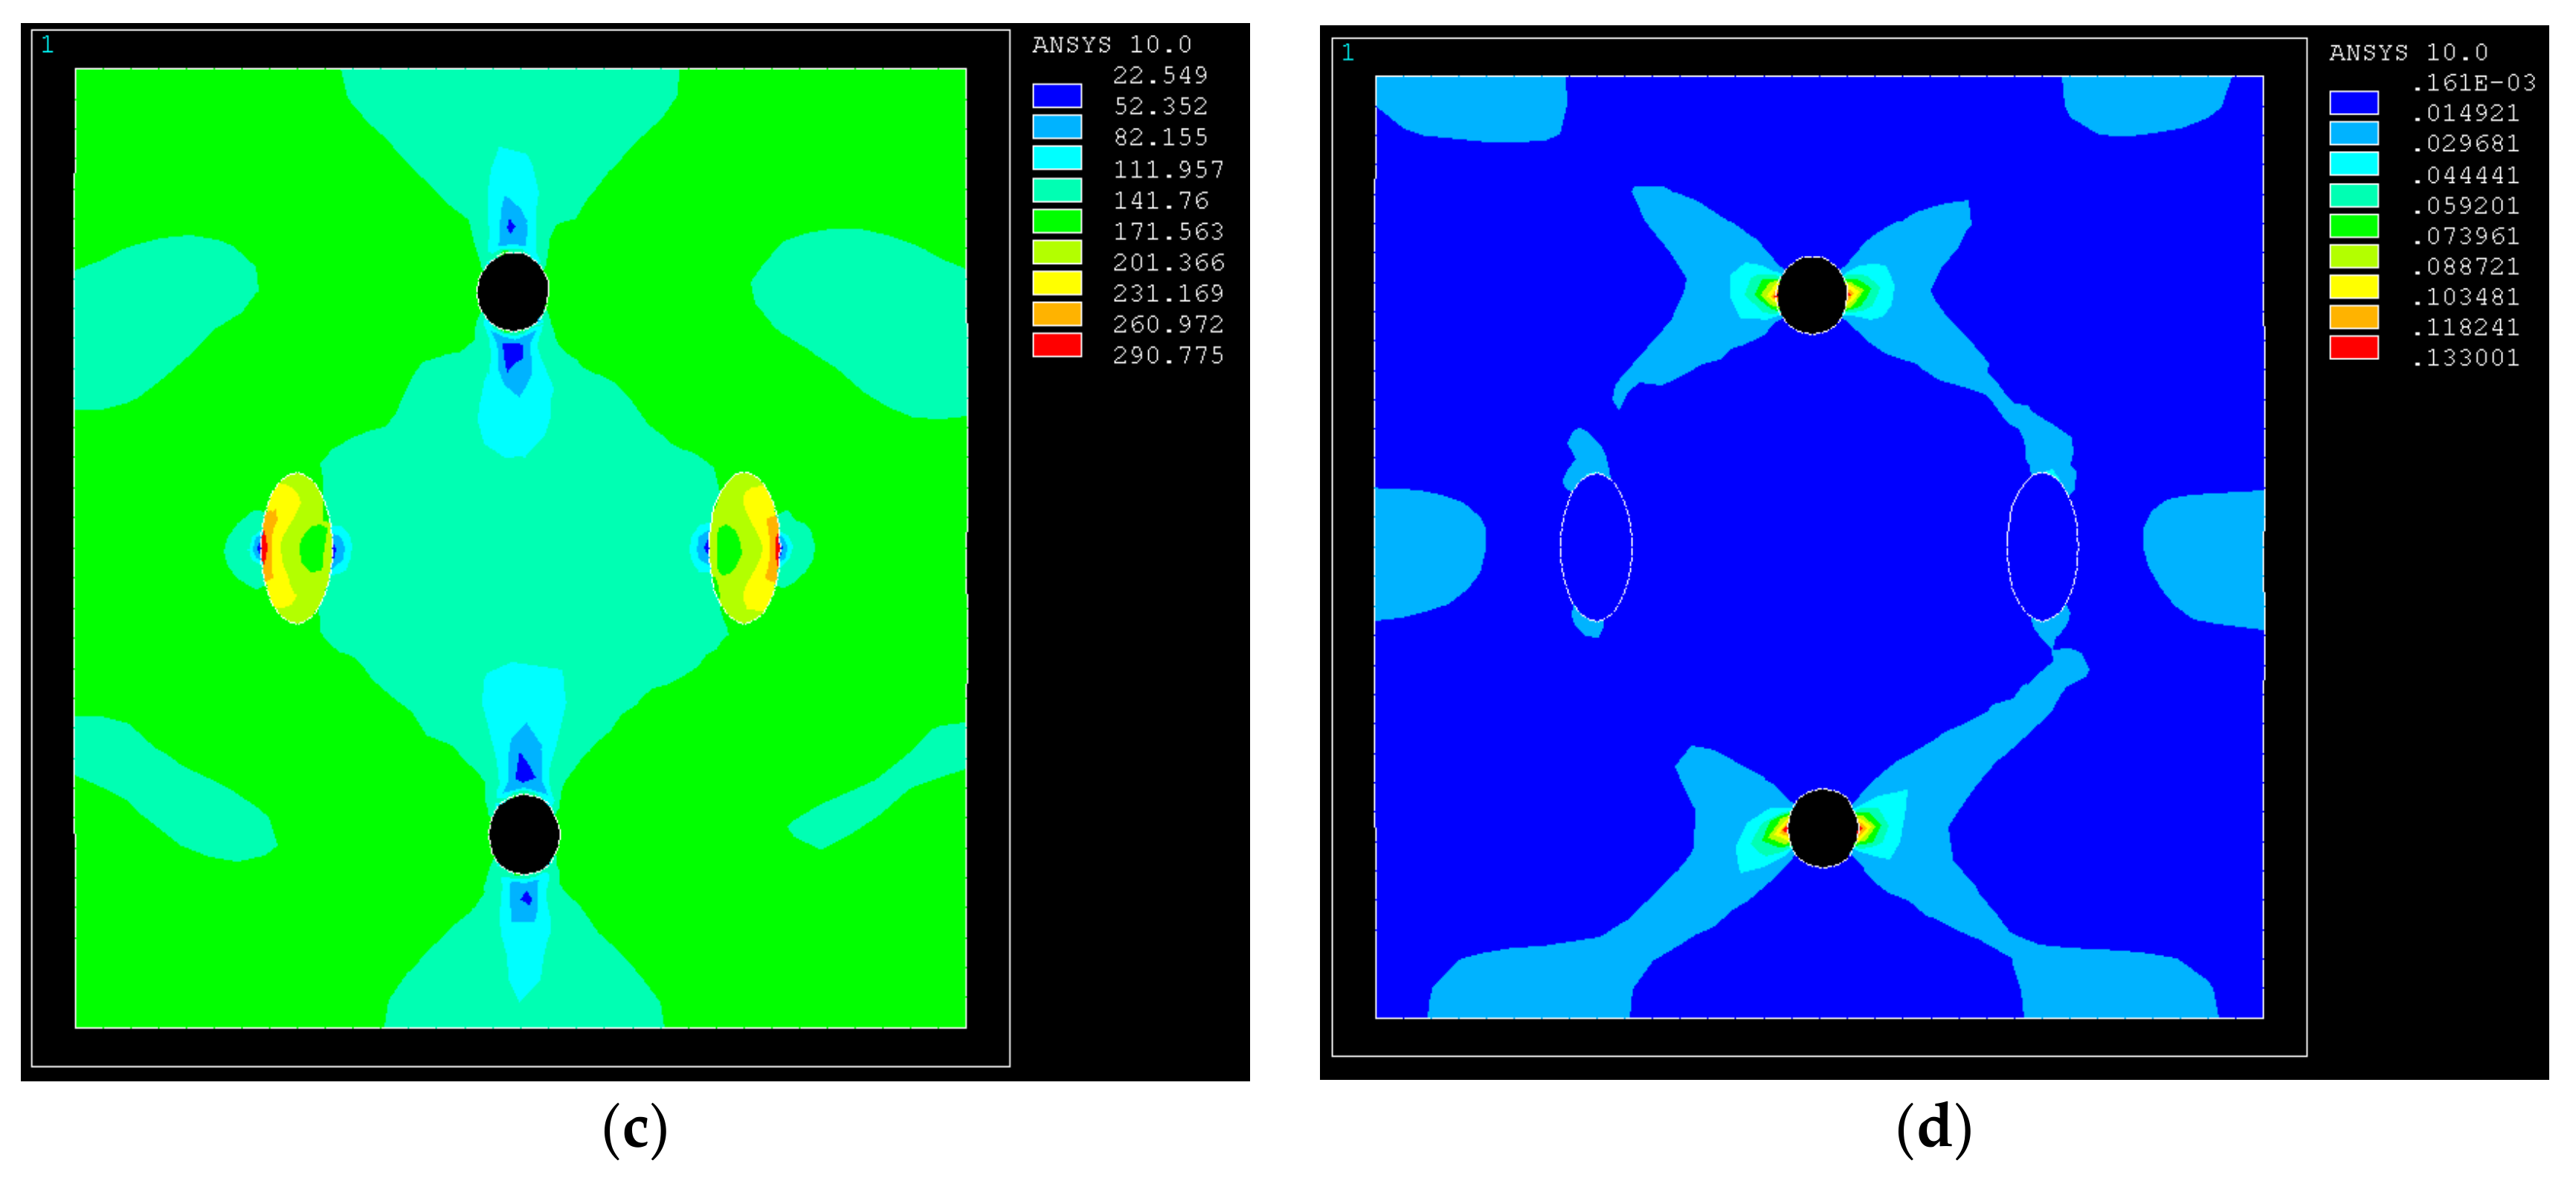
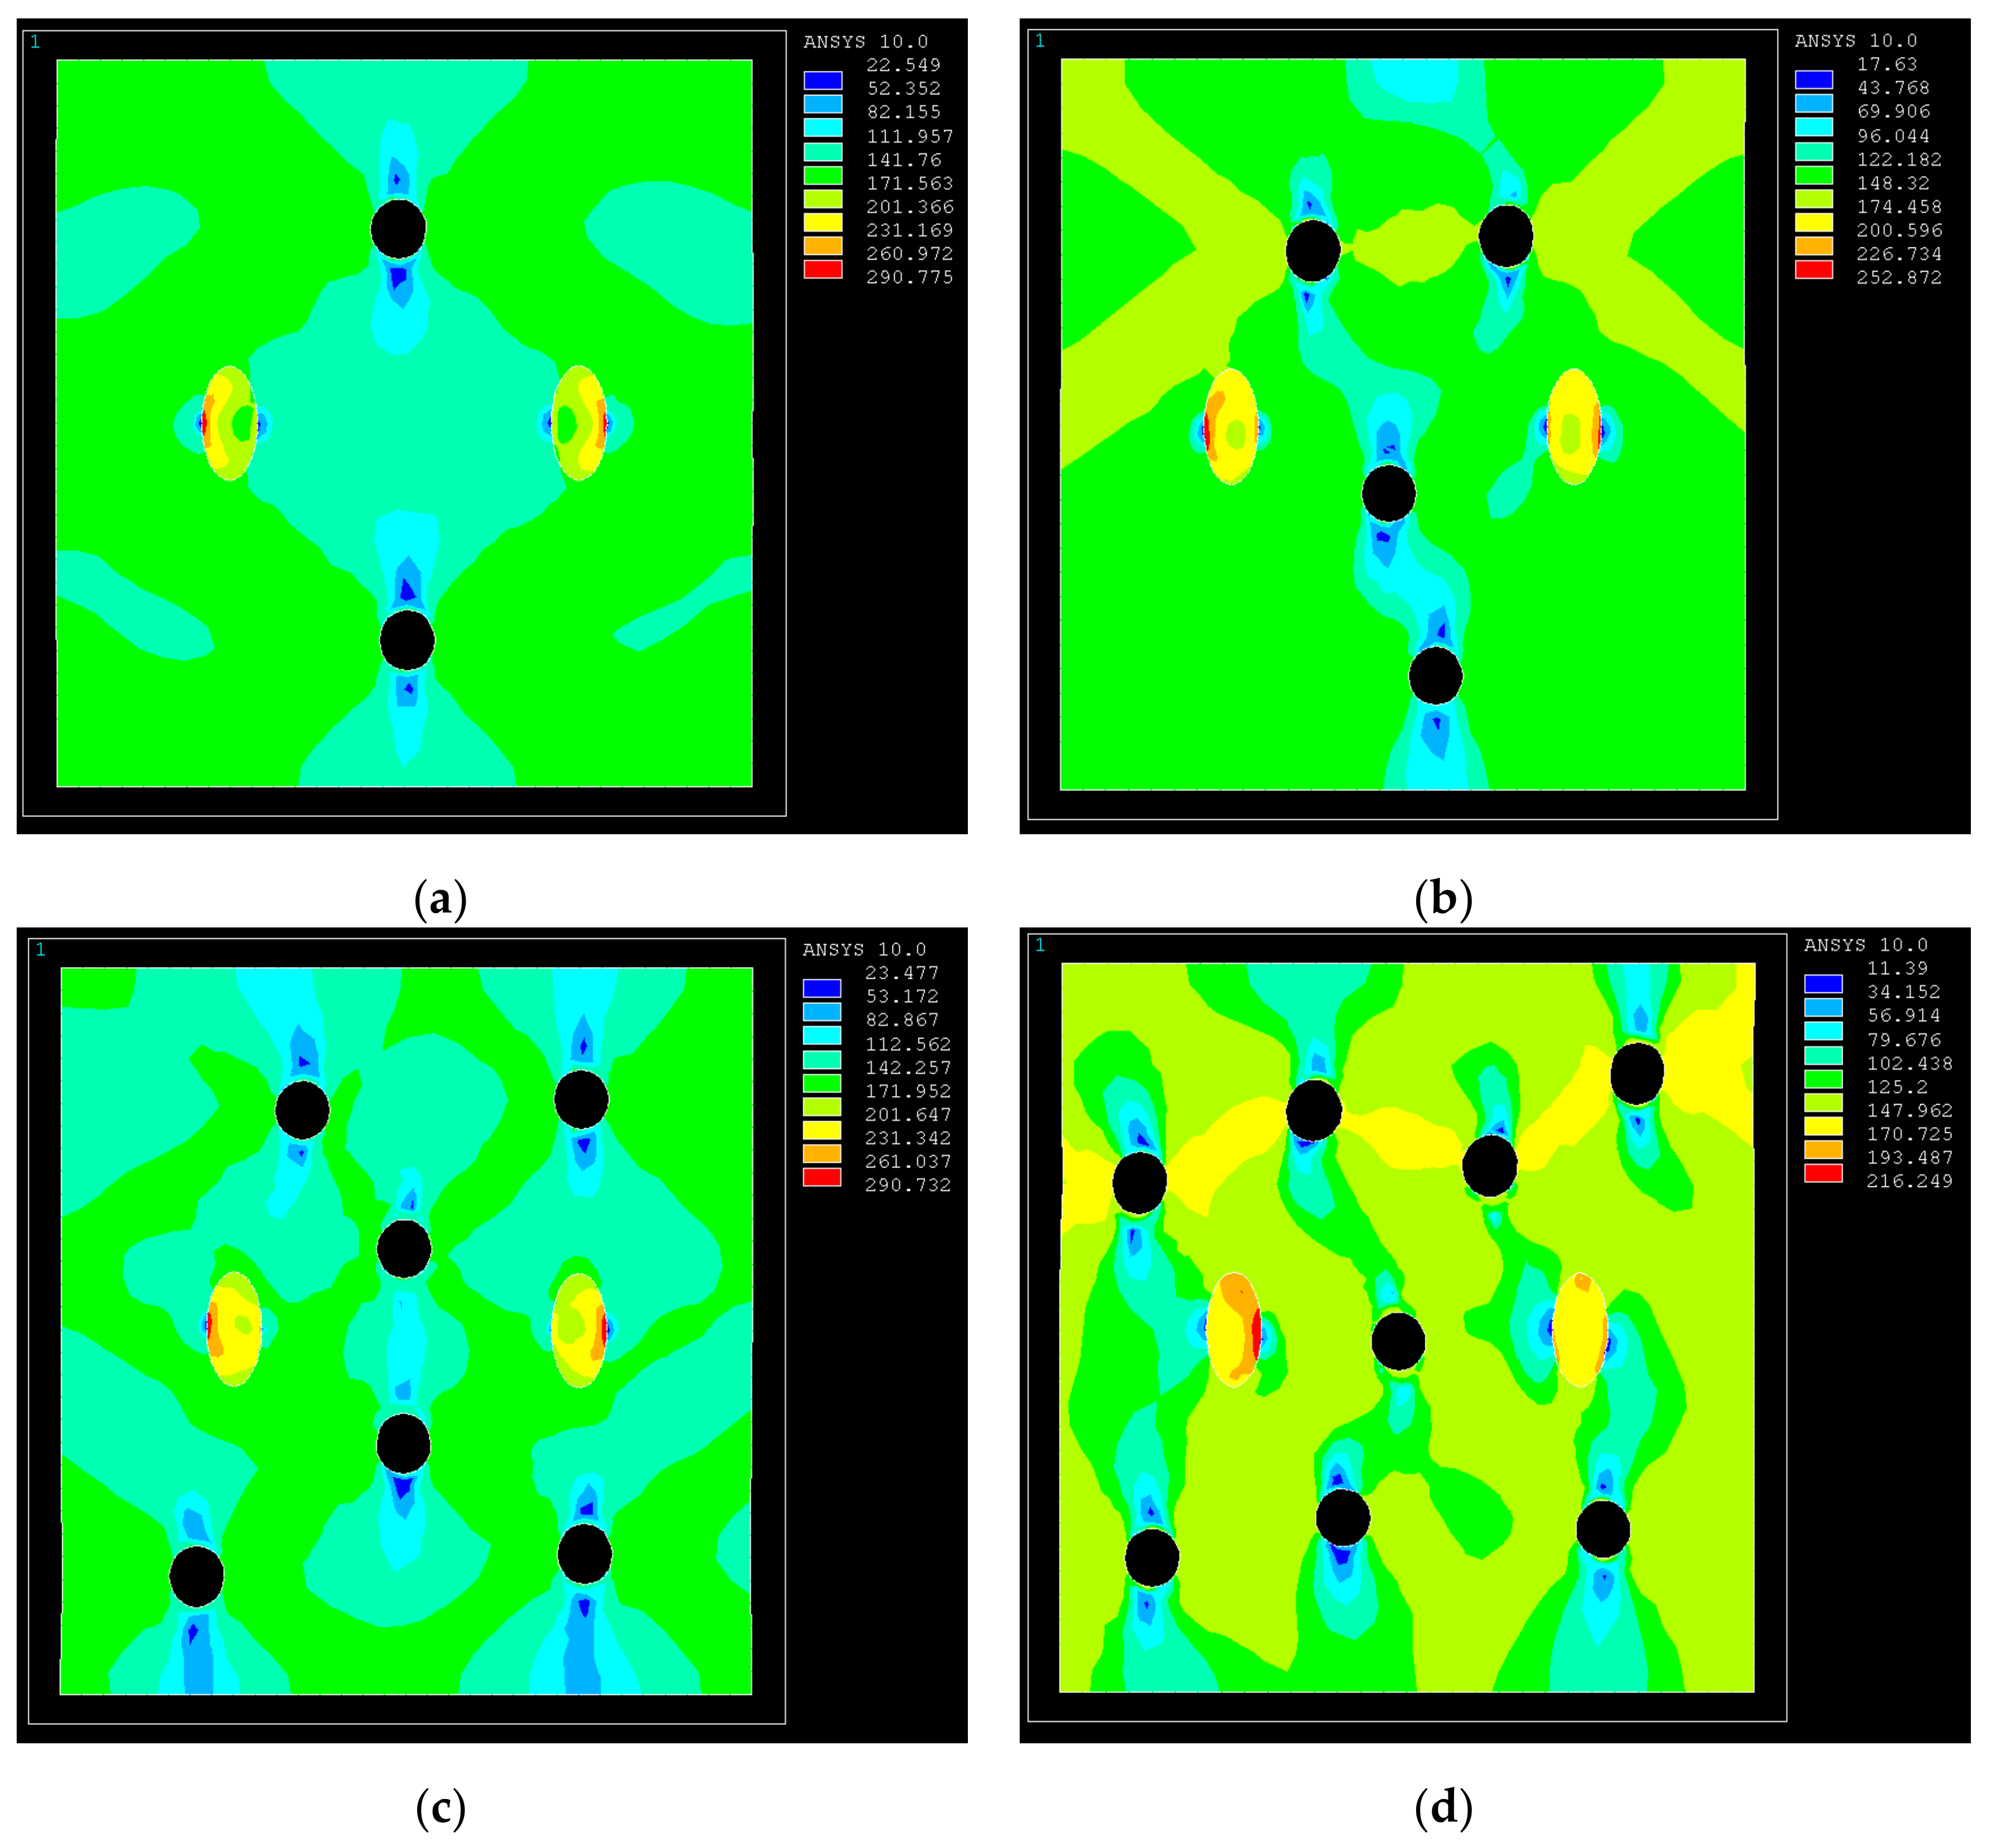
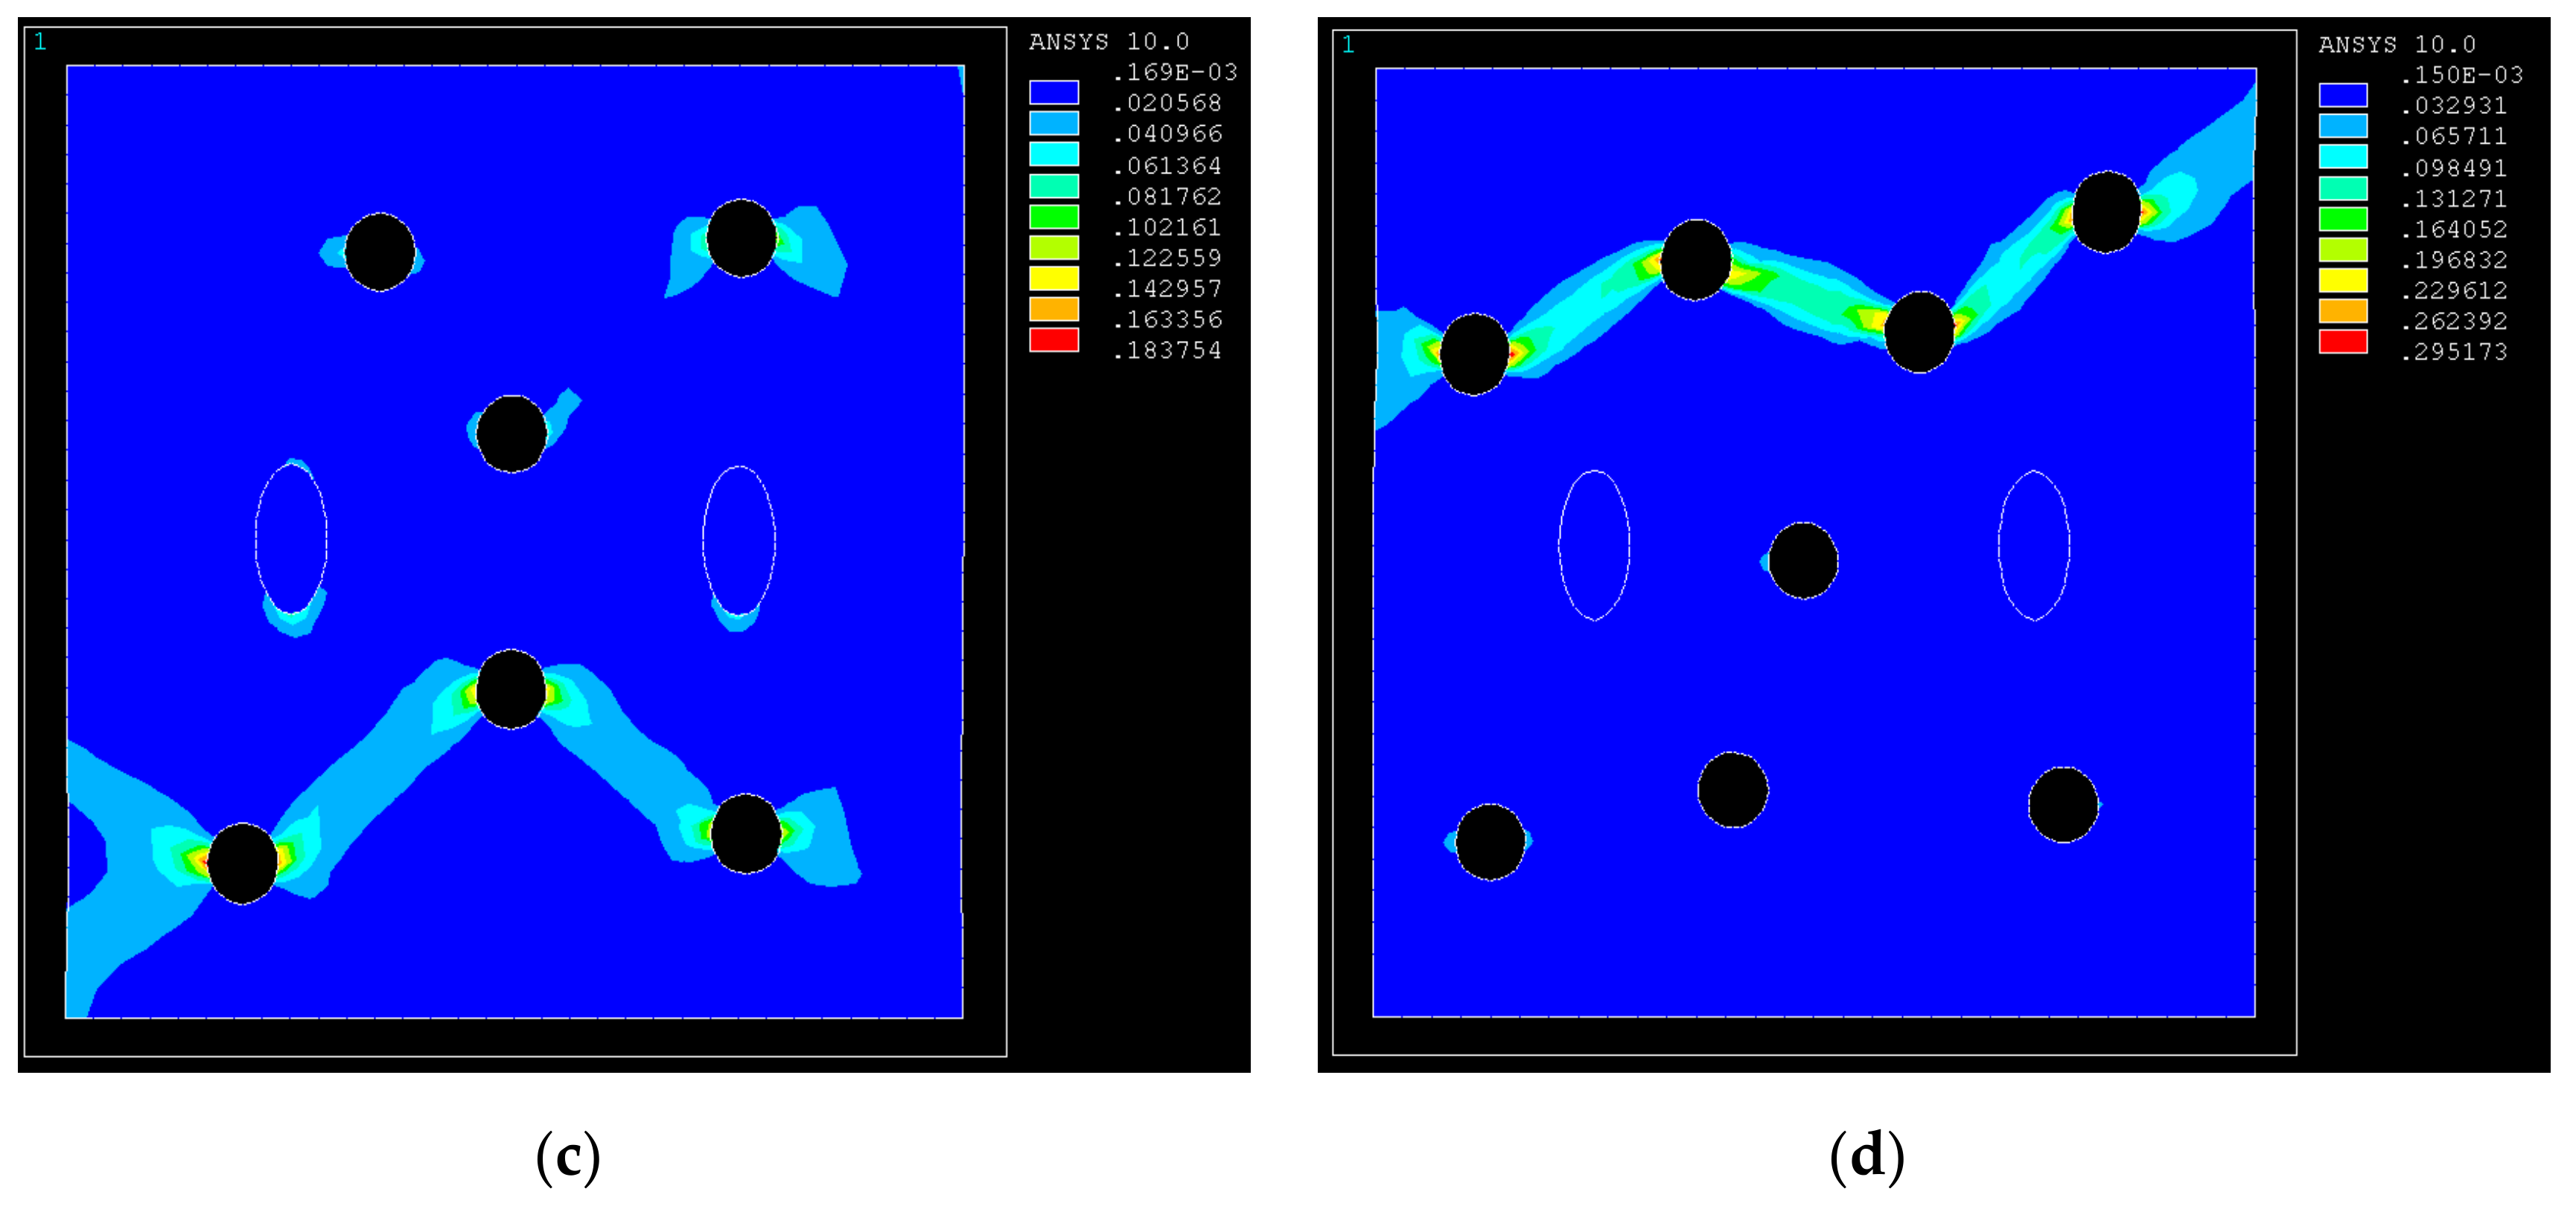
3.2. Effect of Different Porosities on the Mechanical Behavior of GRANs

The effects of stress and strain field distribution of GRANs with 1.2%, 2.4%, 3.6%, and 4.8% porosity under tensile load were simulated. Figure 2 illustrates the Von Mises equivalent stress diagram of the composite material under an additional 1% displacement load, and Figure 3 shows the equivalent strain diagram. Figure 2 shows that the stress in the reinforcement is larger than the matrix and still bears a larger stress; the matrix stress near the direction of pore stretching is smaller, while the stress on the two sides of the matrix is larger, and there is a certain degree of stress concentration. It is shown that the existence of pores in the material will change the matrix stress distribution, and its stress distribution state is related to the direction of the applied load. As the porosity increases, the overall stress in the matrix decreases first, then increases, and then decreases, but the matrix around the pores has the same stress distribution.
Figure 3 shows that the deformation of the reinforcement is small, and the equivalent strain distribution in the matrix is extremely uneven. The maximum equivalent strain in the matrix does not appear near the top of the reinforcement, but it is located near the sides of the pores. For example, For GRANs with a porosity of 4.8%, the maximum strain in the matrix on both sides of the pores is 0.295, which is much larger than the overall strain of the composite (1%), and for the closer pores, the matrix near the sides is connected into a large deformation area. This micropore aggregation might cause micro-cracks, which causes GRANs to break and make the composite fail. Therefore, the greater the porosity of GRANs, the higher the tendency of pore aggregation, and the greater the possibility of crack formation, it results in increased risk of failure. Figure 4 shows the stress-strain curves of GRANs with different porosities obtained by simulation.
Figure 4 shows that the four curves almost coincide in the elastic deformation stage. From the plastic stage, the stress-strain curve of GRANs with different porosity changes. The strength of GRANs with 1.2 vol% porosity is the highest, and GRANs has the lowest strength, with the strength of 2.4 vol% and 3.6 vol% of GRANs in between. The matrix Al is a plastic material. The effective cross section of the composite material is weakened due to the existence of pores. As the porosity increases, the load bearing effect of GRANs is further weakened, which results in a decrease in the strength of GRANs.

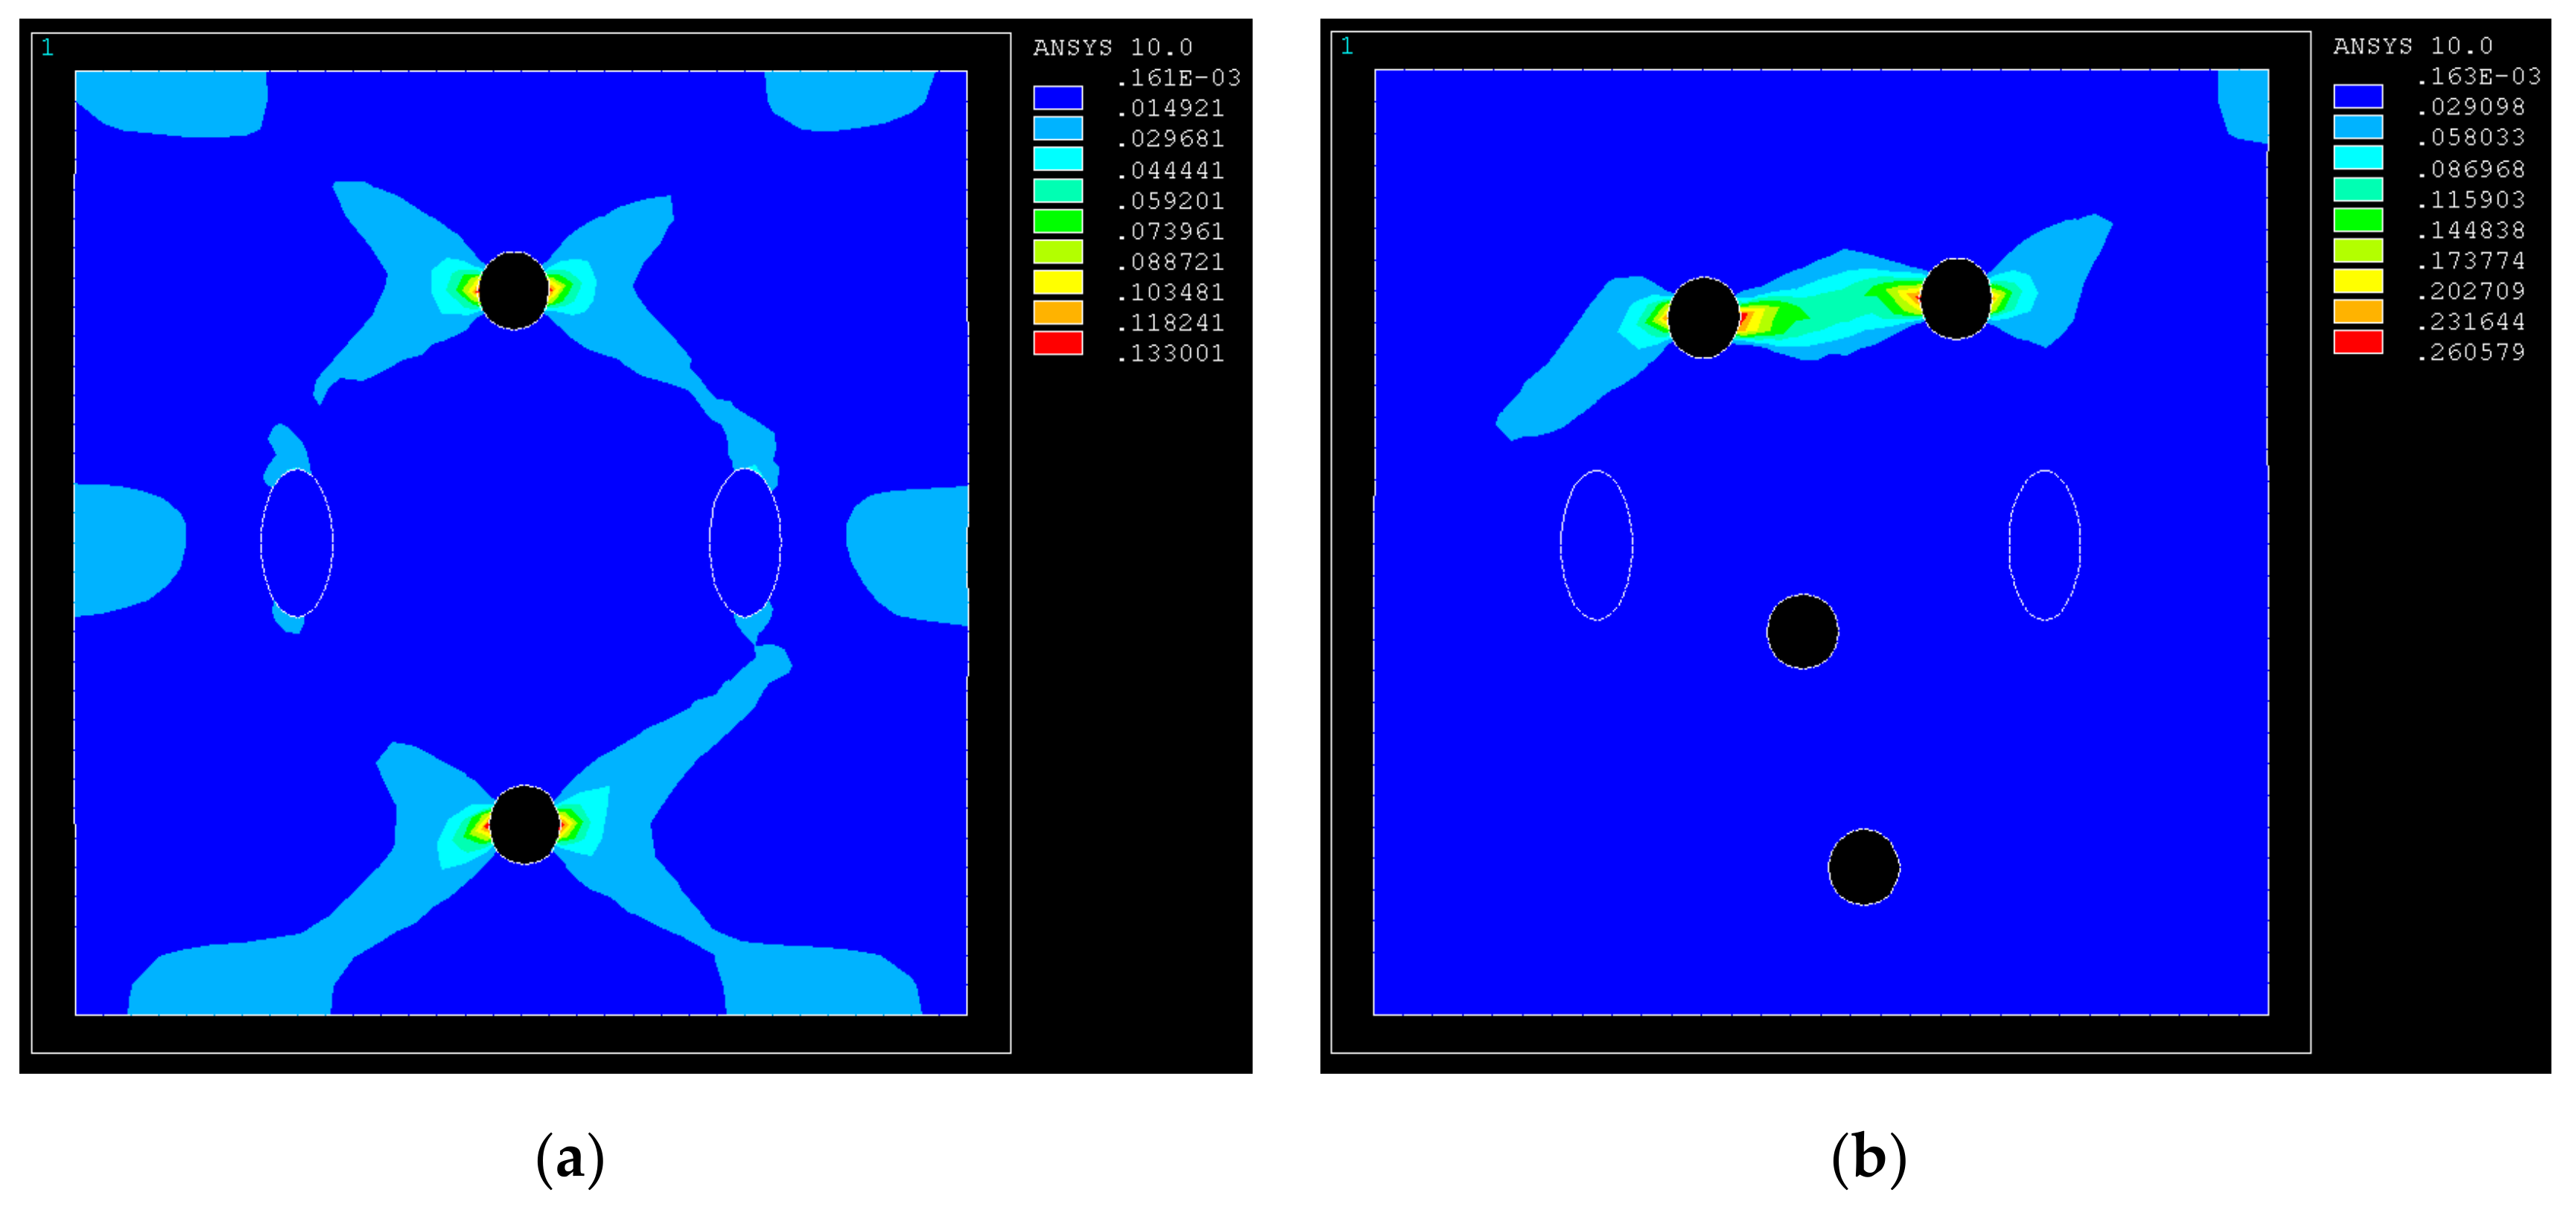
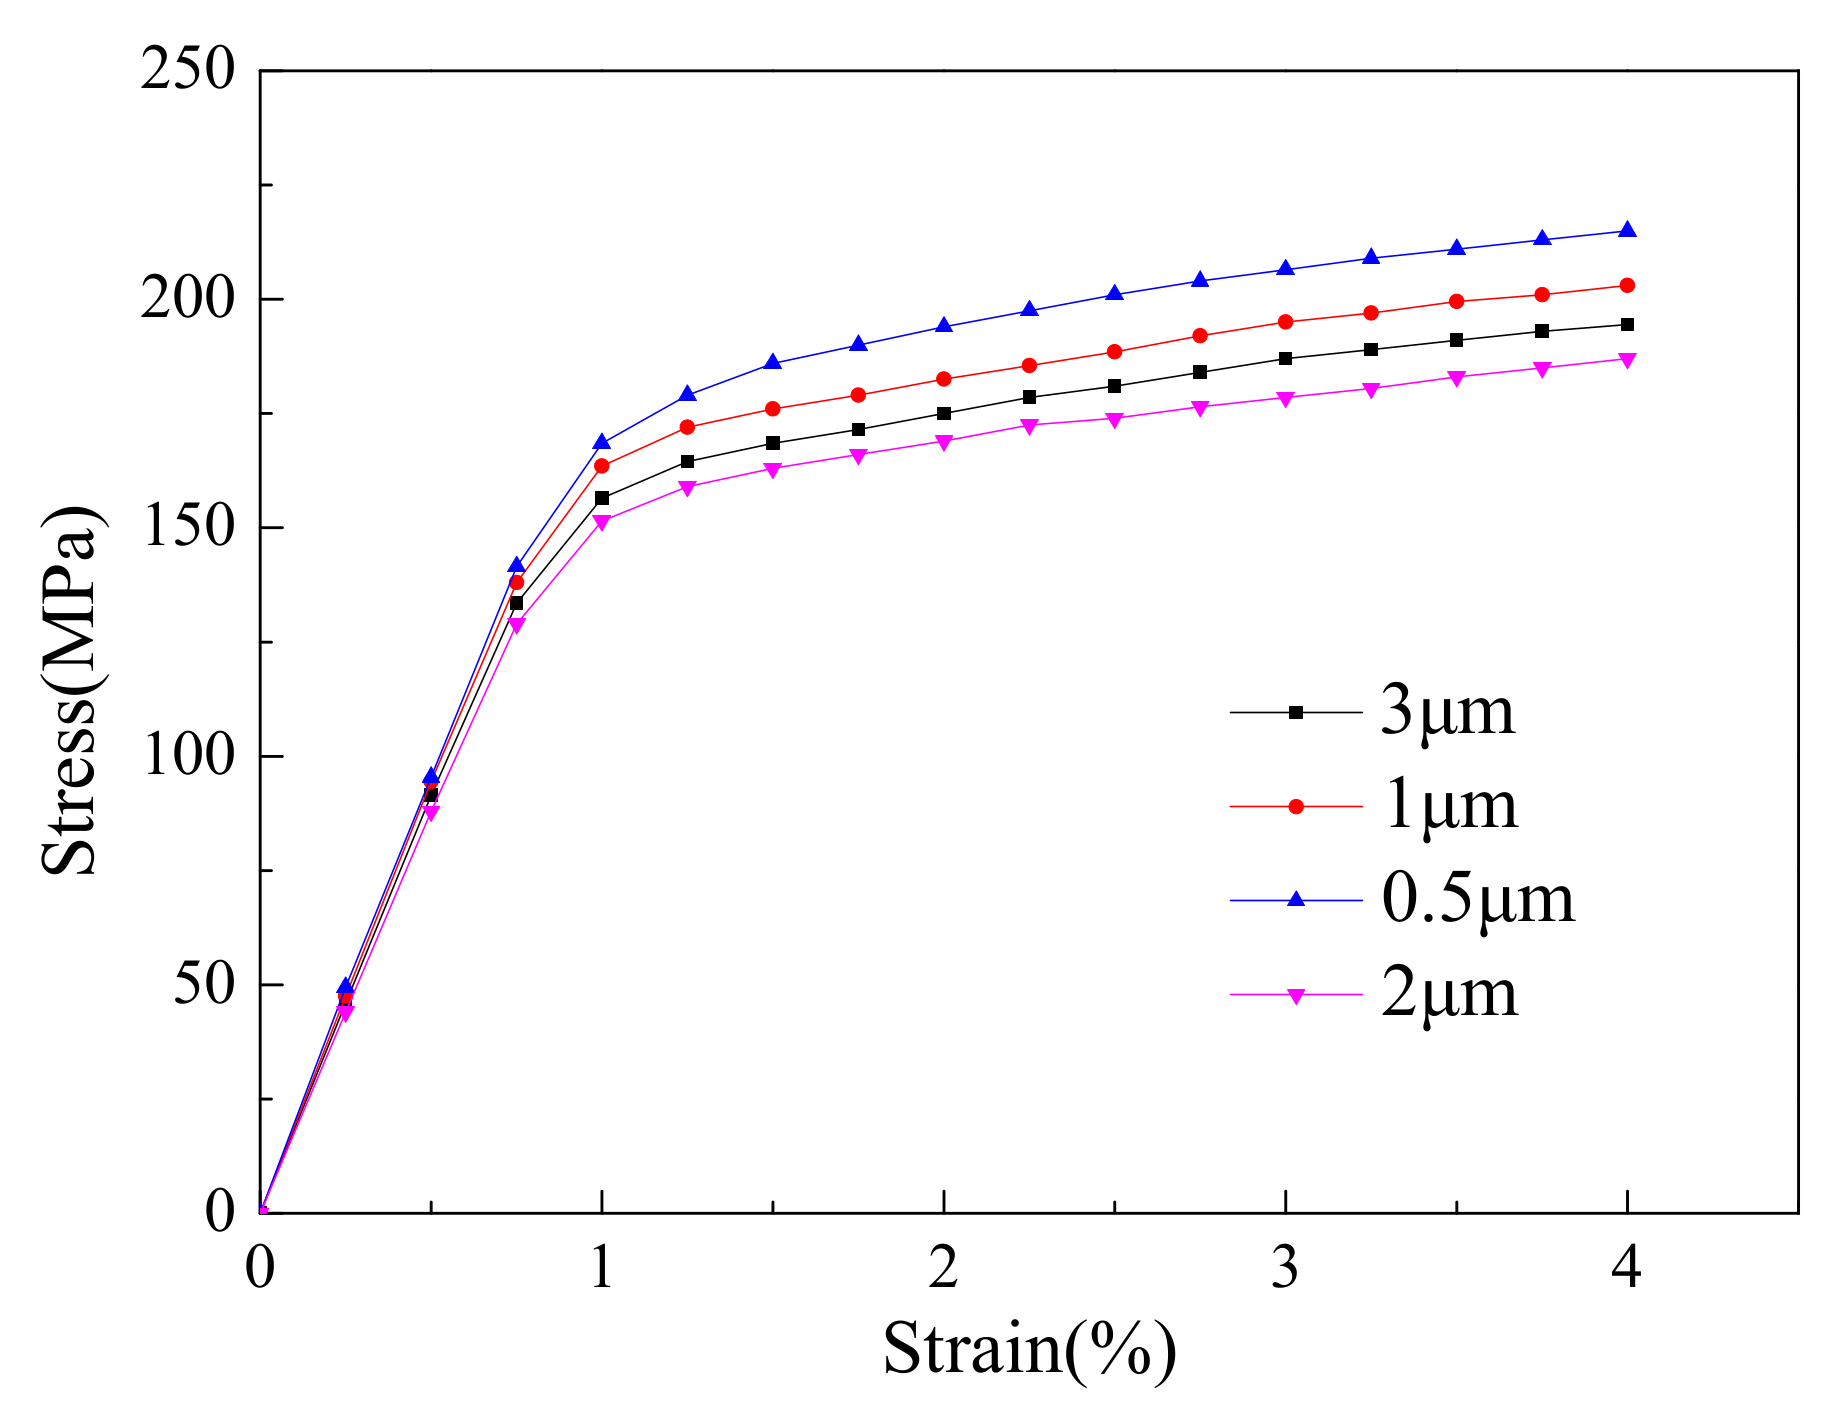
3.3. Effect of Pore Size on Mechanical Behavior of GRANs

The porosity of GRANs was 2.4%, and the pore diameters were 0.5, 1, 2, and 3 μm, respectively. Figure 5 is the equivalent stress diagram of Von Mises when a 1% displacement load is applied. Figure 5 shows that the stress in the reinforcement is higher than that of the matrix, and it carries a larger load. The stress distribution of the matrix around the pore is different, and the matrix stress on both sides of the pore is high. When the pore diameter is 0.5 μm, the matrix stress distribution is only uneven in small area near the pores. As the pore size increases, the stress distribution in the matrix becomes increasingly uneven, and the uneven area gradually increases. It shows that the larger the pore size, the greater the impact on the stress distribution of the surrounding matrix, the larger the affected area in the matrix, and the greater the performance hazard to GRANs.
Figure 6 shows the equivalent strain diagram of GRANs. It shows that the strain in the reinforcement is small and it is in the stage of elastic deformation and the stress distribution also changes. There is a higher strain gradient, and the matrix that is farther away from the pores has less strain. Under the combined effect of pore size and pore spacing, the strain around the pores will change accordingly. As shown in Figure 6c, the pore size is larger than that shown in Figure 6a,b. For some pores that are closer, the matrix strain is greater. Strains interact with each other, eventually forming a large strain band, and the maximum matrix strain around the pores is larger than the other three types of pore diameters, reaching 0.2606, which is much higher than the overall strain of the composite material by 1%. Stress concentration causes microcracks to form in the composite. Figure 6d shows that larger pore sizes cause greater strain near the pores. The large strain area of the matrix around the pores increases as the pore diameter increases. Figure 7 shows the stress-strain curves of GRANs with different pore sizes.
Figure 7 shows that the stress-strain curve of GRANs has the same trend at different pore diameters. In the elastic deformation stage, the curves are basically same, and, in the plastic stage, the amplitude of the curve is slightly different for different pore diameters. For smaller pore diameters, such as 1 and 0.5 μm, the smaller the pore diameters, the greater the stress in the plastic phase of GRANs. When the pore diameter is 2 and 3 μm, the stress at the plastic stage of GRANs is smaller than the pore diameter of 1 and 0.5 μm, but the stress of GRANs with a pore diameter of 3 μm is larger than that of 2 μm. This shows that the stress in the composite does not necessarily increase with the decrease of the pore diameter, which might be related to the specific distribution of the pores.
The experimentally prepared 2 vol% GRANs has a porosity of 1.2% and a pore diameter of about 2 μm. It is simulated with GRANs under the same conditions. Figure 8 shows the simulated stress-strain curve and experimental data.
Figure 8 shows that the simulated values and the experimental values fit well. In the elastic phase, the two curves are basically same. From the plastic deformation phase, the two curves have the same trend, but the numerical simulation values are slightly more than the experimental values. Those possible reasons are: (1) during the finite element simulation, the pores are assumed to be circular, but the shape of the pores in the actual composite material is irregular, which causes the measured value of the strength of the composite material to be lower than the simulated value. (2) Due to the poor wettability of the reinforced graphene and the aluminum matrix during the experiment, the GRANs interface usually cannot be well combined, and it is difficult to prepare graphene reinforced aluminum nanocomposites with good interfacial bonding [2,5,19]. The finite element model has an idealized interface without any defects, which causes the measured value of the composite strength to be lower than the simulation value, which is another important reason. (3) The difference between the idealized finite element model and the graphene used in the experiment will also affect the simulation results, which will make the simulation values higher than the experimental values.

4. Conclusions

The existence of pores of GRANs will affect the stress distribution in the matrix. The matrix stress in the pores along the tensile direction is small, while the larger stresses appear on both sides of the pores. The pores in the composite will cause stress concentration and large plastic deformation. Crack source. The change of porosity will not change the stress distribution of the matrix, but the higher the porosity, the greater the tendency of pore aggregation, and the higher the risk of GRANs l failure. The stress distribution in the matrix becomes more uneven as the pore size increases, and the large strain area of the matrix around the pores also increases. The simulation values are basically consistent with the experimental values. The finite element simulation values are larger than the experimental values because the defects existing in the composite material are not considered.

Author Contributions

W.W. prepared graphene reinforced aluminum nanocomposites under the guidance of D.L. S.S. performed methodology. D.Z. had supervision on manuscript. All authors discussed the results and participated in writing the manuscript. D.L. initiated and directed this research. All authors have read and agreed to the published version of the manuscript.

Funding

This project was supported by National Natural Science Foundation of China (51562027, 51575269 and 51975287), Advantage Technology Innovation Team of Jiangxi Province (20181BCB24007), and Science and Technology of University of PLA project (KYZXJK123).

Acknowledgments

The authors acknowledge lecturer Ye Yin of Nanchang Hangkong University for his technical support and the Department of Materials Science and Engineering of Nanchang Hangkong Universitiy.

Conflicts of Interest

The author declares no conflict of interest.

References

  1. Novoselov, K.S.; Geim, A.K.; Morozov, S.V.; Jiang, D.; Zhang, Y.; Dubonos, S.V.; Grigorieva, I.V.; Firso, A.A. Electric Field Effect in Atomically Thin Carbon Films. Science 2004, 306, 666–669. [Google Scholar] [CrossRef] [PubMed] [Green Version]
  2. Li, D.S.; Ye, Y.; Liao, X.J.; Qin, Q.H. A novel method for preparing and characterizing graphene nanoplatelets/aluminum nanocomposites. Nano Res. 2018, 11, 1642–1650. [Google Scholar] [CrossRef]
  3. Dasari, B.L.; Brabazon, D.; Naher, S. Prediction of Mechanical Properties of Graphene Oxide Reinforced Aluminum Composites. Metals 2019, 9, 1077. [Google Scholar] [CrossRef] [Green Version]
  4. Porwal, H.; Tatarko, P.; Grasso, S.; Khaliq, J.; Dlouhý, I.; Reece, M.J. Graphene reinforced alumina nano-composite. Carbon 2013, 64, 359–369. [Google Scholar] [CrossRef]
  5. Peng, Y.; Hu, Y.; Han, L.; Ren, C. Ultrasound-assisted fabrication of dispersed two-dimensional copper/reduced graphene oxide nanosheets nanocomposites. Compos. Part B Eng. 2014, 58, 473–477. [Google Scholar] [CrossRef]
  6. Liu, J.; Yan, H.; Jiang, K. Mechanical properties of graphene platelet-reinforced alumina ceramic composites. Ceram. Int. 2013, 39, 6215–6221. [Google Scholar] [CrossRef]
  7. Kanit, T.; Forest, S.; Galliet, I.; Mounoury, V.; Jeulin, D. Determination of the size of the representative volume element for random composites: Statistical and numerical approach. Int. J. Solids Struct. 2003, 40, 3647–3679. [Google Scholar] [CrossRef]
  8. Harper, L.T.; Qian, C.; Turner, T.A.; Li, S.; Warrior, N.A. Representative volume elements for discontinuous carbon fibre composites-Part 1: Boundary conditions. Compos. Sci. Technol. 2012, 72, 225–234. [Google Scholar] [CrossRef]
  9. Huang, X.; Qi, X.; Boey, F.; Zhang, H. Graphene-Based Composites. Chem. Soc. Rev. 2012, 41, 666–686. [Google Scholar] [CrossRef] [PubMed]
  10. Singh, V.; Joung, D.; Zhai, L.; Das, S.; Khondaker, S.I.; Seal, S. Graphene based materials: Past, present and future. Prog. Mater. Sci. 2011, 56, 1178–1271. [Google Scholar] [CrossRef]
  11. Hu, Y.; Jin, J.; Wu, P.; Zhang, H.; Cai, C. Graphene–gold nanostructure composites fabricated by electrodeposition and their electrocatalytic activity toward the oxygen reduction and glucose oxidation. Electrochim. Acta 2010, 56, 491–500. [Google Scholar] [CrossRef]
  12. Protich, Z.; Wong, P.; Santhanam, K.S.V. A new graphene composite with a high coulombic efficiency. J. Power Sources 2016, 33215, 337–344. [Google Scholar] [CrossRef] [Green Version]
  13. Niyitanga, T.; Jeong, H.K. Graphite oxide and molybdenum disulfide composite for hydrogen evolution reaction. Chem. Phys. Lett. 2017, 6851, 451–456. [Google Scholar] [CrossRef]
  14. Lin, Q.Y.; Zeng, Y.H.; Liu, D.; Jing, G.Y.; Liao, Z.M.; Yu, D. Step-by-step fracture of two-layer stacked graphene membranes. ACS Nano 2014, 8, 10246–10251. [Google Scholar] [CrossRef] [PubMed]
  15. Tang, J.M.; Lee, W.I.; Springer, G.S. Effects of cure pressure on resin flow, voids, and mechanical propertise. J. Compos. Mater. 1987, 21, 421–440. [Google Scholar] [CrossRef]
  16. Mokhireva, K.A.; Svistkov, A.L.; Solod’ko, V.N.; Komar, L.A.; Stöckelhuber, K.W. Experimental analysis of the effect of carbon nanoparticles with different geometry on the appearance of anisotropy of mechanical properties in elastomeric composites. Polym. Test. 2017, 59, 46–54. [Google Scholar] [CrossRef]
  17. Zhang, W.; Yamashita, S.; Kita, H. Progress in tribological research of SiC ceramics in unlubricated sliding-A review. Mater. Des. 2020, 190, 108528. [Google Scholar] [CrossRef]
  18. Xu, G.; Aydemir, N.; Kilmartin, P.A.; Travas-Sejdic, J. Direct laser scribed graphene/PVDF-HFP composite electrodes with improved mechanical water wear and their electrochemistry. Appl. Mater. Today 2017, 8, 35–43. [Google Scholar] [CrossRef]
  19. Dixit, S.; Mahata, A.; Mahapatra, D.R.; Kailas, S.V.; Chattopadhyay, K. Multi-layer grapheme reinforced aluminum—Manufacturing of high strength composite by friction stir alloying. Compos. Part B Eng. 2018, 1361, 63–71. [Google Scholar] [CrossRef]
Figure 1. Stress-strain diagram of graphene reinforced aluminum nanocomposites (GRANs), (a) stress distribution without pore defects, (b) strain distribution without pore defects, and (c) stress distribution with pore defects, (d) Strain distribution with pore defects.
Metals 10 00468 g001aMetals 10 00468 g001b
Figure 2. Stress diagram of GRANs with different porosities, (a) 1.2%, (b) 2.4%, (c) 3.6%, and (d) 4.8%.
Metals 10 00468 g002
Figure 3. Strain diagram of GRANs with different porosities, (a) 1.2%, (b) 2.4%, (c) 3.6%, and (d) 4.8%.
Metals 10 00468 g003aMetals 10 00468 g003b
Figure 4. Stress-strain curves of GRANs with different porosities.
Metals 10 00468 g004
Figure 5. Stress diagrams of GRANs with different pore sizes, (a) 0.5 μm, (b) 1 μm, (c) 2 μm, and (d) 3 μm.
Metals 10 00468 g005
Figure 6. Strain diagrams of GRANs with different pore sizes, (a) 0.5 μm, (b) 1 μm, (c) 2 μm, and (d) 3 μm.
Metals 10 00468 g006
Figure 7. Stress-strain curves of GRANs with different pore sizes by finite element simulation.
Metals 10 00468 g007
Figure 8. Comparative analysis of stress-strain curves of GRANs between simulation and experiment.
Metals 10 00468 g008

