Article

Digital Holographic Study of pH Effects on Anodic Dissolution of Copper in Aqueous Chloride Electrolytes

1
Jiangsu Key Laboratory of Green Synthetic Chemistry for Functional Materials, School of Chemistry & Material Science, Jiangsu Normal University, Xuzhou 221116, China
2
Jiangsu Key Laboratory of Advanced Laser Materials and Devices, School of Physics and Electronic Engineering, Jiangsu Normal University, Xuzhou 221116, China
*
Authors to whom correspondence should be addressed.
Metals 2020, 10(4), 487; https://doi.org/10.3390/met10040487
Submission received: 7 February 2020 / Revised: 28 March 2020 / Accepted: 3 April 2020 / Published: 7 April 2020

Abstract

:
The anodic dissolution of copper in chloride electrolytes with different pH has been investigated by using polarization measurements and digital holography. In acidic and neutral NaCl solutions, the oxidation processes of copper are almost the same: copper firstly dissolves as cuprous ions, which then produces the CuCl salt layer. The dissolution rate in the acidic solution is a little higher than that in the neutral. However, the mechanism is quite different in the alkaline NaCl solution: copper turns passive easily due to the formation of a relatively stable Cu2O film which results in pitting, and the dissolution rate of copper decreases before pit initiation.

Graphical Abstract

1. Introduction

Copper is one of the most important materials in the industry owing to its relatively noble properties. The anodic polarization of copper in acidic, neutral, and alkaline chloride media has received considerable attention in the literature [1,2,3,4,5,6,7,8,9,10,11,12,13,14]. As the electro-dissolution of Cu is found to be complex, the various mechanisms proposed can be applied for chloride electrolytes. In 2004, Kear et al., summarized copper corrosion in chloride electrolytes and concluded three different models of the initial electro-dissolution reactions of bare copper [1]. There are three possible initial reaction cases of the anodic polarization behavior of pure copper in acidic and neutral chloride media [1,10,12].
( I )   Cu     Cu + + e
Cu + + 2 Cl     CuCl 2
( )   Cu + Cl     CuCl + e
CuCl + Cl     CuCl 2
( )   Cu + 2 Cl     CuCl 2 + e
In recent years, the development and improvement of inhibitors of copper and its alloys in chloride media is of great interest to corrosion scientists and applied electrochemists [15,16,17,18,19,20,21,22,23,24,25,26,27,28,29,30,31]. The explanation of corrosion inhibition in presence of chloride ions are based on the three different models. Case I presents the direct formation of cuprous ions [15,16,18,22,30], whereas cases II [17,19,20,21,23,24,25,26,29,31] and III [27,28] involve the formation of cuprous chloride. It means that the reaction pathway is under debate up to the present in acidic and neutral chloride media [10,12,18,19,20,21,22,23,24,25,26,27,28,29,30,31].
Holographic interferometry has been widely employed to study dynamic electrochemical processes for recent decades [32,33,34,35,36,37,38,39,40,41,42,43,44,45]. The basis of holographic method for the observation of an electrode/electrolyte interface in an electrochemical system, is the generation and measurement of gradients in the refractive index of the solution adjacent to the electrode [32,33,35,36,37,38,39,40,41,42,43,44,45]. A common holographic setup of a solid/liquid interface is illustrated in Figure 1, which is based on a Mach-Zehnder interferometer. In the fields of electrochemistry and corrosion, the changes of concentration caused by electrochemical reactions at an electrode/electrolyte interface, lead to the changes in the refractive index and thus the variations of the phase of the object beam when it goes through the surface of the electrode, as shown in Figure 1. The phase changes can be encoded in the holograms via a CCD (charge coupled device) image sensor and then reconstructed by image processing algorithms [39,40]. The principle of the experiment is that the phase changes ∆Ф (usually called phase differences in optics) have a linear relationship with the ion concentration changes of electrolyte at the electrode/electrolyte interface [6,32,39,40,41]. As a non-destructive testing technology, the holographic method is sensitive to the high rate changes of the concentration of aqueous solutions. The dynamic concentration changes can be in situ monitored during electrochemical processes and the direct information concerning the electrode/electrolyte interface would provoke new insights into the mechanisms of electrochemical reactions.
The anodic processes of copper in chloride electrolytes are surprisingly complex as both soluble and insoluble products are involved. In our previous studies [6], anodic dissolution of copper in neutral NaCl solution was investigated with digital holography and potentiodynamic polarization. The results only confirmed that the first step is the formation of cuprous ions. In addition, the formation and dissolution of species may be depended upon the pH of the solution and the electrode potential. M. Antonijevic et al., investigated the pH effects on electrochemical behavior of copper [4] and its alloy [7] in presence of chloride ions with the open circuit potential and linear voltammetry. H. Curkovic et al., studied the pH influence on the efficiency of corrosion inhibiters of copper in chloride media [19]. J. Scully’s group found [46] and elucidated [47] the pH dependence of copper pitting in chlorinated and aerated Edwards synthetic drinking waters. Ni et al., found out that the pH of Cl containing solution played a crucial role in the polarity reversal of the Cu–304 stainless steel galvanic couple [48]. It can be concluded that the pH change in the solution has a significant effect on the copper corrosion and protection.
In order to verify the anodic dissolution mechanisms of copper in acidic, neutral, and alkaline chloride media, the electro-dissolution processes of copper in NaCl solutions with different pH have been investigated by monitoring the diffusion layers at the interface. We present detailed, time-resolved, in situ visualizations of the dynamic processes of anodic dissolution of copper directly at the electrode/electrolyte interface, using digital holography combined with potentiostatic and potentiodynamic polarization. The anodic dissolution mechanisms of copper in acidic, neutral, and alkaline chloride electrolytes are discussed, respectively.

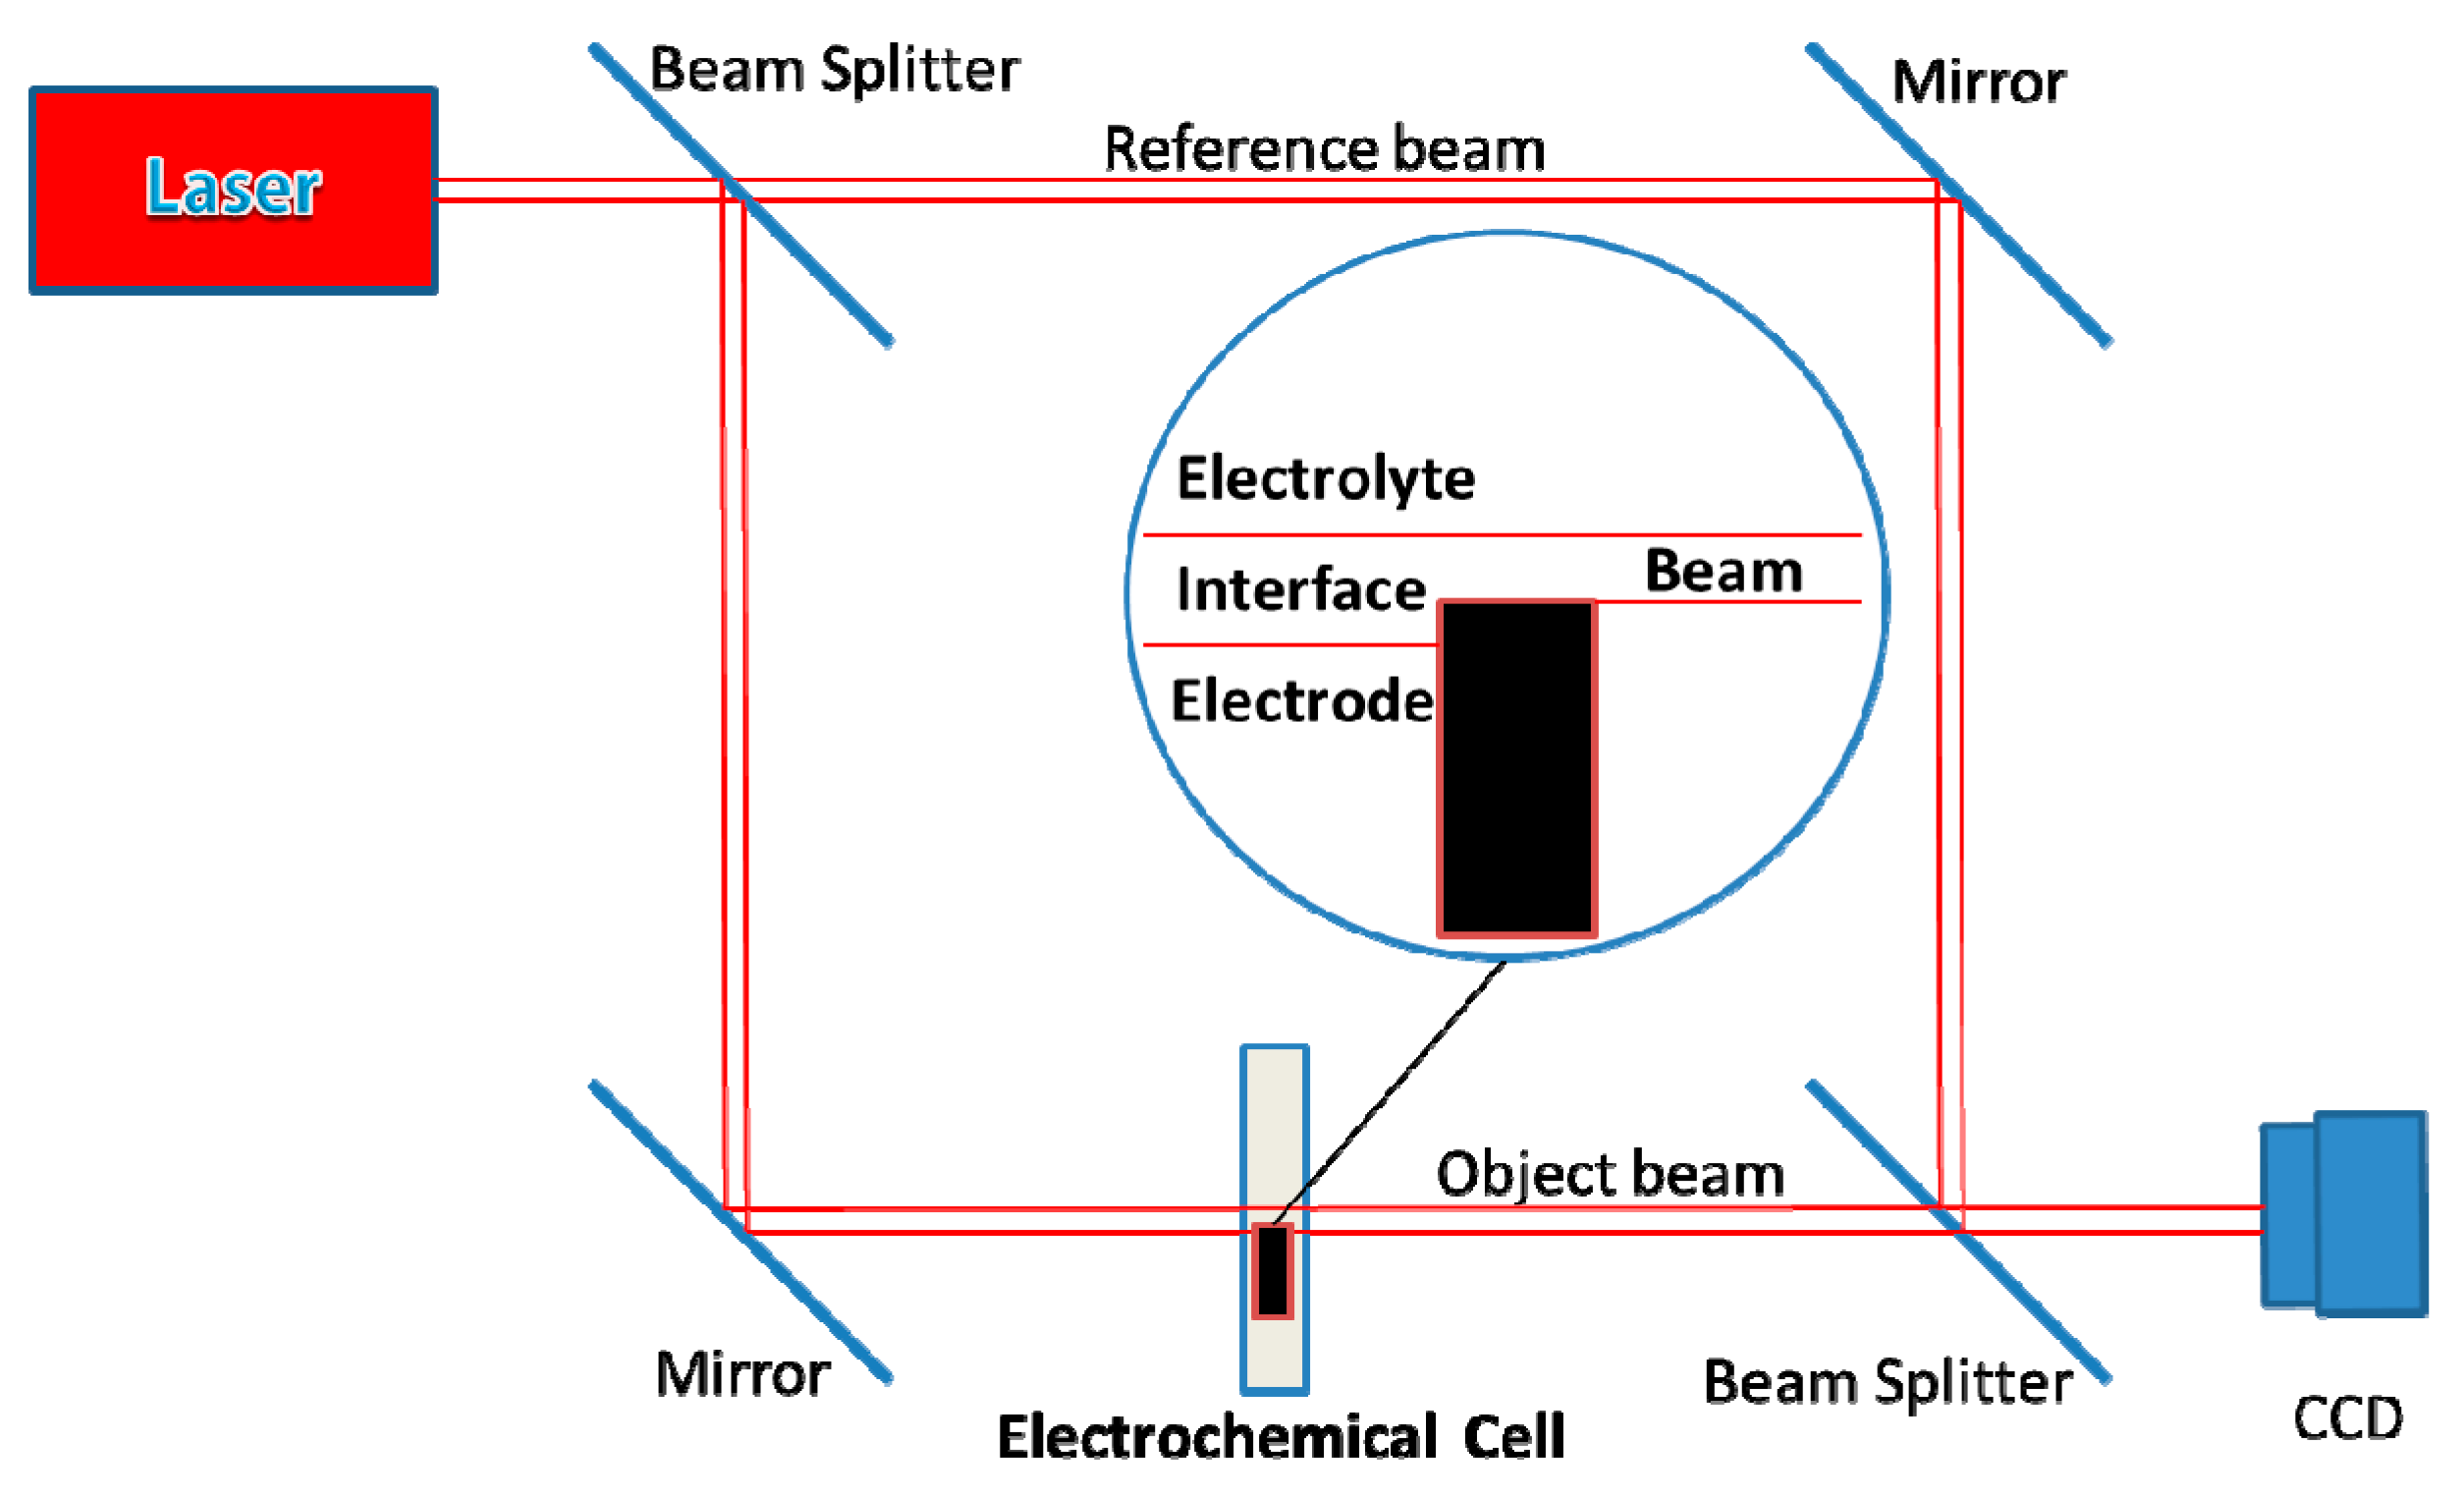
2. Materials and Methods

The electrochemical cell and the holographic measurement system were the same with our previous study [9]. The material used in the experiment was pure copper (99.99%, Aldrich). The working electrode was in the form of copper rod, with a diameter of 2 mm. The exposed area of Cu electrode to the solution was 3.14 mm2. The observed area in the holographic measurement is shown in Figure 2. Before each experiment, the copper electrode was mechanically abraded with #1500 and #3000 emery papers to a mirror-like surface and then cleaned by alcohol and triply distilled water in an ultrasonic bath. Three following electrolytes were used: 0.5 M NaCl, 0.5 M NaCl + 0.01 M HCl, and 0.5 M NaCl + 0.01 M NaOH. The voltammetric measurements were performed by means of the CHI 660B electrochemical station at room temperature under non-deaerated condition. All potentials reported were reported vs. SCE (saturated calomel electrode). Before the polarization measurements, the copper electrode was kept at −1200 mV vs. SCE for 10 min in the corresponding electrolyte to reduce the oxides on the surface. All of the scan rates were 10 mV/s in the potentiodynamic polarization measurements.

3. Results and Discussion

3.1. Neutral and Acid Chloride Electrolytes

It has been reported that the polarization behavior of copper in acid chloride solution is very similar to that in neutral chloride solution within the apparent Tafel region [1]. Firstly, anodic dissolution of copper in neutral and acid NaCl solutions was investigated by use of potentiodynamic polarization and digital holography.

3.1.1. Potentiodynamic and Holographic Results

The cyclic voltammograms of copper electrode in 0.5 M NaCl and 0.5 M NaCl + 0.01 M HCl solutions are shown in Figure 3. There are two anodic current density peaks in the curves. According to the E-pH diagram [49], the first peak is associated with the oxidation of Cu to Cu(I) and the second is related to the oxidation of Cu(I) to Cu(II) species. It is evident that the curve in neutral media is very similar to the one in acidic solution.
Figure 4 and Figure 5 present the phase maps reconstructed at the given potential points (a–h) in the forward scan curves of Figure 3a,b, respectively. In each curve, eight remarkable points are chosen and the corresponding phase maps are obtained with the digital holography. In each phase map, the left is electrode part and the right is solution. The copper/solution interface is marked as a black line in Figure 4a and Figure 5a. The color changes indicate ion concentration changes at the area, where turn yellow/red means increase while turn blue means decrease [6]. It is evident that the ions concentration at the interface experiences dramatic changes during the potentiodynamic polarization processes. The evolution of the diffusion layer in acidic solution is similar to that in neutral. According to the phase maps, both the anodic processes are divided into three sections, as shown in Figure 3a,b. In agreement with previous investigations [6], the holographic results indicate the following points: (1) the increase of concentration at section I (Figure 4b–d and Figure 5b–d) is caused by the formation of cuprous ions; (2) the formation of CuCl salt layer consumes amounts of chloride ions which lead to the decrease of concentration at the interface at section II (Figure 4e–f and Figure 5e–f); (3) the dissolution of CuCl salt layer ceases the decrease of the phase difference ∆Ф (Figure 4g and Figure 5g), then amounts of cupric ions are formed which lead to the sharp increase of the phase difference in section III (Figure 4h and Figure 5h). The holographic results confirm that the mechanisms proposed in neutral solution can be applied for in an acidic solution [1,4].

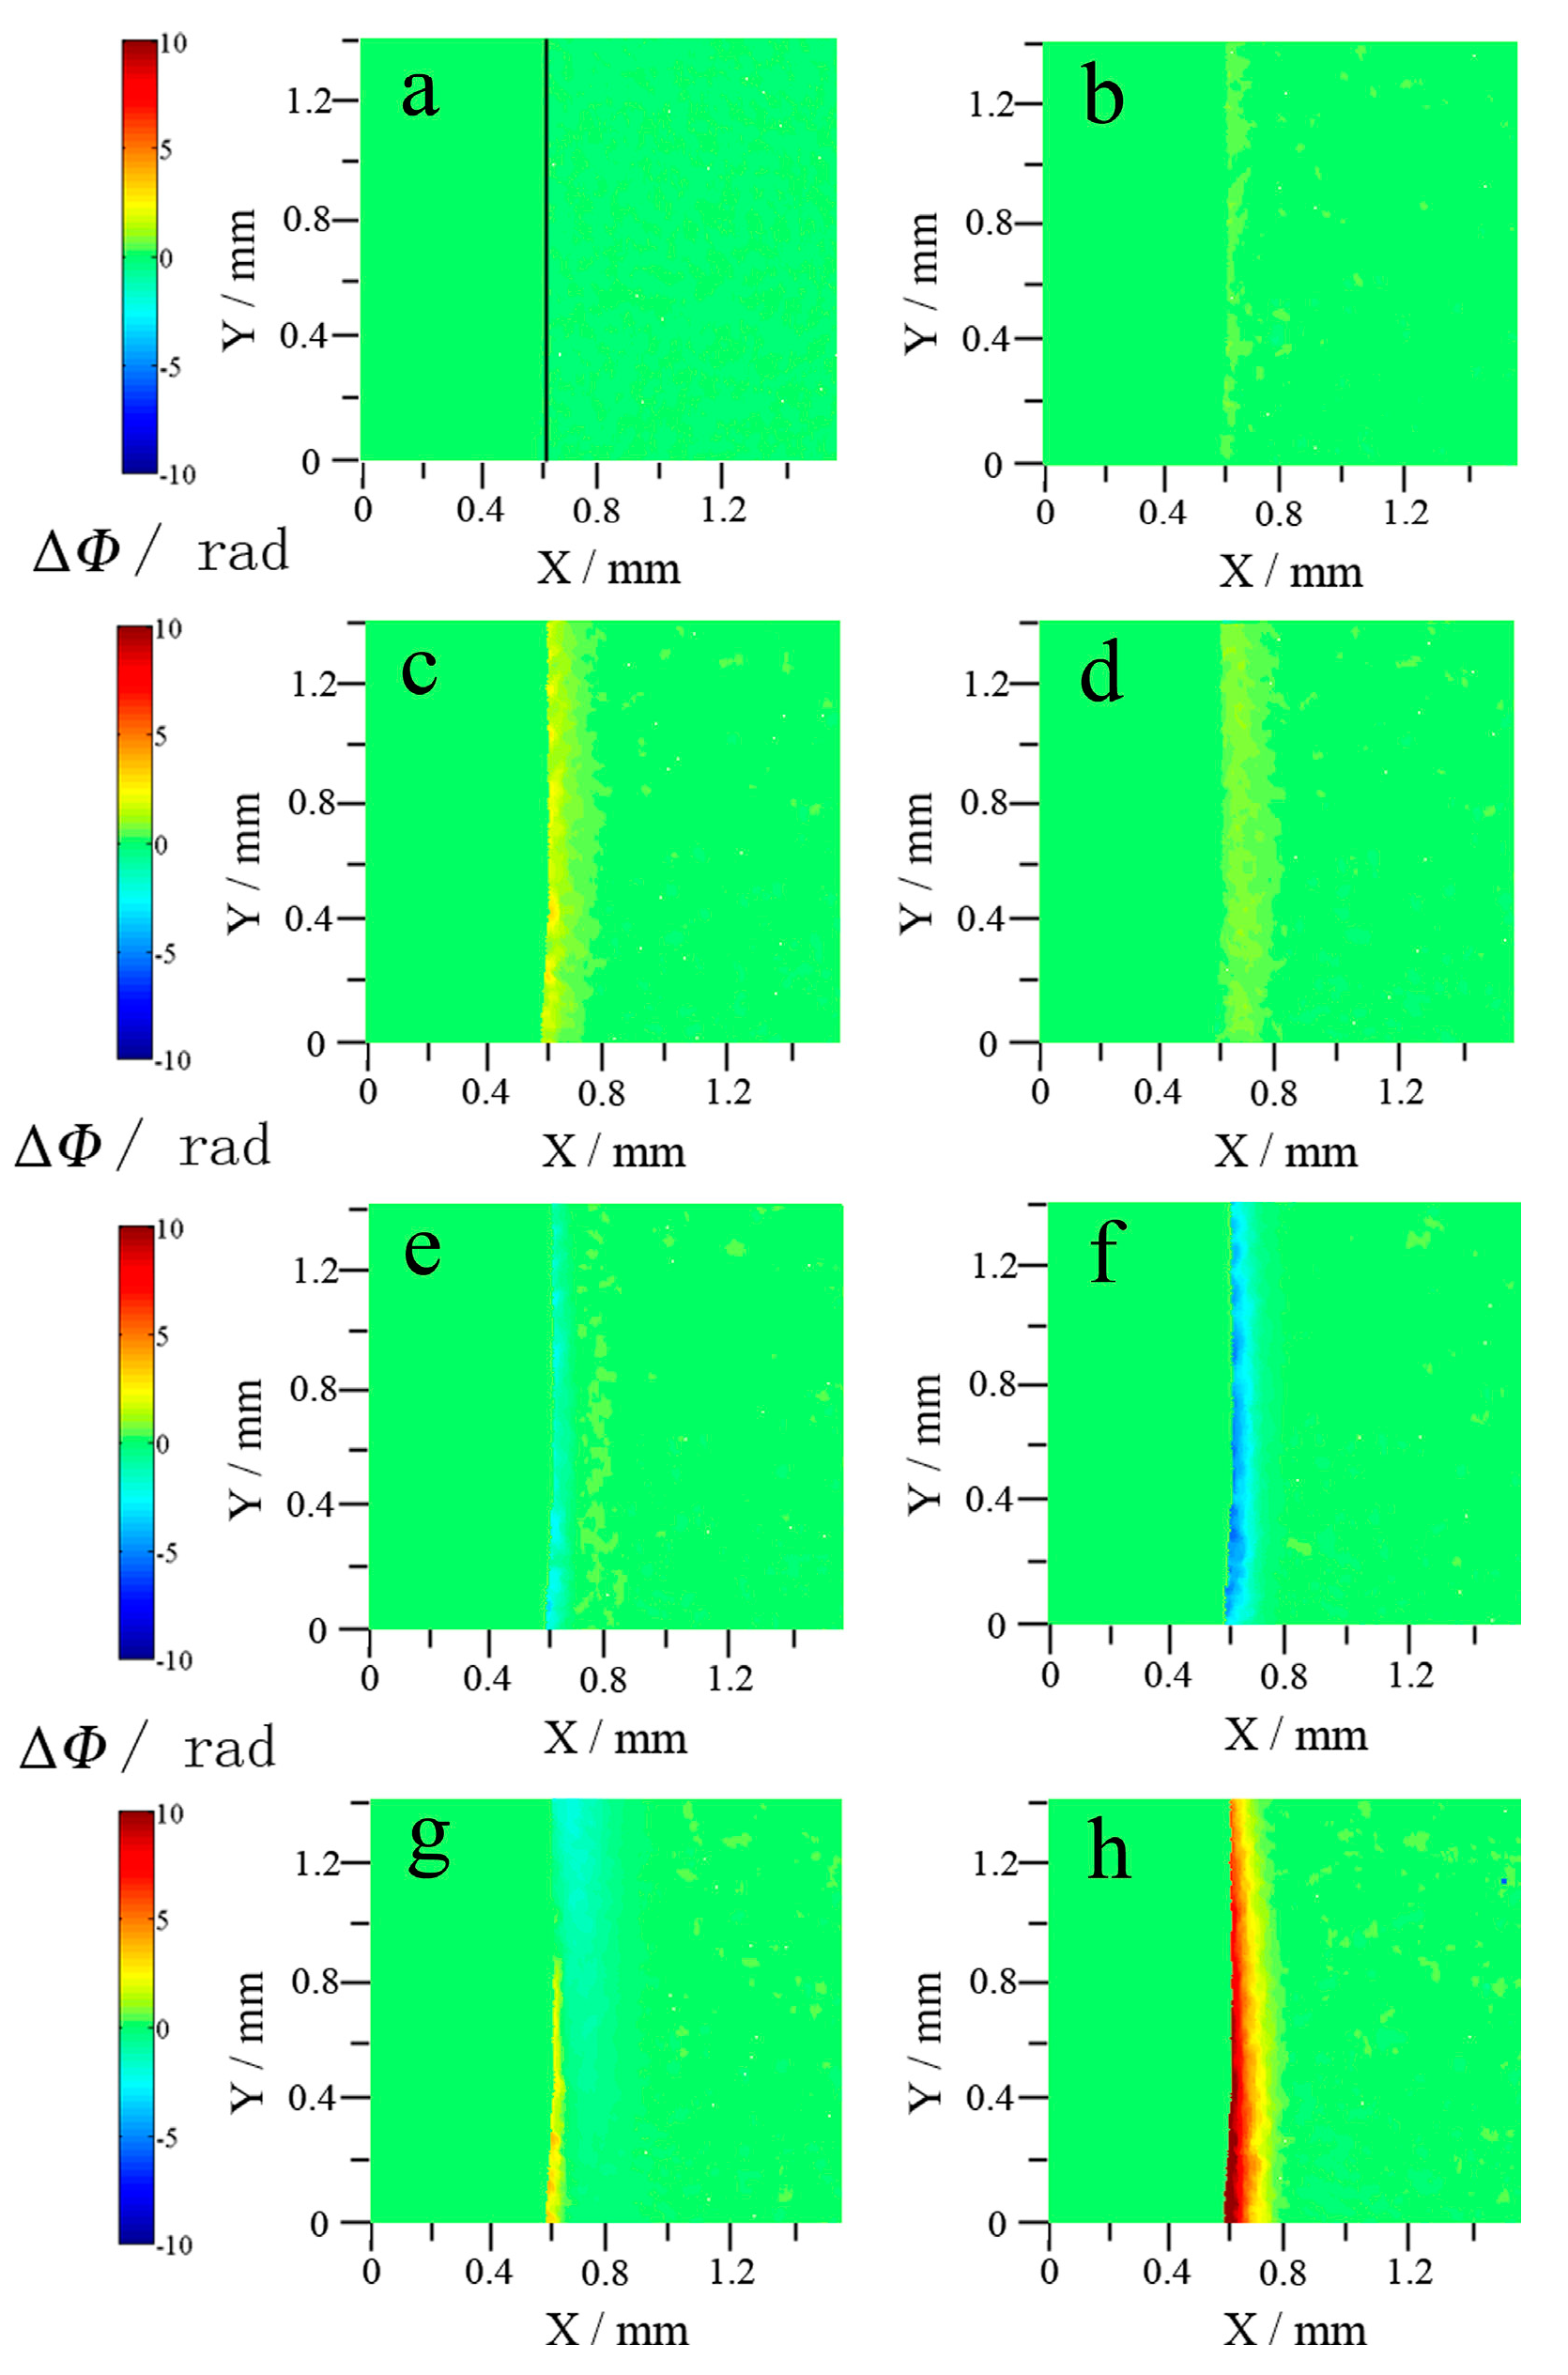
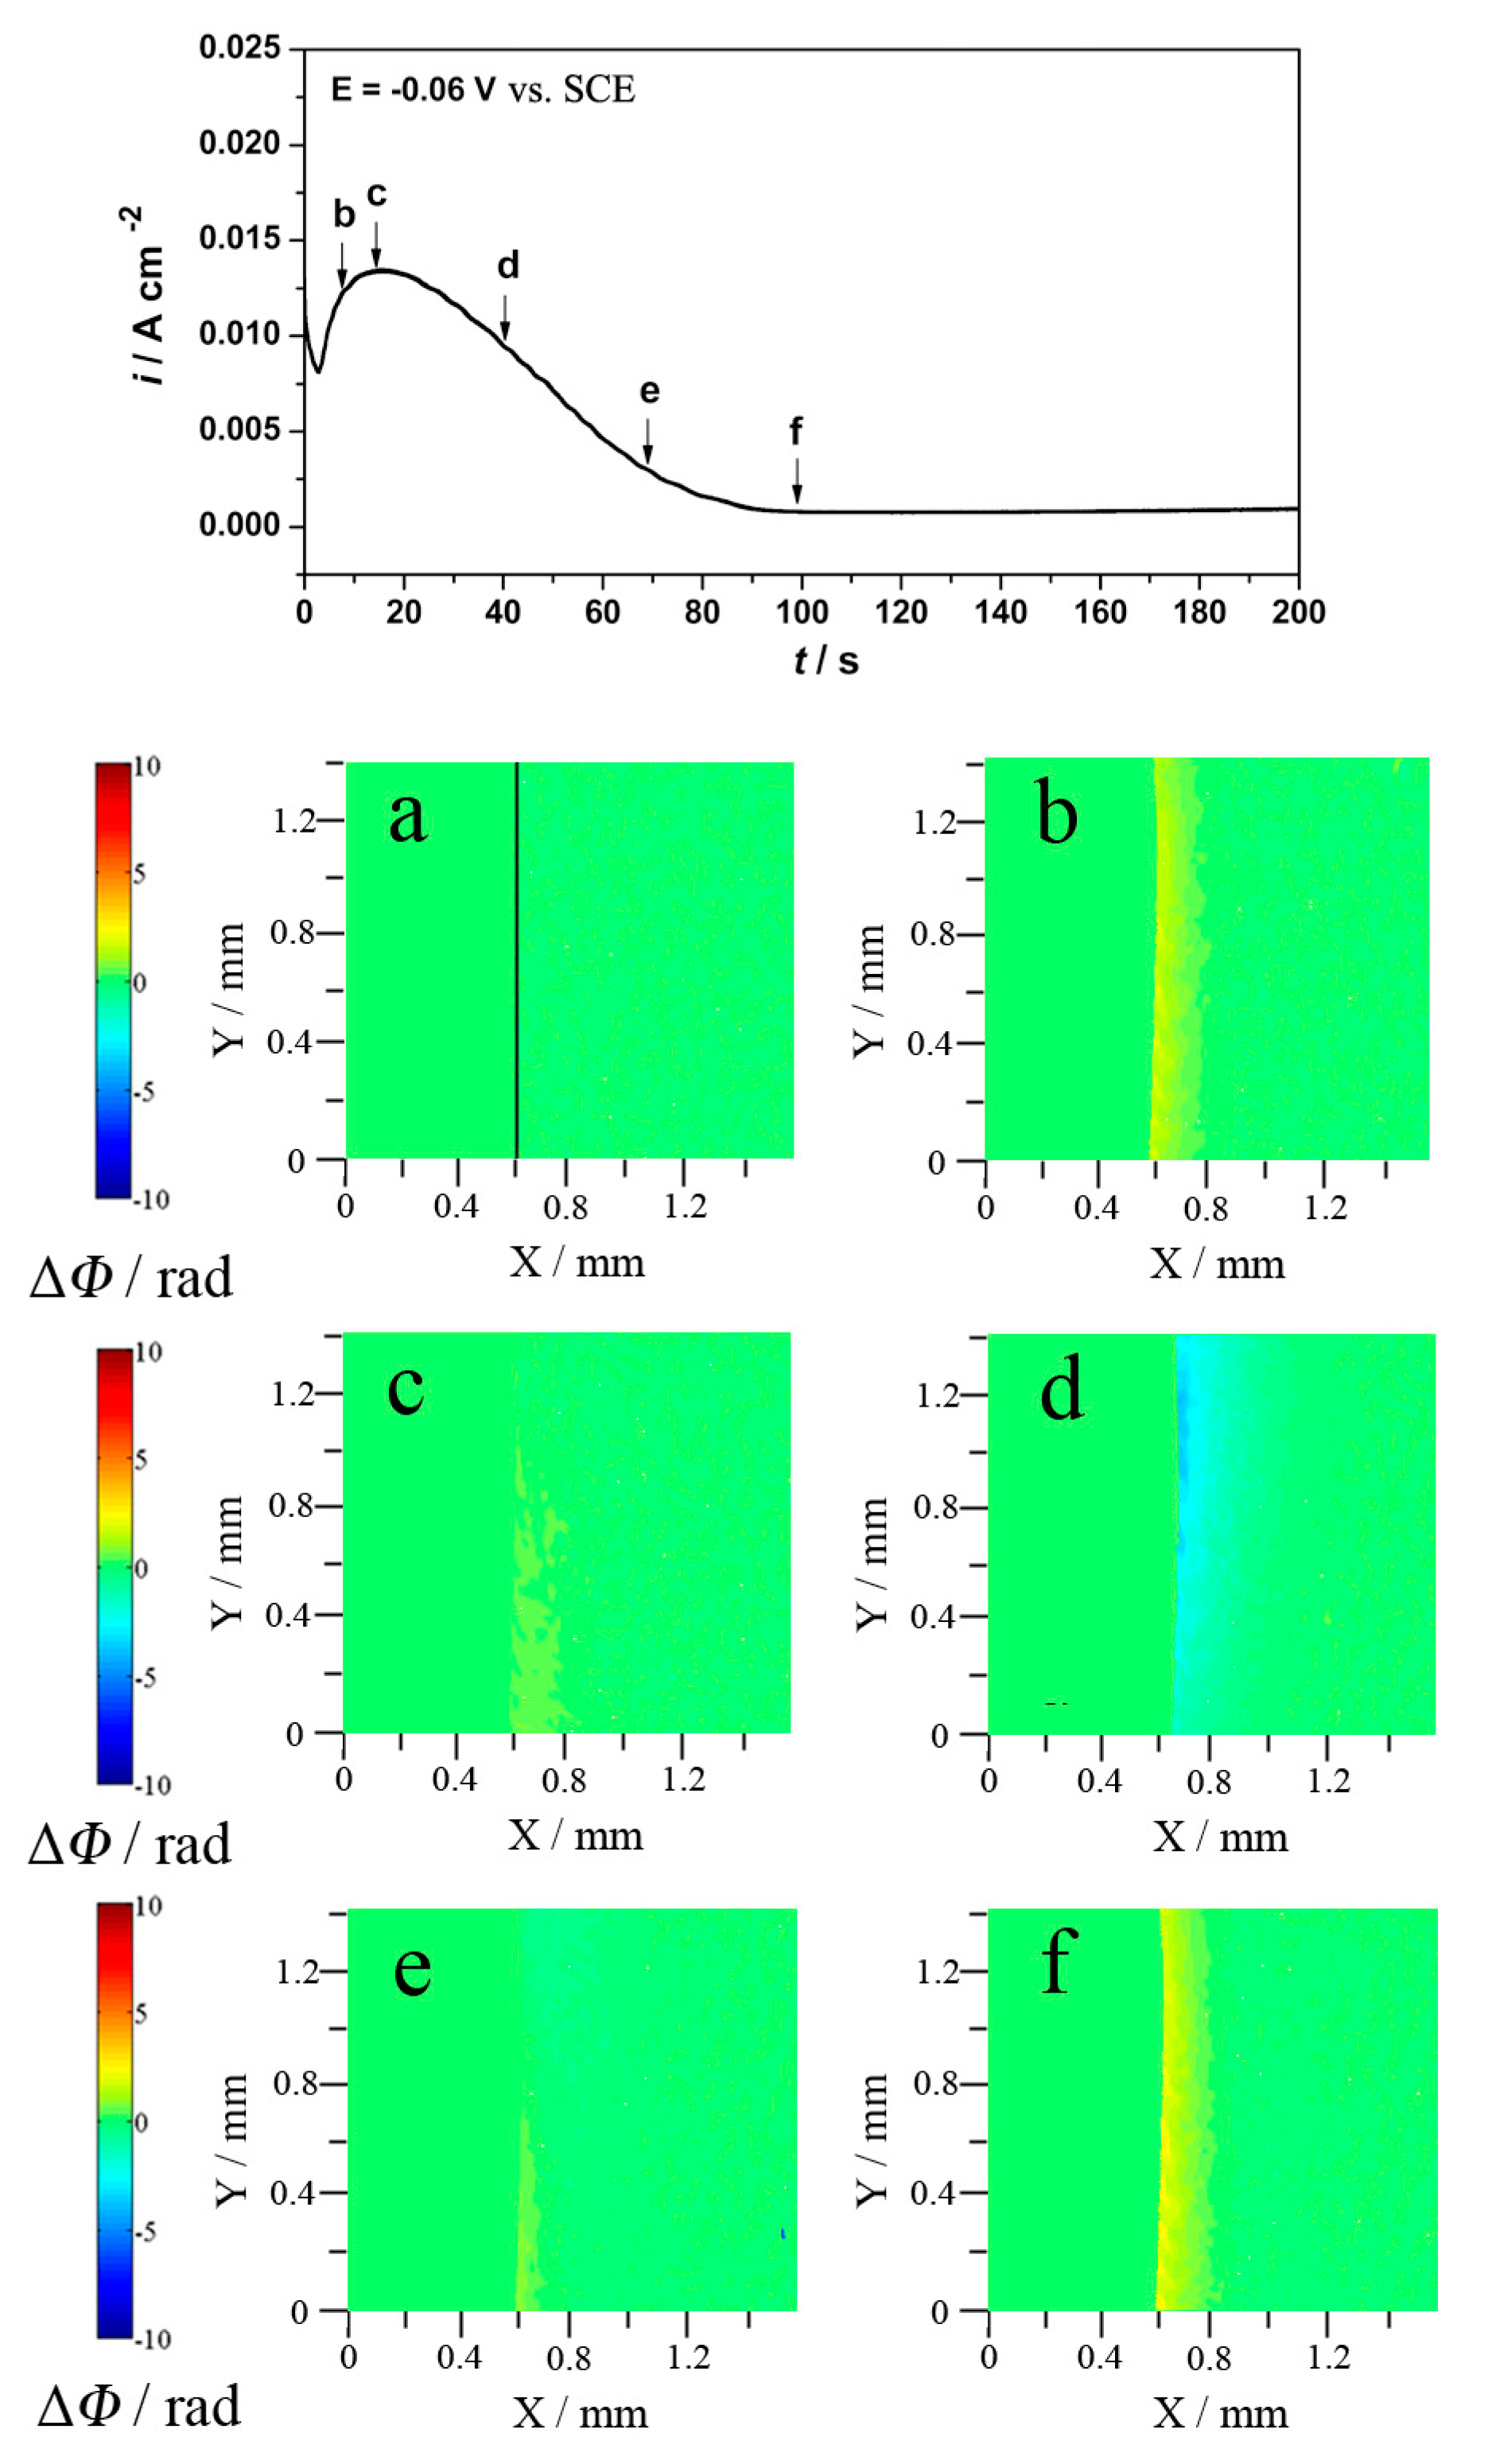
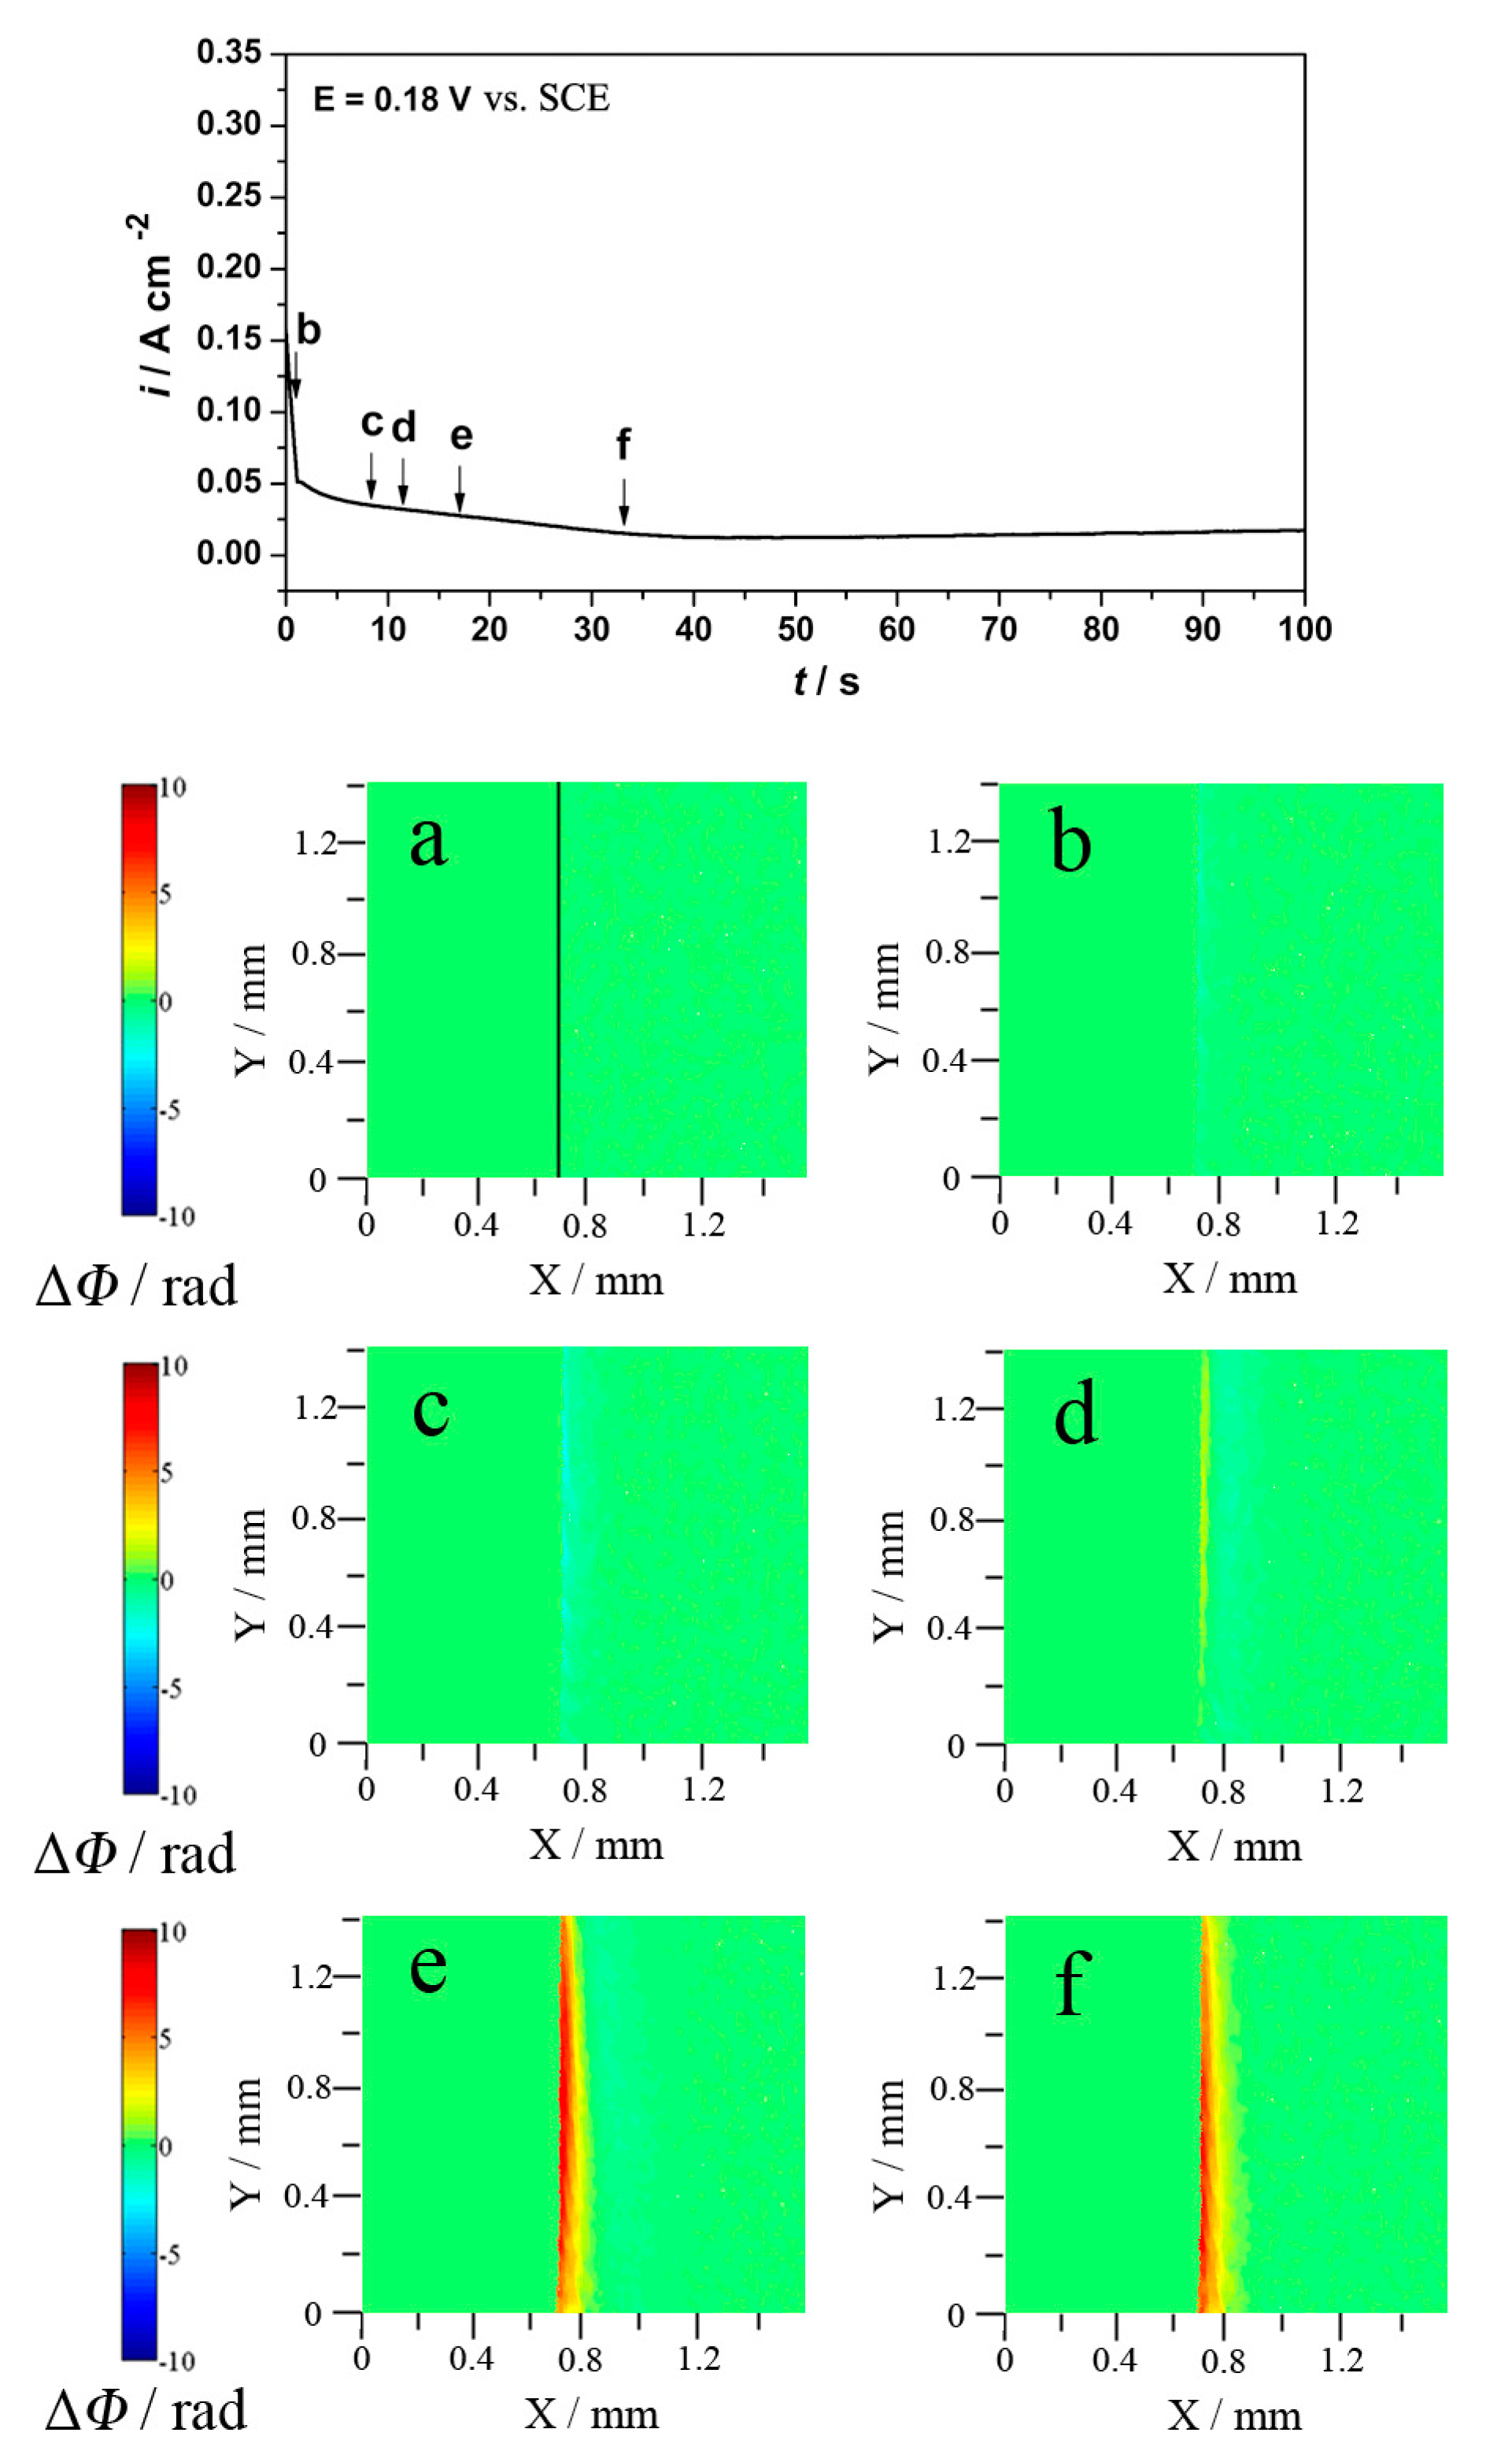
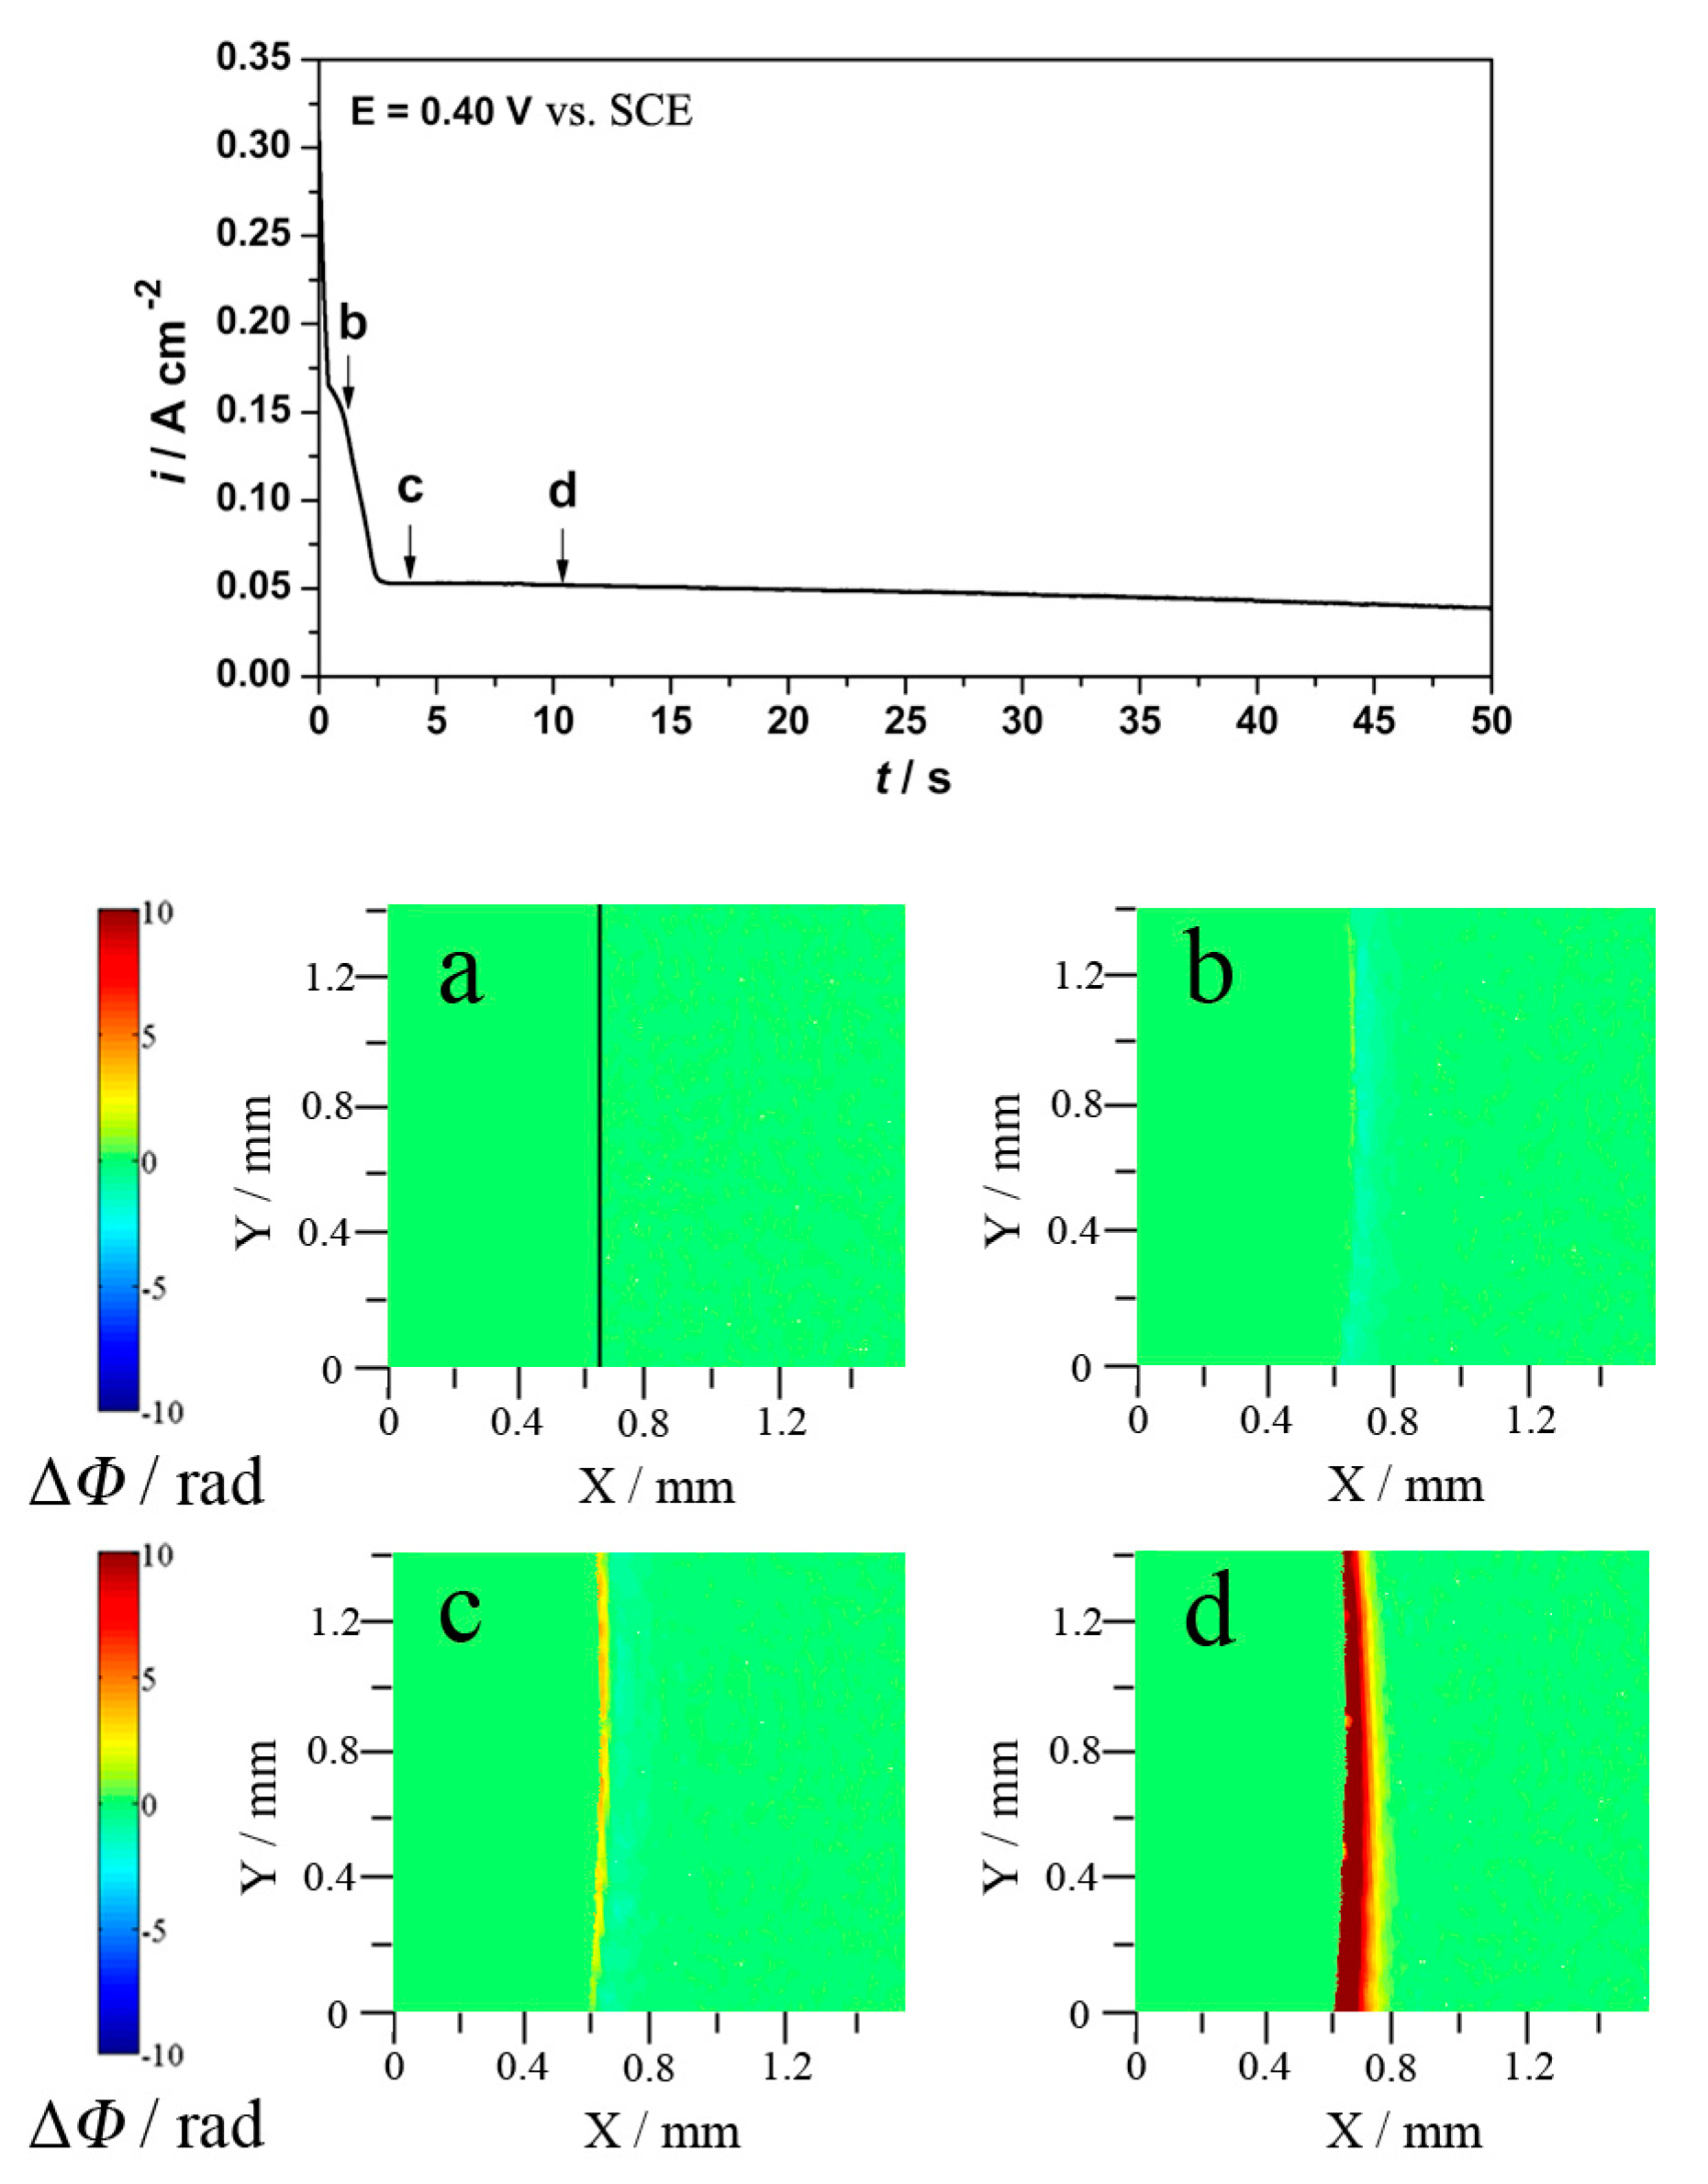
3.1.2. Potentiostatic and Holographic Results

Potentiostatic current-time tests were performed to give more insights into the reaction mechanisms during the anodic processes of copper. Since the anodic dissolution of copper in neutral and acid NaCl solutions can share the same reaction mechanisms, only the results in neutral media are exhibited in the following.
Three typical potentials (−60 mV, 180 mV, and 400 mV vs. SCE) were chosen and the corresponding holographic results were obtained. All the electrolytes were 0.5 M NaCl solution in the potentiostatic polarization measurements. In each experimental, the potential of copper electrode was jump to the selected potentials after 10 min reduction under −1200 mV vs. SCE. Figure 6 shows the i-t curve of the Cu/NaCl system and the corresponding phase maps under the potential of −60 mV vs. SCE. There is a peak in the curve before the current density comes to a stable value. The concentration at the interface increases at point b firstly, as shown in Figure 6b, then it decreases gradually at points c and d (Figure 6c,d). Finally, it increases again at points e and f (Figure 6e,f). Since the applied potential (−60 mV vs. SCE) was lower than the first peak potential in Figure 3, it is reasonable to believe that the current increased first due to the formation of the cuprous ions (point b), then began to decrease after the current peak for the formation of the CuCl film (points c and d). Finally, CuCl dissolves as CuCl2 and the current tended to be stable (point f).
Figure 7 and Figure 8 show the i-t curve and phase maps under the potential of 180 mV vs. SCE and 400 mV vs. SCE, respectively. The current density drops directly in the curves. From these phase maps, it can be seen evidently that the concentration at the interface firstly decreases and then increases at the plateau current region. At the initial stage, there is no concentration increase, indicating the phase maps cannot trace cuprous ions in the solution. The formation of cuprous chloride salt layer consumes chloride ions and leads to the decrease of the phase difference (Figure 7b–d and Figure 8b–c). At these relatively high potentials, there may not be enough time for cuprous ions to diffuse into the solution. When the current density is relatively stable, the cuprous chloride salt layer dissolves as cupric ions and the concentration at the interface increases sharply (Figure 7e–f and Figure 8d). According to Figure 7f and Figure 8d, more cupric ions are formed at higher potential when the current density is stable. Compared with these phase maps (Figure 6, Figure 7 and Figure 8), when the potential increases, the cuprous chloride layer forms faster but its time of duration becomes shorter.
In neutral NaCl solution, copper dissolves as cuprous ions near the corrosion potential. With the increase of the electrode potential, a large amount of CuCl salt layer forms and covers on the electrode surface at the first oxidation peak. The phase difference begins to grow after the peak. Before the turn over point, part of CuCl dissolves as cuprous dichloride complex. If the potential is persistent at a point in the region of the first peak, the formation and dissolution balance of CuCl is formed and the current density is limited by the transport of CuCl2. When the potential continues to rise, the CuCl layer dissolves into cupric ions and chloride ions, which lead to a great growth of the phase difference and thus a steep concentration gradient layer at the interface. The reaction pathway of the initial stage of copper anodic dissolution in neutral NaCl solution is:
Cu     Cu + + e
Cu + + Cl     CuCl
CuCl + Cl     CuCl 2
The proposed reaction mechanisms are also applied for acid NaCl solution.

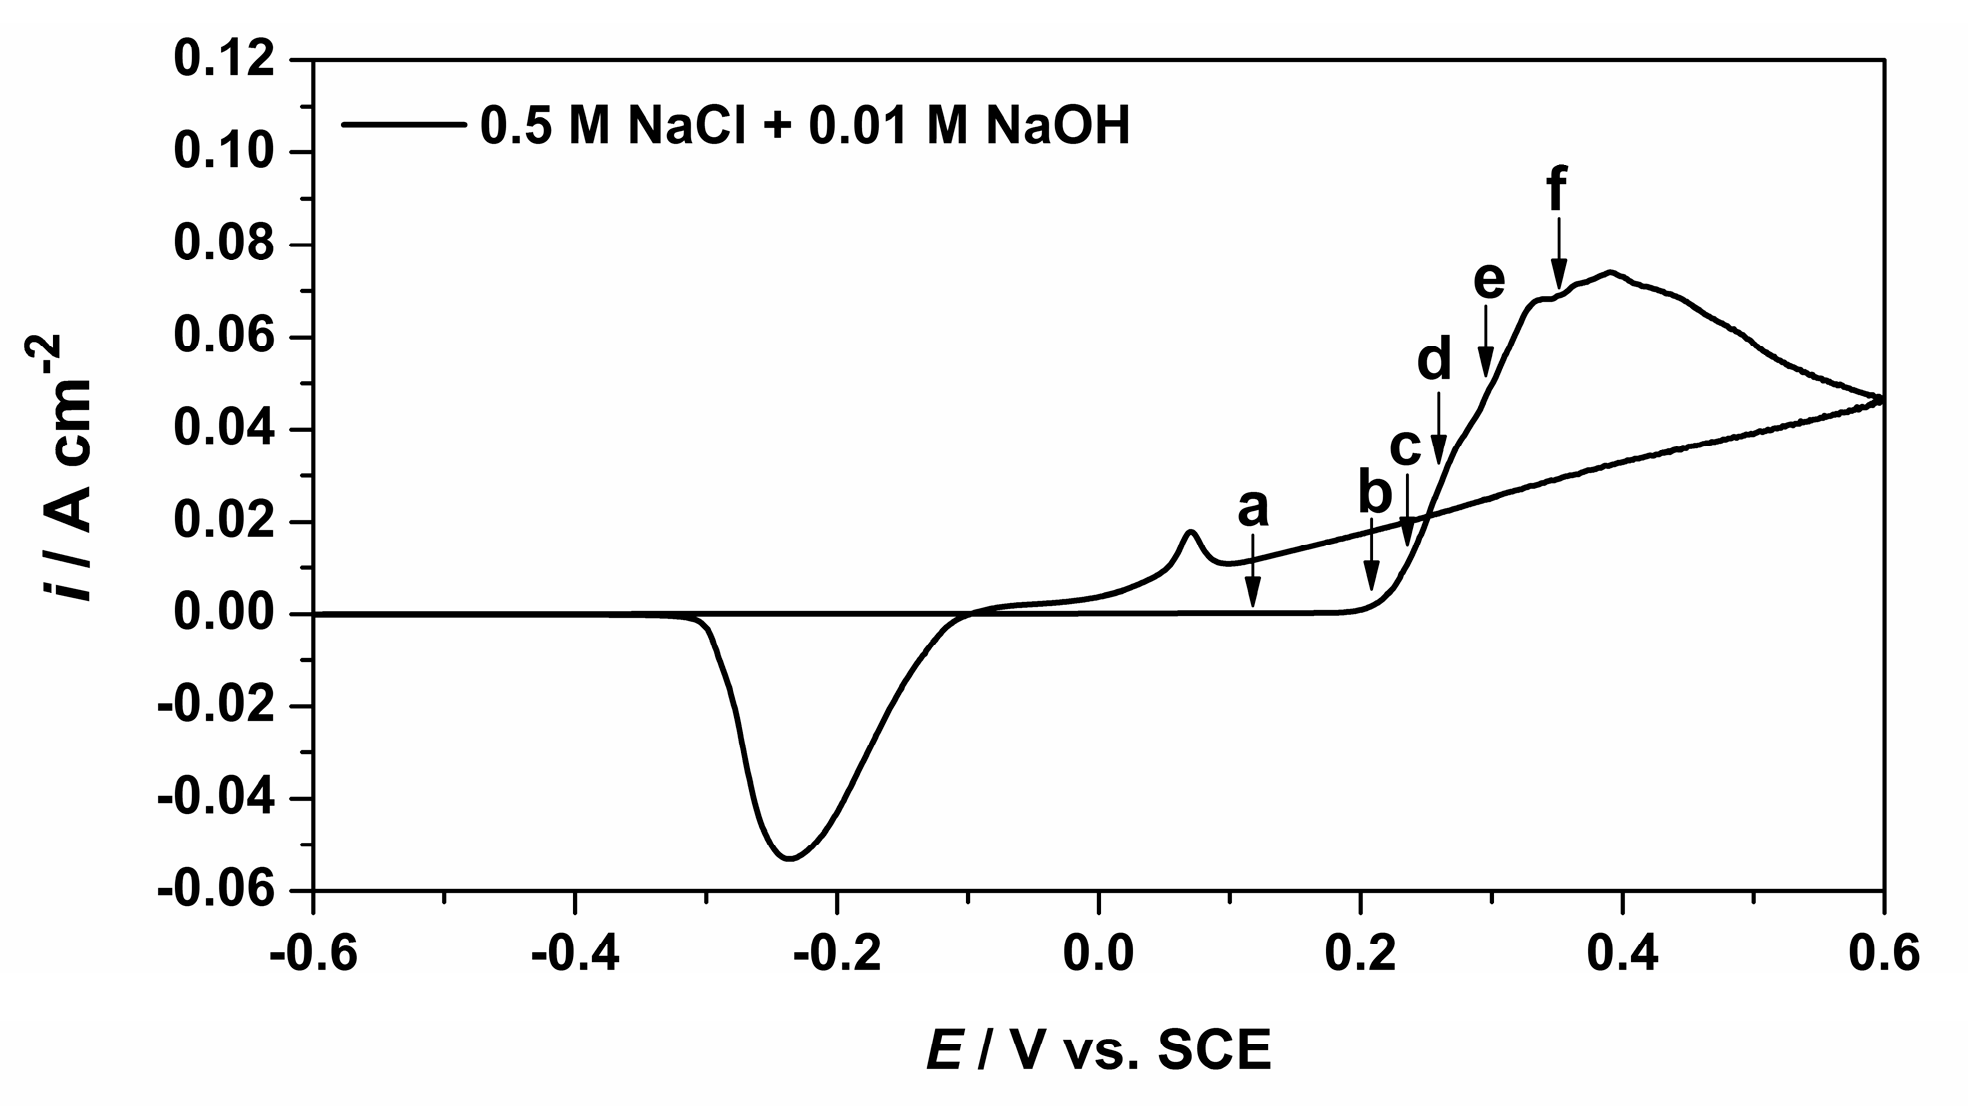
3.2. Alkaline Chloride Electrolyte

In alkaline chloride media (0.5 M NaCl + 0.01 M NaOH), it can be seen evidently that the electrochemical behavior of copper electro-dissolution is entirely different from that in acidic and neutral solutions, as shown in Figure 9. The current density begins to increase at a higher potential value compared with the former.
In Figure 10, the evolution of the diffusion layer at the interface is quite different from that in acid and neutral solutions as well. At an early stage of the experiment, there is hardly any observable change at the interface in the phase maps when the current density is low (Figure 10a). It is evident that small amounts of cuprous ions or cuprous dichloride complex dissolves into the solution when the electrode potential is lower than 200 mV vs. SCE. As it was reported that Cu(I) species were detected during this region [4], the authors propose that the main component of Cu(I) species is probably to be Cu2O film in the alkaline environment. The consumption of hydroxide ions leads to a slight decrease of the phase difference. If the Cu+ or CuCl2 were released into the solution, the concentration at the interface would increase as found in neutral/acid solutions. If the salt film CuCl was the main formation, the concentration at the interface would decrease for the consumption of chloride ions in the solution. Compared to the situation in acid and neutral solutions, the Cu2O is favored as OH concentration increases in the alkaline environment [4],
2 Cu + 2 OH     Cu 2 O + H 2 O + 2 e
The current density increases sharply when the electrode potential is above 200 mV vs. SCE. Meanwhile, two yellow spots appear at the electrode/electrolyte interface (Figure 10b), indicating that the concentration in those areas is higher due to the formation of soluble species. The Cu2O film is broken down firstly at these yellow spots. It means that localized corrosion has been initiated near the yellow spots on the copper surface. This phenomenon confirms the point that pitting of copper is evident only after the formation of a protective film of Cu2O [2,4]. Then, these pits propagate and new pits continue to be induced as shown in Figure 10c–d. With the increase of the current density, more and more pits are induced on the entire surface of the electrode. At last, the whole electrode is activated. During this process, plenty of soluble cupric species dissolve into solution and a steep concentration gradient layer forms at the interface (Figure 10e–f). The pitting dynamic process of copper is visually presented in Video S1. According to the phase maps, it is deduced that a protective film of oxide film exists on the surface of copper and plays an important role in the anodic processes of copper. The surface films in alkaline media decrease the dissolution rate of copper before the pitting occurs.

3.3. Effects of pH

Both the cyclic voltammograms and the phase maps exhibit the pH effects on the anodic dissolution of copper in aqueous chloride electrolytes.
There are three differences between the cyclic voltammograms in acidic and neutral solutions. First, two peak potentials in acidic solution are shifted to a negative direction. Second, in acidic medium, the plateau current density is bigger than that in neutral solution. Third, in the reverse scan, the current density peak in former is larger than that in the later. All of these changes in acidic solution indicate a marked increase of the anodic dissolution processes of copper electrode.
The phase maps directly exhibit the pH effects on concentration changes at the electrode/electrolyte interface. Compared with Figure 4 and Figure 5, there are some evident differences in the phase maps between the acidic and the neutral. When the current density starts to increase, there is more deep yellow area in Figure 5c than Figure 4c, indicating acidic environment is in favor of the formation of cuprous ions at this region. In the first oxidation peak, more deep blue area at the interface (Figure 5f and Figure 4f) indicates more Cl ions are consumed, which means that the formation of CuCl salt layer on the electrode surface is favored in acidic solution. In the plateau region involving the second oxidation peak, more deep red area at the interface (Figure 5h and Figure 4h) means more cupric ions dissolve into the solution, indicating that the rate of electro-dissolution increases in an acidic solution. It is concluded that the concentration gradient in acid solution is steeper than that in neutral solution during the three sections, indicating a marked increase of the anodic processes in acidic environment, which is in agreement with the polarization curves.
Compared to surface film in the alkaline media, the oxide film is difficult to exist steadily and likely to be corroded by chloride ions in acid and neutral environments. The main component of the surface film is CuCl salt layer at the first oxidation peak. When the potential is more positive than 150 mV vs. SCE, the CuCl film dissolves and soluble cupric ions appear, which bring about a sharp concentration gradient layer. In contrast, the formation of Cu2O film is favored in alkaline chloride solution and a relatively stable oxide film exists on the surface of copper. When the potential is higher than 200 mV vs. SCE, the protective film damages and dissolves as soluble species. The pitting dynamic process of copper is evident at the electrode/electrolyte interface in the alkaline chloride media from the phase maps.

4. Conclusions

The pH effects on the anodic dissolution of copper in aqueous chloride electrolytes have been investigated with the polarization measurements and digital holographic method. In acidic and neutral NaCl solutions, the holographic results support that the anodic dissolution mechanisms in the initial stage of copper are,
Cu     Cu + + e
Cu + + Cl     CuCl
CuCl + Cl     CuCl 2
Compared to neutral electrolyte, acidic environment accelerates the copper corrosion in chloride solutions: the steeper concentration gradient layer in the different stages means more formation of cuprous ions, CuCl salt layer, and cupric ions, respectively. In an alkaline chloride environment, the dissolution rate of copper decreases for the formation of a protective oxide film,
2 Cu + 2 OH     Cu 2 O + H 2 O + 2 e
However, when the electrode potential is positive enough, the pitting dynamic process is observed which lead to an abrupt increase of corrosion current density.

Supplementary Materials

The following are available online at https://www.mdpi.com/2075-4701/10/4/487/s1, Video S1: The pitting dynamic process of copper in alkaline chloride electrolyte.

Author Contributions

Conceptualization, L.L and C.W.; data curation, C.Y.; formal analysis, C.Y. and B.Y.; funding acquisition, L.L. and C.W.; investigation, C.Y. and Z.L.; project administration, C.W.; software, B.Y.; validation, C.Y. and Z.L.; writing—original draft, B.Y.; writing—review and editing, L.L. and C.W. All authors have read and agreed to the published version of the manuscript.

Funding

This research was funded by the National Natural Science Foundation of China.

Acknowledgments

This research was supported by the National Natural Science Foundation of China (No. 21972059, 51401094, and 21473081) and the Priority Academic Program Development of Jiangsu Higher Education Institutions (PAPD).

Conflicts of Interest

The authors declare no conflict of interest.

References

  1. Kear, G.; Barker, B.D.; Walsh, F.C. Electrochemical corrosion of unalloyed copper in chloride media—A critical review. Corros. Sci. 2004, 46, 109–135. [Google Scholar] [CrossRef]
  2. El Warraky, A.; El Shayeb, H.A.; Sherif, E.S.M. Pitting corrosion of copper in chloride solutions. Anti-Corros. Method Mater. 2004, 51, 52–61. [Google Scholar] [CrossRef]
  3. Milic, S.M.; Antonijevic, M.M. Some aspects of copper corrosion in presence of benzotriazole and chloride ions. Corros. Sci. 2009, 51, 28–34. [Google Scholar] [CrossRef]
  4. Antonijevic, M.M.; Alagic, S.C.; Petrovic, M.B.; Radovanovic, M.B.; Stamenkovic, A.T. The influence of pH on electrochemical behavior of copper in presence of chloride ions. Int. J. Electrochem. Sci. 2009, 4, 516–524. [Google Scholar]
  5. Milan, M.M.; Milić, S.M.; Petrović, M.B. Films formed on copper surface in chloride media in the presence of azoles. Corros. Sci. 2009, 51, 1228–1237. [Google Scholar]
  6. Yuan, B.; Wang, C.; Li, L.; Chen, S. Real time observation of the anodic dissolution of copper in NaCl solution with the digital holography. Electrochem. Commun. 2009, 11, 1373–1376. [Google Scholar] [CrossRef]
  7. Antonijevic, M.M.; Milic, S.M.; Radovanovic, M.B.; Petrovic, M.B.; Stamenkovic, A.T. Influence of pH and chlorides on electrochemical behavior of brass in presence of benzotriazole. Int. J. Electrochem. Sci. 2009, 4, 1719–1734. [Google Scholar]
  8. Liao, X.; Cao, F.; Zheng, L.; Liu, W.; Chen, A.; Zhang, J.; Cao, C. Corrosion behaviour of copper under chloride-containing thin electrolyte layer. Corros. Sci. 2011, 53, 3289–3298. [Google Scholar] [CrossRef]
  9. Yuan, B.; Wang, C.; Li, L.; Chen, S. Investigation of the effects of the magnetic field on the anodic dissolution of copper in NaCl solutions with holography. Corros. Sci. 2012, 58, 69–78. [Google Scholar] [CrossRef]
  10. Martinez-Lombardia, E.; Gonzalez-Garcia, Y.; Lapeire, L.; De Graeve, I.; Verbeken, K.; Kestens, L.; Mol, J.M.C.; Terryn, H. Scanning electrochemical microscopy to study the effect of crystallographic orientation on the electrochemical activity of pure copper. Electrochim. Acta 2014, 116, 89–96. [Google Scholar] [CrossRef]
  11. Wang, D.; Xiang, B.; Liang, Y.; Song, S.; Liu, C. Corrosion control of copper in 3.5 wt. % NaCl solution by Domperidone: Experimental and theoretical study. Corros. Sci. 2014, 85, 77–86. [Google Scholar] [CrossRef]
  12. Ogata, S.; Kobayashi, N.; Kitagawa, T.; Shima, S.; Fukunaga, A.; Takatoh, C.; Fukuma, T. Nanoscale corrosion behavior of polycrystalline copper fine wires indilute NaCl solution investigated by in-situ atomic force microscopy. Corros. Sci. 2016, 105, 177–182. [Google Scholar] [CrossRef] [Green Version]
  13. Izquierdo, J.; Fernández-Pérez, B.M.; Eifert, A.; Souto, R.M.; Kranz, C. Simultaneous atomic force-scanning electrochemical microscopy (AFM-SECM) imaging of copper dissolution. Electrochim. Acta 2016, 201, 320–332. [Google Scholar] [CrossRef]
  14. Ramirez-Cano, J.A.; Veleva, L.; Souto, R.M.; Fernandez-Perez, B.M. SECM study of the pH distribution over Cu samples treated with 2-mercaptobenzothiazole in NaCl solution. Electrochem. Commun. 2017, 78, 60–63. [Google Scholar] [CrossRef]
  15. Ravichandran, R.; Rajendran, N. Influence of benzotriazole derivatives on the dezincification of 65–35 brass in sodium chloride. Appl. Surf. Sci. 2005, 239, 182–192. [Google Scholar] [CrossRef]
  16. El-Sayed, E.M.; Park, S.M. Effects of 2-amino-5-(ethylthio)-1,3,4-thiadiazole on copper corrosion as a corrosion inhibitor in 3% NaCl solutions. Appl. Surf. Sci. 2006, 252, 8615–8623. [Google Scholar]
  17. Larabi, L.; Benali, O.; Mekelleche, S.M.; Harek, Y. 2-Mercapto-1-methylimidazole as corrosion inhibitor for copper in hydrochloric acid. Appl. Surf. Sci. 2006, 253, 1371–1378. [Google Scholar] [CrossRef]
  18. Sherif, E.S.M.; Erasmus, R.M.; Comins, J.D. Inhibition of copper corrosion in acidic chloride pickling solutions by 5-(3-aminophenyl)-tetrazole as a corrosion inhibitor. Corros. Sci. 2008, 50, 3439–3445. [Google Scholar] [CrossRef]
  19. Curkovic, H.O.; Stupnisek-Lisac, E.; Takenouti, H. The influence of pH value on the efficiency of imidazole based corrosion inhibitors of copper. Corros. Sci. 2010, 52, 398–405. [Google Scholar] [CrossRef]
  20. Liao, Q.Q.; Yue, Z.W.; Yang, D.; Wang, Z.H.; Li, Z.H.; Ge, H.H.; Li, Y.J. Inhibition of copper corrosion in sodium chloride solution by the self-assembled monolayer of sodium diethyldithiocarbamate. Corros. Sci. 2011, 53, 1999–2005. [Google Scholar] [CrossRef]
  21. Khiati, Z.; Othman, A.A.; Sanchez-Moreno, M.; Bernard, M.-C.; Joiret, S.; Sutter, E.M.M.; Vivier, V. Corrosion inhibition of copper in neutral chloride media by a novel derivative of 1,2,4-triazole. Corros. Sci. 2011, 53, 3092–3099. [Google Scholar] [CrossRef] [Green Version]
  22. Zhang, D.-Q.; Xie, B.; Gao, L.-X.; Joo, H.G.; Lee, K.Y. Inhibition of copper corrosion in acidic chloride solution by methionine combined with cetrimonium bromide/cetylpyridinium bromide. J. Appl. Electrochem. 2011, 41, 491–498. [Google Scholar] [CrossRef]
  23. Hong, S.; Chen, W.; Zhang, Y.; Luo, H.Q.; Li, M.; Li, N.B. Investigation of the inhibition effect of trithiocyanuric acid on corrosion of copper in 3.0 wt. % NaCl. Corros. Sci. 2013, 66, 308–314. [Google Scholar] [CrossRef]
  24. Neodo, S.; Carugo, D.; Wharton, J.A.; Stokes, K.R. Electrochemical behaviour of nickel–aluminium bronze in chloride media: Influence of pH and benzotriazole. J. Electroanal. Chem. 2013, 695, 38–46. [Google Scholar] [CrossRef]
  25. Betova, I.; Bojinov, M.; Lilja, C. Influence of chloride on the long-term interaction of copper with deoxygenated neutral aqueous solutions. Corros. Sci. 2013, 76, 192–205. [Google Scholar] [CrossRef]
  26. Tansug, G.; Tüken, T.; Giray, E.S.; Fındıkkıran, G.; Sıg˘ırcık, G.; Demirkol, O.; Erbil, M. A new corrosion inhibitor for copper protection. Corros. Sci. 2014, 84, 21–29. [Google Scholar] [CrossRef]
  27. Badawy, W.A.; El-Rabiei, M.M.; Nady, H. Synergistic effects of alloying elements in Cu-ternary alloys inchloride solutions. Electrochim. Acta 2014, 120, 39–45. [Google Scholar] [CrossRef]
  28. Wu, Z.; Cheng, Y.F.; Liu, L.; Lv, W.; Hu, W. Effect of heat treatment on microstructure evolution and erosion–corrosion behavior of a nickel–aluminum bronze alloy in chloride solution. Corros. Sci. 2015, 98, 260–270. [Google Scholar] [CrossRef]
  29. Zhang, X.H.; Liao, Q.Q.; Nie, K.B.; Zhao, L.L.; Yang, D.; Yue, Z.W.; Ge, H.H.; Li, Y.J. Self-assembled monolayers formed by ammonium pyrrolidine dithiocarbamate on copper surfaces in sodium chloride solution. Corros. Sci. 2015, 93, 201–210. [Google Scholar] [CrossRef]
  30. Yu, Y.Z.; Zhang, D.Q.; Zeng, H.J.; Xie, B.; Gao, L.X.; Lin, T. Synergistic effects of sodium lauroyl sarcosinate and glutamic acid in inhibition assembly against copper corrosion in acidic solution. Appl. Surf. Sci. 2015, 355, 1229–1237. [Google Scholar] [CrossRef]
  31. Yu, Y.Z.; Yang, D.; Zhang, D.Q.; Wang, Y.Z.; Gao, L.X. Anti-corrosion film formed on HAl77-2 copper alloy surface by aliphatic polyamine in 3 wt. % NaCl solution. Appl. Surf. Sci. 2017, 392, 768–776. [Google Scholar] [CrossRef]
  32. Denpo, K.; Okumura, T.; Fukunaka, Y.; Kondo, Y. Measurement of concentration profiles of Cu2+ ion and H+ ion near a plane vertical cathode by two-wavelength holographic interferometry. J. Electrochem. Soc. 1985, 132, 1145–1150. [Google Scholar] [CrossRef]
  33. Chao, C.W.; Lin, S.P.; Wang, Y.Y.; Wan, C.C.; Yang, J.T. Continuous monitoring of acid stratification during charge/discharge by holographic laser interferometry. J. Power Sources 1995, 55, 243–246. [Google Scholar] [CrossRef]
  34. Habib, K. In-situ monitoring of pitting corrosion of copper alloys by holographic interferometry. Corros. Sci. 1998, 40, 1435–1440. [Google Scholar] [CrossRef]
  35. Konishi, Y.; Nakamura, Y.; Fukunaka, Y.; Tsukada, K.; Hanasaki, K. Anodic dissolution phenomena accompanying supersaturation of copper sulfate along a vertical plane copper anode. Electrochim. Acta 2003, 48, 2615–2624. [Google Scholar] [CrossRef]
  36. Yang, X.; Chen, S.; Wang, C.; Li, L. In-line digital holography for the study of dynamic processes of electrochemical reaction. Electrochem. Commun. 2004, 6, 643–647. [Google Scholar] [CrossRef]
  37. Nishikawa, K.; Fukunaka, Y.; Sakka, T.; Ogata, Y.H.; Selman, J.R. Ionic mass transfer during electrochemical dissolution of Li metal in PC electrolyte solution. J. Electroanal. Chem. 2005, 584, 63–69. [Google Scholar] [CrossRef]
  38. Nishikawa, K.; Fukunaka, Y.; Sakka, T.; Ogata, Y.; Selman, J.R. Robert Selman, in situ measurement of lithium mass transfer during charging and discharging of a Ni–Sn alloy electrode. J. Power Sources 2007, 174, 668–672. [Google Scholar] [CrossRef]
  39. Yuan, B.; Chen, S.; Yang, X.; Wang, C.; Li, L. Mapping the transient concentration field within the diffusion layer by use of the digital holographic reconstruction. Electrochem. Commun. 2008, 10, 392–396. [Google Scholar] [CrossRef]
  40. Yang, X.; Eckert, K.; Heinze, A.; Uhlemann, M. The concentration field during transient natural convection between vertical electrodes in a small-aspect-ratio cell. J. Electroanal. Chem. 2008, 613, 97–107. [Google Scholar] [CrossRef]
  41. Tada, E.; Kaneko, H. Optical visualization of concentration field of Zn2+ during galvanic corrosion of a Zn/steel couple. Corros. Sci. 2010, 52, 3421–3427. [Google Scholar] [CrossRef]
  42. Klages, P.E.; Rotermund, M.K.; Rotermund, H.H. Simultaneous holographic, ellipsometric, and optical imaging of pitting corrosion on SS 316LVM stainless steel. Corros. Sci. 2012, 65, 128–135. [Google Scholar] [CrossRef]
  43. Wang, J.; Zhao, J.; Di, J.; Rauf, A.; Hao, J. Dynamically measuring unstable reaction–diffusion process by using digital holographic interferometry. Opt. Lasers Eng. 2014, 57, 1–5. [Google Scholar] [CrossRef]
  44. Li, X.; Zhang, M.; Yuan, B.; Li, L.; Wang, C. Effects of the magnetic field on the corrosion dissolution of the 304SSFeCl3 system. Electrochim. Acta 2016, 222, 619–626. [Google Scholar] [CrossRef]
  45. Nimdeo, Y.M.; Joshi, Y.M.; Muralidhar, K. Diffusion of charged nano-disks in aqueous media: Influence of competing inter-particle interactions and thermal effects. Chem. Eng. Sci. 2017, 164, 71–80. [Google Scholar] [CrossRef]
  46. Cong, H.; Michels, H.T.; Scully, J.R. Passivity and pit stability behavior of copper as a function of selected water chemistry variables. J. Electrochem. Soc. 2009, 156, C16–C27. [Google Scholar] [CrossRef]
  47. Cong, H.; Scully, J.R. Use of coupled multielectrode arrays to elucidate the pH dependence of copper pitting in potable water. J. Electrochem. Soc. 2010, 157, C36–C46. [Google Scholar] [CrossRef]
  48. Ni, Q.; Xia, X.; Zhang, J.; Dai, N.; Fan, Y. Electrochemical and SVET studies on the typical polarity reversal of Cu–304 stainless steel galvanic couple in cl--containing solution with different pH. Electrochim. Acta 2017, 247, 207–215. [Google Scholar] [CrossRef]
  49. Bianchi, G.; Longhi, P. Copper in sea-water, potential-pH diagrams. Corros. Sci. 1973, 13, 853–864. [Google Scholar] [CrossRef]
Figure 1. Schematic diagram of holographic setup for the observation of an electrode/electrolyte interface.
Metals 10 00487 g001
Figure 2. The observed area (gray) on the electrode surface: The X axis is in horizontal direction from the electrode surface toward the bulk electrolyte while the Y axis is in the opposite direction of gravity.
Metals 10 00487 g002
Figure 3. The cyclic voltammograms of the copper electrode in acidic and neutral NaCl solutions at 10 mV·s−1. (a) 0.5 M NaCl solution. (b) 0.5 M NaCl + 0.01 M HCl solution.
Metals 10 00487 g003
Figure 4. The phase distributions at different times in Figure 3a during potentiodynamic polarization of copper in 0.5 M NaCl solution. (ah) are corresponding to the points a–h in Figure 3a.
Metals 10 00487 g004
Figure 5. The phase distributions at different times in Figure 3b during potentiodynamic polarization of copper in 0.5 M NaCl + 0.01 M HCl solution. (ah) are corresponding to the points a–h in Figure 3b.
Metals 10 00487 g005
Figure 6. The i-t curve of Cu/NaCl system at −60 mV vs. SCE (Top). (a) was obtained at the open circuit potential (OCP). (bf) are the phase maps corresponding to the points b–f in the curve.
Metals 10 00487 g006
Figure 7. The i-t curve of Cu/NaCl system at 180 mV vs. SCE (Top). (a) was obtained at OCP. (bf) are the phase maps corresponding to the points b–f in the curve.
Metals 10 00487 g007
Figure 8. The i-t curve of Cu/NaCl system at 400 mV vs. SCE (Top). (a) was obtained at OCP. (bd) are the phase maps corresponding to the points b–d in the curve.
Metals 10 00487 g008
Figure 9. The cyclic voltammogram of copper in 0.5 M NaCl + 0.01 M NaOH solution.
Metals 10 00487 g009
Figure 10. The phase maps at different times in Figure 9 during potentiodynamic polarization of copper in 0.5 M NaCl + 0.01 M NaOH solution. Figure 10(a–f) are corresponding to the points a–f in Figure 9. A dynamic process is available in Video S1.
Metals 10 00487 g010

