Article

Formation Process of the Integrated Core(Fe-6.5wt.%Si)@Shell(SiO2) Structure Obtained via Fluidized Bed Chemical Vapor Deposition

1
Key Laboratory of Metallurgical Emission Reduction & Resources Recycling, Anhui University of Technology, Ministry of Education, Ma’anshan 243002, China
2
Ansteel Group Iron and Steel Research Institute, Ansteel Group, Anshan 114021, China
3
International Science & Technology Cooperation Base for Intelligent Equipment Manufacturing under Special Work Environment, Anhui University of Technology, Ma’anshan 243002, China
*
Author to whom correspondence should be addressed.
These authors contributed equally to this work.
Metals 2020, 10(4), 520; https://doi.org/10.3390/met10040520
Submission received: 11 March 2020 / Revised: 9 April 2020 / Accepted: 14 April 2020 / Published: 17 April 2020

Abstract

:
As electromagnetic functional materials, soft magnetic composites (SMCs) have great potential for applications in high-energy electromagnetic conversion devices. The most effective way to optimize the performance of an SMC is to incorporate it into insulated ferromagnetic core-shell particles with high structural uniformity and integrity. Fluidized bed chemical vapor deposition (FBCVD) is a facile and efficient technique for the synthesis of ferromagnetic/SiO2 core-shell particles. However, the formation mechanism and conditions of integrated ferromagnetic/SiO2 core-shell structures during the FBCVD process are not fully understood. On this basis, the formation process and the deposition time required for transformation of the Fe-6.5wt.%Si substrate into the Fe-6.5wt.%Si/SiO2 composite, and finally into the Fe-6.5wt.%Si/SiO2 core-shell structure, were investigated. Deposition of the insulative SiO2 coating onto the Fe-6.5wt.%Si particles was described by the three-dimensional island nucleation theory. The SiO2 islands were initially concentrated in rough areas on the Fe-6.5wt.%Si particle substrates owing to the lower heterogeneous nucleation energy. Deposition for at least 960 s was necessary to obtain the integrated ferromagnetic/SiO2 core-shell structure. The uniformity, integrity, and thickness of the insulative SiO2 coating increased with the increasing deposition time. The results in this study may provide a foundation for future kinetics investigations and the application of FBCVD technology.

Graphical Abstract

1. Introduction

Soft magnetic composites (SMCs) have become increasingly important in materials research, because they are magnetically isotropic, highly permeable, and inhibit eddy current loss [1,2,3]. The most effective way to optimize the features of SMCs is to incorporate them into core-shell (C-S) structures by coating the ferromagnetic core particles with an insulative shell. The C-S structure can significantly enhance the surface resistance of ferromagnetic particles and reduce the effective diameters of eddy currents [4,5] for the realization of high-energy electromagnetic conversion devices.
Over the past decade, many researchers have focused on the design and controlled synthesis of insulated ferromagnetic C-S structures and the relationships between their structures and activities [6,7]. The design and preparation of SMCs and ferromagnetic/inorganic C-S structures using diverse insulative oxide coatings including Al2O3 [8,9], SiO2 [10], Fe3O4 [11], MgO [12], and ZnO [13] were reported. Yan and coworkers investigated the influence of processing parameters on the magnetic properties of SMCs [14,15,16]. Shokrollahi and coworkers studied the mechanisms by which C-S structures influenced the magnetic properties of SMCs [17,18]. These research achievements promoted the development of basic theory and expanded the range of applications for SMCs. As basic and applied research on SMCs has progressed, it has been widely accepted that increasing the structural integrity and uniformity of C-S structures will reduce iron loss at extremely high-energy densities. Furthermore, the thickness of the insulative shell coating affects carrier migration and the coupling efficiency of the ferromagnetic particles [5,19,20,21]. Therefore, the synthesis of C-S composite particles with few defects seems particularly important for obtaining SMCs with excellent properties. While many studies have focused on SMC characterization and measurement, few have investigated the formation mechanisms and optimal conditions for the production of C-S structures with ferromagnetic cores. For example, fluidized bed chemical vapor deposition (FBCVD) has been recognised as an efficient technique for the synthesis of ferromagnetic/SiO2 core-shell particles [22,23]. However, FBCVD is a complex two-phase gas and solid flow system, and the controlled synthesis of ferromagnetic/SiO2 C-S particles is influenced by many factors. The formation mechanism and conditions of integrated ferromagnetic/SiO2 core-shell structures during the FBCVD process are not fully understood.
Aiming at these problems above, a more in-depth study of the formation mechanism of ferromagnetic/SiO2 C-S structural evolution during FBCVD was carried out in this paper. The influence of deposition time on the microscopic characteristics of as-deposited particles was systematically investigated at a constant precursor concentration using ferromagnetic particles with the same temperature and morphology. We studied the time needed for the transition from Fe-6.5wt.%Si particles to an Fe-6.5wt.%Si/SiO2 composite to obtain Fe-6.5wt.%Si/SiO2 C-S particles. The relationship between the deposition time and the static magnetic properties of the Fe-6.5wt.%Si/SiO2 C-S particles was also investigated. The results could promote the application and development of FBCVD technology.

2. Materials and Methods

Spherical atomized Fe-6.5wt.%Si particles (>99 wt.%) with an average size of ~70 μm were used as substrates. The tetraethyl orthosilicate (C8H20O4Si) precursor was supplied by Sinopharm Chemical Reagent Co., Ltd. High purity argon (Ar, 99.99 wt.%) was used as carrier gas to transport tetraethyl orthosilicate vapor.
In a typical process, 10 g of Fe-6.5wt.%Si particles was first heated to 920 K in a quartz tube furnace of the fluidized bed reactor. Simultaneously, 80 mL/min of high purity Ar was introduced into the reactor to suspend and fluidize the Fe-6.5wt.%Si particles. Then, the gaseous C8H20O4Si precursor was introduced into the fluidized bed reactor at atmospheric pressure using 80 ml/min of high purity Ar as a carrier gas. The gasification reaction of the C8H20O4Si precursor occurred in a liquid evaporator at 423 K. The deposition time was set to 60, 120, 240, 480, 960, 1920, or 3840 s before cooling the furnace to room temperature.
The phases obtained after FBCVD were analyzed using a D8 Advance X-ray diffractometer (XRD, Bruker, Billerica, MA, USA) equipped with a CuKα radiation source from (2θ) 10° to 90°. The surface and cross-sectional morphologies of all particle samples were examined using a JSM7610F field-emission scanning electron microscope (FE-SEM, JEOL, Tokyo, Japan). The cladding ratio of SiO2 insulation on the surface of the Fe-6.5wt.%Si substrate was statistical analyzed by an Image J software after skeletonize treatment. The chemical states and electronic structures of the original Fe-6.5wt.%Si and Fe-6.5wt.%Si/SiO2 C-S particle surfaces were determined via X-ray photoelectron spectroscopy (XPS) on a 250Xi spectrometer (ThermoFisher, Waltham, MA, USA) equipped with an AlKα radiation source. The pass energy, energy step size, and scan time for XPS were 30.0 eV, 0.050 eV, and 120.3 s, respectively. The electrical resistivity under a pressure of 2 MPa was measured on a ST2722 powder resistivity tester (Jingge Electronic Co., LTD, Suzhou, China). Hysteresis loops were recorded on a 7404-S vibrating sample magnetometer (VSM, Lake Shore Cryotronics, OH, USA) under an applied magnetic field ranging from −20,000 to 20,000 Oe. The saturated magnetizations of all particle samples are expressed in emu/g, which is the unit in the centimeter–gram–second (CGS) system of units.

3. Results and Discussion

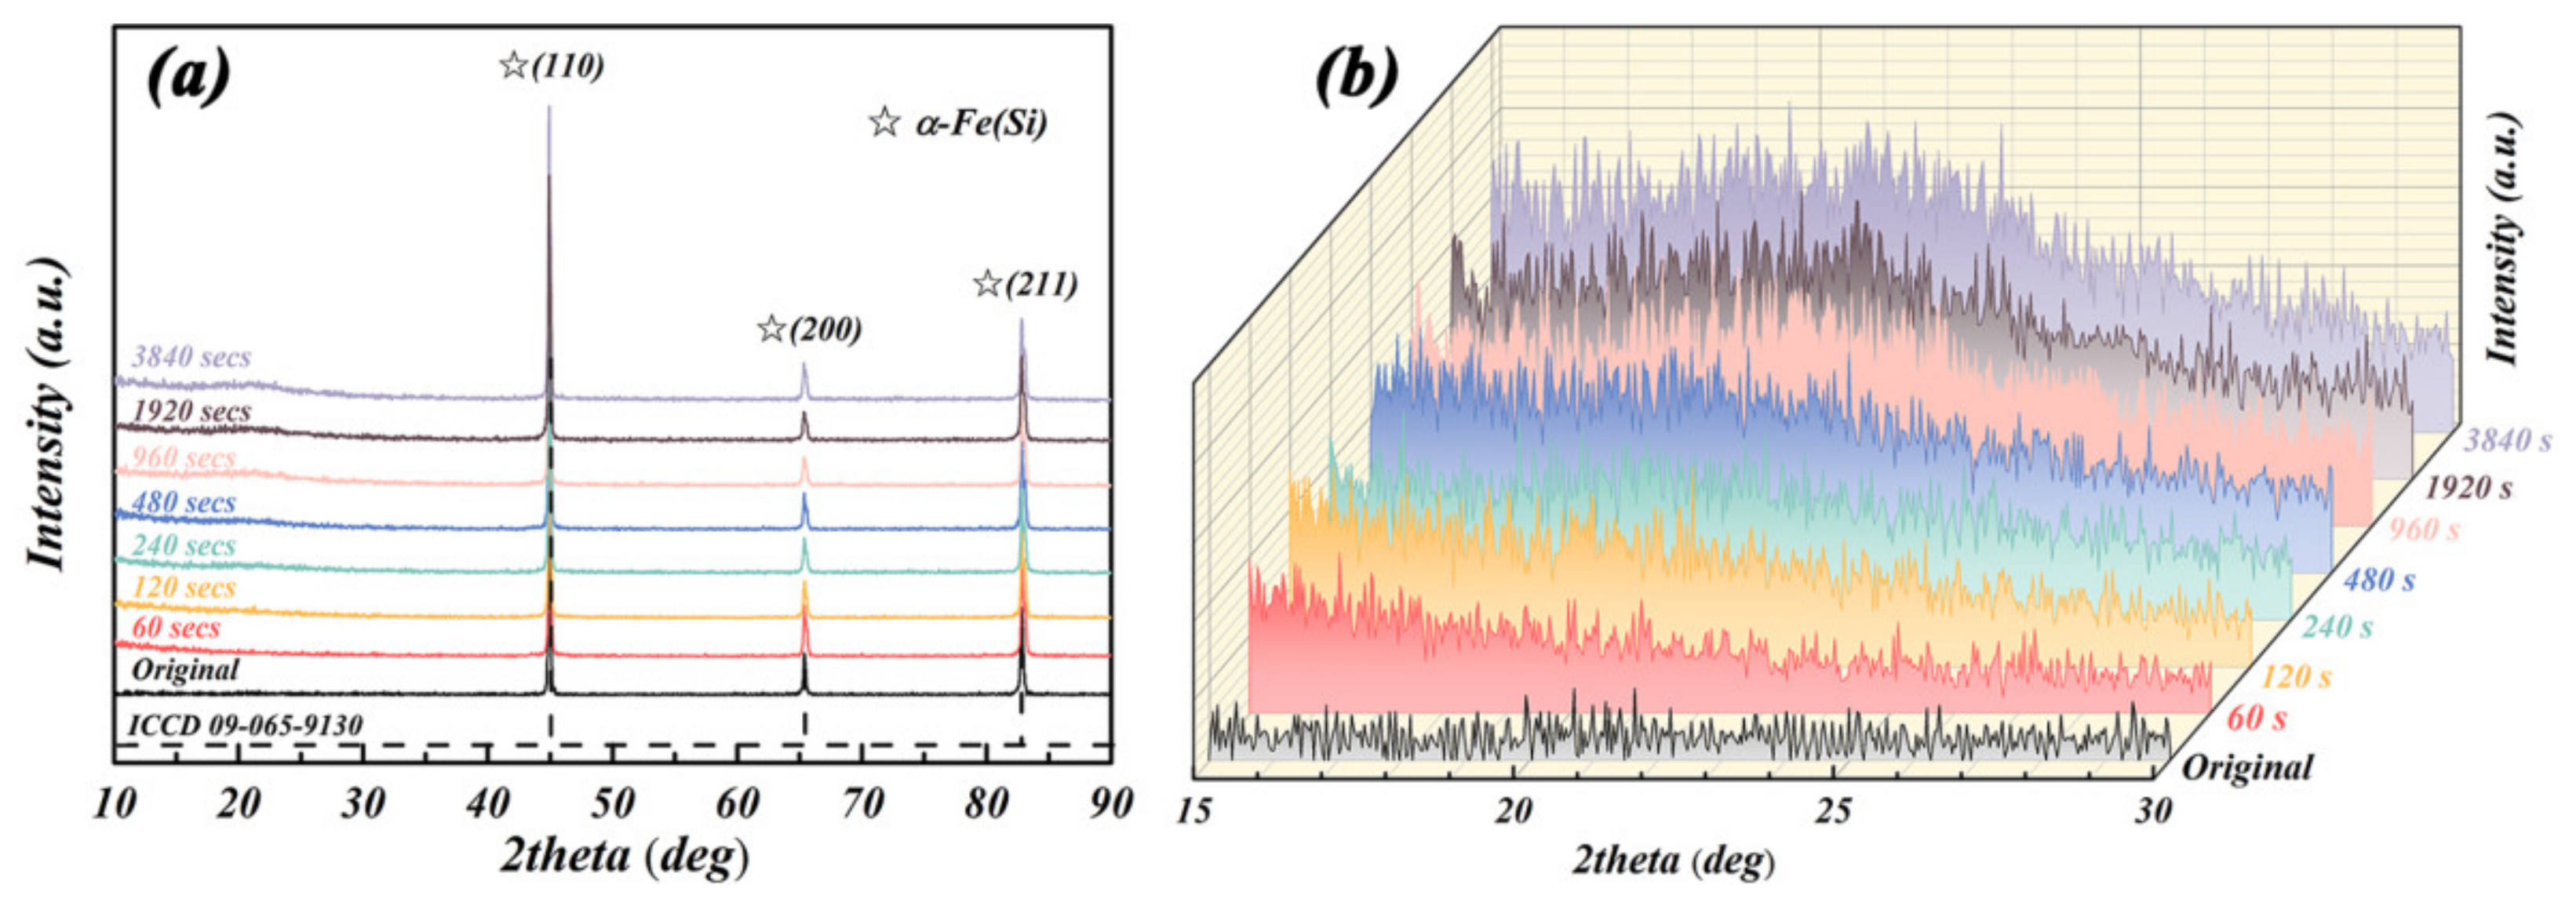
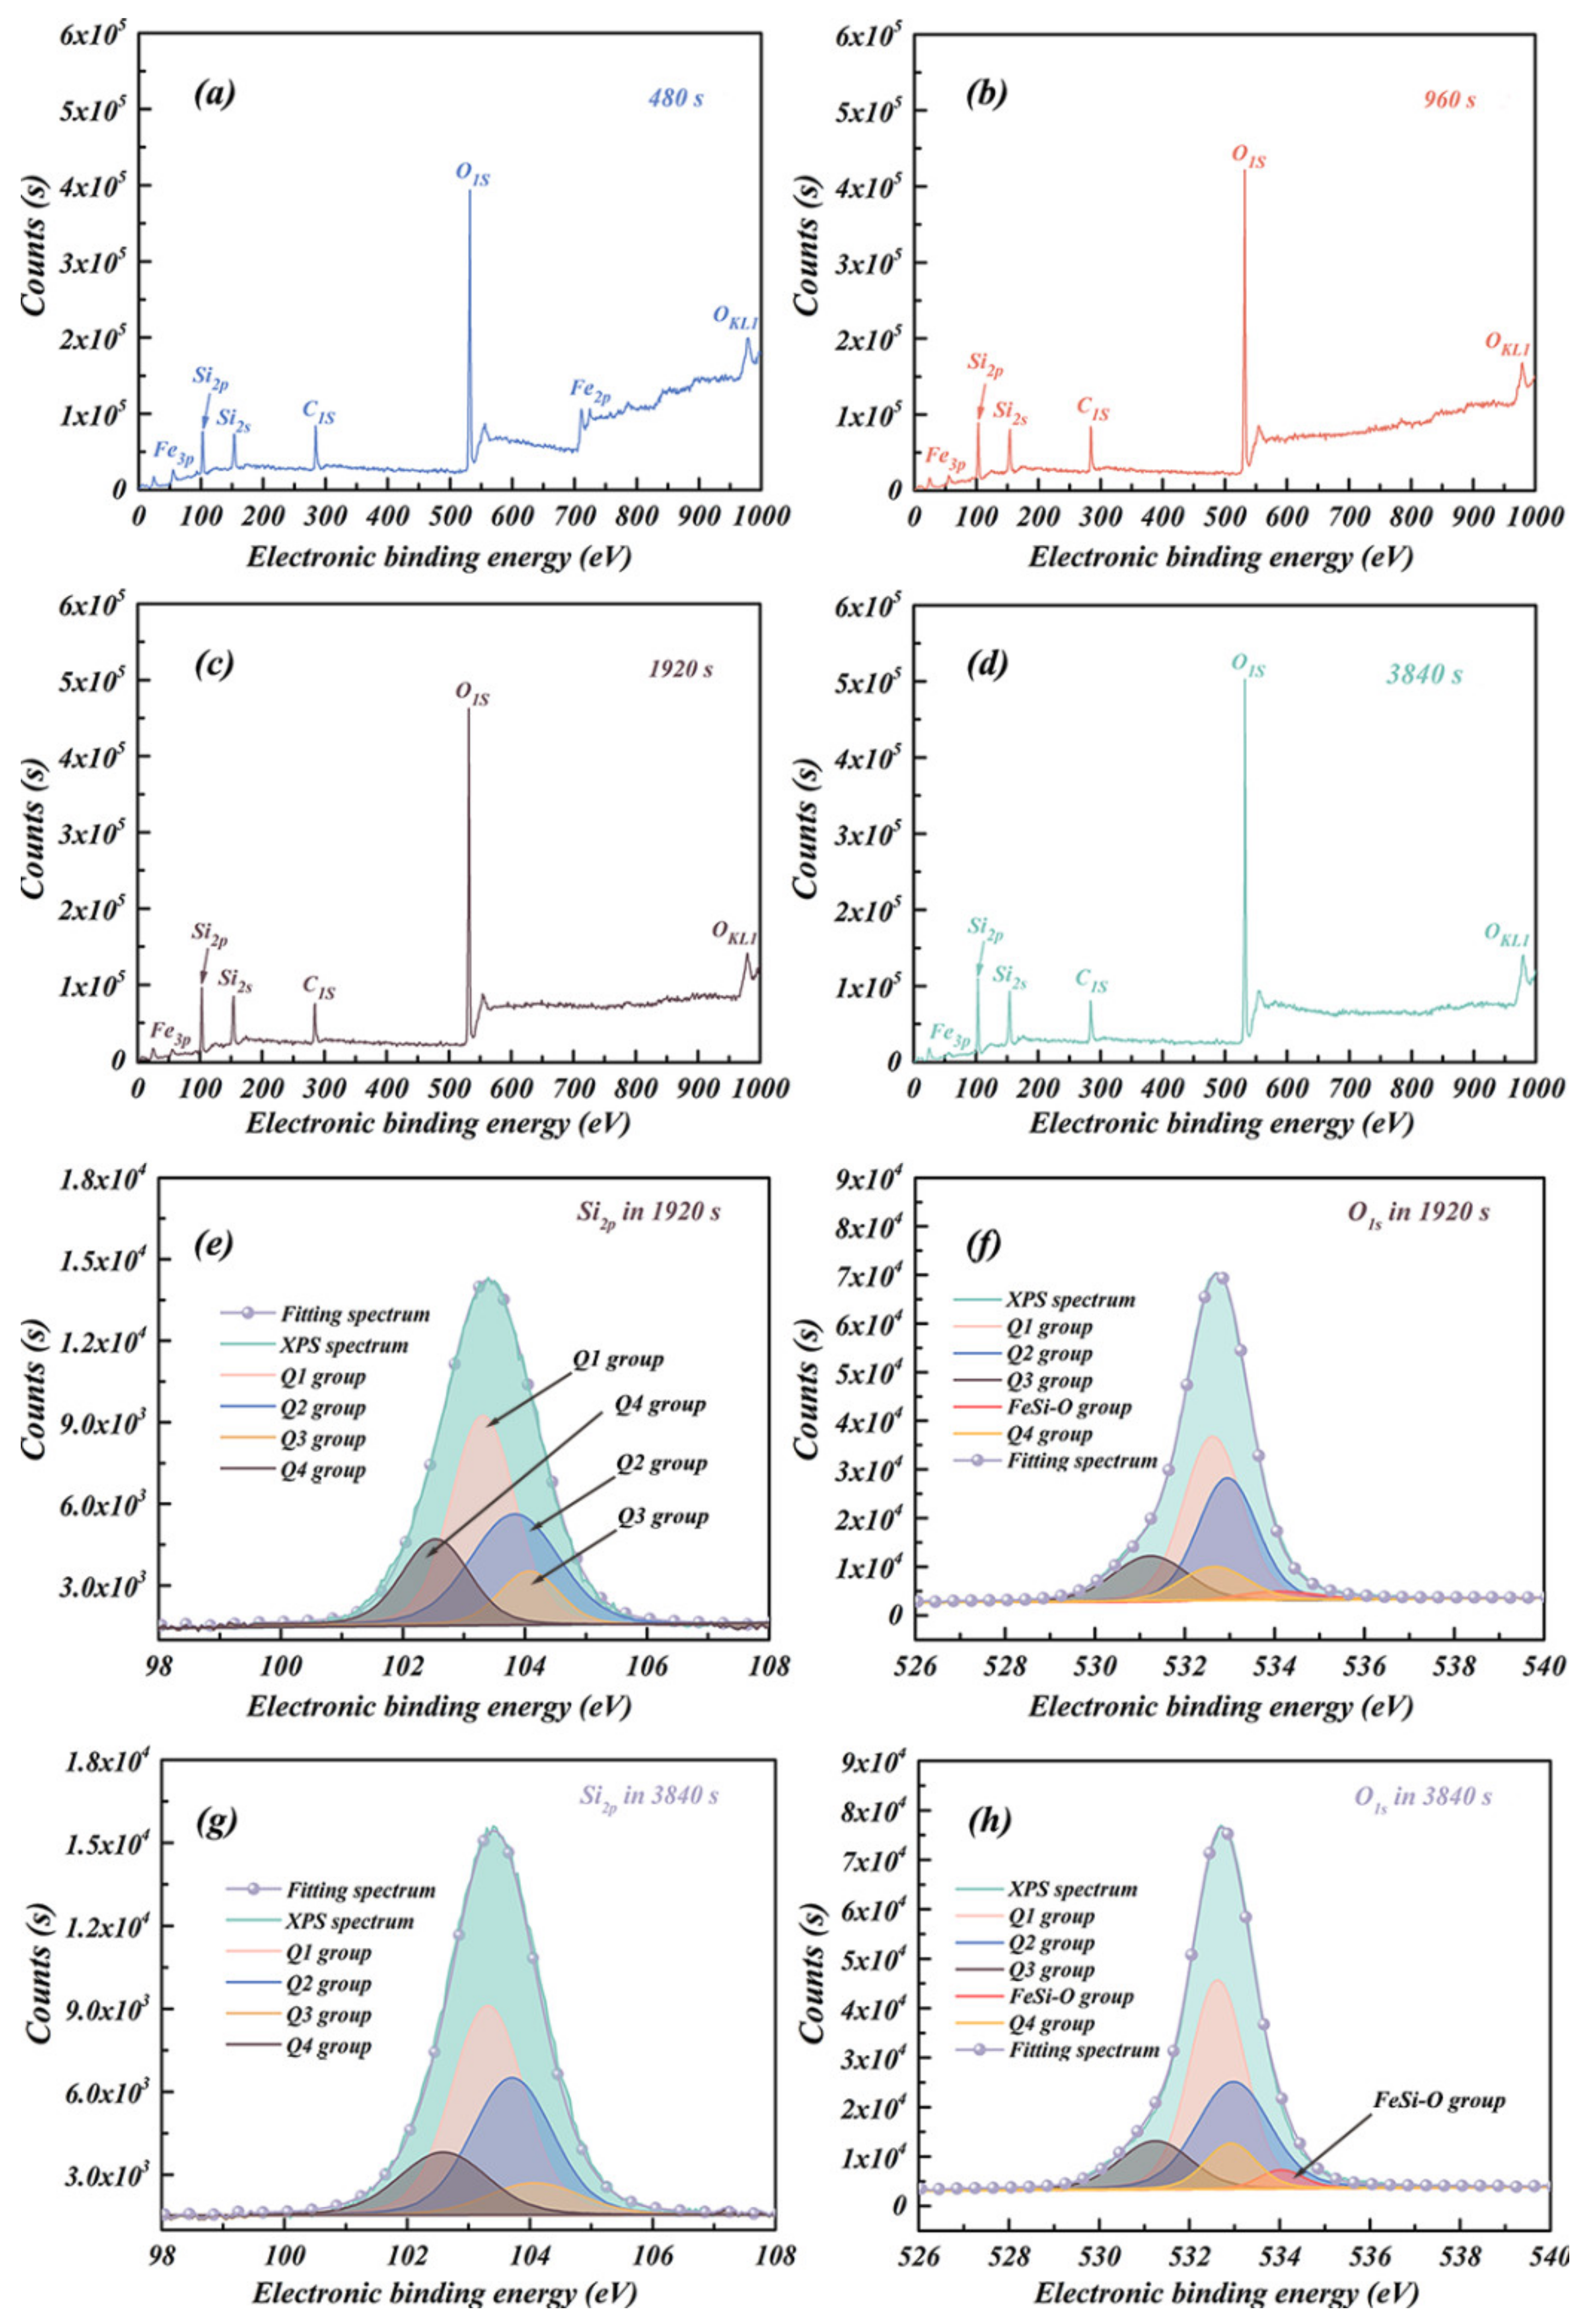
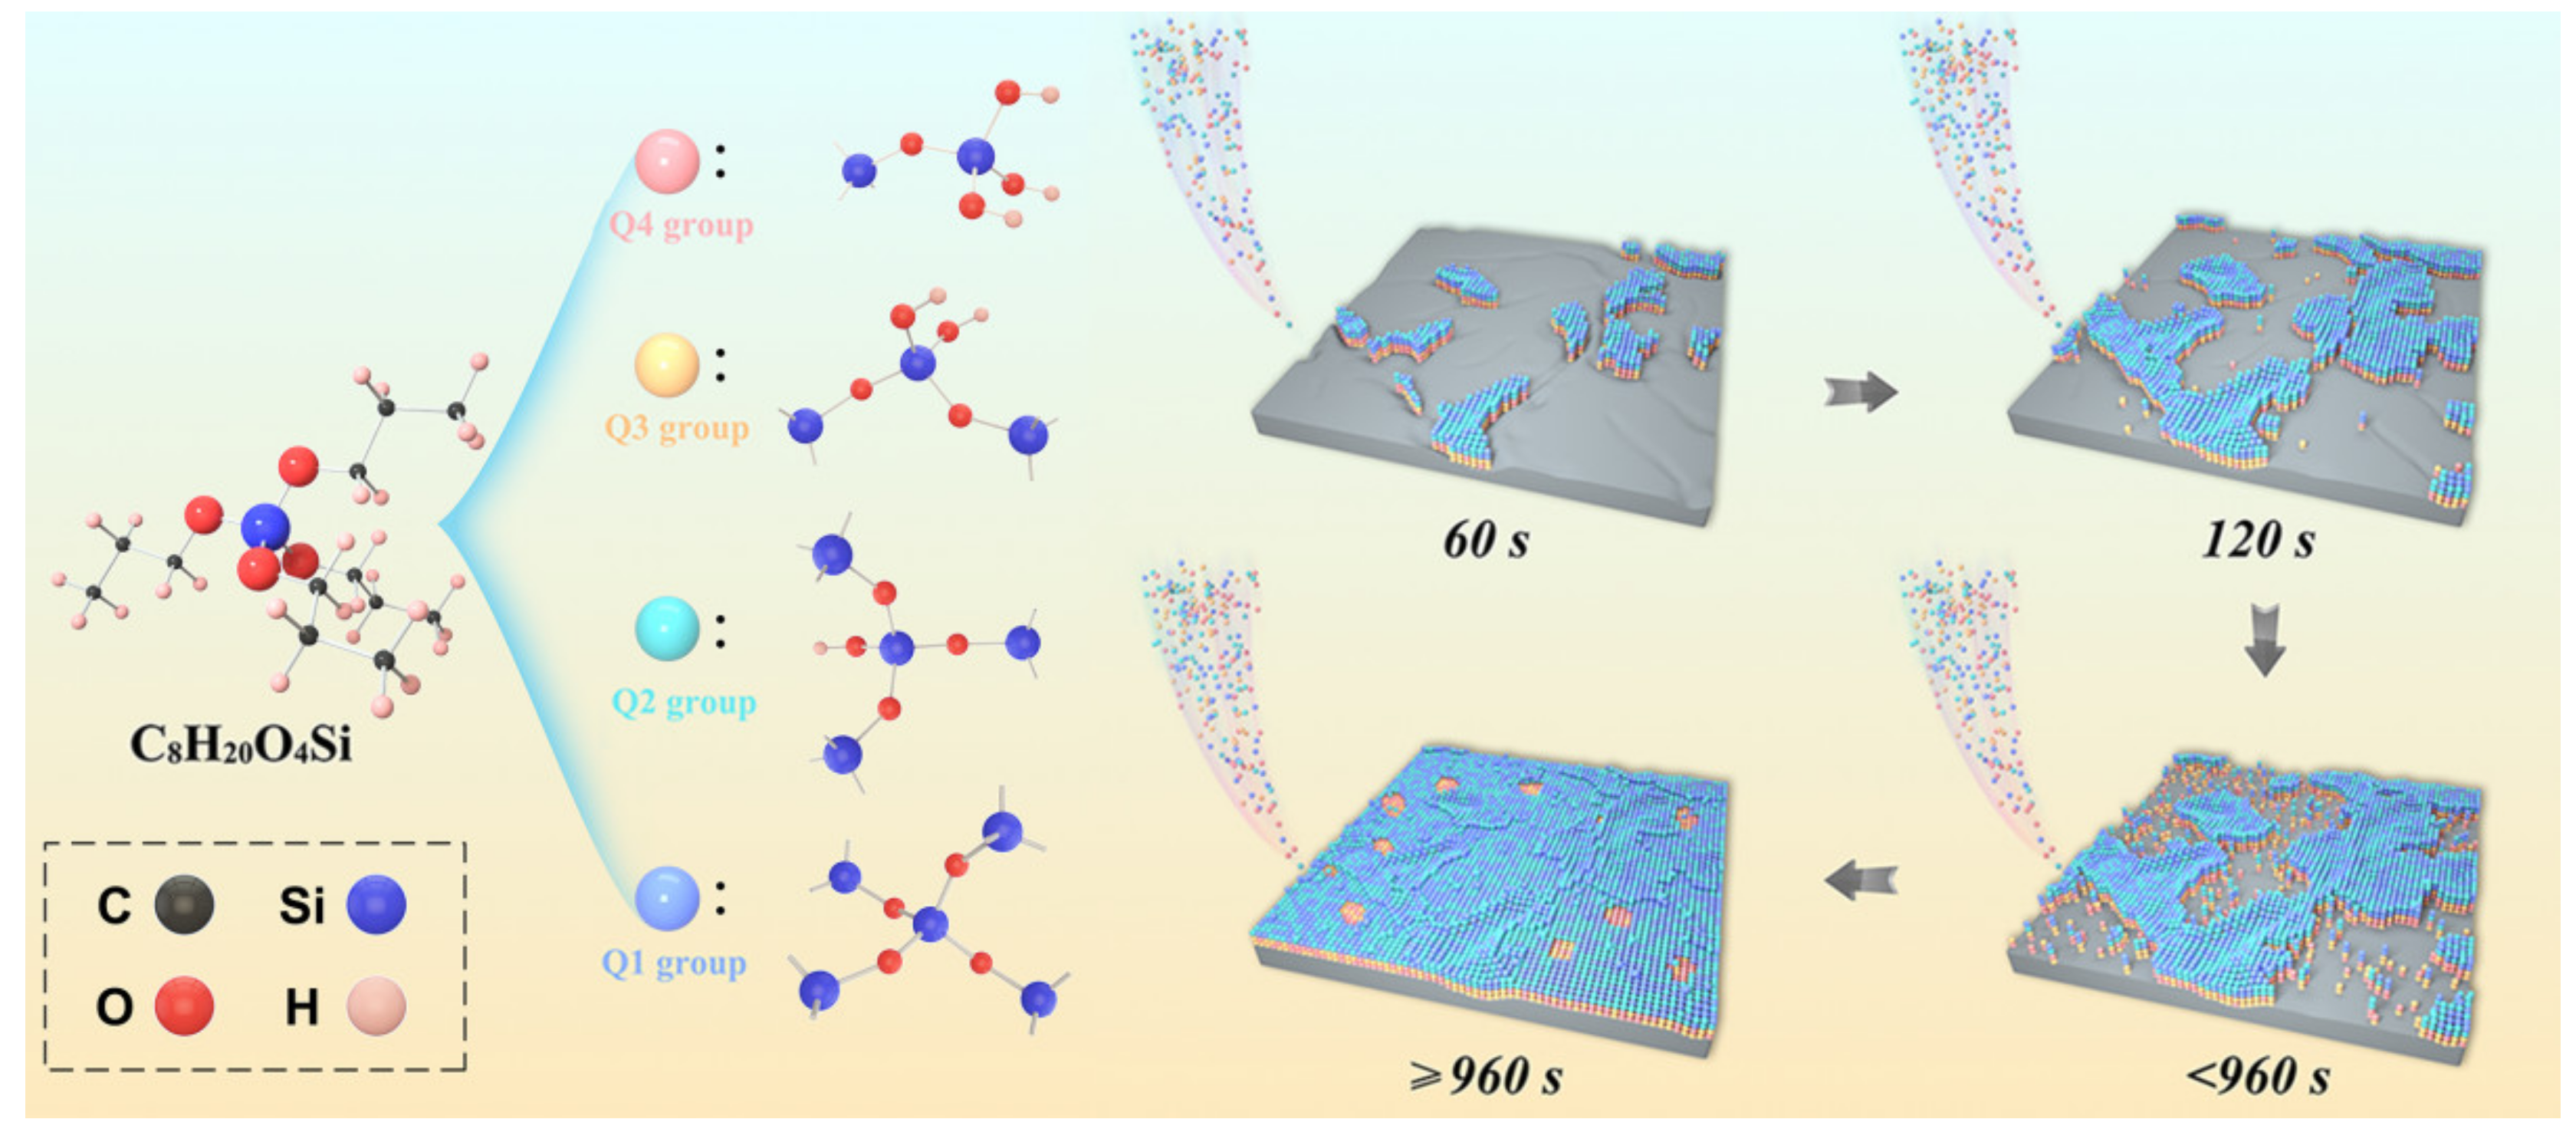
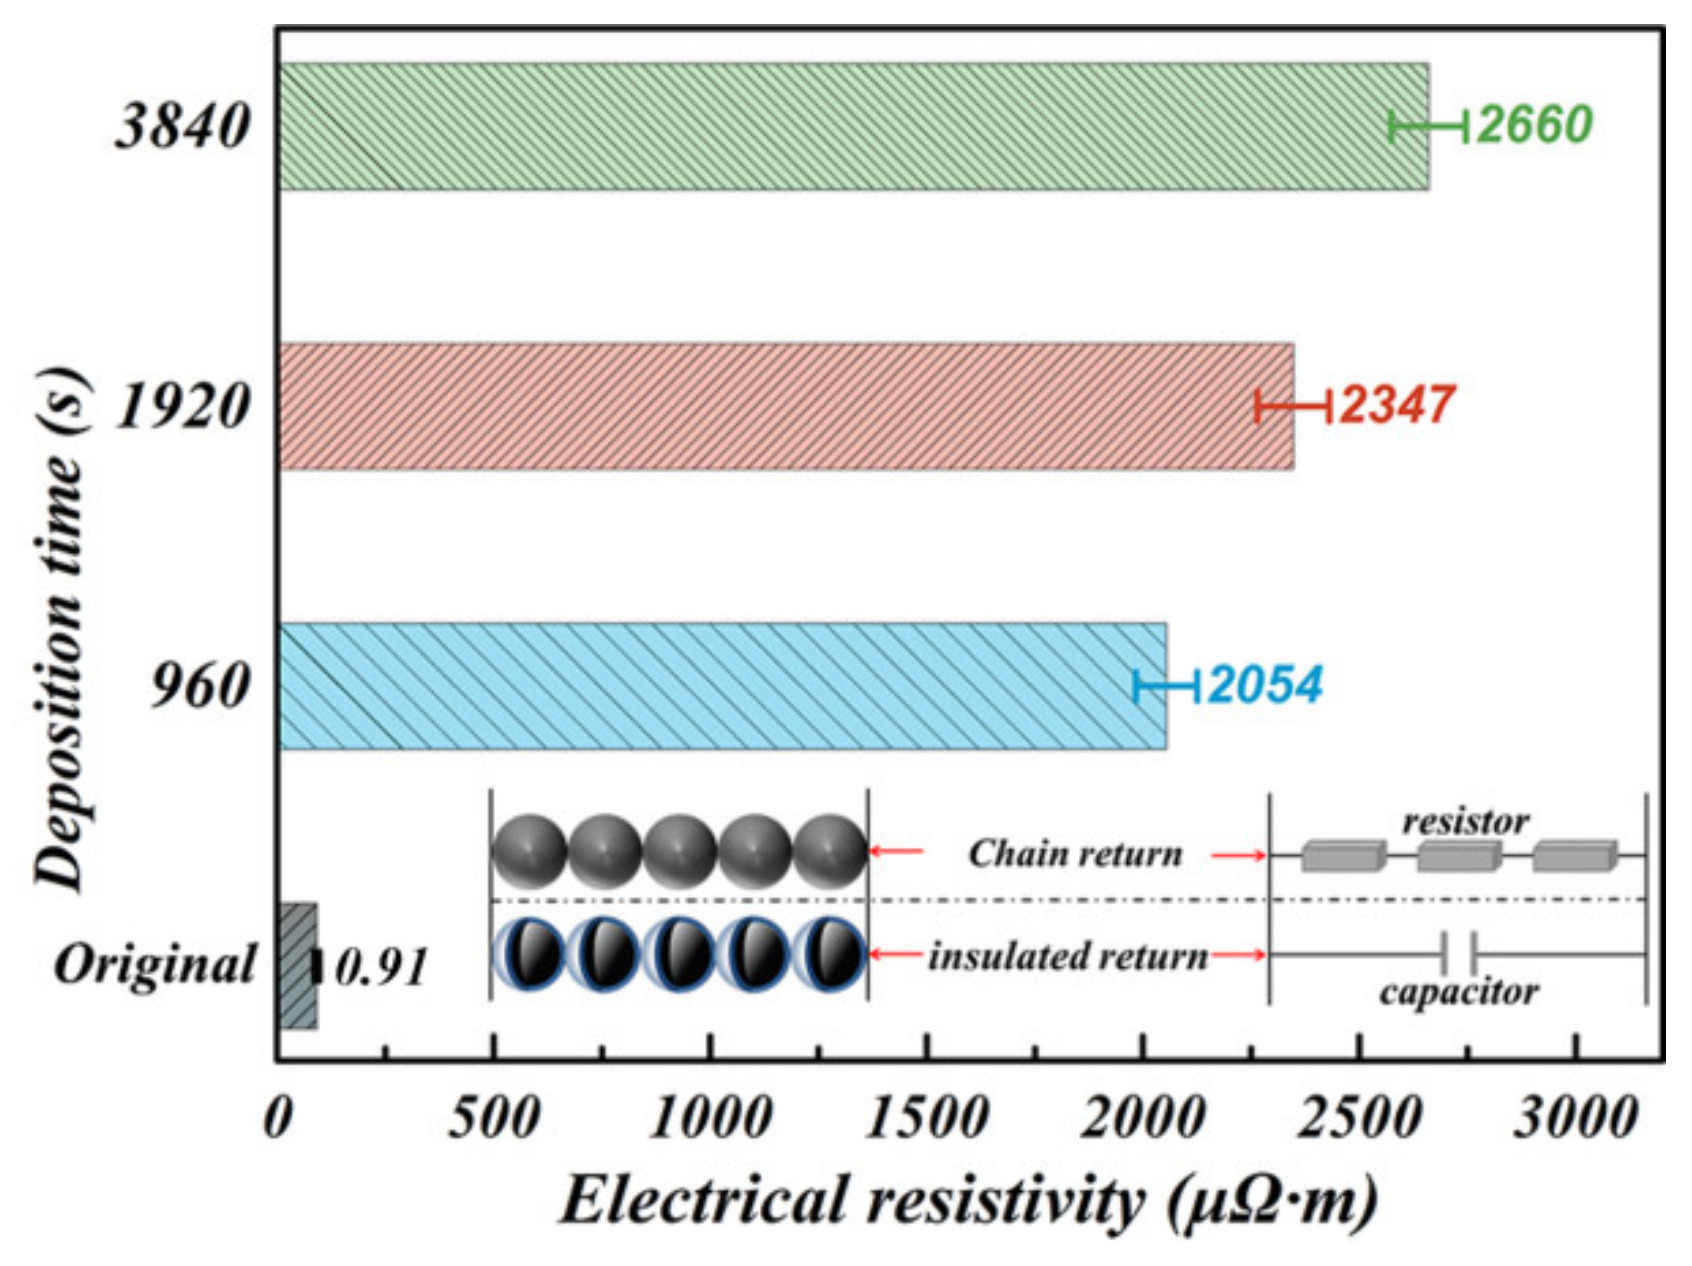
3.1. Synthesis Process of Fe-6.5wt.%Si/SiO2 C-S Structure

XRD was employed to analyze the structures of the original Fe-6.5wt.%Si particles and particle samples after deposition over various intervals. As shown in Figure 1a, three sharp crystalline peaks were observed at (2θ) 44.94°, 65.37°, and 82.78° in the pattern of the original Fe-6.5wt.%Si particle sample, which corresponded to the (110), (200), and (211) crystal planes of α-Fe(Si), respectively. The pattern was consistent with that of the International Centre for Diffraction Data powder diffraction file 09-065-9130. These results indicated that the Fe-6.5wt.%Si particle substrate had a body-centered cubic (bcc) lattice structure. The enlarged image in Figure 1b revealed another broad peak centered at 23° in the XRD patterns of the Fe-6.5wt.%Si particles after FBCVD treatment, which indicated that the SiO2 coating on the particles was an amorphous phase. The diffraction peak intensity of the amorphous SiO2 phase increased gradually as the deposition time increased, likely because more SiO2 was deposited onto the surfaces of the particles. The average crystal sizes, micro-strains, and lattice constants of the α-Fe(Si) phase with their corresponding deposition times are analyzed after XRD structural refinement using a Jade 6.0 software (Materials Data, USA). The results are shown in Table 1. The microstructure of the α-Fe(Si) phase did not undergo any obvious changes during FBCVD. The average crystal size, micro-strain, and lattice constant were approximately 56.1 nm, 0.126%, and 2.8510 Å, respectively. These results indicated that the deposition of amorphous SiO2 did not affect the crystal structure of the Fe-6.5wt.%Si particle substrate.
The morphologies of the particles were investigated via FE-SEM. The typical morphology of the atomized Fe-6.5wt.%Si particle substrate can be seen in Figure 2a. Wrinkles and pits (outlined in black on the Figure 2a) randomly distributed over the surfaces of the particles resulted from the combined effects of superheating, flow pressure, and collision during solidification. The surface stress would be increased owing to the appearance of those wrinkles and pits, and the stress centralizes around the wrinkles and in the pits [24]. The successful deposition of insulative SiO2 nanoparticles onto the Fe-6.5wt.%Si particles is indicated in Figure 2b–h. The surface roughness clearly increased as the quantity of deposited SiO2 increased owing to longer deposition times. The wrinkles and pits became less defined as the quantity of deposited SiO2 increased with the increasing deposition time. It was possible that the FBCVD SiO2 deposition process was similar to that of traditional chemical vapor deposition [25]. It could then be divided into four major evolutionary stages. When deposition was performed for 60 s (Figure 2b), the SiO2 insulation nucleated on the surface of the Fe-6.5wt.%Si particles by absorbing SiO2 or merging. When the deposition time was extended to 120 s (Figure 2c), the growing SiO2 nuclei formed three-dimensional islands once their concentration reached a certain threshold. As the FBCVD reaction progressed, the SiO2 islands continuously came into contact by gathering and through the secondary nucleation of young SiO2 nuclei. Particles obtained after deposition for <960 s are shown in Figure 2d–f. Most of the adjacent SiO2 islands merged, leaving only a small number of stripe-shaped gaps. Fresh SiO2 continued to nucleate and grow within the gaps to form an integrated and continuous SiO2 insulative coating in the final stage of deposition. The particles obtained after deposition for 1920 s and 3840 s are shown in Figure 2g,h, respectively. The vast majority of the initial SiO2 islands was located in the wrinkled and pitted areas of the Fe-6.5wt.%Si substrate (tagged in red in Figure 2c). According to the model of heterogeneous nucleation on rough surfaces [26], the nucleation energy can be calculated using Equation (1).
Δ G H e t = 16 π r n s 3 3 Δ g v 2 ( 1 cos θ * ) 2 ( 2 + cos θ * ) 4
where ΔGHet is the heterogeneous nucleation energy on a rough surface; rns is the ratio of the interfacial energies of a SiO2 nucleus and an Fe-6.5wt.%Si particle; and Δgv is the difference between the free energies of the SiO2 nucleus and the Fe-6.5wt.%Si particle. θ* is the epigenetic contact angle between the SiO2 nucleus and the Fe-6.5wt.%Si particle, which can be calculated using Equation (2) according to the Wenzel model [27].
cos θ * = f cos θ
where f is the roughness factor of a rough surface, and θ is the intrinsic contact angle between a SiO2 nucleus and an Fe-6.5wt.%Si particle. The schematic illustration of the intrinsic contact angle (θ) and epigenetic contact angle (θ*) between the SiO2 nucleus and the Fe-6.5wt.%Si particle was shown in Supplementary Figure S1. As the SiO2 nucleus is present on an island structure, the value of θ is less than 90° [28,29]. Many more nucleation sites were thus present in the wrinkled and pitted areas, because ΔGHet decreased as the value of f increased. This indicated that the Fe-6.5wt.% Si/SiO2 composite structure could form quickly during FBCVD. However, the time required to form the integrated Fe-6.5wt.% Si/SiO2 C-S structure is not known with certainty, and further investigation is needed.
To investigate the formation and transformation processes of the Fe-6.5wt.%Si/SiO2 C-S structure, electron backscatter diffraction analysis was performed on sections of the Fe-6.5wt.%Si/SiO2 composite particles after deposition for >120 s. The cross-sectional FE-SEM images are shown in Figure 3a–f. The thickness and uniformity of the SiO2 insulation and the cladding ratio increased dramatically with the increasing deposition time. The Stranski–Krastanovs mode of nucleation and growth was observed [30], which was in good agreement with the results of previous analyses. Within a relatively short period of 120 s, roughly 61.8% of the Fe-6.5wt.%Si substrate surface in Figure 3a was covered with insulative SiO2 cladding, with an average thickness of 93 nm. As the deposition time increased to 960 s (Figure 3d), the Fe-6.5wt.%Si substrate surface became completely covered with layers of insulative SiO2 cladding, with thicknesses ranging from 107 nm to 262 nm. Moreover, the average value of the SiO2 insulation thickness was 184.5 nm. The results indicated that the evolution of the Fe-6.5wt.%Si/SiO2 composite structure into the integrated Fe-6.5wt.%Si/SiO2 C-S structure might take 960 s or longer. With deposition times of 1920 s and 3840 s (Figure 3e–f), the Fe-6.5wt.%Si/SiO2 C-S structure was much more recognizable. The cladding ratios and thicknesses of the SiO2 layers after deposition for various amounts of time are shown in Figure 3g. The experimental data were fitted using the classic Kolmogorov–Johnson–Mehl–Avrami equation [31] to investigate the relationship between the cladding ratio and the deposition time.
C S i O 2 = 1 exp ( 0.0274 t 0.735 )
where CSiO2 is the cladding ratio of SiO2 insulation on the surface of the Fe-6.5wt.%Si substrate, and t is the FBCVD reaction time. This fitting equation demonstrated here can provide basic information to precisely control the morphology characteristics of Fe-6.5wt.%Si/SiO2 C-S structure particles during the FBCVD process.
The chemical states of the Fe-6.5wt.%Si/SiO2 composite particles after deposition for > 480 s and their variation with deposition time were studied via XPS. The results are shown in Figure 4 and Table 2. The XPS survey spectrum of the Fe-6.5wt.%Si/SiO2 composite particles after deposition for 480 s contained characteristic C, Si, O, and Fe peaks. For calibration purposes, the C1s electron binding energy corresponding to adsorbed carbon was set at 284.8 eV. The intensities of the Si and O signals increased with deposition time, while the Fe signal decreased in intensity. The Fe2p peak existing in the Fe-6.5wt.%Si/SiO2 composite particles after deposition for 480 s was because the SiO2 is not fully coated on the Fe-6.5wt.%Si particle surface to form the Fe-6.5wt.%Si/SiO2 C-S structure. When the deposition time increased above 960 s, the Fe2p peak was nearly undetectable, indicating that formation of the Fe-6.5wt.%Si/SiO2 C-S structure was complete after deposition for 960 s and the thickness of SiO2 insulation is higher than 10 nm. Moreover, the deconvoluted Fe3p spectra for electrons on the surfaces of Fe-6.5wt.%Si/SiO2 C-S particles after deposition for 1920 s is shown in Supplementary Figure S2. Four Si2p peaks at electron binding energies of 102.54 eV, 103.31 eV, 103.84 eV, and 104.07 eV [32,33] are visible in the deconvoluted Si spectrum of Fe-6.5wt.%Si/SiO2 C-S particles after deposition for 1920 s, as shown in Figure 4e. According to the 29Si magic angle spinning nuclear magnetic resonance (MAS NMR) and chemical kinetics results [34,35,36], there are four categories of Si groups with different oxidation states during thermal decomposition of the C8H20O4Si precursor. Moreover, the concentrations of four categories of Si groups decrease in the order Si(OSi)4 (group Q1) > Si(OSi)3OH (group Q2) > Si(OSi)2(OH)2 (group Q3) > Si(OSi)(OH)3 (group Q4). In accordance with the results of the quantitative analysis (Table 2), the Si2p electron structure on the Fe-6.5wt.%Si/SiO2 C-S surface after deposition for 1920 s indicated the presence of Si in Q3 groups (102.54 eV, 12.81 at.%), Q1 groups (103.31 eV, 42.56 at.%), Q2 groups (103.84 eV, 31.08 at.%), and Q4 groups (104.07 eV, 8.35 at.%). Similarly, the O1s electrons on the surfaces of the Fe-6.5wt.%Si/SiO2 C-S particles after deposition for 1920 s were assigned to Q3 groups (531.24 eV, 14.07 at.%), Q1 groups (532.62 eV, 43.87 at.%), Q4 groups (532.81 eV, 11.33 at.%), and Q2 groups (532.97 eV, 29.24 at.%) [33]. The peak at 534.03 eV was ascribed to O atoms bound to the Fe-6.5wt.%Si alloy surface (1.99 at.%). It was noted that the sum of the O atoms in Q2 groups and O atoms bound to the Fe-6.5wt.%Si alloy surface (31.23 at.%) was in close proximity to the at.% of Si in Q2 groups (31.08 at.%). This indicated that the O atoms interacting with the Fe-6.5wt.%Si alloy surface were also in Q2 groups. Although the binding energies of Si2p and O1s electrons did not change as the deposition time increased to 4000 s (Figure 4h), their relative proportions in Q3 and Q4 groups decreased slightly. This meant that Si groups with a high degree of polymerization were more thermally stable [37,38]. The Fe-6.5wt.%Si/SiO2 C-S structural formation process during FBCVD is shown schematically in Figure 5, which is based on the combined XRD, SEM, and XPS results.

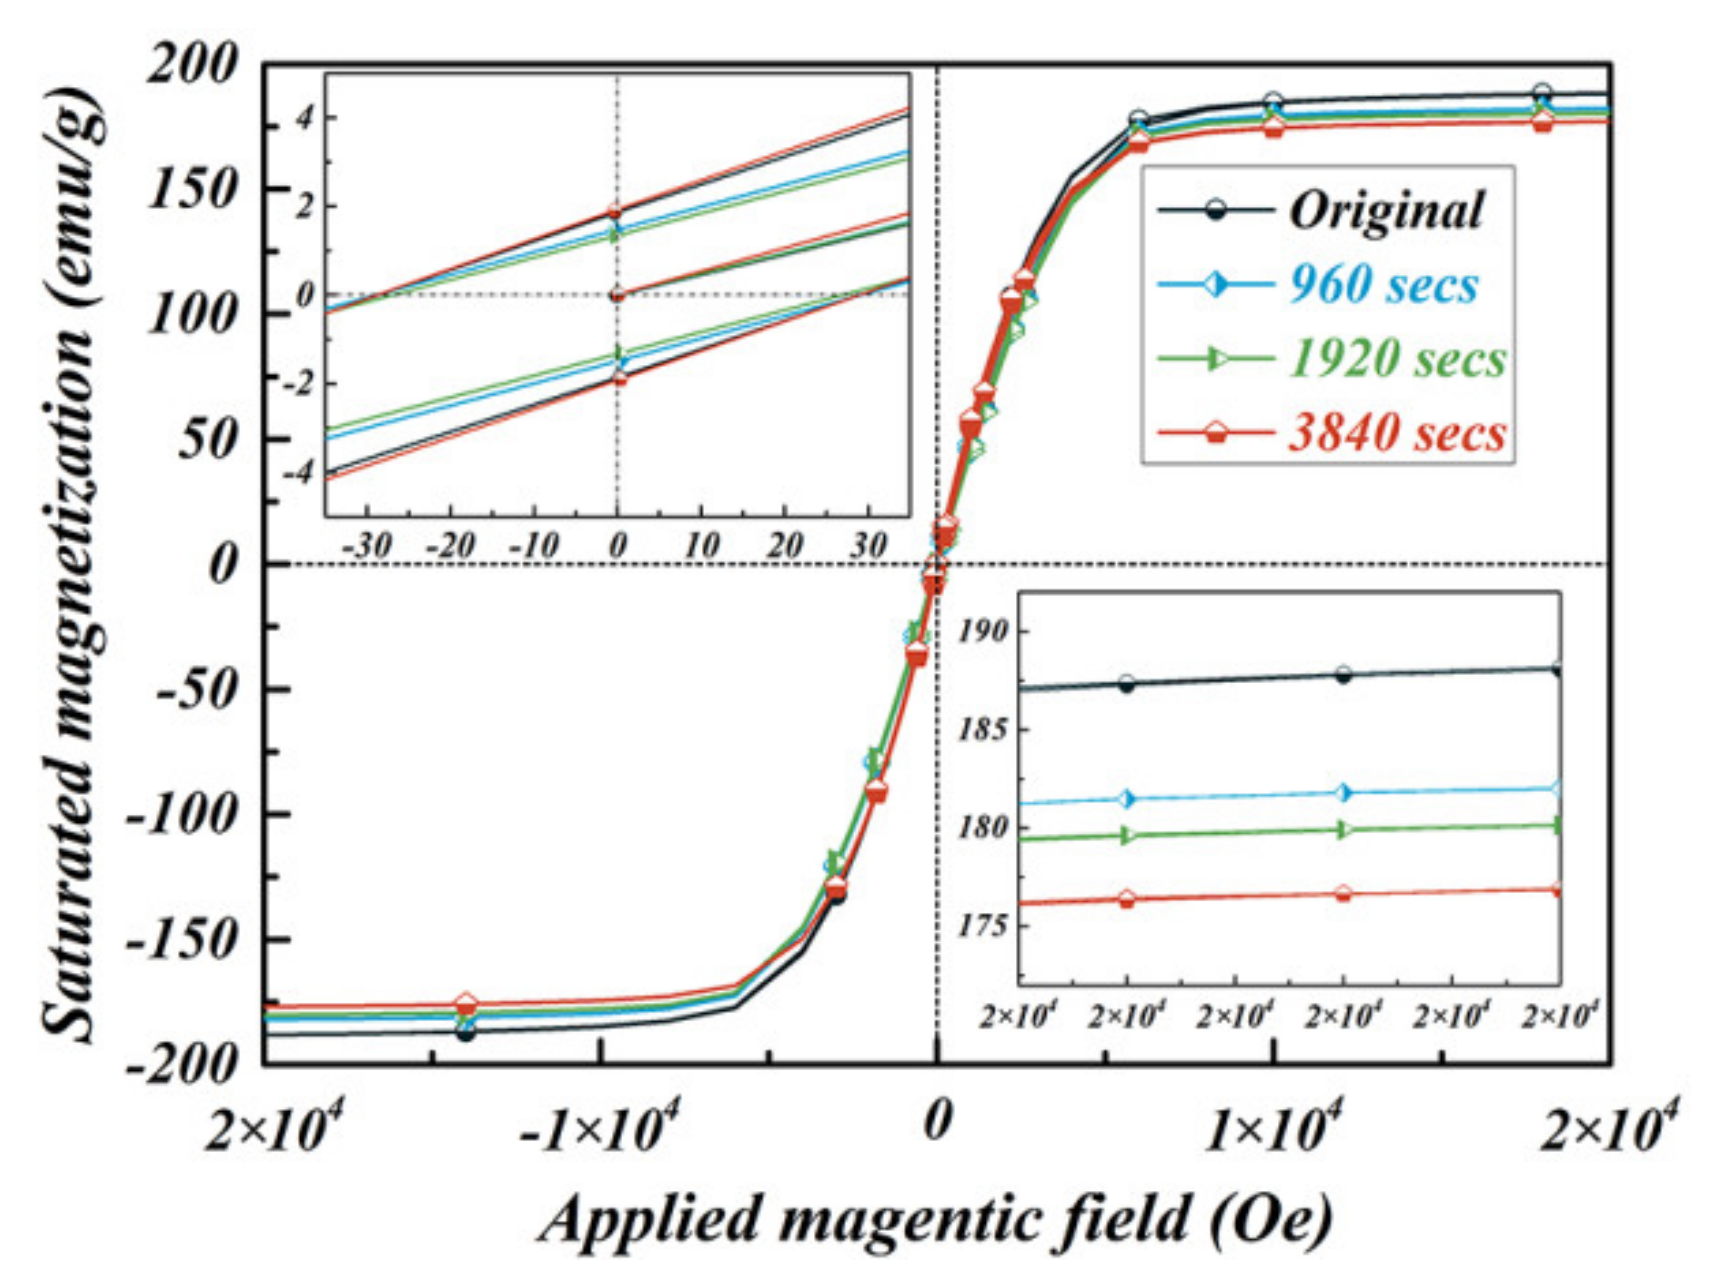
3.2. Static Magnetic Properties

The static magnetic properties of the original Fe-6.5wt.%Si particles and Fe-6.5wt.%Si/SiO2 C-S particles were analyzed using a VSM. The results are shown in Figure 6. On the basis of their hysteresis loops, all of the particle samples exhibited excellent soft magnetic properties. The saturated magnetization (Ms) values of the Fe-6.5wt.%Si/SiO2 C-S particles were obtained in the range from 176.9 to 182.0 emu/g as the deposition time increased from 960 s to 3840 s. The Ms values of the Fe-6.5wt.%Si/SiO2 C-S particles were slightly lower than those of the original Fe-6.5wt.%Si particles (188.1 emu/g). The decrease in the Ms values with the increasing deposition time might have been the result of the growing thickness and quality of the non-magnetic amorphous SiO2 shells on the core Fe-6.5wt.%Si particles. This also had the effect of reducing the magnetic moment per unit volume. The theoretical value of Ms according to the core-surface model [39] could be calculated using Equation (4).
M s = M s ( F e 6.5 w t . % S i ) × v ( F e 6.5 w t . % S i ) + M s ( S i O 2 ) × v ( S i O 2 ) v ( F e S i ) + v ( S i O 2 ) = M s ( F e 6.5 w t . % S i ) × d 3 + M s ( S i O 2 ) × ( ( d + r ) 3 d 3 ) ( d + r ) 3
where Ms(Fe-6.5wt.%Si) is the Ms of the pure Fe-6.5wt.%Si particles (188.1 emu/g); Ms(SiO2) is the Ms of the non-magnetic amorphous SiO2 shell (0 emu/g); d is the average radius of the original Fe-6.5wt.%Si particles (35 μm); and r is the thickness of the non-magnetic amorphous SiO2 shell. The theoretical and measured Ms values of all the particle samples are summarized in Table 3. It was clear that the measured Ms values agree with the theoretical results approximately, which verified the correctness of the experimental data in this work and indicated that both the microstructural characteristics and the saturated magnetization values of the particles could be controlled with the deposition time. However, the value of Hc changed little, which was thought to be because the test conditions of vibrating sample magnetometer (step-size of 50 Oe and testing precision of 1%) cannot satisfy the demands of Hc of the soft magnetic materials [40].
The electrical resistivities of the original Fe-6.5wt.%Si particles and the Fe-6.5wt.%Si/SiO2 C-S particles are shown in Figure 7. According to the percolation theory, an increase in the electrical resistivity of a conducting/insulating C-S structure is the result of disruption of the electrical conductivity network [41]. Conduction in the original Fe-6.5wt.%Si particles and the Fe-6.5wt.%Si/SiO2 C-S particles could be described using a simple circuit model. On one hand, the original Fe-6.5wt.%Si particles were in continuous contact to form chain return, which was equivalent to the current passed through series-connected resistors. On the other, the conductive Fe-6.5wt.%Si cores of the Fe-6.5wt.%Si/SiO2 C-S particles were covered with insulative amorphous SiO2 shells, which corresponded to capacitance. Therefore, the electrical resistivities of Fe-6.5wt.%Si/SiO2 C-S particles after deposition for 480 s (2054 μΩ∙m) were higher than those of the original Fe-6.5wt.%Si particles (0.91 μΩ∙m) by four orders of magnitude. The increase in the SiO2 shell thickness with the increasing deposition time led to more obvious capacitance effects. This increased the electrical resistivities of the Fe-6.5wt.%Si/SiO2 C-S particles to 2347 μΩ∙m (1920 s) and 2660 μΩ∙m (3840 s).

4. Conclusions

We studied the formation of an integrated Fe-6.5wt.%Si/SiO2 C-S structure during fluidized bed chemical vapor deposition. The Fe-6.5wt.%Si/SiO2 C-S particles were synthesized using Fe-6.5wt.%Si particle substrates and a gaseous C8H20O4Si precursor via FBCVD for different amounts of time. The Fe-6.5wt.%Si/SiO2 composite particles could be obtained in 60 s. These were converted into integrated ferromagnetic/SiO2 C-S structures after deposition for ≥960 s. The process of integrated ferromagnetic/SiO2 C-S structure formation was described using the three-dimensional island nucleation theory. Islands began to form in wrinkled and pitted areas of the Fe-6.5wt.%Si particle surfaces. The deposited SiO2 was an amorphous phase with four Si groups and five O groups. As the deposition time increased from 120 s to 960 s, the cladding ratio increased from 61.8% to 100%, and the average thickness of the SiO2 layer increased from 93 nm to 184.5 nm. The average thickness of the SiO2 layer increased as the FBCVD reaction progressed, and it became more uniform. The saturated magnetization values of the Fe-6.5wt.%Si/SiO2 C-S particles decreased from 182.0 emu/g to 176.9 emu/g as the deposition time increased from 960 s to 3840 s, while their electrical resistivity increased from 2054 μΩ∙m to 2660 μΩ∙m. We believe this work will help promote the use of FBCVD for the synthesis of high-performance Fe-6.5wt.%Si/SiO2 and other ferromagnetic-based SMCs for future applications.

Supplementary Materials

The following are available online at https://www.mdpi.com/2075-4701/10/4/520/s1, Figure S1: Schematic illustration of intrinsic contact angle (θ) and the epigenetic contact angle (θ*) between the SiO2 nucleus and the Fe-6.5wt.%Si particle; Figure S2: The deconvoluted Fe3p spectra for electrons on the surfaces of Fe-6.5wt.%Si/SiO2C-S particles after deposition for 1920 s.

Author Contributions

Conceptualization, writing—original draft preparation, Z.W. and J.J.; methodology, C.X.; investigation, X.L.; writing—review and editing, K.X.; visualization, project administration, H.K. All authors have read and agreed to the published version of the manuscript.

Funding

This research was funded by Natural Science Foundation of Anhui Province (1908085QE190), Chinese National Science Foundation (51904002, 51674181), and Key Program of Scientific Research Fund of Anhui Provincial Education Department (KJ2019A0077).

Conflicts of Interest

The authors declare no conflict of interest.

References

  1. Shokrollahi, H.; Janghorban, K. Soft magnetic composite materials (smcs). J. Mater. Process. Technol. 2007, 189, 1–12. [Google Scholar] [CrossRef]
  2. Périgo, E.; Weidenfeller, B.; Kollár, P.; Füzer, J. Past, present, and future of soft magnetic composites. Appl. Phys. Rev. 2018, 5, 031301. [Google Scholar] [CrossRef]
  3. Shokrollahi, H. The magnetic and structural properties of the most important alloys of iron produced by mechanical alloying. Mater. Des. 2009, 30, 3374–3387. [Google Scholar] [CrossRef]
  4. Liu, D.; Wu, C.; Yan, M.; Wang, J. Correlating the microstructure, growth mechanism and magnetic properties of fesial soft magnetic composites fabricated via hno3 oxidation. Acta Mater. 2018, 146, 294–303. [Google Scholar] [CrossRef]
  5. Liu, L.; Yue, Q.; Li, G.; Xu, K.; Wang, J.; Wu, Z.; Fan, X. Influence of sio2 insulation layers thickness distribution on magnetic behaviors of fe-si@ sio2 soft magnetic composites. J. Phys. Chem. Solids 2019, 132, 76–82. [Google Scholar] [CrossRef]
  6. King, D.M.; Liang, X.; Weimer, A.W. Functionalization of fine particles using atomic and molecular layer deposition. Powder Technol. 2012, 221, 13–25. [Google Scholar] [CrossRef]
  7. Ferguson, J.D.; Weimer, A.W.; George, S.M. Atomic layer deposition of ultrathin and conformal al2o3 films on bn particles. Thin Solid Films 2000, 371, 95–104. [Google Scholar] [CrossRef]
  8. King, D.M.; Spencer, J.A.; Liang, X.; Hakim, L.F.; Weimer, A.W. Atomic layer deposition on particles using a fluidized bed reactor with in situ mass spectrometry. Surf. Coat. Technol. 2007, 201, 9163–9171. [Google Scholar] [CrossRef]
  9. Rauwel, E.; Galeckas, A.; Rauwel, P.; Nilsen, O.; Walmsley, J.; Rytter, E.; Fjellvåg, H. Ald applied to conformal coating of nanoporous γ-alumina: Spinel formation and luminescence induced by europium doping. J. Electrochem. Soc. 2012, 159, 45–49. [Google Scholar] [CrossRef]
  10. Fan, X.; Wu, Z.; Li, G.; Wang, J.; Xiang, Z.; Gan, Z. High resistivity and low core loss of intergranular insulated fe–6.5 wt.% si/sio2 composite compacts. Mater. Des. 2016, 89, 1251–1258. [Google Scholar] [CrossRef]
  11. Luo, F.; Fan, X.A.; Luo, Z.; Hu, W.; Li, G.; Li, Y.; Liu, X.; Wang, J. Ultra-low inter-particle eddy current loss of fe3si/al2o3 soft magnetic composites evolved from fesial/fe3o4 core-shell particles. J. Magn. Magn. Mater. 2019, 484, 218–224. [Google Scholar] [CrossRef]
  12. Nazir, S.; Jiang, S.; Cheng, J.; Yang, K. Enhanced interfacial perpendicular magnetic anisotropy in fe/mgo heterostructure via interfacial engineering. Appl. Phys. Lett 2019, 114, 072407. [Google Scholar] [CrossRef]
  13. Rauwel, E.; Nilsen, O.; Rauwel, P.; Walmsley, J.C.; Frogner, H.B.; Rytter, E.; Fjellv?g, H. Oxide coating of alumina nanoporous structure using ald to produce highly porous spinel. Chem. Vap. Depos. 2012, 18, 315–325. [Google Scholar] [CrossRef]
  14. Zhao, J.; Wu, C.; Luo, D.; Yan, M. Soft magnetic composites based on the fe elemental, binary and ternary alloy systems fabricated by surface nitridation. J. Magn. Magn. Mater. 2019, 481, 140–149. [Google Scholar] [CrossRef]
  15. Liu, D.; Wu, C.; Yan, M. Investigation on sol–gel Al2O3 and hybrid phosphate-alumina insulation coatings for fesial soft magnetic composites. J. Mater. Sci. 2015, 50, 6559–6566. [Google Scholar] [CrossRef]
  16. Wu, C.; Chen, H.; Lv, H.; Yan, M. Interplay of crystallization, stress relaxation and magnetic properties for fecunbsib soft magnetic composites. J. Alloys Compd. 2016, 673, 278–282. [Google Scholar] [CrossRef]
  17. Pooladi, M.; Shokrollahi, H.; Lavasani, S.; Yang, H. Investigation of the structural, magnetic and dielectric properties of mn-doped bi2fe4o9 produced by reverse chemical co-precipitation. Mater. Chem. Phys. 2019, 229, 39–48. [Google Scholar] [CrossRef]
  18. Shokrollahi, H. Structure, synthetic methods, magnetic properties and biomedical applications of ferrofluids. Mater. Sci. Eng. C 2013, 33, 2476–2487. [Google Scholar]
  19. Fan, X.; Wang, J.; Wu, Z.; Li, G. Core–shell structured FeSiAl/SiO2 particles and Fe3Si/Al2O3 soft magnetic composite cores with tunable insulating layer thicknesses. Mater. Sci. Eng. B 2015, 201, 79–86. [Google Scholar] [CrossRef]
  20. Geng, K.; Xie, Y.; Xu, L.; Yan, B. Structure and magnetic properties of ZrO2-coated Fe powders and Fe/ZrO2 soft magnetic composites. Adv. Powder Technol. 2017, 28, 2015–2022. [Google Scholar] [CrossRef]
  21. Hsiang, H.I.; Fan, L.F.; Hung, J.J. Phosphoric acid addition effect on the microstructure and magnetic properties of iron-based soft magnetic composites. J. Magn. Magn. Mater. 2018, 447, 1–8. [Google Scholar] [CrossRef]
  22. Wu, Z.; Jiang, Z.; Fan, X.; Zhou, L.; Wang, W.; Xu, K. Facile synthesis of Fe-6.5 wt% Si/SiO2 soft magnetic composites as an efficient soft magnetic composite material at medium and high frequencies. J. Alloys Compd. 2018, 742, 90–98. [Google Scholar] [CrossRef]
  23. Wu, S.L.; Chen, C.M.; Kuo, J.H.; Wey, M.Y. Synthesis of carbon nanotubes with controllable diameter by chemical vapor deposition of methane using Fe@Al2O3 core–shell nanocomposites. Chem. Eng. Sci. 2020, 217, 115541. [Google Scholar] [CrossRef]
  24. Turnbull, A.; Horner, D.A.; Connolly, B.J. Challenges in modelling the evolution of stress corrosion cracks from pits. Eng. Fract. Mech. 2008, 76, 633–640. [Google Scholar] [CrossRef]
  25. Serp, P.; Feurer, R.; Kalck, P.; Kihn, Y.; Faria, J.; Figueiredo, J. A chemical vapour deposition process for the production of carbon nanospheres. Carbon 2001, 39, 621–626. [Google Scholar] [CrossRef]
  26. Zheng, H.Y.; Wang, M.; Wang, X.X.; Huang, W.D. Analysis of heterogeneous nucleation on rough surfaces based on wenzel model. Acta Phys. Sin. 2011, 6, 066402–066405. [Google Scholar]
  27. Wenzel, R.N. Resistance of solid surfaces to wetting by water. Ind. Eng. Chem. 1936, 28, 988–994. [Google Scholar] [CrossRef]
  28. Seel, S.C.; Thompson, C.V. Tensile stress generation during island coalescence for variable island-substrate contact angle. J. Appl. Phys. 2003, 93, 9038–9042. [Google Scholar] [CrossRef]
  29. Woodward, J.; Gwin, H.; Schwartz, D. Contact angles on surfaces with mesoscopic chemical heterogeneity. Langmuir 2000, 16, 2957–2961. [Google Scholar] [CrossRef]
  30. Baskaran, A.; Smereka, P. Mechanisms of stranski-krastanov growth. J. Appl. Phys. 2012, 111, 044321. [Google Scholar] [CrossRef]
  31. Castro, M.; Domınguez-Adame, F.; Sánchez, A.; Rodrıguez, T. Model for crystallization kinetics: Deviations from kolmogorov–johnson–mehl–avrami kinetics. Appl. Phys. Lett. 1999, 75, 2205–2207. [Google Scholar] [CrossRef] [Green Version]
  32. Zhu, Y.; Luo, B.; Sun, C.; Li, Y.; Han, Y. Influence of bromine modification on collecting property of lauric acid. Miner. Eng. 2015, 79, 24–30. [Google Scholar] [CrossRef]
  33. Buchwalter, L.P. Chromium and tantalum adhesion to plasma-deposited silicon dioxide and silicon nitride. J. Adhes. Sci. Technol. 1995, 9, 97–116. [Google Scholar] [CrossRef]
  34. Temuujin, J.; Okada, K.; MacKenzie, K.J.D.; Jadambaa, T. Characterization of porous silica prepared from mechanically amorphized kaolinite by selective leaching. Powder Technol. 2001, 121, 259–262. [Google Scholar] [CrossRef]
  35. Kachurovskaya, N.A.; Zhidomirov, G.M.; Aristov, Y.I. On the problem of differentiation of acetone adsorption species on the silica gel: Molecular models of adsorption complexes. J. Mol. Catal. A Chem. 2000, 158, 281–285. [Google Scholar] [CrossRef]
  36. Coltrin, M.E.; Ho, P.; Moffat, H.K.; Buss, R.J. Chemical kinetics in chemical vapor deposition: Growth of silicon dioxide from tetraethoxysilane (teos). Thin Solid Films 2000, 365, 251–263. [Google Scholar] [CrossRef]
  37. Liu, Y.; Huang, Y.; Liu, L. Thermal stability of poss/methylsilicone nanocomposites. Compos. Sci. Technol. 2007, 67, 2864–2876. [Google Scholar] [CrossRef]
  38. He, S.; Sun, G.; Cheng, X.; Dai, H.; Chen, X. Nanoporous SiO2 grafted aramid fibers with low thermal conductivity. Compos. Sci. Technol. 2017, 146, 91–98. [Google Scholar] [CrossRef]
  39. Nanophase Materials: Synthesis-Properties-Applications; Hadjipanayis, G.C.; Siegel, R.W. (Eds.) Springer Science & Business Media: Berlin, Germany, 2012; Volume 260. [Google Scholar]
  40. Geng, K.; Xie, Y.; Yan, L.; Yan, B. Fe-si/zro2 composites with core-shell structure and excellent magnetic properties prepared by mechanical milling and spark plasma sintering. J. Alloys Compd. 2017, 718, 53–62. [Google Scholar] [CrossRef]
  41. Feng, Y.; Li, W.; Wang, J.; Yin, J.; Fei, W. Core–shell structured batio 3@ carbon hybrid particles for polymer composites with enhanced dielectric performance. J. Mater. Chem. A 2015, 3, 20313–20321. [Google Scholar] [CrossRef]
Figure 1. (a) X-ray diffractometer (XRD) patterns and (b) partially enlarged XRD patterns of the original Fe-6.5wt.%Si particles and the particles obtained after fluidized bed chemical vapor deposition (FBCVD).
Metals 10 00520 g001
Figure 2. (a) Field-emission scanning electron microscope (FE-SEM) images of the original Fe-6.5wt.%Si particles; particle samples following FBCVD for (b) 60 s, (c) 120 s, (d) 240 s, (e) 480 s, (f) 960 s, (g) 1920 s, and (h) 3840 s.
Metals 10 00520 g002
Figure 3. Cross-sectional images of Fe-6.5wt.%Si/SiO2 composite particles after deposition for (a) 120 s, (b) 240 s, (c) 480 s, (d) 960 s, (e) 1920 s, and (f) 3840 s. (g) The relationships between the cladding ratio, SiO2 insulation thickness, and deposition time.
Metals 10 00520 g003
Figure 4. X-ray photoelectron spectroscopy (XPS) survey spectra of Fe-6.5wt.%Si/SiO2 composite particles after deposition for (a) 480 s, (b) 960 s, (c) 1920 s, and (d) 3840 s. The deconvoluted Si2p and O1s spectra for electrons on the surfaces of Fe-6.5wt.%Si/SiO2 C-S particles after deposition for 1920 s (e,f) and 3840 s (g,h).
Metals 10 00520 g004
Figure 5. Schematic illustration of the Fe-6.5wt.%Si/SiO2 C-S structural formation process during FBCVD.
Metals 10 00520 g005
Figure 6. Hysteresis loops and details about the applied magnetic fields and saturated magnetization of the original Fe-6.5wt.%Si particles and Fe-6.5wt.%Si/SiO2 C-S particles after deposition over various intervals.
Metals 10 00520 g006
Figure 7. Electrical resistivities of the original Fe-6.5wt.%Si particles and Fe-6.5wt.%Si/SiO2 C-S particles following deposition.
Metals 10 00520 g007
Table 1. The average crystal sizes, micro-strains, and lattice constants of α-Fe(Si) in the original Fe-6.5wt.%Si particles and the particles obtained after fluidized bed chemical vapor deposition (FBCVD).
SamplesCrystal Size (nm)Micro-Strain (%)Lattice Constant (Å)
Original Fe-6.5wt.%Si particles55.1 ± 0.100.126 ± 0.00162.8508 ± 0.006
Particle samples after deposition for 60 to 3840 s60 s53.7 ± 0.060.131 ± 0.00132.8509 ± 0.004
120 s57.3 ± 0.080.122 ± 0.00172.8511 ± 0.003
240 s56.1 ± 0.090.128 ± 0.00172.8510 ± 0.004
480 s54.6 ± 0.090.123 ± 0.00192.8509 ± 0.005
960 s58.7 ± 0.090.128 ± 0.00182.8510 ± 0.002
1920 s58.8 ± 0.110.127 ± 0.00202.8511 ± 0.004
3840 s54.1 ± 0.130.126 ± 0.00212.8513 ± 0.006
Table 2. Quantitative elemental analysis of Si2p and O1s on the surfaces of Fe-6.5wt.%Si/SiO2 composite particles after deposition for 1920 s and 3840 s.
Deposition TimePeaksRelative Sensitivity FactorsPositionFull Width Half MaximumAreaAtomic Ratio
1920 sSi2p1102.54 eV1.404610.112.81%
Si2p1103.31 eV1.3110,896.342.56%
Si2p1103.84 eV1.537956.031.08%
Si2p1104.07 eV1.162138.98.35%
O1s1531.24 eV1.9821,095.414.07%
O1s1532.62 eV1.5365,018.543.87%
O1s1532.81 eV1.8016,911.411.33%
O1s1532.97 eV1.8743,835.329.24%
O1s1534.03 eV2.612978.71.99%
3840 sSi2p1102.54 eV1.704343.815.95%
Si2p1103.31 eV1.3911,862.643.55%
Si2p1103.87 eV1.558693.931.92%
Si2p1104.07 eV1.802337.98.58%
O1s1531.24 eV1.8720,603.513.28%
O1s1532.62 eV1.4569,023.344.49%
O1s1532.81 eV1.3313,883.48.95%
O1s1532.97 eV1.9146,698.830.10%
O1s1534.03 eV1.164922.83.17%
Table 3. Theoretical and measured saturated magnetization values of the original Fe-6.5wt.%Si particles and Fe-6.5wt.%Si/SiO2 C-S particles following deposition.
SamplesTheoretical
Value (emu/g)
Measured
Value (emu/g)
original Fe-6.5wt.%Si particles188.1188.1
Fe-6.5wt.%Si/SiO2 C-S
particles
960 s182.0182.9
1920 s180.3181.0
3840 s176.9178.4

