Article

Microstructural Precipitation Evolution and In Vitro Degradation Behavior of a Novel Chill-Cast Zn-Based Absorbable Alloy for Medical Applications

by
Ana Laura Ramirez–Ledesma
1,*,
Paola Roncagliolo–Barrera
1,
Carlo Paternoster
2,
Riccardo Casati
3,
Hugo Lopez
4,
Maurizio Vedani
3 and
Diego Mantovani
2
1
Departamento de Ingeniería Metalúrgica, Facultad de Química, Universidad Nacional Autónoma de México, Av. Universidad 3000, Circuito Exterior S/N, Cd. Universitaria, 04510 Ciudad de México, Mexico
2
Lab. for Biomaterials & Bioengineering (CRC—I), Dept. Min—Met—Materials Engineering & Research Center CHU de Québec, Laval University, Québec, QC G1V 0A6, Canada
3
Department of Mechanical Engineering, Politecnico di Milano, 20133 Milan, Italy
4
Materials Science and Engineering Department, CEAS University of Wisconsin-Milwaukee 3200 N. Cramer Street, Milwaukee, WI 53211, USA
*
Author to whom correspondence should be addressed.
Metals 2020, 10(5), 586; https://doi.org/10.3390/met10050586
Submission received: 2 April 2020 / Revised: 23 April 2020 / Accepted: 26 April 2020 / Published: 29 April 2020

Abstract

:
In recent years, increasing interest has been placed in the development of Zn alloys for absorbable biomedical applications. It has been demonstrated that these alloys are potential candidates for endovascular applications. In the present work, a novel Zn-12.5Ag-1Mg alloy was investigated as a potential biomedical absorbable material. As a reference, the exhibited biocompatible properties are compared with those of pure Zn and a Zn-1Mg alloy. All the alloys investigated in this work were cast in a water-cooled Cu-mold (chill casting). Subsequently, the alloys were solution-treated and then extruded. The microstructural evolution at each stage of the alloy processing was resolved by analytical means including optical, scanning, transmission microscopy, and X-ray diffraction. By these means, the various phases belonging to this alloy system were disclosed. In addition, determinations of both corrosion and mechanical properties were carried out in the proposed Zn-12.5Ag-1Mg alloy. In particular, an excellent combination of strength and ductility was found, which is attributed to grain refinement as well as the precipitation of a uniform distribution of refined phases (i.e., AgZn solid solution, ε-AgZn3, and Ag0.15MgZn1.85 intermetallics). All the precipitated intermetallics were embedded in a η-Zn matrix. As for the corrosion degradation in the physiological NaCl solution in the as-extruded condition, the experimental outcome indicates that the Zn-12.5Ag-1Mg alloy exhibits degradation rates far superior to currently reported ones for Zn-based alloys intended for absorbable biomedical applications.

1. Introduction

Absorbable metals are considered revolutionary as they introduce a new class of materials for applications as biomedical devices. Currently, pure Mg, Fe, and Zn are the dominant metallic materials in the development of novel absorbable alloys [1,2,3]. In particular, a well-known disadvantage of Mg alloys is related to its rapid degradation including hydrogen evolution in physiological environments. In addition, their relatively poor mechanical performance for cardiovascular applications is well documented [4]. In Fe-alloys, despite their outstanding mechanical properties, they suffer from inadequate corrosion properties for applications as biomedical absorbable alloys. According to the literature, pure Fe and in general Fe-alloys cannot completely degrade over a service period of approximately two years [5]. Therefore, in order to improve the corrosion rate of Fe-based alloys, the role of alloying elements such as Mn has been considered [6]. In contrast, Zn alloys are the newly proposed absorbable materials. These novel type of alloys, provide an opportunity to overcome some of the alloy limitations found in Mg and Fe systems.
In general, Zn possesses a standard corrosion potential of −0.8 V vs. standard hydrogen electrode (SHE), (between Fe (−0.4 V vs. NHE) and Mg (−2.4 V vs. NHE) [7]). Moreover, Zn plays a vital role in the human fluid environment as it regulates body functions, such as in DNA synthesis, RNA polymerization, and in the regulation of various transcription factors. Moreover, it is the second most abundant transition metal element in the human body [8,9,10] after Fe. In particular, among all the benefits offered by Zinc, its relatively low biocorrosion degradation for cardiovascular applications allows for a wide range of alloy processing alternatives for optimal mechanical properties [11] including better cytocompatibility. In vivo studies by Bowen et al. [11,12] indicated that Zn-alloys are potentially suitable for endovascular applications. In fact, Zn has been recommended as a dietary allowance of 2–3 µg/day for infants and up to 12 µm/day for adults [13,14].
Plausible degradation mechanisms in in vivo Zn experiments have been proposed by Yang et al. [12] who followed the alloy degradation of a Zn stent in the abdominal aorta of a rabbit. The major findings of their work included (1) extraordinary biocompatibility of the Zn degradation products, (2) structural integrity of the used scaffolds for up to 6 months, and (3) 40% volume stent degradation after 12 months. Currently, Zn alloys are subject to extensive research aimed at identifying families of alloys that are completely suitable and absorbable for stent fabrication [6].
One of the major challenges in designing an absorbable alloy system is to keep the balance between mechanical and corrosion properties in an in vivo environment [15,16]. Accordingly, it becomes rather difficult to achieve this challenge as there is a limited number of alloying elements which can be safely metabolized by the body (e.g., Ca, Cu, Mn, Sr, among others) or elements that do not have adverse effects on the cytocompatibility [17]. It has been found that Ag has a positive impact on the mechanical properties in Zn-alloys, particularly on the alloy ultimate tensile strength (UTS) [18] as it promotes significant grain refinement. Moreover, the antibacterial action of silver has been confirmed [19] in stainless steel when coated with this element. Other advantages include the absence of adverse effects such as a daily human dietary silver intake with values of up to 27 µg/day [20]. Moreover, Mg forms eutectic constituents in the Zn-Mg system, which enables a fine tuning of the exhibited mechanical properties. The daily allowance values for Mg in Zn-alloys are relatively high (~700 µg [21]).
In the design of stents, the mechanical requirements are UTS > 300 MPa and elongation to failure > 15–18% [22]. Thus, in order to achieve optimal mechanical performance, extrusion after a solid solution treatment (ST) followed by aging [16] has been employed in order to achieve a desirable microstructure (i.e., precipitates homogeneously distributed along the matrix, segregation—free microstructures, grain refinement, etc.) for this type of applications. In this work, a novel Zn ternary alloy containing 12.5 wt. % Ag and 1 wt. % Mg, (Zn-12.5Ag-1Mg) is proposed for absorbable biomedical applications. For comparison purposes, pure Zn and a Zn-1 wt. % Mg were also considered. Both alloys were subjected to similar processing and testing conditions. Finally, their exhibited microstructures, precipitate evolution, as well as mechanical and corrosion properties were experimentally determined.

2. Experimental

2.1. Materials and Processing

In the present work, a Mg-Zn-Ag ternary alloy was chosen based on crystallographic and microstructural considerations [23]. The experimental alloys were cast from high purity Zn (99.99%), Ag (99.99%), and Mg (99.99%). The alloys were melted in a vacuum induction furnace under an argon (Ar) atmosphere. Care was taken to reduce Zn evaporation as much as possible by inducing an oxygen-free atmosphere. In order to avoid melt contamination, alumina crucibles were used for alloy casting in Cu-molds subject to water recirculation to attain a temperature of 25 °C, and thus achieve high solidification rates (Figure 1a).
Prior to melting, three gas evacuations reaching 1 Torr were carried out. An Ar gas was introduced for purging purposes inside the chamber furnace. Subsequently, the two alloy systems (Table 1) were brought to above 500 °C and 850 °C and poured at ~460 °C and ~770 °C, respectively. Melting was conducted at 12 kW input power for 5–7 min (depending on the alloy system). Figure 1a shows the Cu-mold containing a cylindrical perforation to rapidly solidified billets of 25 mm in diameter and ~70 mm in length (Figure 1b). Annealing was carried out in a Carbolite RHF 1600 furnace (Carbolite Inc., Hope Valley, UK) at 370 °C ± 2 °C for 3 and 5 h, respectively, followed by water quenching. A significant grain refinement was achieved by extruding all Zn-based alloy billets at 280 °C ± 5 °C in the form of 10 mm cylindrical rods (see Figure 1c).

2.2. Microstructural Characterization

Sections parallel to the extrusion direction of the cylindrical bars were metallographically prepared and chemically etched in a 5 vol. % HNO3 + ethanol for 10 to 60 s, depending on the alloy composition. High-resolution transmission electron microscopy (HRTEM), JEM ARM200F (Jeol Inc., Tokio, Japan); optical microscopy (OM, Olympus Corporation, Center Valley, PA, USA); and scanning electron microscopy (SEM, JSM JEOL7600F, Jeol Inc., Tokio, Japan) coupled with energy dispersive X-ray spectroscopy (EDS) and X-ray diffraction (XRD) in a SIEMENS D5000 diffractometer (Siemens Inc., Munich, Germany) were employed for microstructural characterization including phase identification. The TEM-foils were prepared using a Struers Tenupol 235 Twin Jet Electrolytic Polisher (Adv. Materialography Inc., Mammelzen, Germany) in a 30 vol. % HNO3 + 70 vol. % ethyl alcohol solution as electrolyte, whereas image analyses were carried out using a Gatan Microscopy Suite software platform (GMS, Gatan Inc., Pleasanton, CA, USA).

2.3. Mechanical Characterization

The exhibited mechanical properties were obtained from microhardness determinations and tensile testing following the ASTM E8-08-16a standard [24]. The extruded bars were tensile tested at a strain rate of 4.2 × 10⁻⁵ s−1 in an Instron 1125 machine (MTS Systems Corporation, Eden Prairie, MN, USA). Average and standard deviation of tensile properties were estimated based on three tests for each condition. Ten microhardness readings were taken for each sample using a Vickers hardness tester (THBRV –187.5V, Lab. Testing Technology, Zhejiang, China); the load used was 500 gf with a dwelling time of 15 s.

2.4. Corrosion Behavior

To determine the specimen’s corrosion rates, a transverse section of the extruded rods (Figure 1) were cut (1 cm of diameter). Surface preparation consisted of mechanical polishing from 80 to 1000 grit SiC paper, and the final mirror surface was achieved by using 50 nm alumina. Finally, all samples were degreased and dried with acetone and air (compressed), respectively. A typical three electrode cell was used to perform corrosion measurements. A saturated calomel electrode (SCE) was the reference electrode (Radiometer Analytical, Lyon, France), graphite rods were used as counter electrodes, and Zn-based specimens were the working electrodes. The exposed area of the working electrode was 1 cm2. In each condition, the tests were repeated 3 times to ensure reproducible and reliable results.
The electrochemical measurements were obtained using a BioLogic VSP—300 Potentiostat—Galvanostat (BioLogic Inc., Seyssinet-Pariset, France). The open circuit potential (OCP) was monitored for a duration of 7200 s. Potentiodynamic polarization (PP) measurements were carried out, using ±300 mV over the previously determined open circuit potential at a 0.166 mV·s−1 sweep. All the corrosion tests were conducted in a NaCl solution at physiological concentration to investigate the effect of Cl ions on the experimental alloys. The electrolyte was stirred and maintained at 37 ± 1 °C (body temperature) by a coil heater during all the duration of the test. The pH of the pseudo-physiological solution was adjusted to 7.4, by adding 1 M HCl or 1 M NaOH as required. The electrolyte was a physiological saline solution, prepared with 8.94 g of NaCl (Sigma Aldrich S5886—1 KG) in 1 L of nano-pure water as reported by Tolouei et al [25].
The Stern equation predicts that for E > Ecorr, the anodic reaction predominates and, for E < Ecorr, the cathodic reaction predominates. This is known as the Tafel approximation described in Equations (1) and (2):
log | i | E E c o r r β a + l o g I c o r r f o r   E E c o r r
log | i | E E c o r r β c + l o g I c o r r f o r   E E c o r r
To validate Tafel extrapolation, a general criterion was considered taken into consideration the following points; (1) at least one of the branches from the polarization curve must exhibit Tafel’s behavior, (2) extrapolation could be done at least 100 mV with respect to Ecorr. For each branch, and (3) at least one of the branches from polarization curves should be under polarization activation zone [26]. Additionally, extrapolation fitting was completed by EC–Lab software 11.3 (BioLogic Inc., Seyssinet-Pariset, France) to calculate the corrosion potential (Ecorr), corrosion current value (Icorr), and Tafel coefficients (βa and βc). Linear regression was done by using a log(|I|) vs. E representation.
Nelder and Mead Simplex method was used to find numerical parameters reducing the associated error between Icalc,i and Imeas,i by the next expression [26],
χ 2 = 1 N i = 1 N ( I m e a n s , i I c a l c , i ) 2 I m e a s , i + 10 9
Tafel corrosion current and corrosion rate (CR) in mm·year−1 was determined according to the ASTM G102-89—2015 [27].

3. Results and Discussion

3.1. Microstructural Characterization

Figure 2a,d displays optical micrographs of the as-cast condition for Zn-1Mg and Zn-12.5Ag-1Mg, respectively. Under the solidification conditions employed, a cooling rate of ~80 °C/s was achieved for the Zn-1Mg and ~3000 °C/s for the Zn-12.5Ag-1Mg alloy as estimated from the expression proposed by Jones [28], λ = −n (where λ = secondary dendrite arm spacing, B = alloy constant, ε = cooling rate K/s, and n = 1/3). These cooling rates gave rise to secondary dendrite arm spacings of ~25 µm for Zn-1Mg and ~6.5 µm for Zn-12.5Ag-1Mg, respectively. The resultant secondary dendrite arm spacing for the Zn-1Mg alloy indicate an appreciable refinement when compared with the value reported by Mostaed et al. of ~110 µm [29] for an alloy of similar composition. This clearly shows that increasing the solidification rates promotes appreciable grain refinement regardless of the amount of Mg additions. A similarly effect was found in the Zn-12.5Ag-1Mg by adding Ag and Mg under relatively high cooling rates.
The presence of a η-Zn matrix (see Figure 2b) corresponding to equiaxed dendrites in the Zn-1Mg alloy [18] was found to be surrounded by a very thin network of a eutectic microconstituent formed by η-Zn/Mg2Zn11 [30,31]. A maximum thickness of ~2.6 ηm was found for this eutectic as determined by EDS means (point C from Figure 2b,c). Figure 2d,e shows the presence of precipitates and intermetallic compounds formed during solidification of the Zn-12.5Ag-1Mg alloy (point H in Figure 2e,h). In this case, dendrites of the ε-AgZn3 phase were observed (point F in Figure 2e,f), in agreement with Liu et al. [18] and Sikora et al [32]. Moreover, a modified eutectic microconstituent containing Zn, Ag, and Mg was resolved see point G (Figure 2e–g).
Figure 3 shows the microstructural evolution of Zn-1Mg after the solution treatment (ST) at 370 °C for 3 h and 5 h (Figure 3a,b). Increasing holding times promoted grain growth to average diameters of ~280 µm and ~300 µm, respectively, including a coarse eutectic phase surrounding the grain boundaries. Increasing the grain size after 3 and 5 h of ST in the Zn-1Mg, the reduction is slight for Zn and Zn-1Mg and within experimental error. The reduction trend is clearer in the Zn-Ag-Mg alloy, however still within experimental error, as shown in Table 3 and Figure 9a.
The microstructural evolution of the Zn-12.5Ag-1Mg alloy after the ST did not exhibit appreciably grain growth after prolonged annealing times. Yet, dendrite dissolution occurred which favored the formation of new equiaxed grains uniformly dispersed throughout the alloy matrix (see Figure 3c,d). In addition, a relatively minor amount of intermetallic compounds were found after ST. Notice that there is an absence of eutectic constituent indicating several plausible phase transformations taking place after dissolution of the as-cast microstructure (see Figure 2d and Figure 3c,d).
SEM micrographs in the ST alloys after 5 h at 370 °C are shown in Figure 4. From these micrographs, it is possible to identify a high density of planar defects (e.g., twins), as well as, thickening of the interdendritic regions of the Zn-1Mg alloy (Figure 4a,b). The precipitation of three different phases was also identified from EDS microanalyses for the Zn-12.5Ag-1Mg alloy. In these case, the phases were a AgZn solid solution (medium gray, point D from Figure 4c,d); the ε-AgZn3 phase (light gray) in point E (Figure 4c–e) and a dark gray phase composed of Zn, Ag, and Mg elements corresponding to point (F) (Figure 4c,f).
Optical micrographs of the hot extruded specimens are shown in Figure 5a–c. From these micrographs (see Figure 5b), two microstructural features are disclosed: (a) one related to the alignment of planar defects and (b) a large amount of Mg-rich precipitates when compared with the conditions shown in either the as-cast or ST conditions (see Figure 2b and Figure 4b). Moreover, Zn-1Mg (Figure 5b) is confirmed by the η-Zn solid solution (matrix), and the presence of Mg4Zn7 precipitates can be observed distributed along all the microstructure.
Figure 5c shows some microstructural features found in the Zn-12.5Ag-1Mg alloy after extrusion. Notice the aligned deformation bands along the extrusion direction and the presence of uniformly distributed spherically-shaped precipitates. The chemical composition of three different phases was clearly resolved by EDS (see Figure 5d–g). These phases are the ε-AgZn3 phase (medium gray, point E of Figure 5d–e), a Mg-rich AgZn solid solution (light gray, point F in Figure 5d–f), and Mg-rich precipitates (dark gray, point G in Figure 5d–g). As the grain boundaries were not clearly distinguishable, the average grain size was determined with special care.
Further characterization using HRTEM revealed high-resolution microstructural details (Figure 6 and Figure 7). In particular, nanometric grains of ~10 nm diameter were found in two different phases (Figure 6a) with the light gray region corresponding to zone 1 consisting of a AgZn solid solution. From Figure 6b, it was plausible to identify the P m 3 ¯ m crystal structure, which corresponds to a cubic phase (Table 2). The zone axis found for this cubical phase was [001]. The crystal structure of the second zone (dark gray, Figure 6c) consisted of two crystalline microstructures, a hexagonal one ( P 63 / m m c ) embedded in a AgZn solid solution (see Table 2). The zone axes for the two phases were [1 2 ¯ 1 3 ¯ ] and [001], respectively.
Figure 7a shows round-shaped Ag0.15MgZn1.85 precipitates with an average diameter size of ~15 nm. These precipitates were dominant in the alloy extruded at 280 °C. Bright-field high-resolution investigations indicated that these precipitates contained some lattice distortions (white arrows), concentrated at the particle edges and the surroundings. Accordingly, semi-coherency between the hexagonal Ag0.15MgZn1.85 and the cubic AgZn solid solution was confirmed for these precipitates (see Figure 7b and Table 2). Finally, by indexing the fast Fourier transform (FFT), it was found that the zone axes for Ag0.15MgZn1.85 and AgZn solid solution were [011] and [01 1 ¯ 1], respectively. This included a misorientation angle associated with both, geometrically necessary boundaries and incidental dislocation boundaries [33] assisted by simultaneous severe plastic deformation. Moreover, a uniform distribution of precipitates is observed which combined with low and high angle boundaries [34] are expected to promote appreciable alloy strengthening effects in this ternary alloy.

3.2. XRD Characterization and Phase Identification

Figure 8 shows XRD patterns for the Zn-1Mg and Zn-12.5Ag-1Mg alloys subject to the different processing routes. In the extruded pure Zn (Figure 8a), intensity peaks corresponding to the η-Zn solid solution were found in agreement with Liu et al [18]. For the Zn-1Mg, new peaks appeared (Figure 8b) corresponding to Zn2Mg11 precipitation (Figure 2b,c), while the η-Zn phase peaks remained present. After the ST at 370 °C for 5 h, there were no new peaks related to other precipitates (Figure 8c), only morphological changes, as shown in Figure 3b and Figure 4a. After extrusion at 280°, new phase precipitation occurred as shown in Figure 8d. Notice the new reflections at 36.14°, 43.02°, and 54.07° corresponding to the Mg4Zn7 phase. In particular, extrusion processing induced precipitation due to plastic deformation and fracture of the eutectic microconstituent (Mg2Zn11, Figure 5b).
Figure 8e shows reflections from several phases related to the as-cast Zn-12.5Ag-1Mg alloy, including the η-Zn phase, a second solid solution composed by Ag and Zn with a cubic crystal structure ( P m 3 ¯ m ), and two hexagonal phases ( P 63 / m m c ), that is, ε-AgZn3 and Ag0.15MgZn1.85 (Figure 2e–h). After ST for 5 h, all the phases already found in the as-cast condition were preserved (Figure 8f), despite the morphological changes caused by the thermal treatment (Figure 3d and Figure 4c). The Ag0.15MgZn1.85 phase found after extrusion were identified as shown in Figure 8g. Notice that they have a spherical morphology (5d–g). Apparently, the implemented solution treatment and subsequent processing by alloy extrusion was not able to dissolve these hexagonal intermetallics. Therefore, in this case, the challenge in alloy design is to be able to maintain a highly uniform distribution of precipitates in the ternary alloys.
Under these conditions, the resultant alloys are expected to make a significant contribution to alloy toughness. Table 2 gives a summary of the phases identified each step of the way during the processing of the Zn-based alloys, including their corresponding crystallography and EDS.

3.3. Mechanical Properties

Table 3 and Table 4 show the exhibited mechanical properties of the experimental alloys. Moreover, Vickers hardness measurements and a bar diagram of the tensile properties for the Zn alloys are given in Figure 9a,b, including their fracture morphologies (see Figure 9c,d), where it is possible to observed a ductile behavior exhibited by the ternary alloy (Figure 9d), in comparison to the Zn-1Mg system (Figure 9c). After ST for 3 h at 370 °C, the Zn-12.5Ag-1Mg alloy hardness was 177.6 ± 9.8 HV and then 164.5 ± 8.1 HV after 5 h of holding time (see Table 3 and Figure 9a). As expected, increasing ST holding times increases the alloy ductility for the investigated compositions. The reduction in hardness values from 61.6 ± 4.0 HV to 33.4 ± 1.9 HV after extrusion for the Zn-1Mg alloy and from 164.5 ± 8.1 HV to 151.5 ± 4.8 HV for the Zn-12.5Ag-1Mg can be related to further precipitate coarsening events with time at temperature (Table 3, Figure 9a).
From the experimental outcome, true stress–strain curves were plotted and then used for the determination of work hardening power-law exponents, n, for the Zn-12.5Ag-1Mg alloy [35] (Figure 10a,b). The resultant strength and ductility values, as well as those reported in the literature for alloys of similar composition, are given in Figure 11. In the present work, tensile properties for the Zn-1Mg alloy were found that are comparable with the ones reported by Mostaed et al. and Gong et al., [28,36]. Even though, in this work the ST was carried out at a relatively high temperature (370 °C) in order to minimize holding times (5 h max.). This together, with a slightly high extrusion temperature (280 °C) brought about a notable reduction in yield strength (YS) (80 MPa) and UTS (152 MPa) values (see Figure 11). Surprisingly, the elongation to fracture remained relatively high, near 11% (Figure 9b).
Regarding the Zn-12.5Ag-1Mg alloy, for comparison purposes there are only a few ternary or quaternary systems proposed as absorbable materials [15,16]. The main reason for this is the increasing system complexity when additional elements are introduced to improve the mechanical performance. In this sense, Mg additions to Zn alloys are desirable in order to provide superior mechanical properties together with a high level of cytocompatibility [36]. In a previous work, two Zn-based ternary alloys, Zn-1Mg-1Ca and Zn-1Mg-1Sr [37], were investigated. Both alloys had a relatively small difference in YS and UTS values (205 MPa and 201 MPa, and 257 MPa and 253 MPa, respectively). Nevertheless, these alloys were relatively brittle with elongation values of 7.4% and 5.3% respectively. Additionally, a Zn-3Cu-1Mg alloy system was explored with relatively high YS and UTS values of 427 MPa and 441 MPa, respectively [38]. Surprisingly, the alloy elongation was extremely low (0.9%). This lack of enough ductility was attributed to the development of Mg2Zn11 brittle intermetallics [38]. Therefore, Mg additions are expected to improve tensile strength at expenses of alloy ductility. In this work, the mechanical properties of the investigated alloys greatly exceed the ones reported by Liu et al., [37]. In addition, the alloy possesses an outstanding elongation to failure of 21% (see Table 4 and Figure 11). As for the role of Ag additions combined with extrusion processing, the experimental outcome indicates that this is an effective method to achieve appreciable grain refinement. As a result, alloy ductility and strength are significantly improved (see Table 4).
The development of Mg2Zn11 or MgZn2 intermetallics was not detected in the extruded condition. This in contrast with published reports for alloy systems with Mg additions [36,39,40]. Another factor which has a strong influence on the precipitation sequence is the ST temperature. This temperature should be high enough in order to achieve total precipitate and dendrite dissolution. In turn, this has a determinant effect on the exhibited mechanical properties. Table 3 shows the effect of various annealing times for the investigated alloys showing in general a decreasing trend in alloy strength with increasing times.
As for the work hardening properties of the Zn-base ternary alloy (Figure 10), in the investigated Zn-12.5Ag-1Mg alloy after extrusion, the initial n value is 0.37. Nevertheless, from the log(σ) − log(ε) relationship (Figure 10a), an inflection point on this curve is found at log (ε) = − 1.3. Therefore, two values of work hardening exponent are obtained that is 0.37 and 0.76. The exhibited work hardening properties can be explained by considering the alloy microstructural features. From Figure 6a, the presence of two different phases was already disclosed by TEM means. A ductile AgZn solid solution was identified (Figure 6b), and the presence of ε-AgZn3 hexagonal phase nanometric crystallites embedded in a cubic AgZn solid solution (Figure 6c). Therefore, during deformation, at relatively low strains, dislocation motion encounters relatively significant opposition provided by the solid solution phase, and soft-precipitates, grain boundaries, including coherent nano-phases (regions holding AgZn cubic solid solution grains). Yet at increasing strain, other hard phases become dominant, dislocation obstacles leading to an increase in the alloy work hardening.

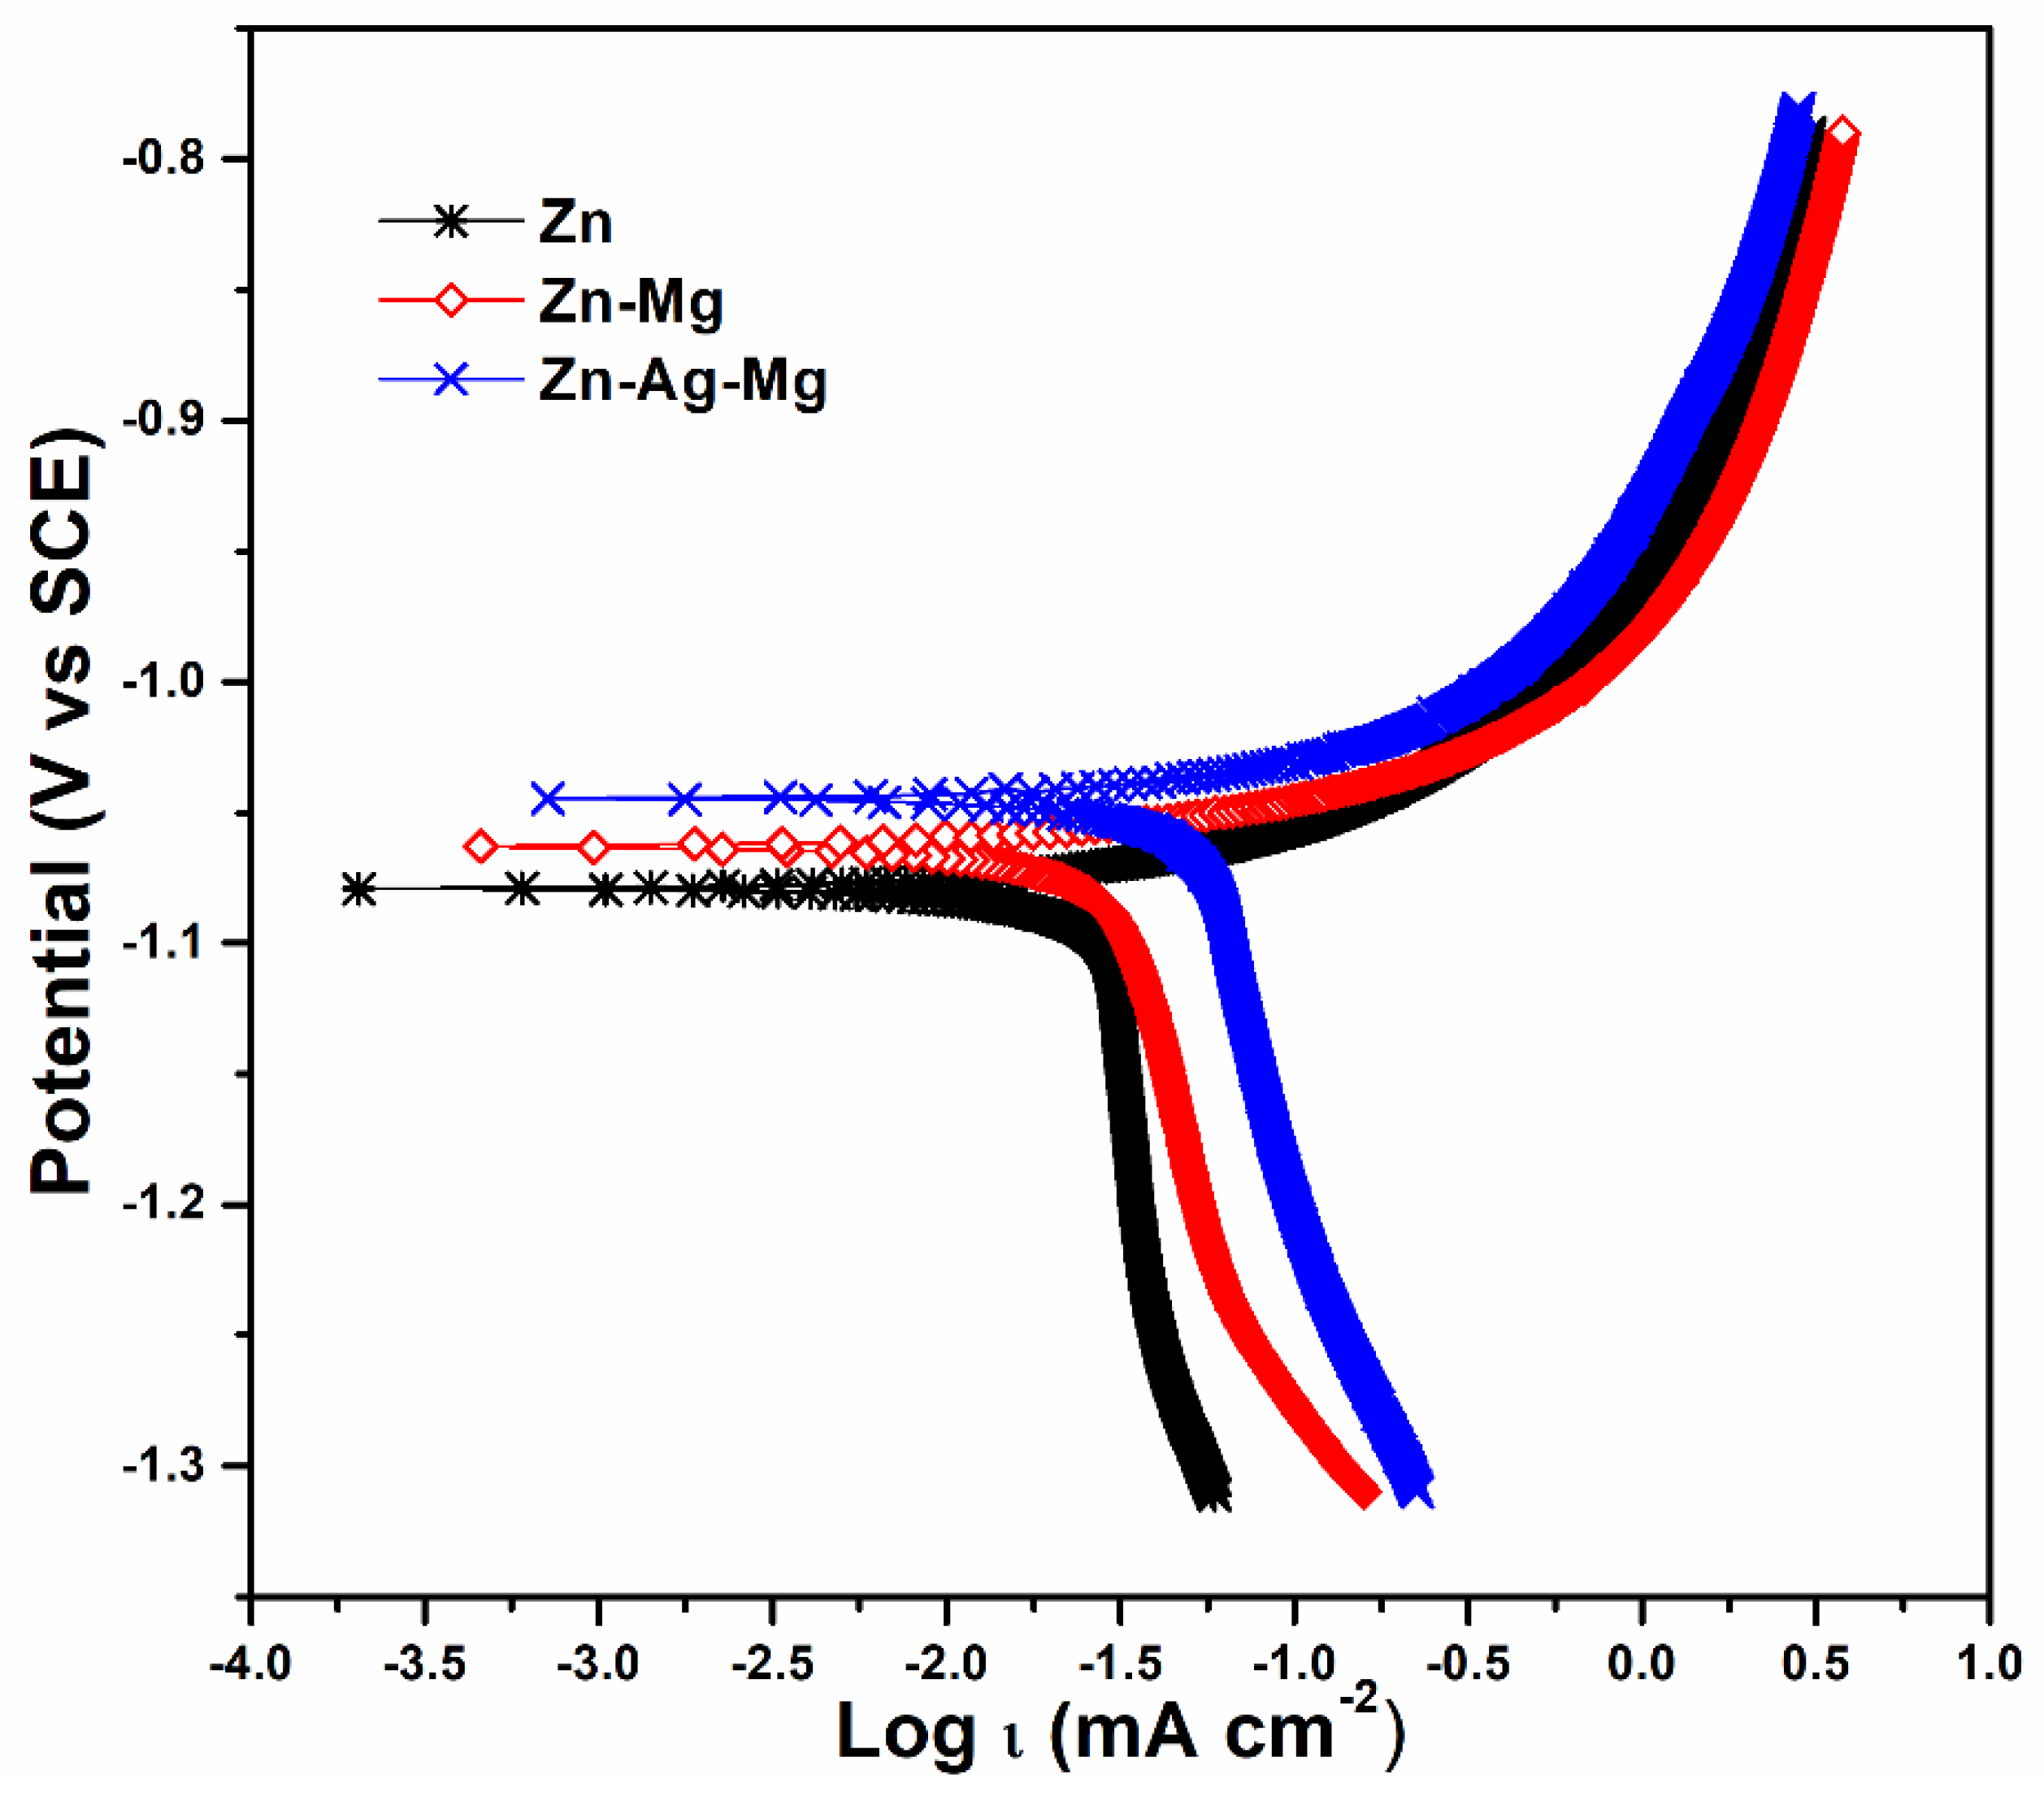
3.4. Corrosion Behavior

Potentiodynamic tests carried out in Zn-12.5Ag-1Mg, Zn-1Mg, and Zn in NaCl indicated a decreases cathodic reaction by modifications mixed potential towards more negative values compared to “pure zinc” (SCEs = −1.044 V, −1.056 V, and −1.092) with alloying additions. In turn, this indicated that the metal–electrolyte interface was increasingly active when Ag was added as alloying element. Regarding to hydrogen evolution, all the specimens exhibited a current limit in the cathodic zone of the curve. In particular, it is found that this current limit tends to increase as the amount of alloying elements (Ag and Mg) is increased and as a result there is increasing metallic dissolution.
Tafel extrapolation was implemented to the polarization curves in order to investigate the corrosion phenomena undergone in the Zn-based alloys.
From Figure 12, anodic branches were used to perform Tafel analysis due it was observed a current limit typical of hydrogen formation in the cathodic zone. This current increases with the presence of alloy elements (such as An or Mg) and modify the cathodic response. To prevent calculation errors related to the aforementioned observations, the corrosion potential and corrosion current density were calculated using the anodic zone with a properly adjustment.
From the anodic slopes, electrochemical parameters were estimated, and the measured current densities are summarized in Table 5. Notice that the anodic slopes corresponding to pure Zn, Zn-1Mg and Zn-12.5Ag-1Mg are 0.167 V/SCE, 0.129 V/SCE, and 0.107 V/SCE, respectively (Figure 12). A comparison of the Icorr values (Table 5) shows that pure Zn has the lowest oxidation rates. In contrast, the Zn-12.5Ag-1Mg alloy exhibits an increment in the corrosion rate with a drop in the magnitude of the anodic slope.
As mentioned in the past section, Mg2Zn11 intermetallics were not found in the extruded Zn-1Mg specimens. In contrast, both Mg4Zn7 and Mg0.971Zn0.029 precipitates were detected as evidenced in Figure 8d. These precipitates are known to be highly corrosion resistant when compared with the matrix, so they act as cathodic spots which accelerate the corrosion rates of the surrounding matrix. Overall, the corrosion rate of the Zn-1Mg alloy increases, attaining a value of 0.683 mm·year−1 in comparison with 0.525 mm·year−1 for pure Zn. An even faster corrosion rate is achieved by adding Ag, reaching values of up to 1.251 mm·year−1 (see Table 5), in agreement with the work of Sikora-Jasinska et al., [31].
The surface corrosion morphologies found in Zn-1Mg and Zn-12.5Ag-1Mg are shown in Figure 13. Notice the degradation product layer found on the surface of the Zn-1Mg alloy. The layer was quite uniform and generally adherent to the surface; some craters were found on the degraded surface, showing the underneath base material. XRD phase identification of the corroded specimens for all Zn-based alloys and its corrosion products are shown in Figure 14.
From Figure 13a, preferential attack corrosion was found in the Zn-1Mg alloy, where degradation zones are distinctly visible. Notice that Mg-rich precipitates (Table 2) were found in discrete sites. Moreover, Mg4Zn7 phase is extremely resistant to corrosion due to their electrochemical stability, which favors sites where corrosion morphology is not uniform (Figure 13b).
For the ternary alloy Zn-12.5Ag-Mg (Figure 13c), it can be observed a different corrosion mechanism with respect to Zn-1Mg alloy, exhibiting a surface covered by cracks. This degradation is slightly favored along the grain boundaries where a combination of the ε-AgZn3 and Ag0.15MgZn1.85 is observed. Therefore, when Ag is added as an alloying element, a galvanic cell corrosion is preferential (Figure 13d). Consequently, all grain boundaries act as an anode with respect to the matrix, facilitating, in thermodynamic terms, localized potential differences, which create a micro-galvanic cell mechanism.
Diffraction analyses carried out on the surface of the corroded specimens confirmed the presence of Zn, ZnO, and Zn(OH)2 in pure Zn (Figure 14a), in agreement with Bowen et al. [22] and Zheng et al. [4]. In the Zn-1Mg alloy similar degradation products were found (Figure 13a), including Mg0.97, Zn0.029, and Mg4Zn7 intermetallics (see Figure 14b). These intermetallic compounds possess a relatively high corrosion resistance, thus causing rapid and local erosion.
Figure 14c corresponds to XRD pattern of the corroded Zn-12.5Ag-1Mg surface alloy. In this alloy, corrosion products such Zn0.15MgZn1.85; ε-AgZn3; and ZnO, ZnO, and Zn(OH)2 were detected. Consequently, plausible dissolution–passivation mechanisms in the investigated alloys can be identified according to the following reactions.
Zn oxidation reaction sequence:
Zn ( OH ) 4 2   Zn ( OH ) 2 + 2 OH  
Zn ( OH ) 2   ZnO + H 2 O
Formation of a pseudo-passive layer, dissolution in the physiological solution and local solution acidification.
Zn 2 + + 2 Cl   ZnCl 2
ZnCl 2 + 2 H 2 O   Zn ( OH ) 2 + 2 HCl  
As the corrosion reaction advances ZnO is generated, the presence of ε-AgZn3 and Zn0.15MgZn1.85 prevents the formation of a homogeneous passive film on the surface. Moreover, the grain boundaries, which are preferential sites for a eutectic transformation, play a role in the corrosion mechanism. In turn, this results in a surface morphology highly homogeneous, consistent with the cell micro-galvanic effects originated as a result of the potential difference between Zn and ε-AgZn3 and the oxygen-silver affinity.

4. Conclusions

A novel Zn-12.5Ag-1Mg absorbable alloy was investigated for potential biomedical applications. Microstructural, mechanical, and corrosion properties were compared with those of pure Zn and a Zn-1Mg alloy, all exposed to similar processing routes. The outcome of the present work can be summarized as follows.
  • High solidification rates, typical of chill casting, promoted appreciable dendrite refinement and a uniform solute distribution all the way to the extrusion process.
  • A solution treatment (ST) became a critical step process prior to extrusion: A ST temperature of 370 °C for 5 h enabled the dissolution of some phases while promoting more stable ones in the Zn-12.5Ag-1Mg alloy so that a good compromise between hardness and ductility was found.
  • After extrusion, the development of an AgZn solid solution, combined with the precipitation of the ε-AgZn3 phase, and Mg-rich precipitates embedded in a η-Zn matrix formed a complex microstructure. This complex phase microstructure lead to the improvements exhibited in the mechanical properties of the Zn-12.5Ag-1Mg alloy.
  • In the Zn-12.5Ag-1Mg alloy, two work hardening mechanisms were active as evidenced by the n exponents, that is, n ≈ 0.37 for log(ε) < −1.3 and n ≈ 0.76 for log(ε) > −1.3. Apparently, at low strains, dislocation motion is relatively easy without significant opposition, yet at increasing strain, other obstacles become active, probable intermetallic second phases. Additionally, the grain refinement observed in the Zn-12.5Ag-1Mg alloy together with the presence of a cubic phase embedded into its matrix provided an important increment on its ductility.
  • Alloying additions of Ag and Mg in the right amounts can provide an optimal combination of properties for a good balance between strength and corrosion behavior. This is evident from the outcome of the present work, particularly notice the degradation rate increment exhibited by the Zn-12.5Ag-1Mg alloy (CR = 1.25 mm/year) when compared with either pure Zn (CR = 0.53 mm/year) or Zn-1Mg alloy (CR = 0.683 mm/year) in the extruded condition.
From the experimental outcome, the proposed Zn12.5Ag1Mg ternary absorbable alloy is found to be an excellent candidate to be considered for cardiovascular applications.

Author Contributions

Investigation, A.L.R.–L.; methodology, P.R.–B.; formal analysis, C.P.; validation, R.C.; writing review and editing, H.L.; funding, D.M.; project administration, M.V. All authors have read and agreed to the published version of the manuscript.

Funding

This research was funded by Programa de Apoyo a Proyectos de Investigación e Innovación Tecnológica (PAPIIT–TA101520) and the Natural Science and Engineering Research Council of Canada.

Acknowledgments

The authors gratefully acknowledge the technical support from Guillermina González–Mancera.

Conflicts of Interest

The authors declare no conflicts of interest.

References

  1. Han, H.-S.; Loffredo, S.; Jun, I.; Edwards, J.; Kim, Y.-C.; Seok, H.-K.; Witte, F.; Mantovani, D.; Glyn-Jones, S. Current status and outlook on the clinical translation of biodegradable metals. Mater. Today 2019, 23, 57–71. [Google Scholar] [CrossRef]
  2. Chen, Y.; Xu, Z.; Smith, C.; Sankar, J. Recent advances on the development of magnesium alloys for biodegradable implants. Acta Biomater. 2014, 10, 4561–4573. [Google Scholar] [CrossRef] [PubMed]
  3. Liu, B.; Zheng, Y.F. Effects of alloying elements (Mn, Co, Al, W, Sn, B, C and S) on biodegradability and in vitro biocompatibility of pure iron. Acta Biomater. 2011, 7, 1407–1420. [Google Scholar] [CrossRef] [PubMed]
  4. Zheng, Y.F.; Gu, X.N.; Witte, F. Biodegradable metals. Mater. Sci. Eng. R 2014, 77, 1–34. [Google Scholar] [CrossRef]
  5. Peuster, M.; Wohlsein, P.; Brügmann, M.; Ehlerding, M.; Seidler, K.; Fink, C.; Fischer, A.; Hausdorf, G. A novel approach to temporary stenting: Degradable cardiovascular stents produced from corrodible metal—Results 6–18 months after implantation into New Zealand white rabbits. Heart 2001, 86, 563–569. [Google Scholar] [CrossRef] [PubMed] [Green Version]
  6. Hermawan, H. Updates on the research and development of absorbable metals for biomedical applications. Prog. Biomater. 2018, 7, 93–110. [Google Scholar] [CrossRef] [Green Version]
  7. Cheng, J.; Liu, B.; Wu, Y.H.; Zheng, Y.F. Comparative in vitro study on pure metals (Fe, Mn, Mg, Zn and W) as biodegradable metals. J. Mater. Sci. Technol. 2013, 29, 619–627. [Google Scholar] [CrossRef]
  8. McCall, K.A.; Huang, C.; Fierke, C.A. Zinc and health: Current status and future directions. J. Nutr. 2000, 22, 1437–1446. [Google Scholar] [CrossRef] [Green Version]
  9. Lastra, M.D.; Pastelin, R.; Camacho, A.; Monroy, B.; Aguilar, A.E. Zinc intervention on macrophages and lymphocytes response. J. Trace Elem. Med. Biol. 2001, 15, 5–10. [Google Scholar] [CrossRef]
  10. Saltman, P.D.; Strause, L.G. The role of trace minerals in osteoporosis. J. Am. Coll. Nutr. 1993, 12, 384–389. [Google Scholar] [CrossRef] [PubMed]
  11. Bowen, P.K.; Shearier, E.R.; Zhao, S.; Guillory II, R.J.; Zhao, F.; Goldman, J.; Drelich, J.W. Biodegradable metals for cardiovascular stents: From clinical concerns to recent Zn-alloys. Adv. Healthc. Mater. 2016, 5, 1121–1140. [Google Scholar] [CrossRef] [PubMed] [Green Version]
  12. Yang, H.; Wang, C.; Liu, C.; Chen, H.; Wu, Y.; Han, J.; Jia, Z.; Lin, W.; Zhang, D.; Li, W.; et al. Evolution of the degradation mechanism of pure zinc stent in the one-year study of rabbit abdominal aorta model. Biomaterials 2017, 145, 92–105. [Google Scholar] [CrossRef] [PubMed]
  13. Plum, L.M.; Rink, L.; Haase, H. The essential toxin: Impact of zinc on human health. Int. J. Environ. Res. Public. Health 2010, 7, 1342–1365. [Google Scholar] [CrossRef] [PubMed] [Green Version]
  14. Trumbo, P.; Yates, A.A.; Schlicker, S.; Poos, M. Dietary reference intakes: Vitamin a, vitamin k, arsenic, boron, chromium, copper, iodine, iron, manganese, molybdenum, nickel, silicon, vanadium, and zinc. J. Am. Diet. Assoc. 2001, 101, 294–301. [Google Scholar] [CrossRef]
  15. Mostaed, E.; Sikora-Jasinska, M.; Drelich, J.W.; Vedani, M. Zinc-based alloys for degradable vascular stent applications. Acta Biomater. 2018, 71, 1–23. [Google Scholar] [CrossRef]
  16. Venezuela, J.; Dargusch, M.S. The influence of alloying and fabrication techniques on the mechanical properties, biodegradability and biocompatibility of zinc: A comprehensive review. Acta Biomater. 2019, 87, 1–40. [Google Scholar] [CrossRef] [Green Version]
  17. Fraga, C.G. Relevance, essentiality and toxicity of trace elements in human health. Mol. Asp. Med. 2005, 26, 235–244. [Google Scholar] [CrossRef]
  18. Liu, Z.; Qiu, D.; Wang, F.; Taylor, J.A.; Zhang, M. The grain refinement mechanism of cast zinc through silver inoculation. Acta Mater. 2014, 79, 315–326. [Google Scholar] [CrossRef]
  19. Shao, W.; Zhao, Q. Influence of reducers on nanostructure and surface energy of silver coatings and bacterial adhesion. Surf. Coat. Technol. 2010, 204, 1288–1294. [Google Scholar] [CrossRef]
  20. Hadrup, N.; Lam, H.R. Oral toxicity of silver ions, silver nanoparticles and colloidal silver—A review. Regul. Toxicol. Pharm. 2014, 68, 1–7. [Google Scholar] [CrossRef]
  21. King, D.E.; Mainous, A.G., III; Geesey, M.E.; Woolson, R.F. Dietary magnesium and C-reactive protein levels. J. Am. Coll. Nutr. 2005, 24, 166–171. [Google Scholar] [CrossRef] [PubMed]
  22. Bowen, P.K.; Drelich, J.; Goldman, J. Zinc exhibits ideal physiological corrosion behavior for bioabsorbable stents. Adv. Mater. 2013, 25, 2577–2582. [Google Scholar] [CrossRef] [PubMed]
  23. Wang, J.; Zhang, Y.-N.; Hudon, P.; Jung, I.-H.; Medraj, M.; Chartrand, P. Experimental study of the phase equilibria in the Mg-Zn-Ag ternary system at 300 °C. J. Alloy. Compd. 2015, 639, 593–601. [Google Scholar] [CrossRef]
  24. ASTM E8–08–16a. Test Methods for Tension Testing of Metallic Materials; Annual Book of ASTM Standards; ASTM International: West Conshohocken, PA, USA, 2008. [Google Scholar]
  25. Tolouei, R.; Harrison, J.; Paternoster, C.; Turgeon, S.; Chevallier, P.; Mantovani, D. The use of multiple pseudo-physiological solutions to simulate the degradation behaviour of pure iron as a metallic resorbable implant: A surface-characterization study. Phys. Chem. Chem. Phys. 2016, 18, 19637–19646. [Google Scholar] [CrossRef] [PubMed]
  26. Press, W.H.; Teukolsky, S.A.; Vetterling, W.T.; Flannery, B.P. Numerical Recipes in C, 2nd ed.; Cambridge University Press: Cambridge, UK, 1992; Volume 10.4, pp. 408–412. [Google Scholar]
  27. ASTM G102-89(2015) e1. Standard Practice for Calculation of Corrosion Rates and Related Information from Electrochemical Measurements; ASTM International: West Conshohocken, PA, USA, 2015. [Google Scholar]
  28. Jones, H. The status of rapid solidification of alloys in research and application. J. Mater. Sci. 1984, 19, 1043–1076. [Google Scholar] [CrossRef]
  29. Mostaed, E.; Sikora-Jasinska, M.; Mostaed, A.; Loffredo, S.; Demir, A.G.; Previtali, B.; Mantovani, D.; Bealand, R.; Vedani, M. Novel Zn-based alloys for biodegradable stent applications: Design, development and in vitro degradation. J. Mech. Behav. Biomed. Mater. 2016, 60, 581–602. [Google Scholar] [CrossRef]
  30. Shen, C.; Liu, X.; Fan, B.; Lan, P.; Zhou, F.; Li, X.; Wang, H.; Xiao, X.; Li, L.; Zhao, S.; et al. Mechanical properties, in vitro degradation behaviour, hemocompatibility and cytotoxicity evaluation of Zn-1.2 Mg alloy for biodegradable implants. RSC Adv. 2016, 6, 86410–86419. [Google Scholar] [CrossRef]
  31. Vojtěch, D.; Kubásek, J.; Šerák, J.; Novák, P. Mechanical and corrosion properties of newly developed biodegradable Zn-based alloys for bone fixation. Acta Biomater. 2011, 7, 3515–3522. [Google Scholar] [CrossRef]
  32. Sikora-Jasinska, M.; Mostaed, E.; Mostaed, A.; Bealand, R.; Mantovani, D.; Vedani, M. Fabrication, mechanical properties and in vitro degradation behaviour of newly developed Zn-Ag alloys for degradable implant applications. Mater. Sci. Eng. C 2017, 77, 1170–1181. [Google Scholar] [CrossRef]
  33. Hughes, D.A.; Hansen, N.; Bammann, D.J. Geometrically necessary boundaries, incidental dislocation boundaries and geometrically necessary dislocations. Scr. Mater. 2003, 48, 147–153. [Google Scholar] [CrossRef]
  34. Chrominski, W.; Lewandowska, M. Precipitation phenomena in ultrafine grained Al-Mg-Si alloy with heterogeneous microstructure. Acta Mater. 2016, 103, 547–557. [Google Scholar] [CrossRef]
  35. Sun, S.; Ren, Y.; Wang, L.; Yang, B.; Li, H.; Qin, G. Abnormal effect of Mn addition on the mechanical properties of as-extruded Zn alloys. Mater. Sci. Eng. A 2017, 701, 129–133. [Google Scholar] [CrossRef]
  36. Gong, H.; Wang, K.; Strich, R.; Zhou, J.G. In vitro biodegradation behavior, mechanical properties, and cytotoxicity of biodegradable Zn–Mg alloy. J. Biomed. Mater. Res. B 2015, 103, 1632–1640. [Google Scholar] [CrossRef] [PubMed] [Green Version]
  37. Liu, X.; Sun, J.; Qiu, K.; Yang, Y.; Pu, Z.; Li, L.; Zheng, Y. Effects of alloying elements (Ca and Sr) on microstructure, mechanical property and in vitro corrosion behavior of biodegradable Zn-1.5Mg alloy. J. Alloy. Compd. 2016, 664, 444–452. [Google Scholar] [CrossRef]
  38. Tang, Z.; Huang, H.; Niu, J.; Zhang, L.; Zhang, H.; Pei, J.; Tan, J.; Yuan, G. Design and characterizations of novel biodegradable Zn-Cu-Mg alloys for potential biodegradable implants. Mater. Des. 2017, 117, 84–94. [Google Scholar] [CrossRef]
  39. Zhu, D.; Su, Y.; Young, M.L.; Ma, J.; Zheng, Y.; Tang, L. Biological responses and mechanisms of human bone marrow mesenchymal stem cells to Zn and Mg biomaterials. ACS Appl. Mater. Interfaces 2017, 9, 27453–27461. [Google Scholar] [CrossRef]
  40. Liu, X.; Sun, J.; Zhou, F.; Yang, Y.; Chang, R.; Qiu, K.; Pu, Z.; Li, L.; Zheng, Y. Micro-alloying with Mn in Zn-Mg alloy for future biodegradable metals application. Mater. Des. 2016, 94, 95–104. [Google Scholar] [CrossRef]
Figure 1. (a) Cu-mold coupled with a water cooling system, (b) a typical billet in the as-cast condition after machining for the removal of the oxidized external layer, and (c) a typical rod in the as-extruded condition.
Metals 10 00586 g001
Figure 2. (a) Zn–1Mg optical micrograph in the as-cast condition; (b) Zn-1Mg SEM micrograph; (c) energy dispersive X-ray spectroscopy (EDS) spectrum; (d) Zn-12.5Ag-1Mg optical micrograph in the as-cast condition; (e) Zn-12.5Ag-1Mg SEM micrograph; (fh) EDS spectrum.
Metals 10 00586 g002
Figure 3. Optical microscopy of ST at 370 °C of (a) Zn-1Mg after 3 h and (b) 5 h, and (c) Zn-12.5Ag-1Mg after 3 h and (d) 5 h.
Metals 10 00586 g003
Figure 4. SEM micrograph of (a) Zn-1Mg after ST at 370 °C for 5 h; (b) EDS spectrum of the Mg2Zn11 microconstituent; (c) SEM micrograph of Zn-12.5Ag-1Mg after ST at 370 °C for 5 h: (df) EDS spectrums corresponding to points D, E, and F.
Metals 10 00586 g004
Figure 5. Optical and SEM micrographs of the extruded condition of (a,b) Zn-1Mg alloy; (c,d) Zn-12.5Ag-1Mg alloy, respectively; (eg) EDS spectra corresponding to points E, F, and G from Figure 5d.
Metals 10 00586 g005
Figure 6. HRTEM micrograph of the extruded Zn-12.5Ag-1Mg alloy: (a) bright-field image showing nanometric grains with different atomic orientations; FTTs patterns of (b) Zone 1 and (c) Zone 2.
Metals 10 00586 g006
Figure 7. HRTEM micrograph of the extruded Zn-12.5Ag-1Mg alloy: (a) bright-field image showing an Ag0.15MgZn1.85 precipitated in an AgZn matrix and (b) the corresponding FTT.
Metals 10 00586 g007
Figure 8. XRD diffraction patterns showing processing phase evolution of the Zn-based alloys: (a) pure Zn as-extruded at 280 °C; (b) Zn-1Mg as-cast; (c) Zn-1Mg ST for 5 h at 370 °C; (d) Zn-1Mg as-extruded at 280 °C; (e) Zn-12.5Ag-1Mg as-cast; (f) Zn-12.5Ag-1Mg ST for 5 h at 370 °C; (g) Zn-12.5Ag-1Mg as-extruded at 280 °C.
Metals 10 00586 g008
Figure 9. (a) Microhardness measurements (HV) of the investigated alloys; (b) tensile properties of the extruded alloys at room temperature; (c,d) SEM fractographies of the extruded alloys (Zn-1Mg and Zn-12.5Ag-1Mg, respectively).
Metals 10 00586 g009
Figure 10. (a) Work hardening exponents calculated from engineering tensile curves for Zn-based alloys; (b) True stress vs. true strain curve of Zn-based alloys tested at the strain rate of 4.2 × 10⁻⁵ s−1.
Metals 10 00586 g010
Figure 11. UTS: elongation to failure comparison of the investigated Zn-based alloys.
Metals 10 00586 g011
Figure 12. Polarization curves of the extruded alloys exposed to the NaCl solution at physiological concentration (T = 37 °C and pH = 7.4).
Metals 10 00586 g012
Figure 13. SEM micrographs of corroded samples after potentiodynamic testing: (a) a Zn-1Mg alloy corroded surface; (b) higher magnification showing degradation products on the surface; (c) general view of Zn-12.5Ag-1Mg corroded surface; and (d) detail of corrosion behavior along grain boundaries.
Metals 10 00586 g013
Figure 14. XRD patterns of the as-extruded specimens after potentiodynamic testing in a NaCl solution at 37 °C, pH = 7.4: (a) pure Zn, (b) Zn-1Mg alloy, and(c) Zn-12.5Ag-1Mg alloy.
Metals 10 00586 g014
Table 1. Nominal compositions (weight %) of the investigated alloys.
MaterialComposition (wt. %)
ZnAgMg
Zn100--
Zn-1.0Mg99-1
Zn-12.5Ag-1.0Mg86.512.51
Table 2. Summary table of EDS and XRD results for pure Zn, Zn-1Mg, and Zn-12.5Ag-1Mg alloys with different processing conditions.
HeadingConditionFound PhasesReference SEM Pictures, EDS SpectrumXRD Attribution
Zn-1MgAs-castH-Zn solid solution- P 63 / m m c (hexagonal phase) ⚫
H-Zn-Mg2Zn11
(eutectic constituent)
Point (c), Figure 2b,c P 63 / m m c ⚫ + P m 3 ¯ (cubic phase)
STη-Zn solid solution- P 63 / m m c (hexagonal phase) ⚫
η-Zn-Mg2Zn11
(eutectic constituent)
Point (b), Figure 4a,b P 63 / m m c ⚫ + P m 3 ¯ (cubic phase)
Extrudedη-Zn solid solution- P 63 / m m c (hexagonal phase) ⚫
Mg4Zn7 precipitates- C 12 / m 1   (monoclinic phase)
Mg0.971Zn0.029 intermetallic compound- P 63 / m m c (hexagonal phase) 🟄
Zn-12.5Ag1MgAs-castη-Zn solid solution- P 63 / m m c (hexagonal phase) ⚫
ε-AgZn3 phasePoint (f), Figure 2e,f P 63 / m m c (hexagonal phase)
η-Zn solid solution + AgZn solid solution with Mg enrichment
(modified eutectic)
Point (g), Figure 2e,g P 63 / m m c ⚫ + P m 3 ¯ m (cubic phase)
Ag0.15MgZn1.85
Mg-rich intermetallic compound
Point (h), Figure 2e,h P 63 / m m c (hexagonal phase)
STη-Zn solid solution- P 63 / m m c (hexagonal phase) ⚫
η-Zn solid solution + AgZn solid solutionPoint (d), Figure 4c,d P 63 / m m c ⚫ + P m 3 ¯ m (cubic phase)
ε-AgZn3 phasePoint (e), Figure 4c,e P 63 / m m c (hexagonal phase)
Ag0.15MgZn1.85
Mg-rich intermetallic compound
Point (f), Figure 4c,f P 63 / m m c (hexagonal phase)
Extrudedη-Zn solid solution- P 63 / m m c (hexagonal phase) ⚫
ε-AgZn3 phasePoint (e), Figure 5d,e P 63 / m m c (hexagonal phase) ★
η-Zn solid solution + AgZn solid solutionPoint (f), Figure 5d,f P 63 / m m c ⚫ + P m 3 ¯ m (cubic phase) ◆
Ag0.15MgZn1.85
Mg-rich intermetallic compound
Point (g), Figure 5d,g P 63 / m m c (hexagonal phase)
Table 3. Microhardness (HV) measurements of the alloys for different conditions.
SpecimenAs-cast3 h at 370 °C5 h at 370 °CExtruded at 280 °C
Zn30.0 ± 2.829.5 ± 1.429.2 ± 1.250.7 ± 2.8
Zn–1Mg55.4 ± 1.966. 6 ± 5.661.6 ± 4.033.4 ± 1.9
Zn–12.5Ag–1Mg127.6 ± 5.0177.6 ± 9.8164.5 ± 8.1151.5 ± 4.8
Table 4. Mechanical properties and strain hardening exponent, n, of the investigated alloys.
SpecimennYS
(MPa)
UTS
(MPa)
Elongation
(%)
Zn0.2342 ± 475 ± 471 ± 6
Zn-1Mg0.3380 ± 4152 ± 611 ± 3
Zn-12.5Ag-1Mg0.37(1), 0.76(2)64 ± 4305 ± 1721 ± 3
n(1) = 0.37 and n(2) = 0.76 from Figure 10a.
Table 5. Summary of corrosion data obtained from potentiodynamic polarization tests for the extruded specimens.
SpecimenOCP (V) vs. SCEba
(V)
Icorr
(µA cm−2)
Corrosion Rate
(mm year−1)
X2
Zn−1.090.16735.10.538.90 × 10−4
Zn-1Mg−1.060.12944.20.682.53 × 10−4
Zn-12.5Ag-1Mg−1.040.10778.51.251.70 × 10−4

