Abstract
Magnesium is a highly desired material for multiple applications including automotive, aircraft, and biomedical components due to its high strength to weight ratio, non-toxicity, and its good machinability. The main drawback of magnesium use is its poor resistance to corrosion. The goal of this experiment was to determine the effect of surface roughening treatments on the rate of corrosion and to characterize the resultant magnesium oxide (MgO) and brucite (Mg(OH)2) corrosion products. Three samples of AZ31 alloy with varying initial surface roughness were exposed to simulated marine conditions using a salt fog chamber for 672 h. The salt fog experiments used a 3.5 wt.% NaCl solution and were conducted in accordance with the ASTM B117 test protocols. One sample was tested in an as-received state, served as the control, another sample was roughened using a grit blaster, and another was polished to a mirror finish. Formed oxide scales were characterized using scanning electron microscopy, X-ray diffraction, and energy dispersive spectroscopy. The samples with a higher roughness underwent the severest corrosion and ensuing formation of the thickest oxide layers. The results indicate that the initial surface roughness has a profound effect on the resulting severity of pitting corrosion in Mg alloys and that mechanical polishing can substantially reduce the propensity for uniform and pitting corrosion to occur.
1. Introduction
Magnesium is one of the most abundant elements on Earth, with one of the lightest densities of all metals. It is significantly lower than aluminum, titanium, and iron [1]. As such, magnesium has a high strength to weight ratio that makes it incredibly attractive for many engineering sectors, such as automotive, structural applications, biomedical, and aircraft. Efficiency can be increased drastically in many applications by reducing the weight while maintaining or enhancing the performance. This increased efficiency, in turn, diminishes the potential emissions from the source. For example, a 1 kg weight reduction in an aircraft would result in approximately 1150 USD in fuel savings [2,3]. Another major benefit of magnesium is its minimal environmental impact. It is nontoxic and 100% recyclable, making it a strong candidate to reduce environmental emissions and also a potential candidate for biomedical applications within the human body [4]. Magnesium also possesses high machinability including rolling, milling, casting, and turning [5], further reducing costs associated with tool wear. Magnesium is also relatively cost-efficient due to its abundance.
Despite magnesium’s many benefits in comparison to other metals, there is still far more research needing to be accomplished into critical areas such as corrosion resistance, which is notably poor for Mg and its alloys [6,7,8]. Mg alloys are particularly sensitive to pitting corrosion as surface defects such as scratch and pits can easily be initiated on the surface due to the relative softness of Mg. Pitting corrosion is a localized corrosion that occurs within an inhomogeneous environment, and often can be severe and lead to undetectable damage that turns catastrophic. It occurs in two phases, the initiation phase, and the propagation phase. The initiation phase can often occur where localized mechanical damage has occurred or in pre-existing crevices, natural asperities, and undulations present on the material surface. Subsequently, a rapid propagation phase occurs due to the generation of positively charged ions during uniform corrosion, which attracts more negatively charged anions such as chlorides into the pit. Additionally, this collection of charged ions can cause localized changes in pH within the pit that then serve to further promote the growth and propagation of pits. This type of corrosion is very difficult to detect due to the corrosion products masking the pit, the small size of the pit, and the small changes in weight caused by the corrosion.
Aside from surface damage due to the relative softness of Mg, Mg surfaces may also be intentionally roughened to prepare samples for surface treatments such as painting or metallic coatings [9,10,11,12]. Surface roughening is used to promote improved adhesion in conventional polymeric coatings as well as metallic coatings prepared by melt dipping as well as thermal and cold sprays [13,14]. Rougher surfaces have improved adhesion primarily due to the increase in mechanical interlocking between the particles and the base metal. Mg alloys often require a protective metallic coating to enhance wear and corrosion resistance while keeping the overall weight of the component low due to the Mg substrate. When coatings peel off or otherwise fail, the roughened Mg surface will then be exposed to the environment. It is hence imperative to understand the effect of surface roughness on the pitting corrosion behavior of Mg alloys.
This study aims to investigate the effect of surface roughness on AZ31 Mg alloys under an aggressive simulated marine environment. AZ31 Mg alloys are prepared in three states: an as-received state from the manufacturer, a sample roughened with grit-blasted using Al2O3 as would be done for a thermal or cold spray application, and a sample polished to a near-mirror finish using 1200 grit SiC paper. The high degree of roughness in the roughened sample effectively acts to endow the surface with pre-existing craters, scratches, and micro-crevices that serve as facile pitting sites. The three samples with varying degrees of surface roughness are subjected to salt fog chamber testing for 672 h, as per the ASTM standard B-117. It is observed that the degree of general and pitting corrosion is profoundly impacted by the initial surface state of the AZ31 Mg alloy.
2. Materials and Methods
2.1. Materials
A rectangular bar of as-received AZ31 Mg alloy (96% Mg, ~3% Al, and ~1% Zn) was cut utilizing a high-speed abrasive saw to split it into three, equal-sized rectangular bars (48 mm × 22 mm × 9 mm). One bar was utilized in the as-received surface condition and served as a control or baseline sample. The second sample was mechanically polished to a near-mirror finish utilizing 320, 600, 800, and 1200 grit SiC paper, in order to substantially remove any pre-existing scratches or other defects on the surface. The polishing machine utilized was a Buehler Ecomet 3 variable speed grinder-polisher (Buehler, Lake Bluff, IL, USA). The sample was polished on all six sides equally. Due to the softness of the material, the polishing machine was only used with the 320 and 600 grit paper. For the 800 and 1200 grit polishing steps, the samples were polished manually. The third sample was grit-blasted using Al2O3 media, on all sides to produce a roughened surface with pre-existing surface defects such as craters, scratches, and micro-crevices that would serve as initial pitting sites. The ensuing surface roughness of each sample was quantified using an optical profilometer (Zygo NewView 7100, Berwyn, PA, USA)
2.2. Salt Fog Chamber Exposure
The control, roughened, and polished samples then underwent a 672-h salt fog chamber test in accordance with ASTM B117-11 using a 3.5 wt.% NaCl solution at approximately 30 °C [15]. The three samples were placed in a custom 3D-printed tray where they stood at a 20° incline relative to the vertical. Drainage holes were drilled throughout the bottom of the tray to ensure water did not gather in the bottom of the tray and expose the lower half of the bars to a more severe corrosion environment. Due to the bottom portion of the tray not being fully open to the humid air environment, these portions of the bars were not used for the dimension measurements or surface characterization.
The sample was placed so as to permit an unencumbered exposure of the fog, and the samples were not in contact with any other material that has wicking characteristics. The magnesium samples were removed from the salt fog chamber after 96 h and 168 h in order to track the changes in the dimensions and mass. This same timing was utilized for the duration of the 672 h experiment on a week by week basis. Prior to the measurements, loose and hydrated corrosion layers were carefully removed utilizing a razor blade, being careful not to scratch the surface, and preserved in a plastic bag to dry for further characterization. Harsh solutions such as acids were not used to avoid restarting the initial corrosion processes, in order to more accurately observe the trends over time. The weight loss measurements are acknowledged to be conservative, as a greater weight loss could have been recorded if the thin MgO oxide layer had been chemically removed.
2.3. Material Characterization
At the completion of the salt fog chamber test, the polished, roughened, and control sample top surfaces and cross-sections were examined using scanning electron microscopy (SEM) using a Zeiss Neon 40 Field Emission SEM (Carl Zeiss Microscopy, LLC, White Plains, NY, USA) equipped with an EDAX Octane Elect energy dispersive spectroscopy (EDS) detector (EDAX Inc., Mahwah, NJ, USA). EDS elemental mapping and point analysis were conducted. The point analysis consisted of 5 points on each region of interest. The SEM was operated using a 2 kV accelerated voltage and a 5 mm working distance. Cross-sections were made by mounting samples in an epoxy resin and cut using an abrasive saw. The mounted samples were polished utilizing 320, 600, 800, and 1200 grit paper. To alleviate charging, a 2 nm layer of platinum–palladium was sputtered onto the samples prior to the SEM analysis.
3. Results
3.1. Surface Roughness
Figure 1 shows the 3D morphological profiles of the three Mg samples attained via optical profilometry including the average roughness values taken from three regions across each sample. It can be seen that the roughened sample had a surface roughness over four-times greater than the control as-received sample. The mechanical polishing of the sample led to a decrease in the surface roughness of over one order of magnitude relative to the control as-received sample (~1/17th of the control sample).
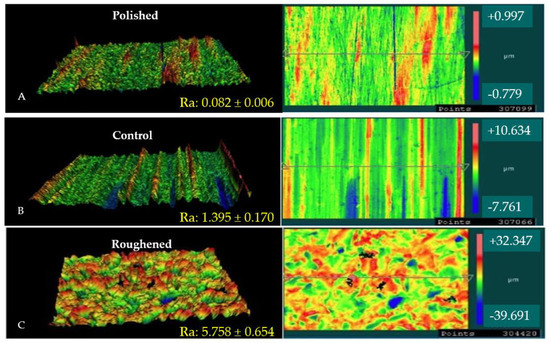
Figure 1.
3D surface profiles and height maps of Mg samples. (A) is the surface profile of the polished sample, (B) is the surface profile of the control sample, and (C) is the surface profile of the roughened sample. The images show both 3D and top down images of each surface treatment. The red color indicates peaks on the surface, while the blue color represents the valleys.
3.2. Mass and Dimensional Changes during Salt Fog Exposure
Table 1, Table 2 and Table 3 present the measurements for each sample exposed to a different surface roughness treatment. Three independent measurement points were taken for each sample. The initial two rows show the data taken during the incubation period, which were not used in any analysis. Only one data point was recorded during each of those measurement periods, as such no standard deviation was calculated.

Table 1.
Polished sample dimension and mass change measurements.
Table 2.
Control sample dimension and mass change measurements.
Table 3.
Roughened sample dimension and mass change measurements.
Figure 2 shows the change in mass and corrosion rate of each sample overtime during the salt fog exposure. The corrosion rate for each sample was calculated using the weight loss method using the mass at 168 h as the initial. The incubation period data were not plotted on the figure. It can be seen that the roughened sample had the highest amount of mass loss. Both the roughened and control samples experience most of their weight loss before approximately 350 h, after which the weights plateau. The polished sample, however, maintained a steady weight throughout the entire salt fog exposure. The corrosion rate for each sample followed a similar trend of intensity.
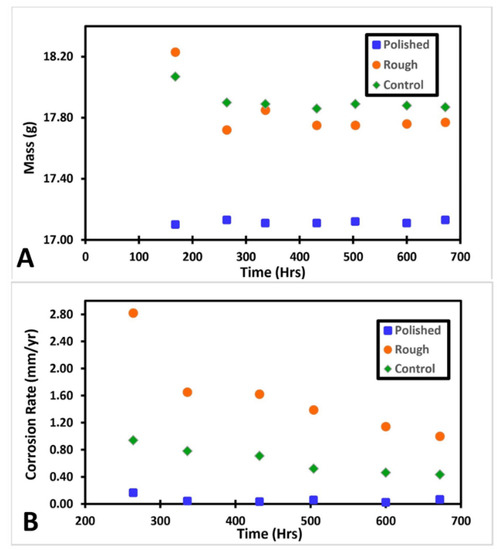
Figure 2.
(A) Shows the change in mass for each sample, (B) shows the corrosion rate for each sample at each time period. The control and roughened samples had similar trends in mass loss. Both samples had a decrease in mass followed by a plateau. Both samples plateaued around 350 h. The roughened sample had a more dramatic mass change. The polished sample remained approximately constant throughout the experiment. The same relative intensities are visible for each samples corrosion rate.
Throughout the time the samples were inside the salt fog chamber, a porous hydrated oxide layer formed on their surface, as seen in Figure 3. The roughened sample had the largest amount of this oxide present followed by the control sample. The amount that formed on the samples decreased over time. There is significantly more oxide present at 168 h for the roughened and control sample when compared with 504 h. At 672 h, the roughened sample had a minimal hydrated oxide layer present and the control sample had none. The polished sample did not display a hydrated oxide throughout the experiment. When compared to the profilometry data, this further confirms the correlation between surface roughness and the rate of corrosion.
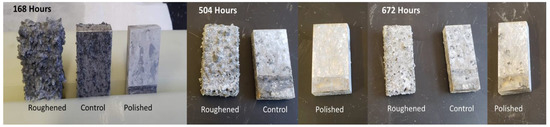
Figure 3.
Pictures of the samples were taken to show the change in oxide layer formation over the course of the experiment. All three photo sets show minimal change to the surface of the polished sample. At 168 h the roughened sample had significant growth of a hydrated oxide layer. This layer is also present on the control sample, but significantly less. As the h increased, the amount of hydrated layer growth decreased and a hard oxide layer becomes more visible
4. Discussion
The formation of two oxide layers was expected to occur, based on previous reports on Mg corrosion [16,17]. The presence of a hard crust-like MgO was expected to form on the top surface of each sample. On top of the magnesium oxide, an Mg(OH)2 layer, which is a hydrated oxide layer known as brucite, was expected to form. The rate of corrosion and oxide layer formation was found to be proportional to the samples’ average roughness (Ra) value. The expected corrosion reactions occurring within the salt fog environment include [16,17].
Cathodic Hydrogen Evolution:
Anodic Dissolution:
MgO Formation:
Brucite Formation:
The top surfaces of both the roughened and polished samples were examined via SEM. Figure 4 shows the SEM images of the top surface of the roughened and polished samples. The top surface of the roughened sample (Figure 4A–C) had relatively large preexisting defects such as scratches, craters, and micro-crevices that served as preferential sites for pitting. This made this sample significantly more prone to pitting corrosion. The roughened sample indeed exhibited greater amounts of metallic dissolution reflected as a steady decrease in mass as well as a substantial formation and proliferation of oxide and hydrated oxide corrosion products. The corrosion on the roughened sample was much more uniform and more intrusive into the base metal. Flower-like oxide corrosion products were found in every pit. These flower-like oxide products on the sample surfaces are likely to be either MgO or brucite, as suggested by the XRD analysis presented in Figure 6. It should be emphasized that a careful examination of the literature on Mg corrosion indicated that this flower-like oxide product has not been previously observed for either MgO or Mg(OH)2 formed during corrosion. However, similar flower-like oxides are seen in manganese oxides used as electrodes for supercapacitor applications [18,19]. The polished sample (Figure 4D–F) showed minimal amounts of corrosion. Most of the polished sample was base metal with corrosion present in isolated patches. Figure 4D shows one of the isolated oxide regions. The dashed box on Figure 4D indicates the region of the higher magnification images. The profilometer data for the polished sample indicated very minimal surface defects present on the surface. This made pitting corrosion very unlikely and sporadic. The corrosion products that were present on the polished sample exhibited greater amounts of cracking, as seen in Figure 4E,F suggesting that they may be thinner and poorly adhered to the underlying Mg metal.
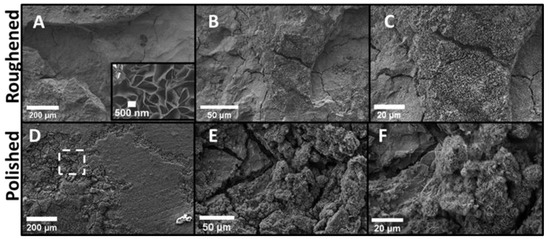
Figure 4.
SEM images of the top surfaces for the control and roughened sample. (A) roughened sample with inset: highest magnification of flower-like oxide; (B) roughened sample at higher magnification, (C) roughened sample higher magnification, (D) polished sample, (E) polished sample at higher magnification, and (F) polished sample at highest magnification. The polished sample still had base metal in view with small oxide regions similar to what is seen in (D). (E) and (F) were taken within the dashed box in (D) to show the limited oxide for comparison. The roughened sample was uniformly covered in an oxide layer with multiple large craters. There were multiple areas with a flower-like oxide as seen in the inlay of (A). This oxide was seen on all three samples in different quantities.
At 168 h, the hydrated oxide layer from both the roughened and control samples were removed and placed in a sample bag to dry. Initially, when removed, the oxide was hydrated to the touch. When the experiment was complete after the 672 h salt fog chamber testing, the oxide looked and felt like ground chalk. Figure 5 shows images of the scraped-off hydrated oxides from the roughened and control samples. The same flower-like oxide from Figure 4 is also visible in both samples, but more developed in the roughened sample.
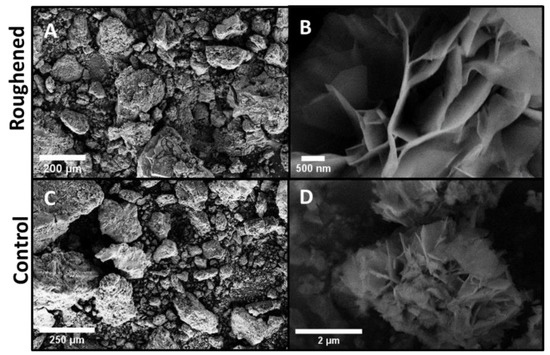
Figure 5.
The hydrated oxide layer that formed on the control and roughened samples was scraped off every weight measurement for consistency. (A) roughened sample oxide, (B) roughened sample oxide at higher magnification, (C) control sample oxide, and (D) control sample oxide at higher magnification. On both samples the flower-like oxide seen on the top surfaces in Figure 4 is also present in these images. This indicates the flower-like oxide is a characteristic of the hydrated oxide layer.
An XRD analysis was performed on the oxide removed from the roughened sample. Oxides from both samples were analyzed with the EDS and had approximately the same weight and atomic percentages as all elements present. Figure 6 shows the XRD results which confirm the presence of brucite and magnesium oxide. These two compounds were the dominant intensities. Magnesium chloride, sodium chloride, and sodium oxide were also present in smaller intensities. Sodium chloride is a result of the salt fog, and the magnesium chloride and sodium oxide are a result of the corrosion process.
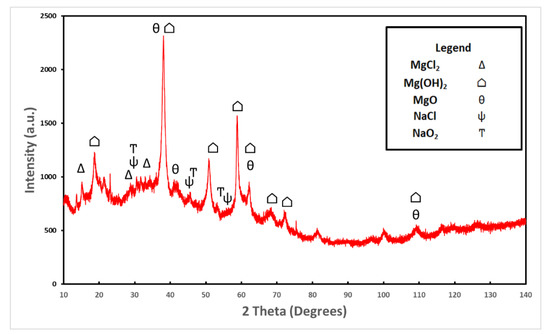
Figure 6.
XRD analysis was performed on the hydrated oxide layer removed from the roughened sample. The dominant compound present was Mg(OH)2 followed by MgO. Also present was NaCl, NaO2, and MgCl2 in smaller quantities, most likely produced as a result of the corrosion taking place in the salt fog chamber.
The cross-sections of the three samples were examined via SEM to compare the thicknesses of the oxide layers and the intrusion into the base metal by the formed pits (Figure 7). SEM images are oriented with the substrate at the bottom, with the top portion of the images being the epoxy mounting material. SEM of the polished sample’s (Figure 7E,F) cross-section shows very little defects on the surface of the sample and a sporadic oxide layer that reached ~1.5 µm into the base metal. The control sample (Figure 7C,D) shows an increase in corrosion. The images show the presence of an oxide layer and a pit that travels ~50 µm into the base metal. There is also evidence of crack propagation into the base metal. There was no visual oxide layer inside the crack. The roughened sample (Figure 7A,B) has a substantial amount of corrosion present on the surface. The oxide layer is ~600 µm thick (Figure 8) and the pit present is ~1 mm deep.
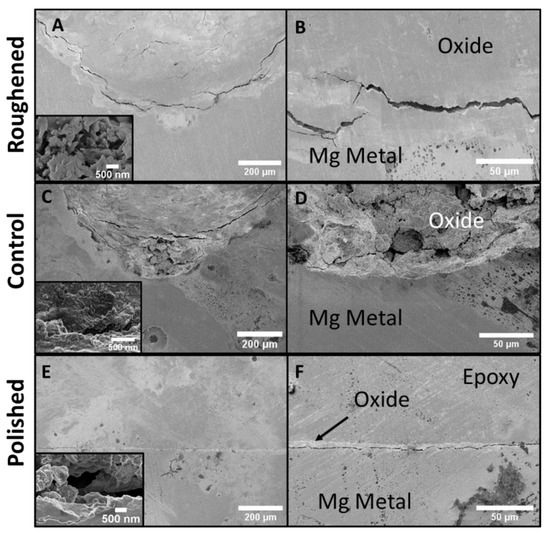
Figure 7.
SEM images of the cross-sections for all three samples. (A) roughened sample with inset: highest magnification of roughened sample, (B) roughened sample higher magnification, (C) control sample with inset: highest magnification of control sample, (D) control sample higher magnification, (E) polished sample with inset: highest magnification of polished sample, and (F) polished sample at higher magnification. The polished sample showed no sporadic presence of oxides. The roughened and control samples both had the presence of pitting and cracks within the base metal.
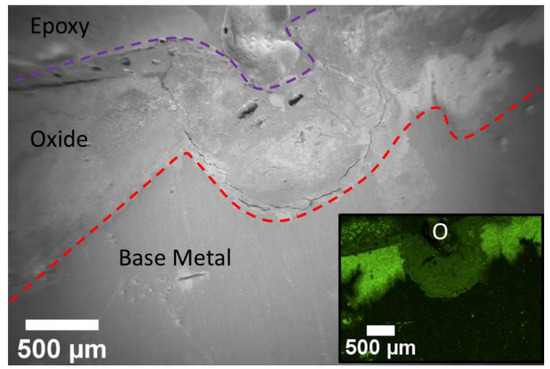
Figure 8.
EDS map of a pit seen in the cross-section of the roughened sample. The inlay is the oxygen map. It shows the increase percentage of oxygen within the oxide layer. The pit has a lower concentration of oxygen due to brucite’s increase in porosity. The base metal has small pockets of oxygen indicating oxygen was diffusing through the metal.
The presence of two distinct oxide layers was expected but difficult to visually identify as a result of the sputtering. An EDS map of the area supports that there are indeed two distinct oxide layers. Figure 8 below shows the map for oxygen. The oxygen map shows two different regions of oxygen near the surface of the sample. The difference in contrast between the two regions is due to a difference in counts received for oxygen within these regions. This indicates a change in oxidation concentration across the regions due to differences in the intrinsic chemistry, porosity, or both. The bright contrast regions are postulated to be MgO, which is expected to form a solid harder crust layer. The darker contrast is believed to be the hydrated layer of brucite. Since brucite is hydrated, it will have a higher porosity as compared to a hard layer of MgO. Brucite would also be more likely to fill in a pit. Figure 8 shows that the dark contrast region appears to fill in a pore and the corresponding SEM micrograph shows the presence of microcracks and pores, indicating an overall higher porosity. Both oxides are depleted of Mg relative to the base metal according to the Mg map (not shown). The oxygen map also shows small pockets of oxygen within the base metal, indicating that oxygen ingress into the metal may occur prior to the evolution of a fully formed oxide.
An EDS point analysis was performed on the cross-section of the roughened sample. Figure 9 shows the average of the analysis with all elements present. Five points were placed in a line in the base metal. Figure 9A shows the spectrum and averages for each element for the first five points. The element is primarily magnesium with small amounts of oxygen which was expected due to the native oxide layer formed on the cross-section and also from the diffusion of oxygen from the surface, as seen in Figure 8. The carbon present is a result of the mounting process for the samples and the platinum is from the platinum–palladium coating. Figure 9B shows the average of the other 10-point scans that were conducted within the oxide layer. The sodium and chlorine are most likely a result of the salt fog chamber solution. The oxygen being 31.03% by weight was consistent with that expected for brucite. Brucite has an extra oxygen in the molecule which would result in higher oxygen values when compared with magnesium oxide. Brucite is the more dominant oxide present due to the surface condition of the roughened sample. The increase in surface roughness led to more numerous, deeper pits. The more severe corrosion leads to an increasing presence of brucite.
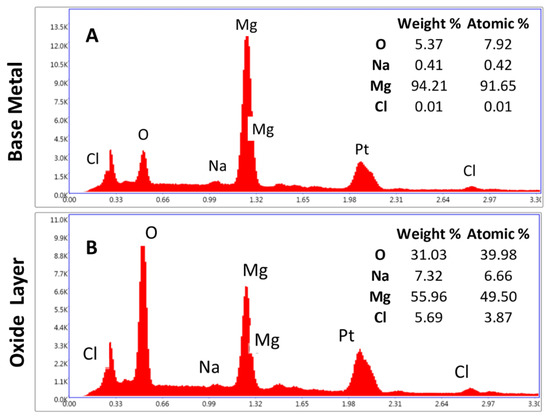
Figure 9.
EDS point analysis was performed on the roughened sample’s cross-section. The elements present were averaged. (A) EDS results for the base metal and (B) EDS results for the oxide layer. The oxygen in (B) represents the expected amount for brucite. Other regions had a% of oxygen as approximately half the amount. Sodium and chlorine are present as a result of the salt fog chamber. Platinum is present from the platinum–palladium sputter coating used.
5. Conclusions
This study investigated the effect of surface roughness modification treatments on an AZ31 Mg alloy on the corrosion rate in a simulated marine environment. Salt fog chamber experiments were conducted for 672 h on three samples with distinct surface states. One sample was roughened via grit blasting, another was mechanically polished to a near-mirror finish, and the last was left in its wrought form as a control sample. The roughened sample underwent severe uniform and pitting corrosion, characterized by a significant mass loss and the formation of a substantially greater amount of hydrated corrosion products. The SEM, EDS, and XRD analyses showed the presence of deep pits (>1 mm) and indicated that corrosion products consisted of a relatively thin MgO layer formed, followed by a thicker layer of Mg(OH)2. In contrast, the mechanically polished sample exhibited an insignificant mass change, and only sporadic discontinuous thin layers of oxide products were detected. This sharp contrast in the corrosion behavior of two AZ31 Mg alloy samples indicates that the surface roughness state has a profound impact on the subsequent corrosion behavior. These results have important implications for the fabrication and maintenance of Mg alloy parts and components exposed to marine environments. Further mechanistic studies using electrical impedance spectroscopy are planned to understand whether the surface roughness affects the intrinsic electrochemical characteristics at the Mg alloy subsurface.
Author Contributions
Conceptualization, A.N.; data curation, J.M. and N.C.; formal analysis, J.M., N.C. and A.N.; funding acquisition, A.N.; investigation, J.M. and N.C.; methodology, J.M. and A.N.; project administration, A.N.; resources, A.N.; supervision, A.N.; validation, J.M.; writing–original draft, J.M.; writing–review and editing, A.N. All authors have read and agreed to the published version of the manuscript.
Funding
Andy Nieto would like to acknowledge support from Naval Postgraduate School (NPS) Research Initiation Program (RIP) and the NPS Foundation SEED Program.
Acknowledgments
Authors would like to thank Dragoslav Grbovic for providing access to optical profilometer facility.
Conflicts of Interest
The authors declare no conflict of interest.
References
- Kainer, K.U. Magnesium—Alloys and Technology; Wiley: Hoboken, NJ, USA, 2003. [Google Scholar]
- International Air Transport Association. Guidance Material and Best Practices for Fuel and Environmental Management, 1st ed.; International Air Transport Association (IATA): Montreal, QC, Canada, 2004. [Google Scholar]
- Esmaily, M.; Svensson, J.E.; Fajardo, S.; Birbilis, N.; Frankel, G.S.; Virtanen, S.; Arrabal, R.; Thomas, S.; Johansson, L.G. Fundamentals and advances in magnesium alloy corrosion. Prog. Mater Sci. 2017, 89, 92–95. [Google Scholar] [CrossRef]
- Mordike, B.L.; Elbert, T. Magnesium Properties—Applications—Potential. Mater. Sci. Eng. A 2001, 302, 37–45. [Google Scholar] [CrossRef]
- Avedesian, M.M.; Baker, H. ASM Specialty Handbook: Magnesium and Magnesium Alloys; ASM International: Materials Park, OH, USA, 1999. [Google Scholar]
- Azzeddine, H.; Hanna, A.; Dakhouche, A.; Rabahi, L.; Scharnagle, N.; Dopita, M.; Brisset, F.; Helbet, A.; Baudin, T. Impact of rare-earth elements on the corrosion performance of binary magnesium alloys. J. Alloys Compd. 2020, 829, 1–14. [Google Scholar] [CrossRef]
- Jönsson, M.; Persson, D.; Thierry, D. Corrosion product formation during NaCl induced atmospheric corrosion of magnesium alloy AZ91D. Corros. Sci. 2007, 49, 1540–1558. [Google Scholar] [CrossRef]
- Kirkland, N.T.; Lespagnol, J.; Birbilis, N.; Staiger, M.P. A survey of bio-corrosion rates of magnesium alloys. Corros. Sci. 2010, 52, 287–291. [Google Scholar] [CrossRef]
- Hasniyati, M.R.; Zuhailawati, H.; Sivakumar, R.; Dhindaw, B.K. Optimization of multiple responses using overlaid contour plot and steepest methods analysis on hydroxyapatite coated magnesium via cold spray deposition. Surf. Coat. Technol. 2015, 280, 250–255. [Google Scholar] [CrossRef]
- Zhang, L.; Yang, S.; Lv, X.; Jie, X. Wear and corrosion resistance of cold-sprayed Cu-Based composite coatings on magnesium substrate. J. Therm. Spray Technol. 2019, 28, 1212–1224. [Google Scholar] [CrossRef]
- Wei, Y.; Luo, X.; Ge, Y.; Huang, G.; Li, C. Deposition of fully dense Al-based coatings via in-situ micro-forging assisted cold spray for excellent corrosion protection of AZ31B magnesium alloy. J. Alloys Compd. 2019, 806, 1116–1126. [Google Scholar] [CrossRef]
- Siddique, S.; Li, C.; Bernussi, A.A.; Hussain, S.W.; Yasir, M. Enhanced electrochemical and tribological properties of AZ91D magnesium alloy via cold spraying of aluminum alloy. J. Therm. Spray Technol. 2019, 28, 1739–1748. [Google Scholar] [CrossRef]
- Xie, Y.; Planche, M.; Raoelison, R.; Hervé, P.; Sou, X.; He, P.; Liao, H. Investigation on the influence of particle preheating temperature on bonding of cold-sprayed nickel coatings. Surf. Coat. Technol. 2017, 318, 99–105. [Google Scholar] [CrossRef]
- Raoelison, R.N.; Xie, Y.; Sapanathan, T.; Planche, M.P.; Kromer, R.; Costil, S.; Langlade, C. Cold gas dynamic spray technology: A comprehensive review of processing conditions for various technological developments till to date. Addit. Manuf. 2018, 19, 134–159. [Google Scholar] [CrossRef]
- Standard Practice for Operating Salt Spray (Fog) Apparatus, ASTM: B117-11. Available online: http://www.astm.org/cgi-bin/resolver.cgi?B117-11 (accessed on 12 December 2019).
- Esmaily, M.; Ström, M.; Svensson, J.E.; Halvarsson, M.; Johansson, L.G. Corrosion behavior of alloy AM50 in semisolid cast and high-pressure die cast states in cyclic conditions. Corrosion 2015, 71, 737–748. [Google Scholar] [CrossRef]
- Cabrera, N.; Mott, N.F. Theory of the oxidation of metals. Rep. Progr. Phys. 1948, 12, 163–184. [Google Scholar] [CrossRef]
- Agrawal, R.; Baboukani, A.R.; Wang, C. Expanding the potential window of aqueous electrochemical capacitors with binder-free electrostatically sprayed manganese oxide composite cathode films. Mater. Res. Express 2019, 6, 8. [Google Scholar] [CrossRef]
- Agrawal, R.; Adelowo, E.; Baboukani, A.R.; Villegas, M.F.; Henriques, A.; Wang, C. Electrostatic spray deposition-bases manganese oxide films-from pseudocapacitive charge storage materials to three-dimensional microelectrode integrands. Nanomaterials 2017, 7, 198. [Google Scholar] [CrossRef] [PubMed]


© 2020 by the authors. Licensee MDPI, Basel, Switzerland. This article is an open access article distributed under the terms and conditions of the Creative Commons Attribution (CC BY) license (http://creativecommons.org/licenses/by/4.0/).