Article

Extension of Barlat’s Yield Criterion to Tension–Compression Asymmetry: Modeling and Verification

Faculty of Civil Engineering & Mechanics, Jiangsu University, Zhenjiang 212013, China
*
Author to whom correspondence should be addressed.
Metals 2020, 10(6), 713; https://doi.org/10.3390/met10060713
Submission received: 4 April 2020 / Revised: 23 May 2020 / Accepted: 25 May 2020 / Published: 28 May 2020

Abstract

:
The present study is devoted to extending Barlat’s famous yield criteria to tension–compression asymmetry by a novel method originally introduced by Khan, which can decouple the anisotropy and tension–compression asymmetry characteristics. First, Barlat (1987) isotropic yield criterion, which leads to a good approximation of yield loci calculated by the Taylor–Bishop–Hill crystal plasticity model, is extended to include yielding asymmetry. Furthermore, the famous Barlat (1989) anisotropic yield criterion, which can well describe the plastic behavior of face-centered cubic (FCC) metals, is extended to take the different strength effects into account. The proposed anisotropic yield criterion has a simple mathematical form and has only five parameters when used in planar stress states. Compared with existing theories, the new yield criterion has much fewer parameters, which makes it very convenient for practical applications. Furthermore, all coefficients of the criterion can be determined by explicit expressions. The effectiveness and flexibility of the new yield criterion have been verified by applying to different materials. Results show that the proposed theory can describe the plastic anisotropy and yielding asymmetry of metals well and the transformation onset of the shape memory alloy, showing excellent predictive ability and flexibility.

1. Introduction

In modern industry, virtual manufacturing technology is one of the most efficient methods to reduce production cycles and improve the quality of products. As a part of virtual manufacturing, numerical simulation of metal forming processes has always been a research hotspot [1,2]. With the rapid development of computer technology, metal sheet forming is gradually assisted by numerical simulations, which can not only reduce the cost of mold testing, but also shorten the production cycles [3]. This is a great progress in the field of metal plastic forming. It is generally known that the plastic analysis of metal forming processes depends on the yield criterion and associated plastic flow rules employed. In order to improve the accuracy of numerical plastic forming simulations, it is essential to develop appropriate yield criteria involved. Given their importance to plastic forming analysis, tremendous yield criteria for different metals have been proposed by researchers.
For isotropic metals, the von Mises and Tresca criteria are the ones most used to predict the plastic behavior of materials. The von Mises criterion has been widely implemented in commercial FEM software packages such as ANSYS and ABAQUS. Besides the two famous yield criteria, there are also numerous other isotropic criteria in literature [4,5,6,7,8,9]. Actually, research on yield criteria for isotropic metals has been done quite thoroughly and the plastic forming simulations are accurate enough in most cases. However, due to their complicated plastic behavior, yield criteria for anisotropic metals are far from being thoroughly studied. In general, the pre-machined or pre-rolled metal sheet exhibits significant anisotropy, which has significant effects on the plastic forming process. In order to model the plastic behavior of anisotropic materials, Hill proposed the first orthotropic yield criterion, which reduces to von Mises criterion for isotropic conditions [10]. So far, because of its simplicity, this famous criterion has been widely used in analytical or numerical simulations of forming processes. Later, tremendous anisotropic yield criteria have been proposed. For reviews concerning yield criteria of metals, one may refer to [11,12]. Subsequently, outstanding contributions have been made by Hill [13,14,15,16], Hosford [17,18,19], and Barlat [20,21,22,23,24]. For the latest research concerning yielding behavior of solids, one may refer to [25,26,27,28,29,30]. For metallic materials, slip of dislocations and twinning are the main plastic deformation mechanisms. For both conditions, shear strains occurred on certain crystallographic planes and along certain directions. If the shear mechanism is reversible, yielding is insensitive to the sign of the stress but is only related to the magnitude of the resolved shear stress. Thus, we get equal tensile yield stress and compressive yield stress. Most yield functions in literature are based on the hypothesis of tension–compression symmetry, namely, the compressive yield stress is equal to the tensile yield stress. The hypothesis of tension–compression asymmetry is reasonable for metals deforming by reversible shear mechanism. However, not all metallic materials are tension–compression symmetric. Due to the directionality of twinning, a remarkable strength differential (SD) effect is observed in hexagonal closed packed (HCP) materials at low strain levels. In general, the yield stress in tension is much higher than that in compression [19]. For Ll2-long-range ordered intermetallic alloy, the SD effect is observed for its violation of Schmid’s law [31]. To model the tension–compression asymmetry of pressure insensitive metals, yield functions that can describe SD effects have been proposed in recent years [32,33,34,35,36,37,38,39]. Those criteria have gained a lot of attention and some have been used to describe the SD effects of engineering materials [40,41,42,43].
Compared to the tremendous anisotropic yield functions proposed for materials with equal tension and compression, criteria that can model both plastic anisotropy and yielding asymmetry are still lacking. Moreover, yield functions that can describe SD effects of metals in literature often contain too many parameters, which has resulted in difficulties in practical applications. As Barlat’s two famous yield criteria, Barlat (1987) criterion for isotropic materials [20] and Barlat (1989) criterion for anisotropic materials [21] are very successful in modeling plastic behavior of metals, an attempt was made to extend them to tension–compression asymmetry. The main focuses are put on the flexibility and manipulative convenience. The parameters of the extended Barlat’s criterion should be kept to a minimum and can be determined by as few tests as possible.

2. Extension of Barlat (1987) Isotropic Yield Criterion to Tension–Compression Asymmetry

In order to describe the yielding behavior of isotropic face-centered cubic (FCC) sheets, Barlat et al. have proposed an isotropic yield criterion, which has the following expression in an x, y, z coordinate system [20]:
| K 1 + K 2 | M + | K 1 K 2 | M + | 2 K 2 | M = 2 σ ¯ M ,
where
K 1 = σ x x + σ y y 2 ,   K 2 = ( σ x x σ y y 2 ) 2 + σ x y 2 .
Here, K1 and K2 are invariants of the stress tensor and M is an integer exponent. σ ¯ is the effective stress usually identified with the uniaxial yield stress. Figure 1 represents the projection of the tricomponent yield surface predicted by Equation (1) with M = 8 for different shear stress S = σ x y / σ ¯ , which takes the value of 0, 0.2, 0.3, 0.4, 0.5, and 0.545. S = 0 represents the planar locus without shear stress, and S = 0.545 becomes a single point which represents the yield stress in pure shear predicted by Equation (1). Tricomponent yield surfaces for isotropic FCC metals calculated by Taylor–Bishop–Hill crystal plasticity model shows that a coupling should exist between shear and normal components of the stress tensor [21]. Figure 1 shows clearly that the yield surfaces predicted by Equation (1) do not exhibit the same shape for different shear stresses, show couplings between shear, and normal components of stress. The main advantage of Barlat’s theory is that it shows excellent agreement with the Bishop and Hill yield surface for isotropic FCC sheets.
In the following, we will try to extend Equation (1) to tension–compression asymmetry without the loss of its simplicity and manipulative convenience, using the approach originally proposed by Khan et al. [44].
Compared to the traditional approach to construct an asymmetric yield criterion, Khan’s method can decouple the anisotropy and tension compression asymmetry characteristics. Therefore, the anisotropic coefficients and the parameters of tension compression asymmetry can be determined independently. Using Khan’s approach, a yield function can be expressed based on the decoupling of anisotropy and tension compression asymmetry responses into multiplicative terms, as given below:
Φ ( σ ) = f ( σ ) g ( σ ) = 1
where σ is the Cauchy stress tensor; f ( σ ) describes the anisotropic yield behavior, and g ( σ ) represents the tension compression asymmetry. Generally speaking, f ( σ ) can be an existing anisotropic yield function. Khan et al. suggested an exponential equation in terms of Lode parameter [44]:
g ( σ ) = e λ ( ξ + 1 )
where e is the base of the natural logarithm, λ is the tension–compression asymmetry coefficient and ξ is the Lode parameter, as given below:
ξ = cos ( 3 θ ) = 27 2 J 3 ( 2 J 2 ) 3
where θ is the Lode angle and J 2 = t r S 2 / 3 , J 3 = t r S 3 / 3 are the second and third invariants of the stress deviator S, respectively (tr represents the trace operator t r ( A ) = k = 1 3 A k k ).
Now, we can extend Barlat (1987) isotropic yield criterion to tension–compression asymmetry as follows:
Φ = { β [ | K 1 K 2 | M + | K 1 + K 2 | M + | 2 K 2 | M ] } e λ ( ξ + 1 ) = 1
where β is a scale coefficient, exponent M is supposed to be greater than 1 for the convexity requirement of yield function.
Supposing a uniaxial compression loading, substituting σ x x = σ C , σ x y = σ y y = 0 into Equation (6), it follows that
ξ = 1 ,   2 β | σ C | M = 1
where σ c is the uniaxial compressive yield stress of materials.
In the condition of uniaxial tension and supposing that σ T is the tensile yield stress, yielding occurs when σ x x = σ T , σ x y = σ y y = 0 , thus
ξ = 1 ,   ( 2 β | σ T | M ) e 2 λ = 1
Combining Equations (7) and (8), the coefficients of proposed criterion (Equation (6)) can be easily determined as follows:
β = 1 2 σ C M
λ = 1 2 ln σ C σ T
for   σ T > σ C > 0 λ > 0
for   σ C > σ T > 0 λ < 0
for   σ C = σ T λ = 0
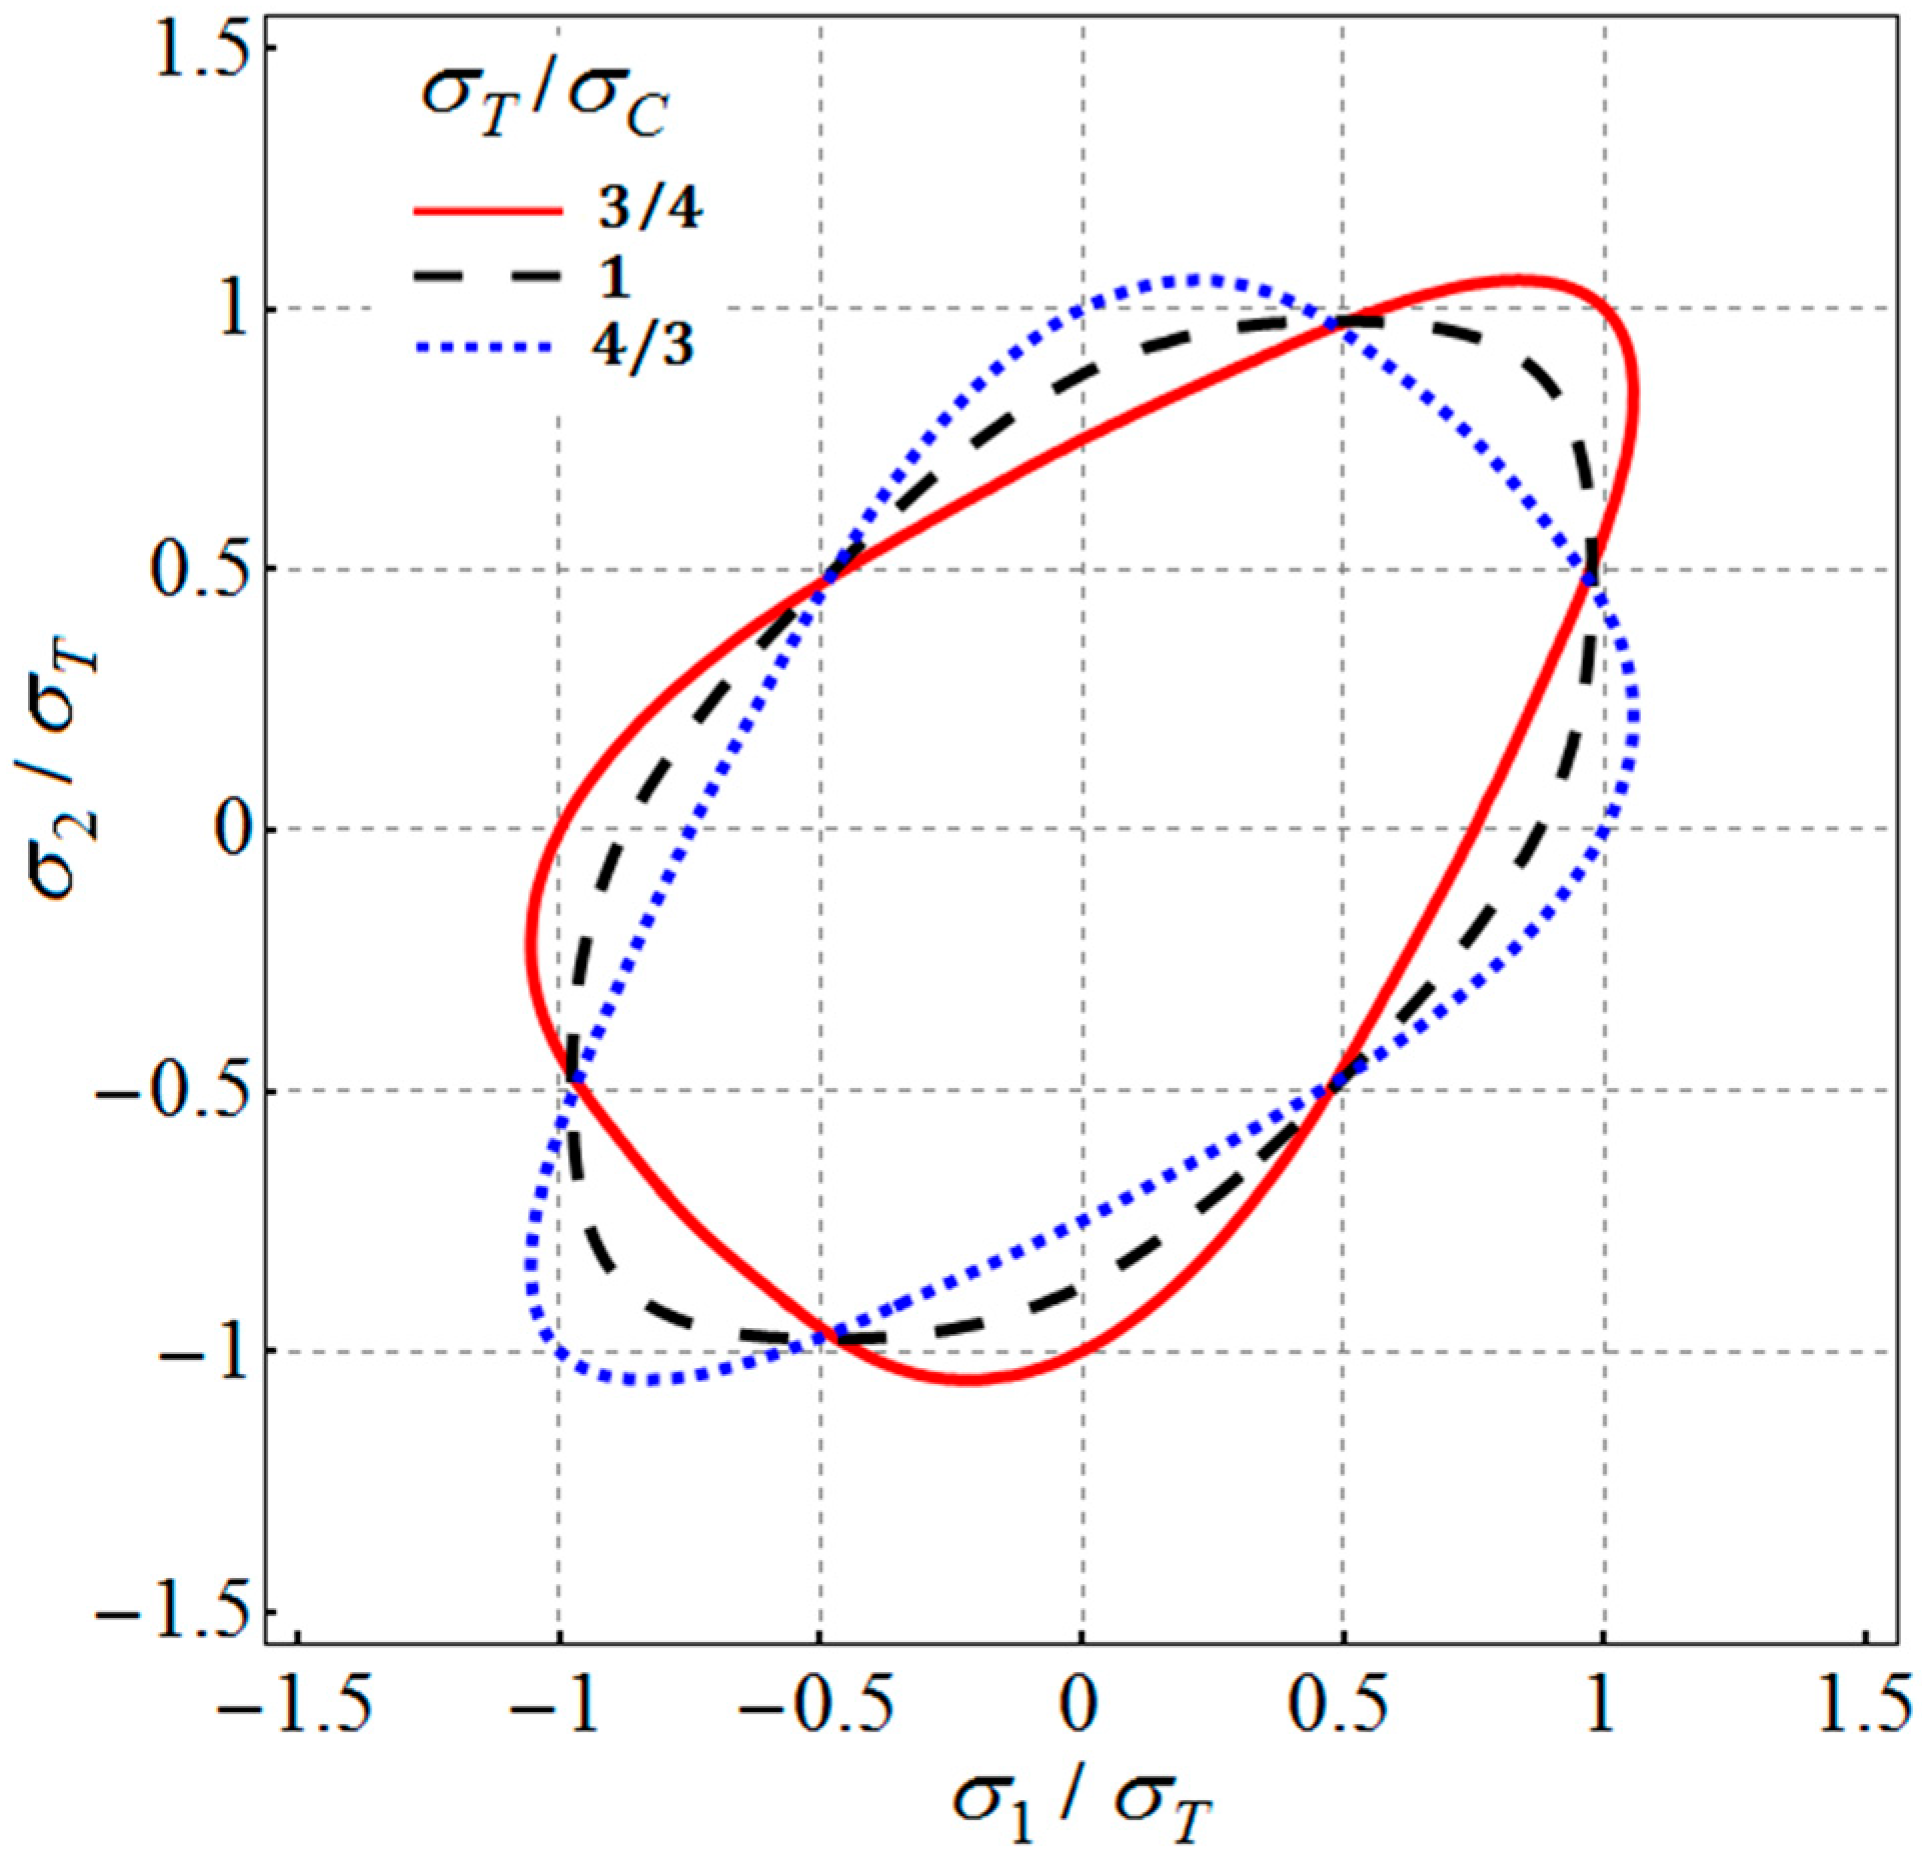
As a demonstration, Figure 2 shows the plane stress yield loci of Equation (6) (M = 6) obtained corresponding to σ T / σ C = 3/4, 1, 4/3, respectively. These ratios correspond to λ = −0.863, 0, 0.863, respectively. In the condition of σ T = σ C ( λ = 0), the proposed criterion reduced to Barlat (1987) yield criterion, and further reduced to von Mises criterion if M = 2.
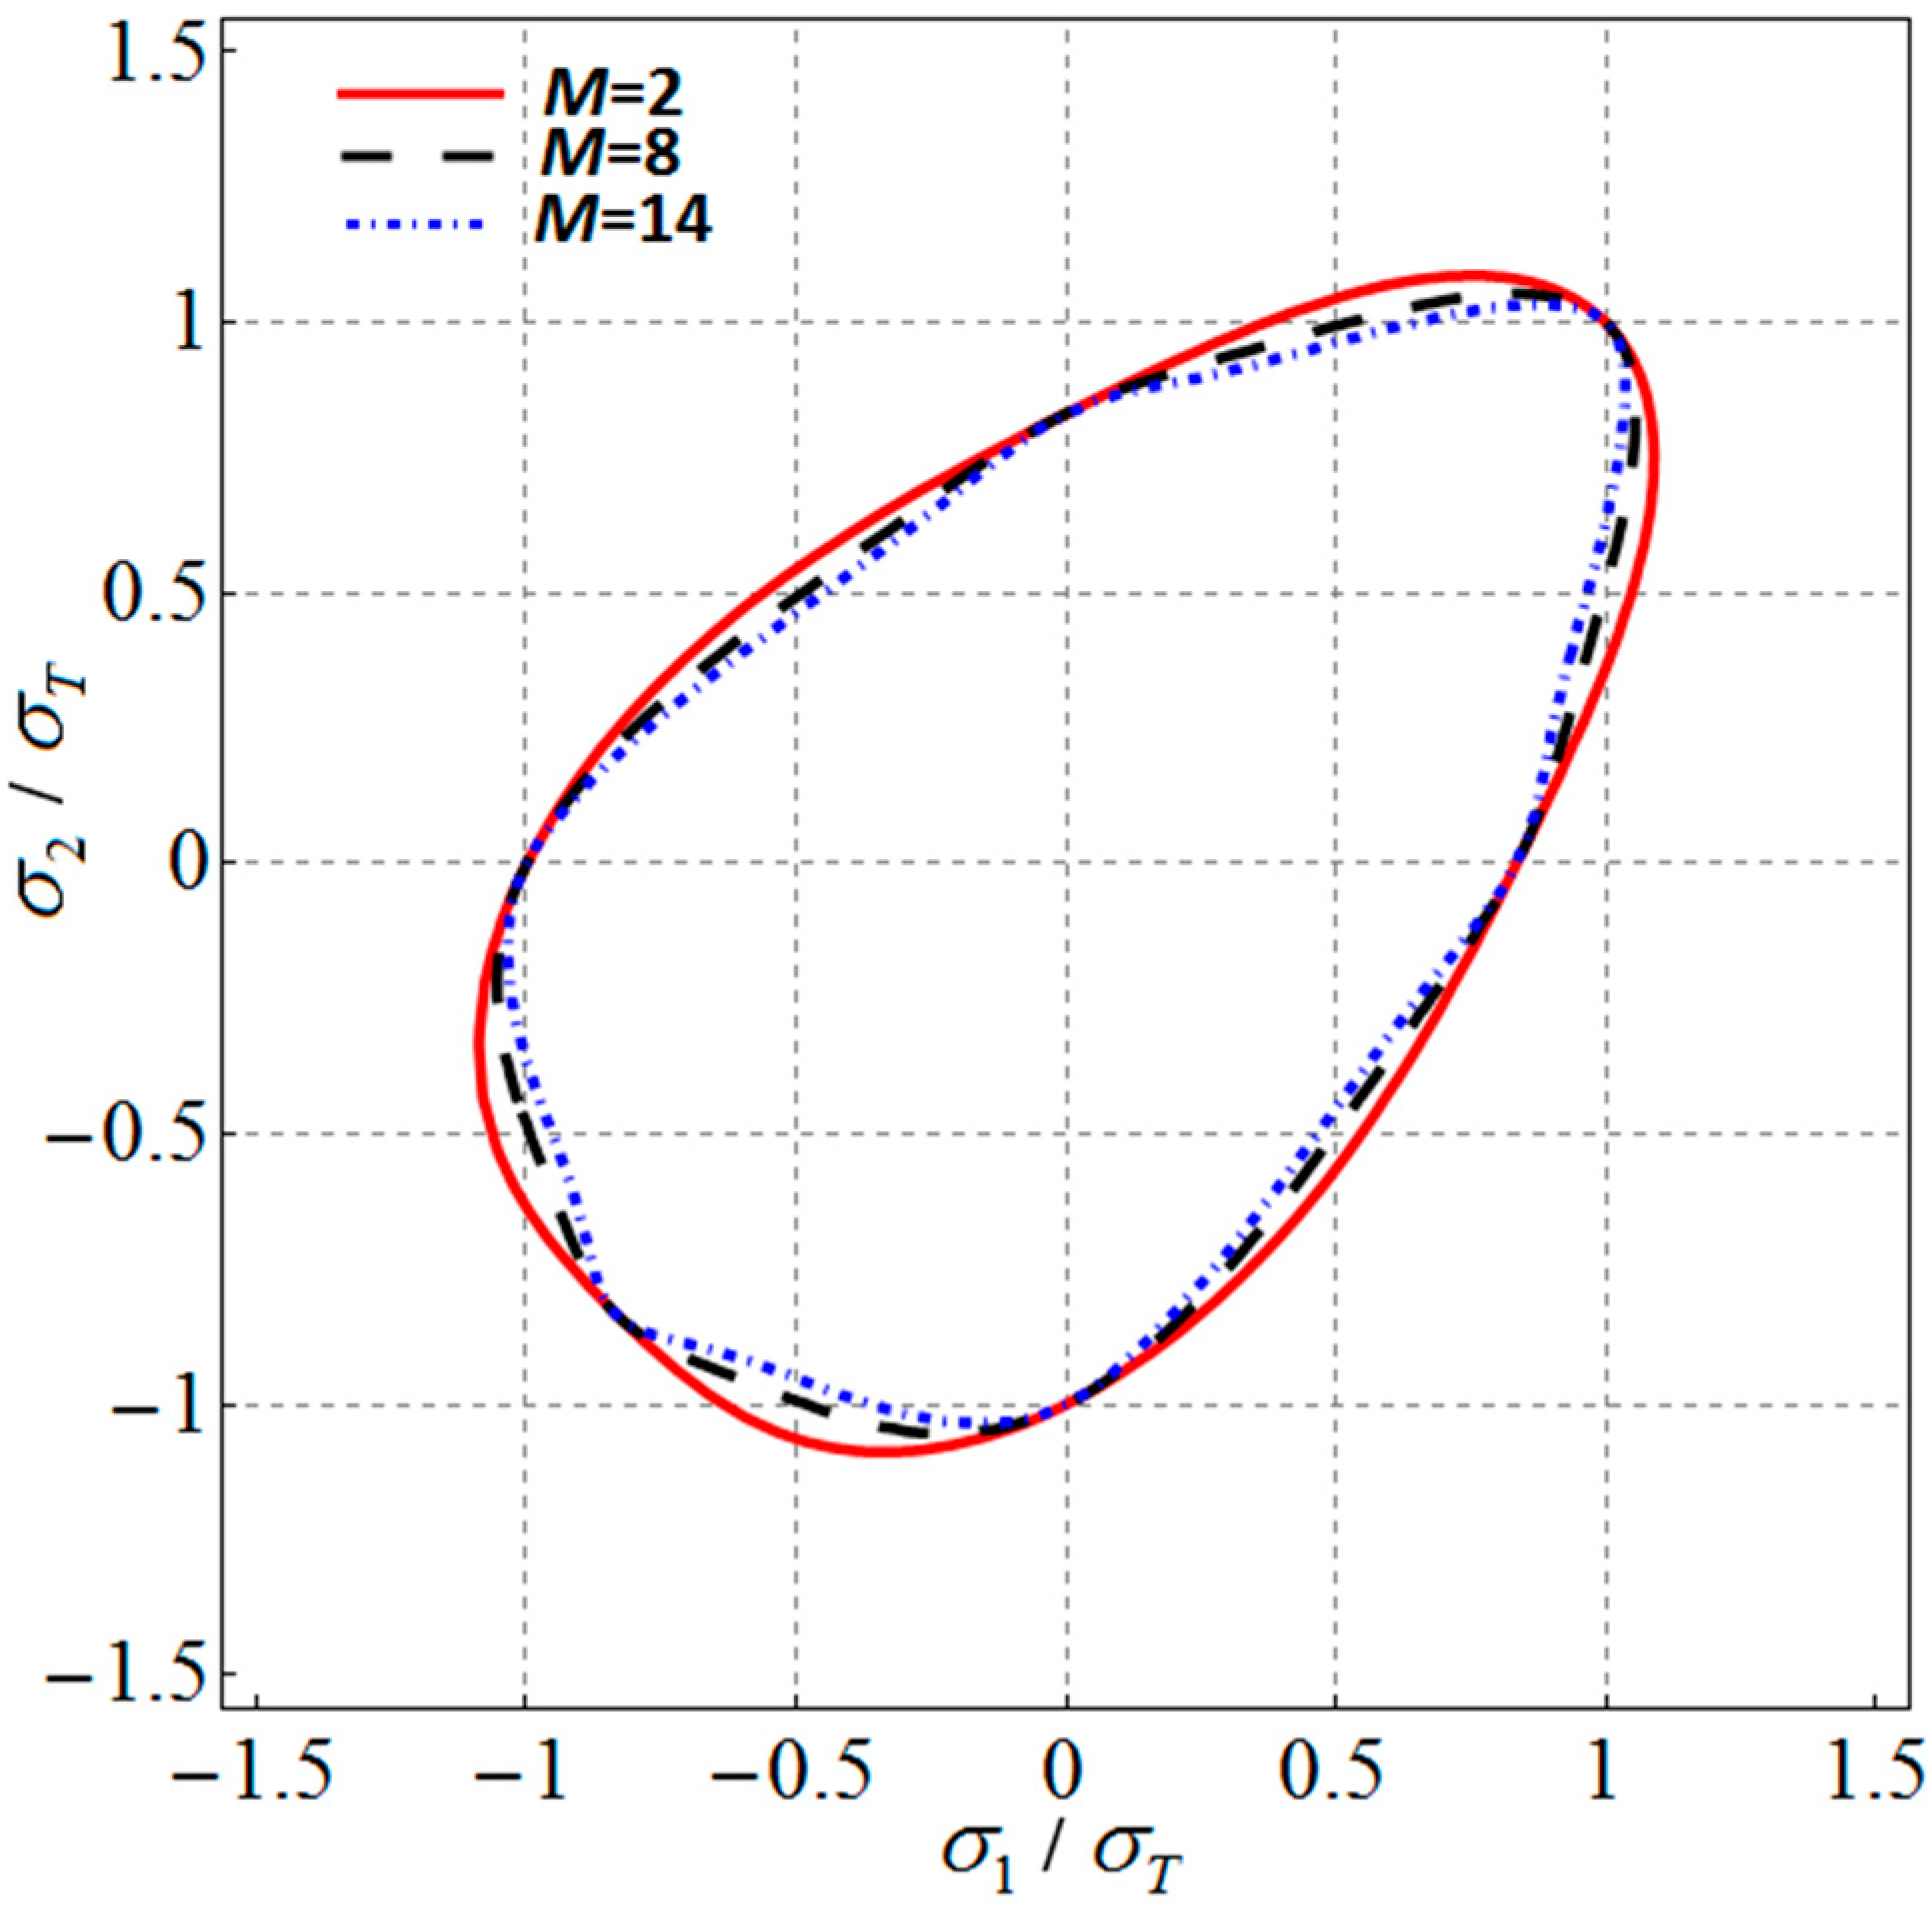
In order to illustrate the influence of the exponent M on the shape of yield surface, Figure 3 shows the representation of the plane stress yield loci of Equation (6) corresponding to σ T / σ C = 1.2 (fixed).
The ratio of σ T / σ C can be derived from Equations (7) and (8) as follows:
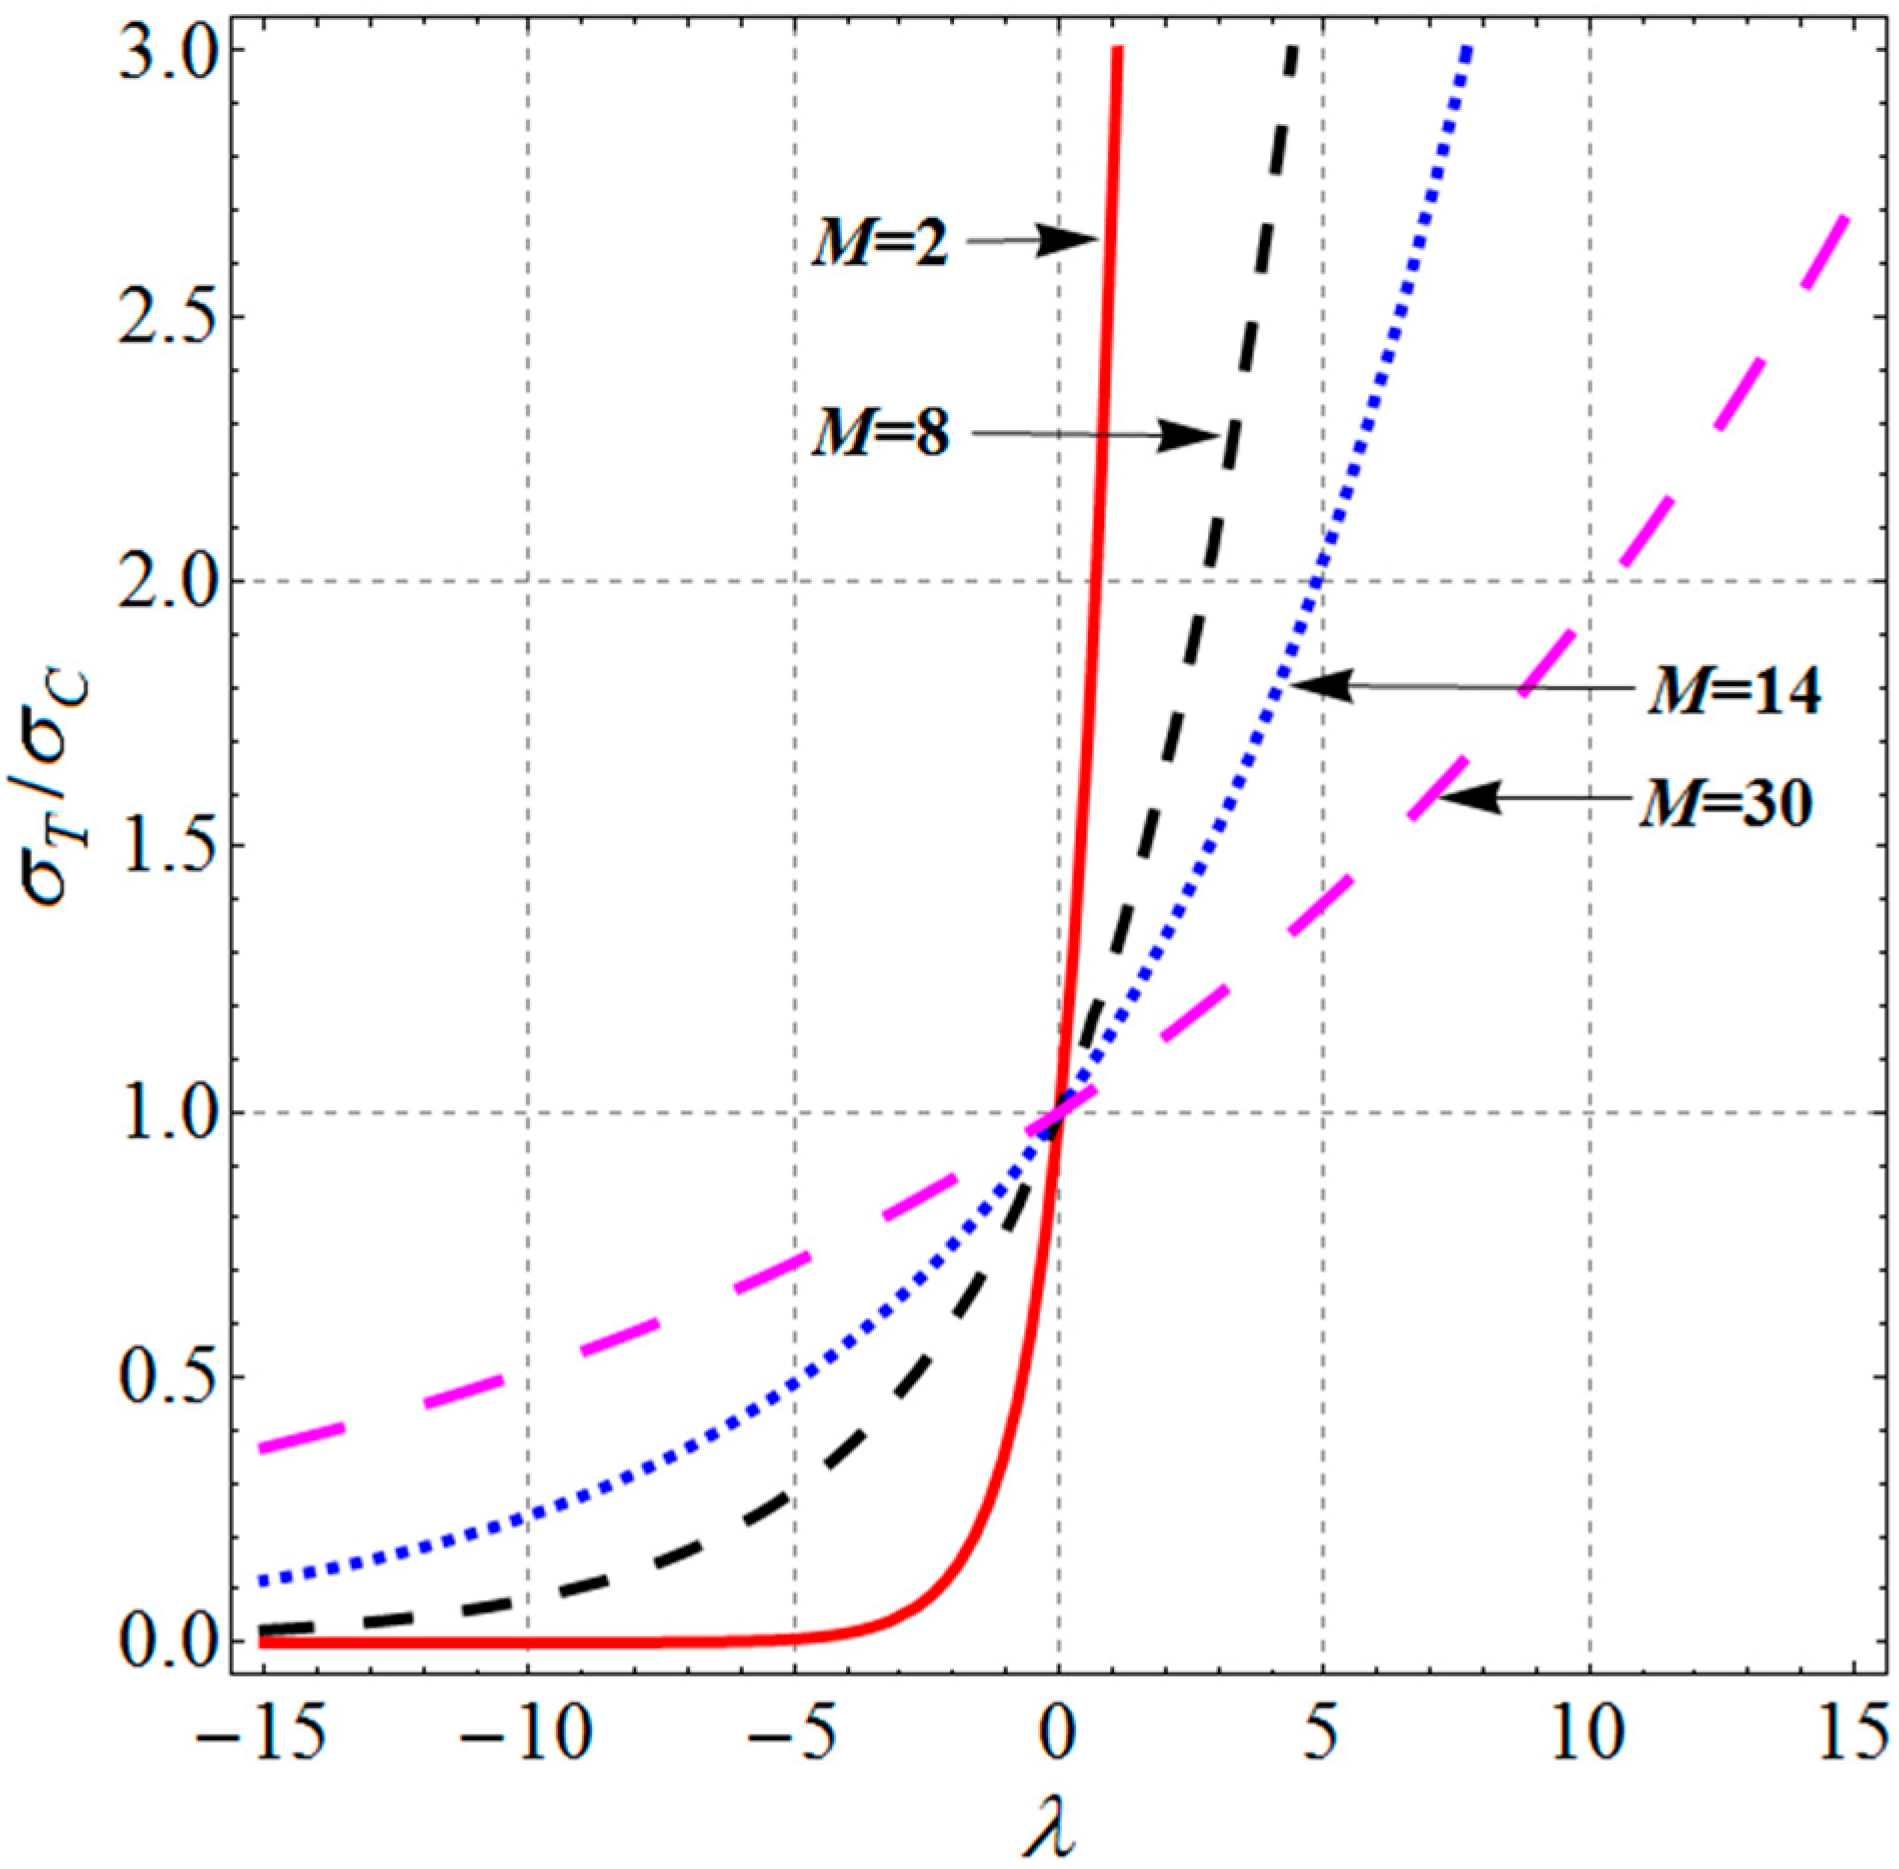
σ T σ C = exp ( 2 λ M )
The variation of σ T / σ C with λ is illustrated in Figure 4 for different values of the exponent M.
For combined tension and torsion conditions, substituting σ x x = σ , σ x y = τ , σ y y = 0 into Equation (6), the proposed yield criterion becomes
β { | σ 2 + 1 2 σ 2 + 4 τ 2 | M + | σ 2 1 2 σ 2 + 4 τ 2 | M + | σ 2 + 4 τ 2 | M } e λ ( ξ + 1 ) = 1 .
Figure 5 displays the yield loci in the tension–torsion plane ( σ / σ T , τ / σ T ) of the Tresca criterion and the proposed yield loci corresponding to a fixed value of the exponent M and several different values of k = σ T / σ C . It can be seen that, for k ≠ 1, the yield locus of the proposed criterion departs sharply from that of the von Mises ellipse.
Figure 6 displays the yield loci in the tension–torsion plane ( σ / σ T , τ / σ T ) of the proposed yield loci corresponding to a fixed value of k = σ T / σ C and several different values of the exponent M. It can be seen that, for the same σ , a smaller value of the exponent M will predict bigger yield shear stress. In the case of pure shear, substituting σ = 0 , ξ = 0 into Equation (15), the yield shear stress can be determined by the following formula:
τ s / σ T = ( 2 2 + 2 M ) 1 / M k 1 / 2
For k = 4/5, the normalized yield shear stresses predicted by Equation (16) for M = 2, 8, 14, 100 are 0.645, 0.609, 0.587, 0.563, respectively.

3. Extension of Barlat (1989) Anisotropic Yield Criterion to Tension–Compression Asymmetry

In order to describe the plastic behavior of orthotropic sheet metals, which exhibit planar anisotropy and subjected to plane stress conditions, Barlat et al. proposed the so-called Barlat (1989) yield criterion [21]. The advantage of Barlat’s theory is that it gives a reasonable approximation to plastic potentials calculated with the Taylor/Bishop and Hill theory of polycrystalline. If x, y, and z coincide with the principal axes of anisotropy, such as the rolling direction (RD), transverse-to-rolling di-rection (TD) and the thickness direction (ND), it has the following expression:
a | K 1 + K 2 | M + a | K 1 K 2 | M + c | 2 K 2 | M = 2 σ ¯ M
K 1 = σ x x + h σ y y 2 ,   K 2 = ( σ x x h σ y y 2 ) 2 + p 2 σ x y 2
where a, c, h, p are material constants. M is an integer exponent larger than one and σ ¯ is the effective stress usually identified with the uniaxial yield stress. When M equals 2, Equation (17) reduces to Hill’s (1948) yield criterion [10]. If σ 0 , σ 90 , σ b i , τ s are the yield stress along RD, TD, equi-biaxial yield stress, and yield shear stress in the xy plane, respectively, then:
h = σ ¯ σ 90
a = 2 c = 2 ( σ ¯ σ b i ) M 2 | 1 σ ¯ σ 90 | M ( σ ¯ σ 0 ) M 1 + ( σ ¯ σ 90 ) M | 1 σ ¯ σ 90 | M
p = σ ¯ τ s ( 2 2 a + 2 M C ) 1 M
As the Barlat (1989) criterion is excellent in modeling the plastic behavior of sheet metals, one may wonder if it can be extended to tension–compression asymmetry. Unfortunately, no successful theory has been found in literature by now. In the following, we will try to extend Barlat (1989) criterion to tension–compression asymmetry without the loss of its simplicity and manipulative convenience.
Using the approach originally proposed by Khan et al. [44], an extension of Barlat (1989) anisotropic yield criterion to tension–compression asymmetry is proposed as follows:
f = { a | K 1 + K 2 | M + a | K 1 K 2 | M + c | 2 K 2 | M } e λ ( ξ + 1 ) = 1
For full plane stress state ( σ x x , σ x y , σ y y ), if M is assumed to be known, there are only five material constants in the proposed criterion: the anisotropic coefficients a, c, h, p and the tension–compression asymmetry coefficient λ .
As mentioned earlier, the parameters of theory should be kept to a minimum and can be determined by as few tests as possible. Table 1 shows the number of parameters for different yield criteria which can describe the SD effects of metals, namely, Cazacu [32], Chen [36], Yoon [38], and the proposed criterion. Obviously, the proposed criterion has much less parameters compared to other similar existing yield criteria in literature. In the following, the identification procedure of the proposed criterion will be derived.
Supposing a uniaxial compression loading along a x-direction, substituting σ x x = σ 0 C ,   σ x y = σ y y = 0 to Equation (22), it follows that:
ξ = 1 ,   ( a + c ) | σ 0 C | M = 1
where σ 0 C is the uniaxial compressive yield stress along the x-direction.
In the condition of uniaxial tension along the x-direction and supposing σ 0 T is the tensile yield stress, yielding occurs when σ x x = σ 0 T , σ x y = σ y y = 0 thus
ξ = 1 ,   { ( a + c ) | σ 0 T | M } e 2 λ = 1
Supposing a uniaxial compression loading along the y-direction, substituting σ y y = σ 90 C , σ x x = σ x y = 0 into Equation (22), it follows that
ξ = 1 ,   ( a + c ) h M | σ 90 C | M = 1
where σ 90 C is the uniaxial compressive yield stress along the y-direction.
In the condition of uniaxial tension along the y-direction and supposing σ 90 T is the tensile yield stress, yielding occurs when σ y y = σ 90 T , σ x x = σ x y = 0 , thus
ξ = 1 ,   { ( a + c ) h M | σ 90 T | M } e 2 λ = 1
In the condition of equi-biaxial tension and supposing σ b T is the equi-biaxial tensile yield stress, yielding occurs when σ x x = σ y y = σ b T , σ x y = 0 , thus
ξ = 1 ,   { a ( 1 + h M ) + c ( 1 h ) M } | σ b T | M = 1
While in the condition of equi-biaxial compression, yielding occurs when σ x x = σ y y = σ b C , σ x y = 0
ξ = 1 ,   { [ a ( 1 + h M ) + c ( 1 h ) M ] | σ b C | M } e 2 λ = 1
where σ b C is the equi-biaxial compressive yield stress.
For shear such that σ x x = σ y y = 0 , σ x y = τ S , then:
ξ = 0 ,   { ( 2 a + 2 M c ) p M | τ s | M } e λ = 1
where τ S is the yield shear stress.
Combining Equations (23)–(28), the coefficients a, c, h, and λ of proposed criterion (Equation (22)) can be easily determined as follows:
h = σ 0 C σ 90 C
a = 1 ( σ 0 C ) M c = [ ( ( 1 h ) / σ 0 C ) ] M 1 / ( σ b T ) M ( 1 h ) M 1 h M
λ = M 2 ln σ 0 C σ 0 T = M 2 ln σ 90 C σ 90 T = M 2 ln σ b T σ b C
The coefficient p, associated with shear stress, can be determined by substituting a, c, λ into Equation (29). Equation (32) indicates the same value of k = σ T / σ C for three principal axes of anisotropy. For practical application, the value of λ can be determined by averaging the calculated results along different principal axes of anisotropy.
Furthermore, let rθ be Lankford coefficients (or r-values), namely, the ratio of transverse to through thickness increment of the logarithmic strain on the condition of uniaxial loading directed at angle θ with x-axis, then
r θ = sin 2 θ f σ x x sin 2 θ f σ x y + cos 2 θ f σ y y f σ x x + f σ y y | σ θ
Substituting θ = 0°, 45°, 90° in both tension and compression conditions into the above equation, we can get six equations containing the coefficients of the yield criterion.

4. Validation and Discussion

In order to check the extended Barlat (1989) anisotropic yield criterion’s predictive ability and flexibility, in the following, we will apply it to three different metallic materials.

4.1. Applications to Titanium Ti-6Al-4V

Khan et al. have studied the plastic behavior of an electron beam single melting processed Ti–6Al–4V alloy, with 0.2221% weight content of equivalent oxygen, by a large number of experimental tests [45]. Plastic work contours were determined over a wide range of equivalent plastic strain levels (0.2–6%), to quantitatively determine the elastic-plastic deformation behavior. The loading axes of specimens were along rolling direction (RD), transverse-to-rolling direction (TD), and the thickness direction (ND). The material data for Ti–6Al–4V alloy are given in Table 2. In order to calibrate the proposed yield function (Equation (22)), the following data have been selected as input data: σ 0 T , σ 0 C , σ 90 T , σ 90 C , σ b T .
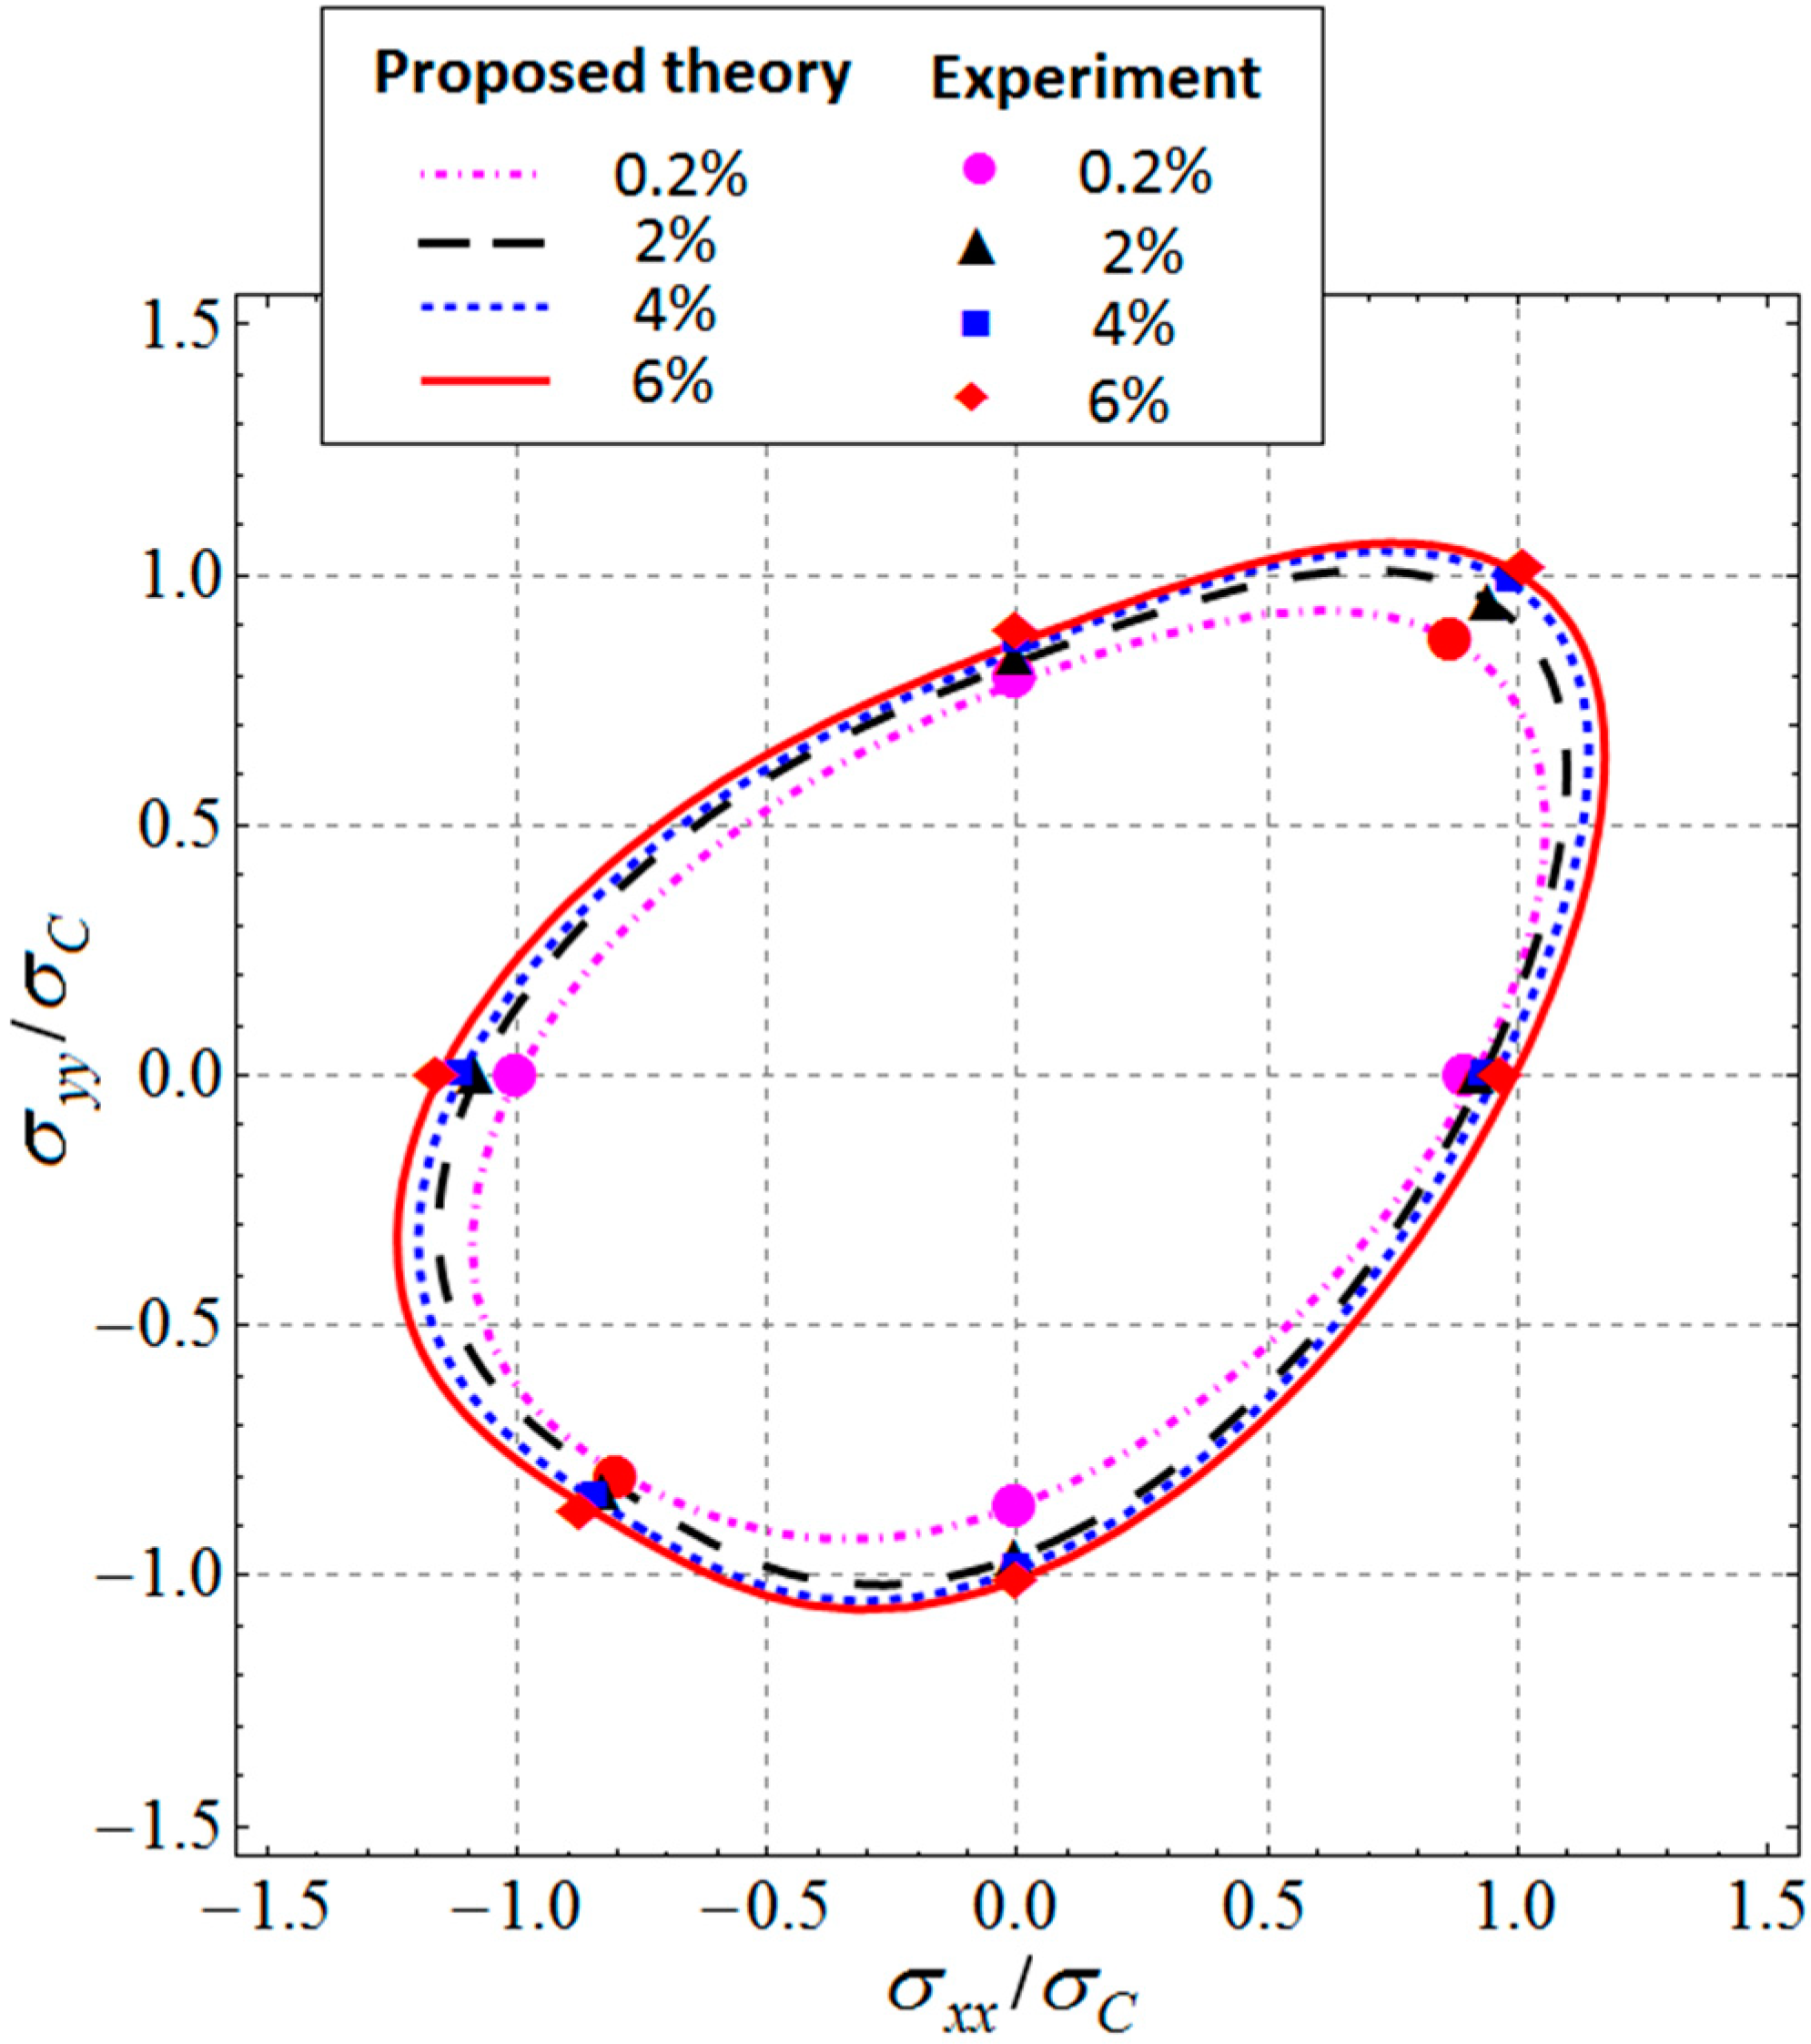
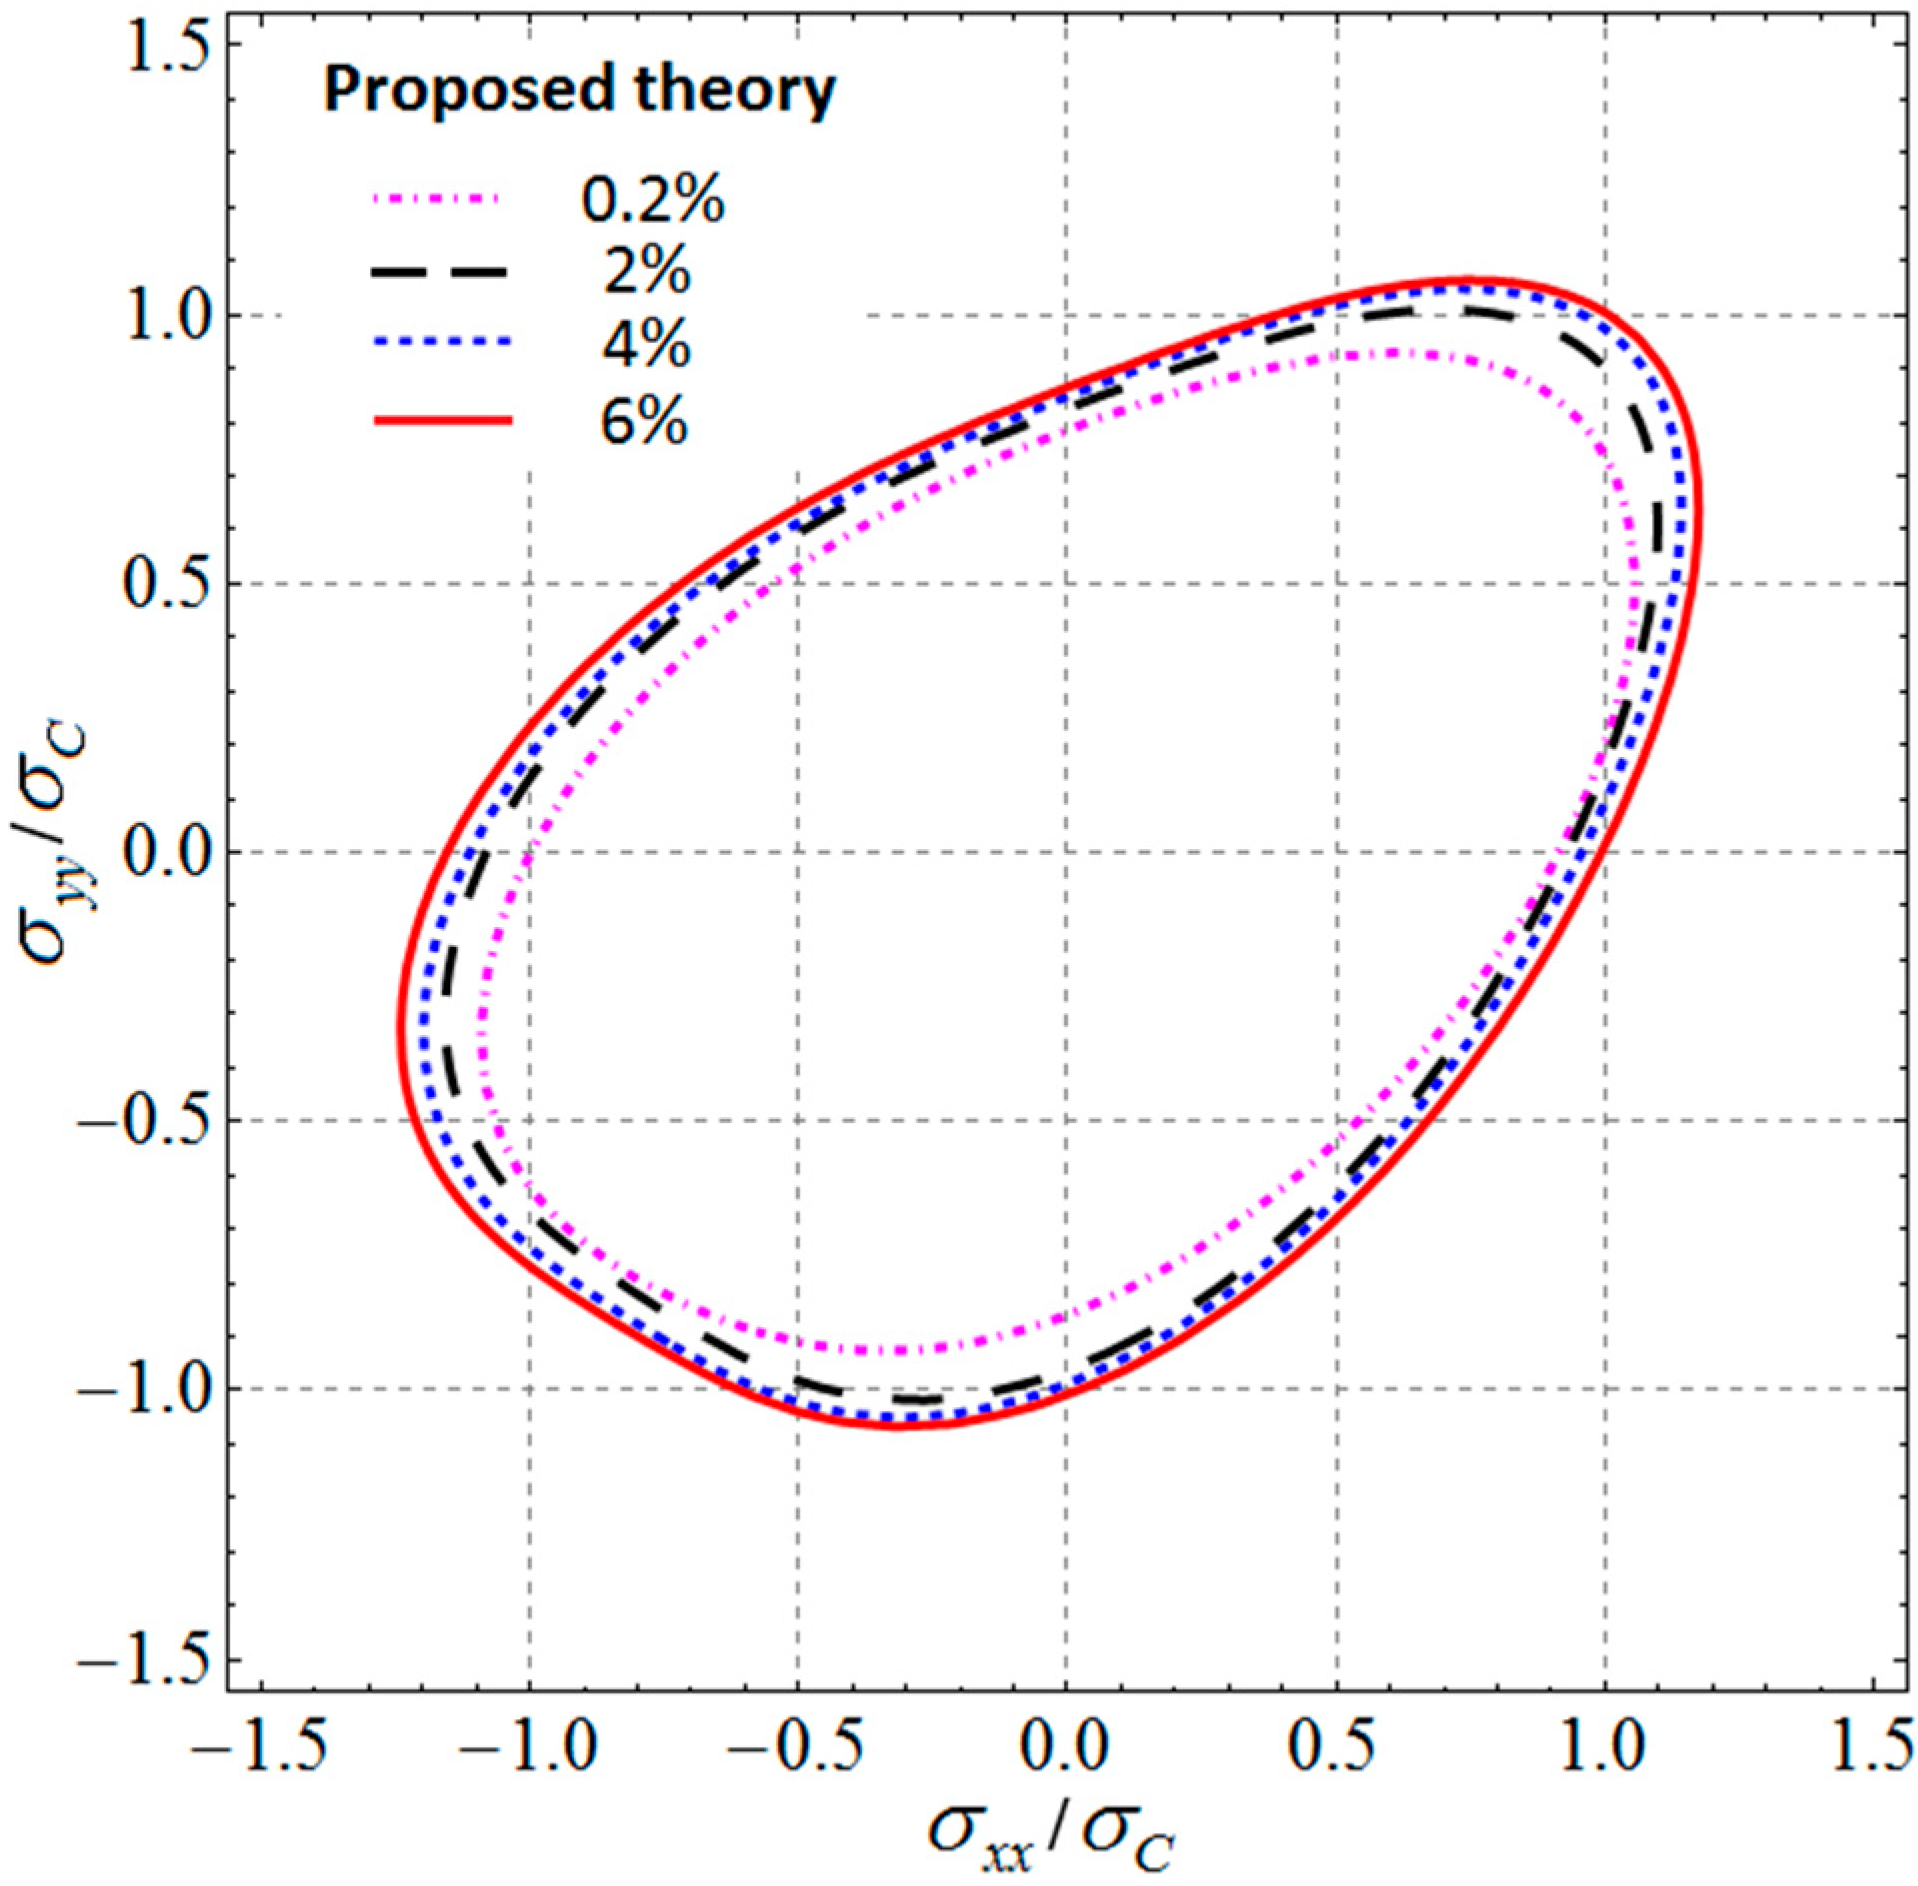
Figure 7 shows the yield loci of experiments of Ti–6Al–4V alloy for different plastic strains, namely 0.2%, 2%, 4%, and 6%, of the largest principal strain (data after Khan et al. [44]). It should be mentioned that the yield stresses in equi-biaxial tension and equi-biaxial compression are calculated from ND experimental data. For experiment details, one may refer to [44,45]. The yield locus of the Ti–6Al–4V has an asymmetrical shape. Note that the yield stress in compression is larger than that in tension. Ti–6Al–4V also shows strong differential work hardening when subject to proportional biaxial stresses. This indicates that the measured work contours are different in both shape and scale for different plastic strains.
Figure 7 also shows the theoretical yield loci of the proposed criterion (M = 2) given by Equation (22) for different plastic strains. The anisotropic and tension–compression asymmetry coefficients of the criterion, calculated using Equations (30)–(32), are listed in Table 3. It can be seen that the proposed criterion fit the experiment data well for all strain levels. The proposed criterion can reproduce well the asymmetry in yielding of Ti–6Al–4V, from initial 0.2% to relatively larger strain levels.

4.2. Applications to Shape Memory Alloy Cu-Al-Be

Shape memory alloy (SMA) often exhibits an asymmetric behavior between tension and compression. Bouvet et al. [46] have conducted extensive experimental studies on the behavior of the Cu-Al-Be SMA under multiaxial proportional and nonproportional loadings. The initial yield surface of phase transformation initiation (austenite to martensite) was obtained. Figure 8 shows the experimental initial transformation onset surface of Cu-Al-Be SMA (experiment data are plotted by symbols). Note that the transformation onset surface of Cu-Al-Be SMA has a significant asymmetrical shape, and the compressive “yield” stress is 20% larger than tensile “yield” stress.
Strictly speaking, the transformation onset surface of SMAs is different with yield surface of metals. Transformation onset surface of SMAs is the boundary of the domain, inside which the martensite phase transformation is not activated. While yield surface is the boundary between elasticity and plasticity. However, as both of them are boundaries of domain in stress space, it is reasonable to describe them with similar models. In fact, Bouvet et al. [46] have proposed a generalized macroscopic J2–J3 criterion to model the initial onset of transformation for SMAs. Herein, we will apply the proposed criterion to model the initial onset of transformation of Cu-Al-Be SMA.
Figure 8 shows the theoretical yield locus of the proposed criterion for Cu-Al-Be SMA given by Equation (22). The experiment data σ 0 T = 87 MPa, σ 0 C = 103 MPa, σ 90 T = 80 MPa, σ 90 C = 100 MPa, and σ b T = 103 MPa are selected as input data to calibrate the yield criterion. The anisotropic and tension–compression asymmetry coefficients for the proposed criterion, calculated using Equations (30)–(32), are listed in Table 4. If a relatively high M value is selected, say M = 8, near balanced biaxial stress conditions, the yield surface of this paper presents a small radius of curvature. This is a special characteristic compared with other existing theories.
From Figure 8, we can see that the proposed yield criterion fits the asymmetric transformation onset surface of Cu-Al-Be SMA very well except for the experiment point (91.43 MPa, 42.86 MPa), which seems like an experimental mistake. Thanks to the small radius of curvature near equi-biaxial compression state, yield surface of the present theory with M = 8 fits the experimental data better than that with M = 2. The yield surface with M = 2 is relatively flat near equi-biaxial compression state and overvalues the yield stresses slightly.
For the sake of comparison, the yield locus of Barlat (1989) criterion with M = 8 is also potted in Figure 8. The experiment data σ 0 C = 103 MPa, σ 90 C = 100 MPa and σ b T = 103 MPa are selected as input data to calibrate the yield criterion. The calculated parameters for Barlat (1989) criterion using Equations (19)–(21) are given in Table 4. For Barlat (1989) criterion, significant discrepancies between predicted results and experiment data are found for some stress states, especially for uniaxial tensile stress states in both x and y directions as well as area near equi-biaxial compression. It should be mentioned that the compressive yield stresses are used here to calibrate the parameters of Barlat’s theory; therefore, the theoretical uniaxial tensile yield stresses do not coincide with experiment data. As the Barlat (1989) criterion is based on the hypothesis of tension–compression symmetry, it therefore failed to reproduce the asymmetry shape of the transformation onset surface for Cu-Al-Be. However, as the transformation onset surface of SMAs is symmetric with respect to the first bisector, asymmetric isotropic yield criterion, such as the one proposed by Bouvet et al, can also describe the “yielding” behavior of Cu-Al-Be SMA well.

4.3. Applications to Ni3Al Based Intermetallic Alloy IC10

Next, we consider the experimental series of a Ni3Al based super-alloy IC10, which was developed as blade materials in advanced aero-engines [47]. IC10 is produced by directional solidification technology with columnar grain structure. Due to the preferred <0 0 1> crystallographic orientation and tension–compression asymmetry of the Ll2-long-range ordered Ni3Al, Ni3Al based alloys usually exhibit both plastic anisotropy and yielding asymmetry between tension and compression. The author of the present paper has studied the plastic behavior of IC10, and the yield locus according to 0.2% plastic strain of the largest principal strain was obtained by biaxial tensile tests on cruciform specimens and bi-compression tests on cubes [48]. The loading axes of specimens were along the directional solidification direction (0°), transverse-to-solidification direction (90°), and the thickness direction (ND). The tested mechanical property parameters for IC10 is given in Table 5. Experimental data show that alloy IC10 exhibits both plastic anisotropy and yielding asymmetry between tension and compression, although the degree of those effects is not big. What is more interesting is that the characteristics of tension–compression asymmetry are different between 0° and 90°. Note that the tensile yield stress is greater than the compressive yield stress in 0° direction, while the yield stress in tension is smaller than that in compression in the 90° direction. This “anomalous” yielding behavior couldn’t be modeled precisely by yield criterion with only one tension–compression asymmetry coefficient. For example, if we use experimental data of 0° direction to calibrate the tension–compression asymmetry coefficient of the present theory, we get λ = M 2 ln σ 0 C σ 0 T > 0 . As a result, σ 90 T > σ 90 C will be derived according to the proposed criterion, which of course is inconsistent with the experimental results. Similarly, using experimental data of 90° direction will cause the same problem.
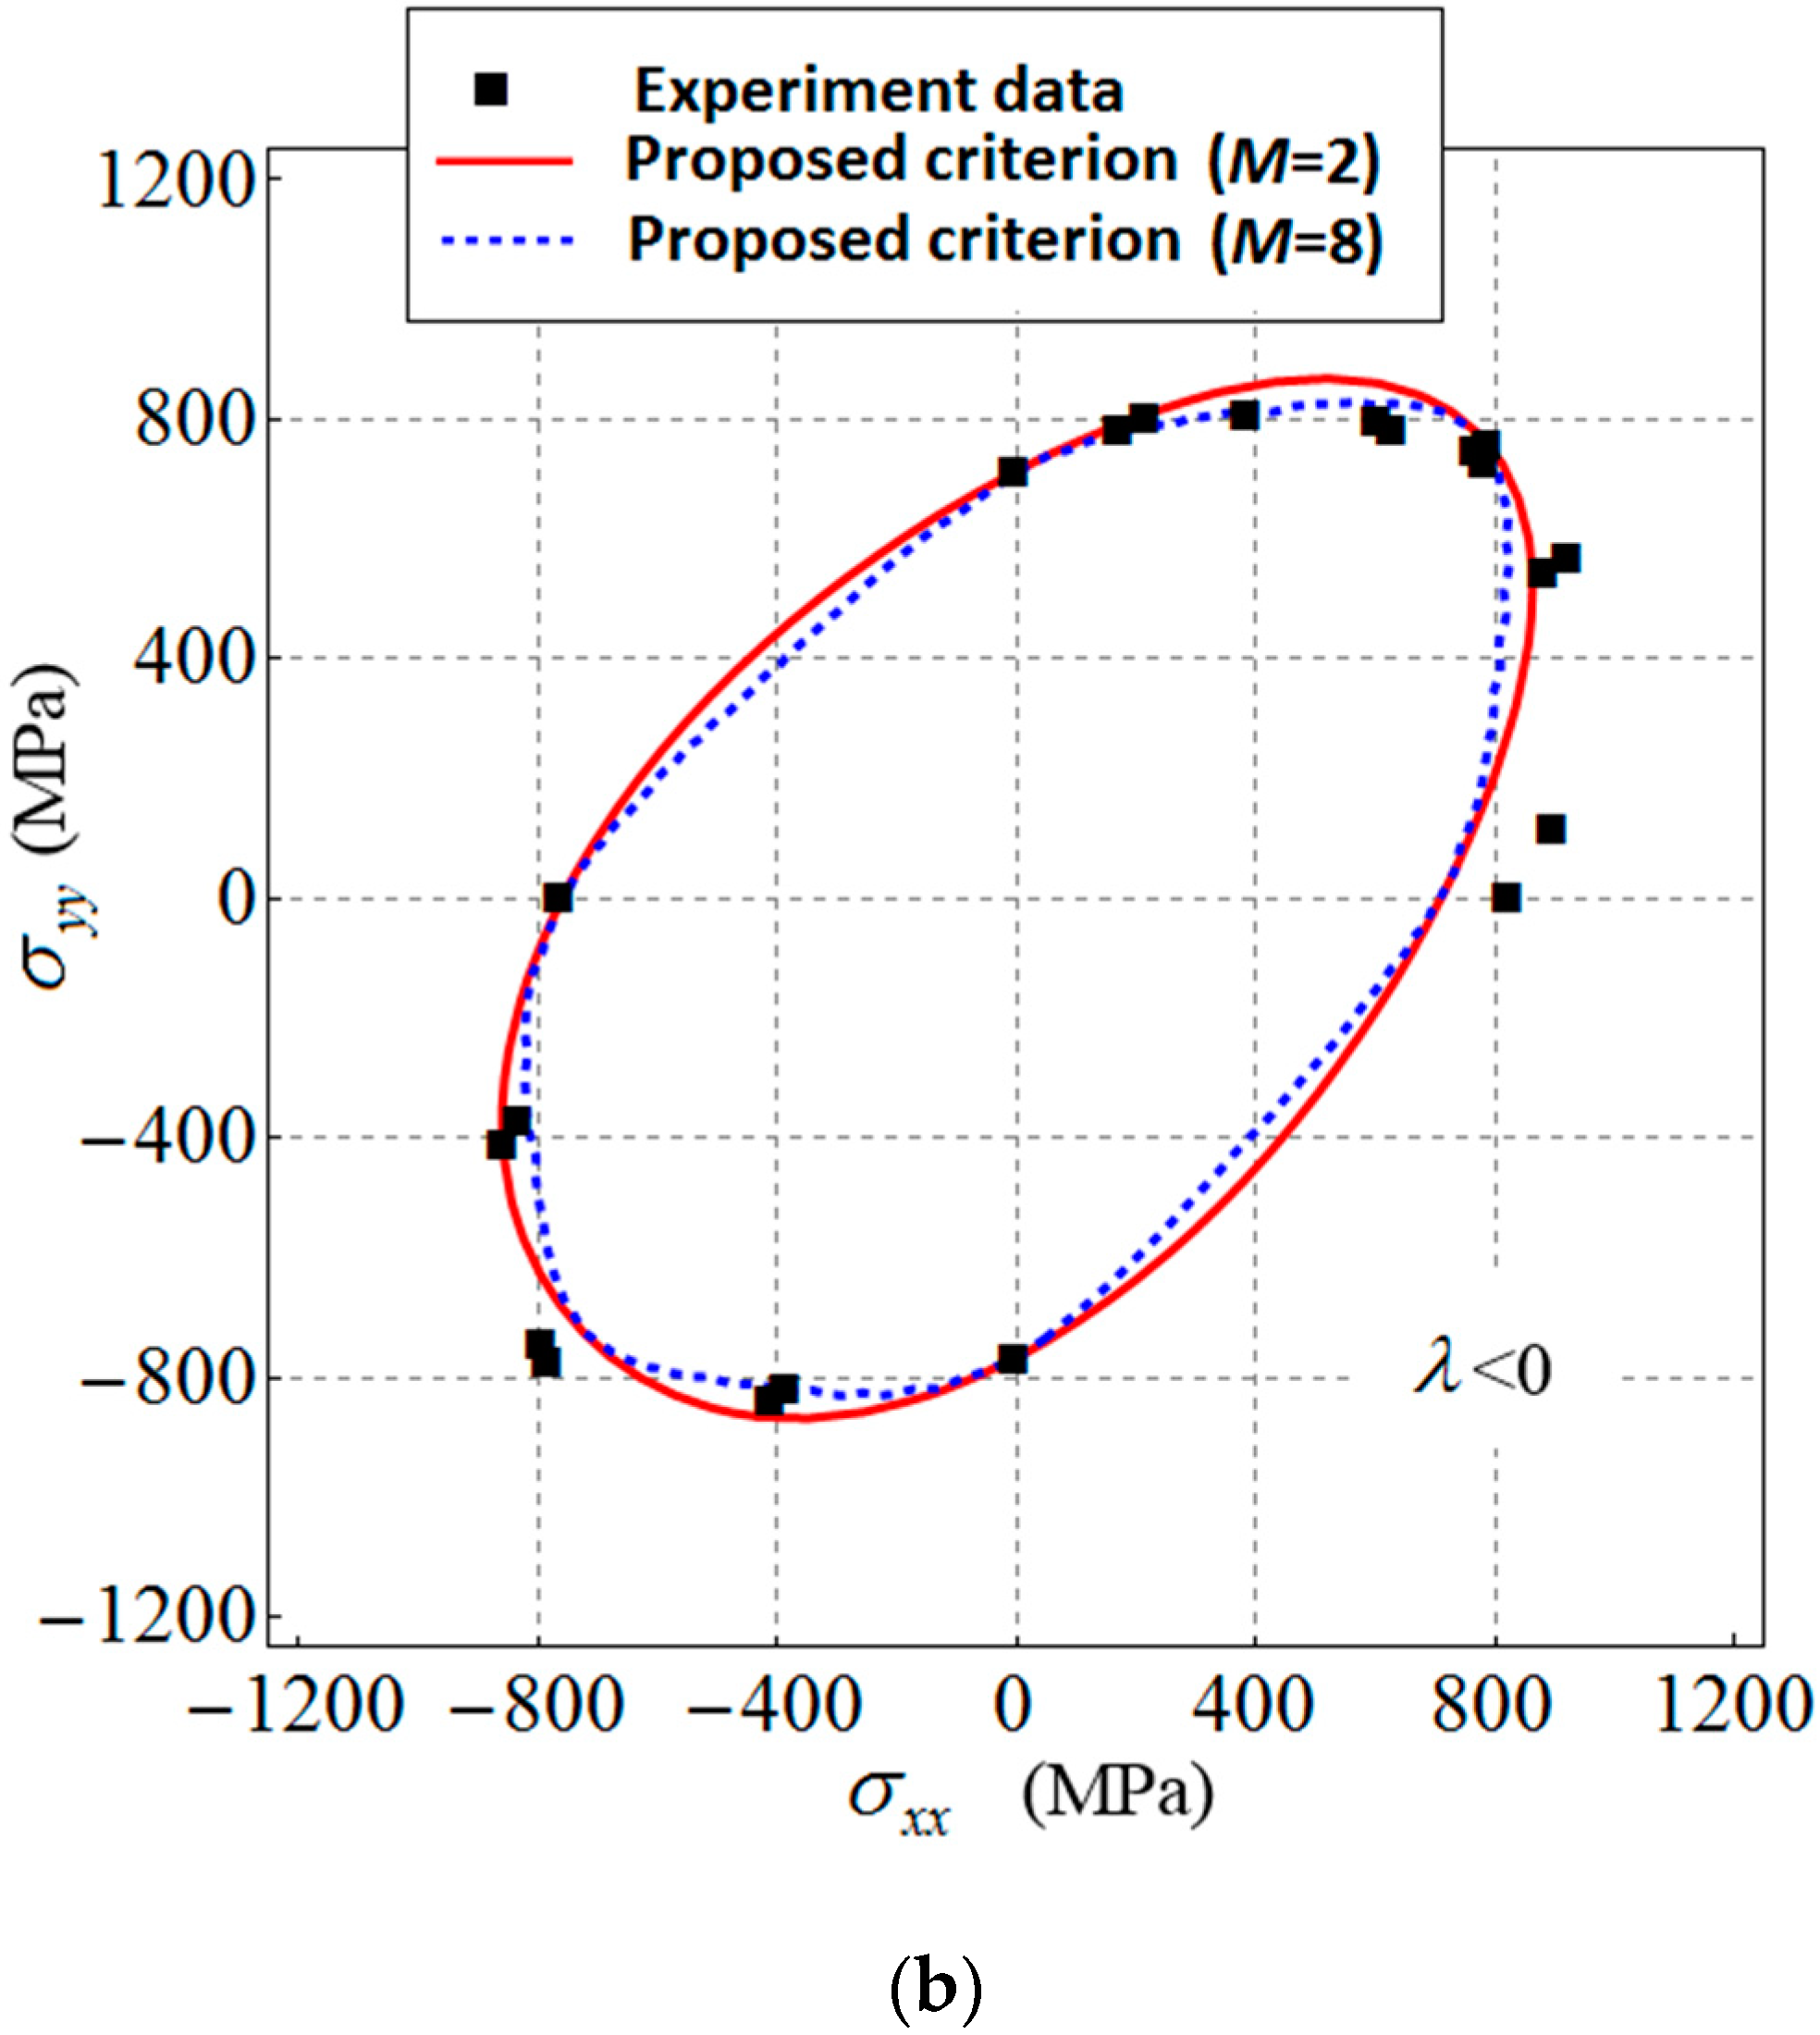
As a demonstration, the theoretical yield loci given by the proposed theory (Equation (22)) with λ calculated by experimental data of 0° and 90° are presented, respectively. The parameters involved in the 2D yield locus, calculated using Equations (30)–(32), are given in Table 6. The experiment results are also plotted in the same figure to demonstrate the predictive ability of theory.
For Figure 9a, the experiment data σ 0 T and σ 0 C are selected to calculate the tension–compression asymmetry coefficient λ . Due to the positive λ , the theoretical yield stress in tension is greater than that in compression in both directions. In addition, for Figure 9b, the experiment data σ 90 T and σ 90 C are selected to calculate λ . With a negative λ , the theoretical yield stress in compression is greater than that in tension in both directions.
Not surprisingly, the deviation between theoretical prediction and experimental data is large in some stress states. Obviously, yield criterion with a single tension–compression asymmetry coefficient can’t model the yielding behavior of IC10 well in some stress states.
In order to obtain better prediction results, an option is to calculate the average value of λ using experimental data in both directions. That is,
λ = 1 2 ( M 2 ln σ 0 C σ 0 T M 2 ln σ 90 C σ 90 T )
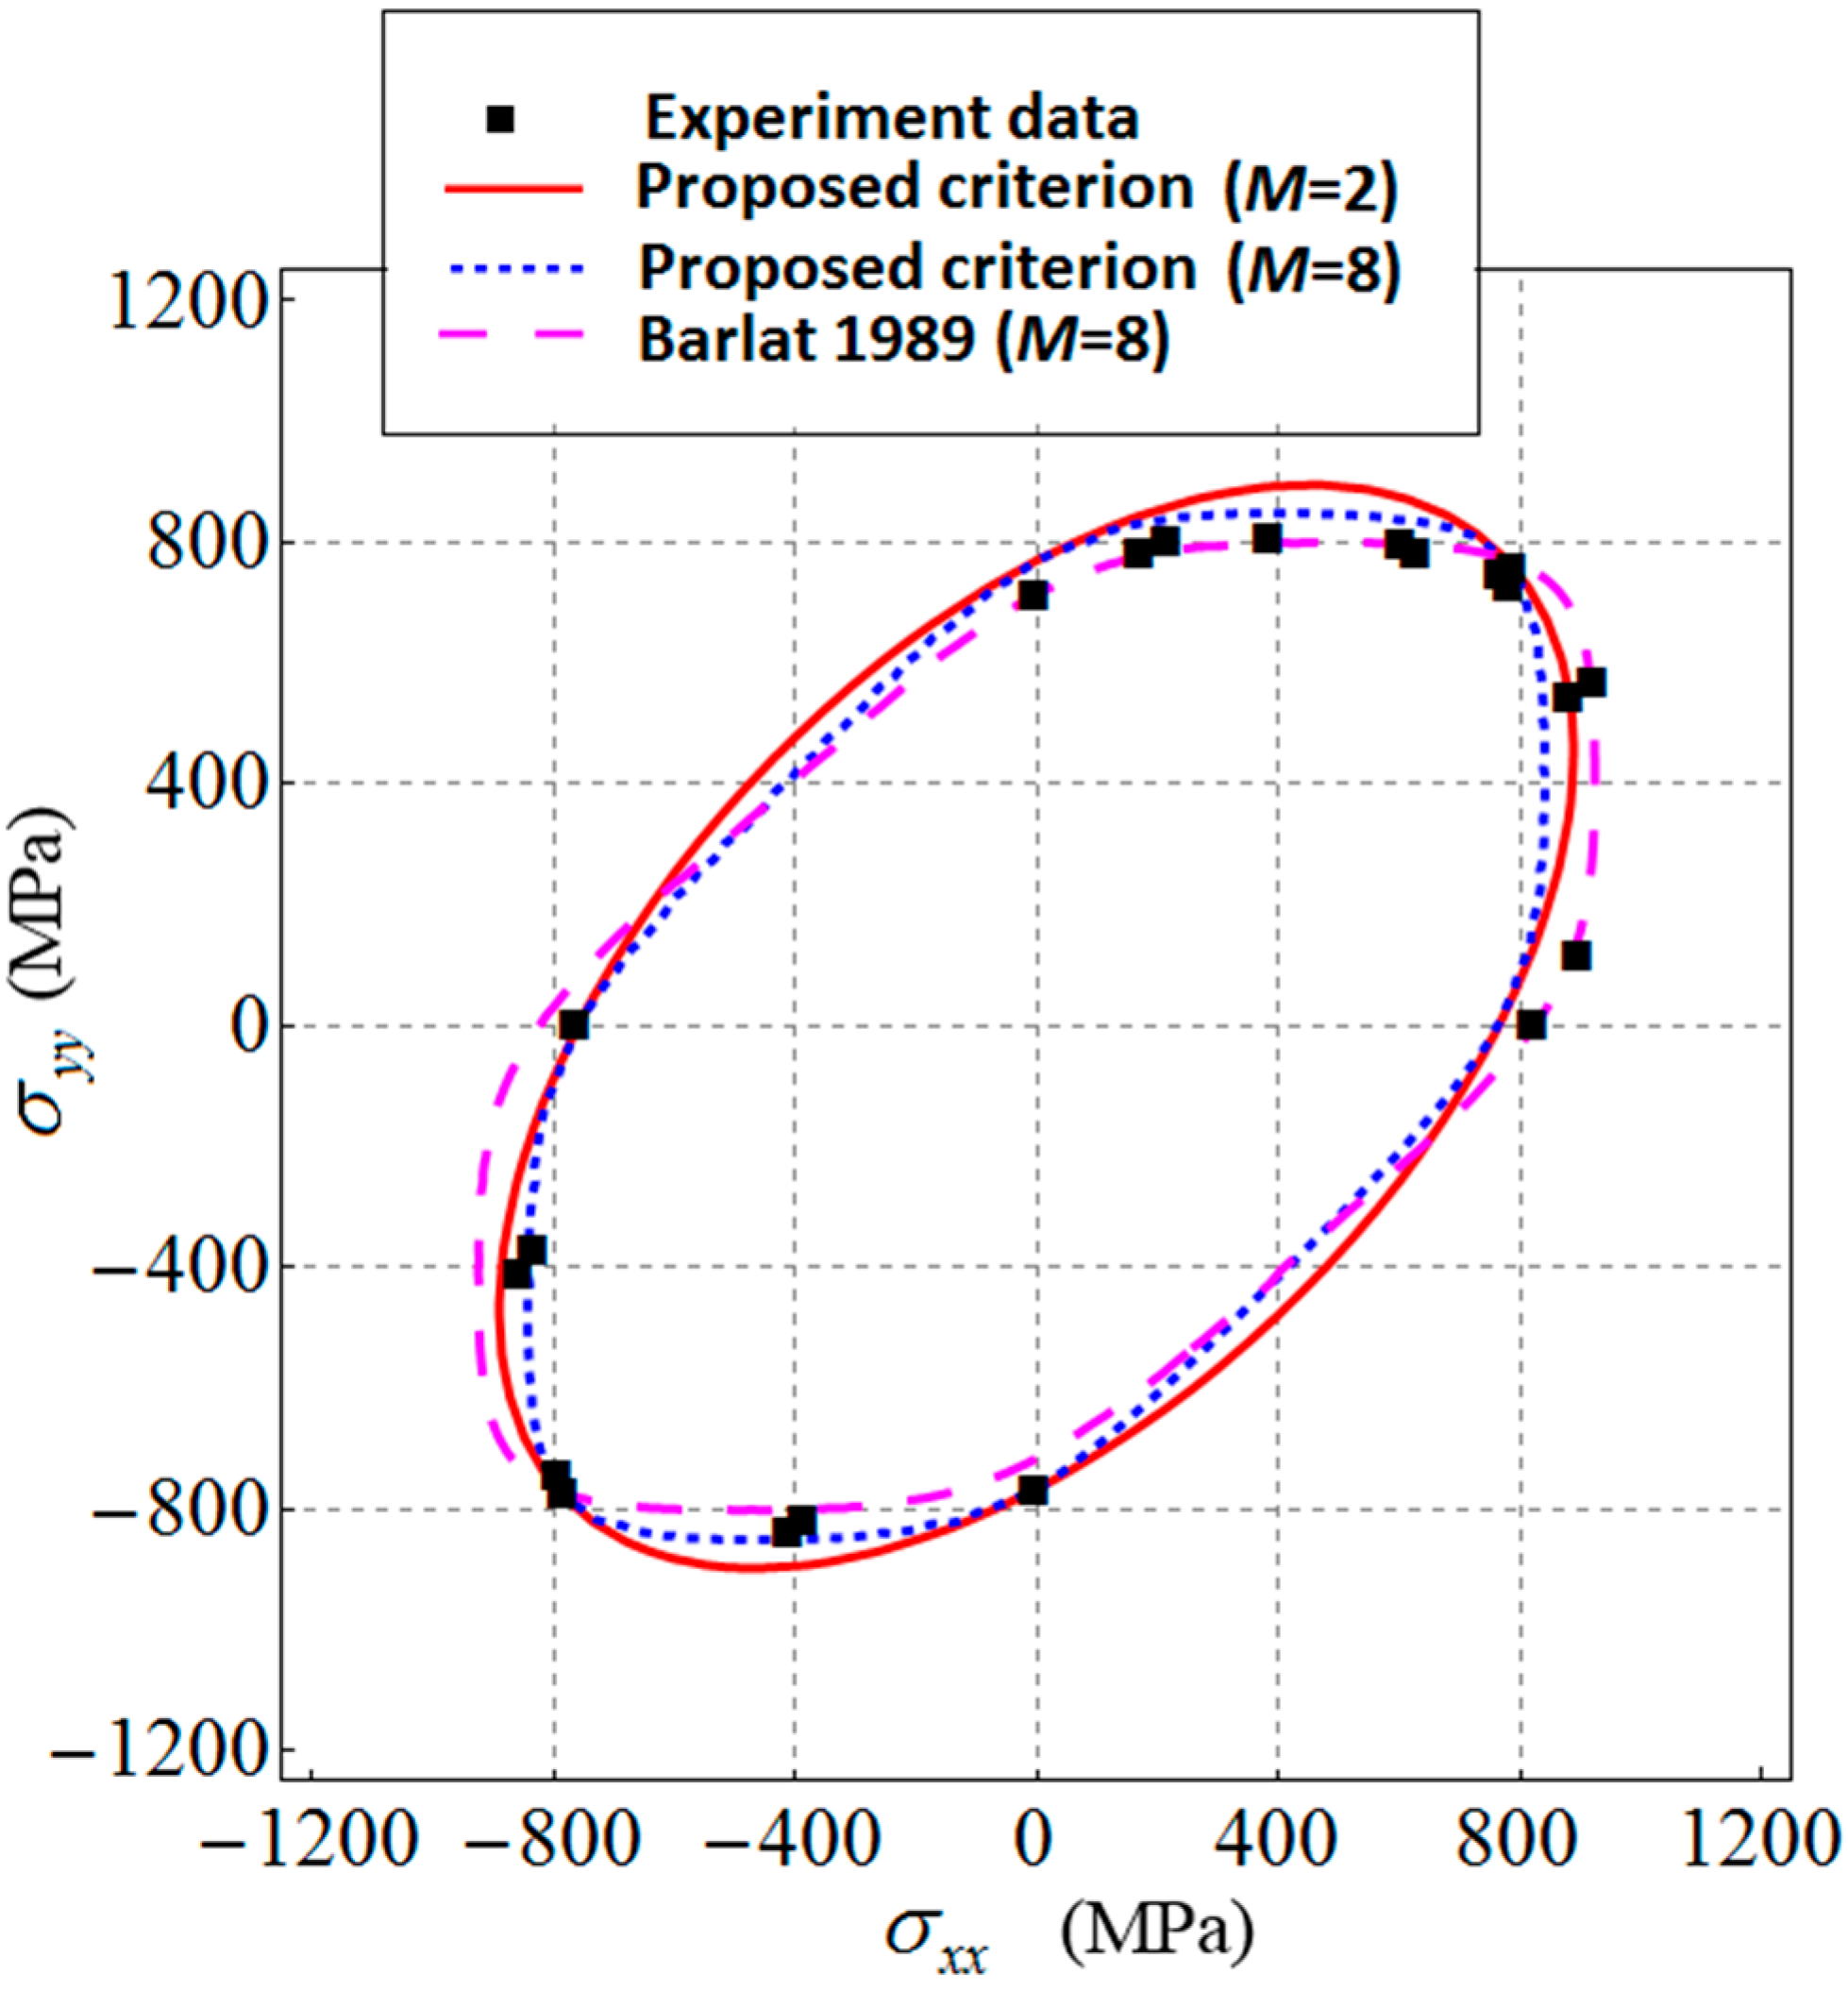
The anisotropic parameters involved in the present theory, with λ calculated using the above equation, are given in Table 7. Figure 10 shows the experimental yield locus of IC10 and the yield locus of the proposed theory. Except for a few experiment points, the predicted yield locus of the current criterion agrees well with the experimental results. In general, the predicted yield locus of the proposed criterion with M = 8 fits the experimental data better than that with M = 2 for most stress states. The prediction accuracy is obviously improved due to the new evaluation of λ .
The yield locus of Barlat (1989) criterion with M = 8 is also plotted in Figure 10 for comparison. The experiment data σ 0 T = 825 MPa, σ 90 T = 715 MPa, and σ b T = 775 MPa are selected as input data to calibrate the yield criterion. The calculated parameters for Barlat (1989) criterion using Equations (19)–(21) are also given in Table 7. As we choose the tensile test data here, rather than the compressive test one, to calculate the parameter h for Barlat (1989) criterion, the value of h is different from that of the proposed criterion. In general, the yield loci of Barlat (1989) criterion fits the experimental data quite well, although some discrepancies are found in some stress states of the biaxial compression area. It should be mentioned that the tensile yield stresses are used here to calibrate the parameters of Barlat’s theory; therefore, the theoretical uniaxial compressive yield stresses do not coincide with experiment data.
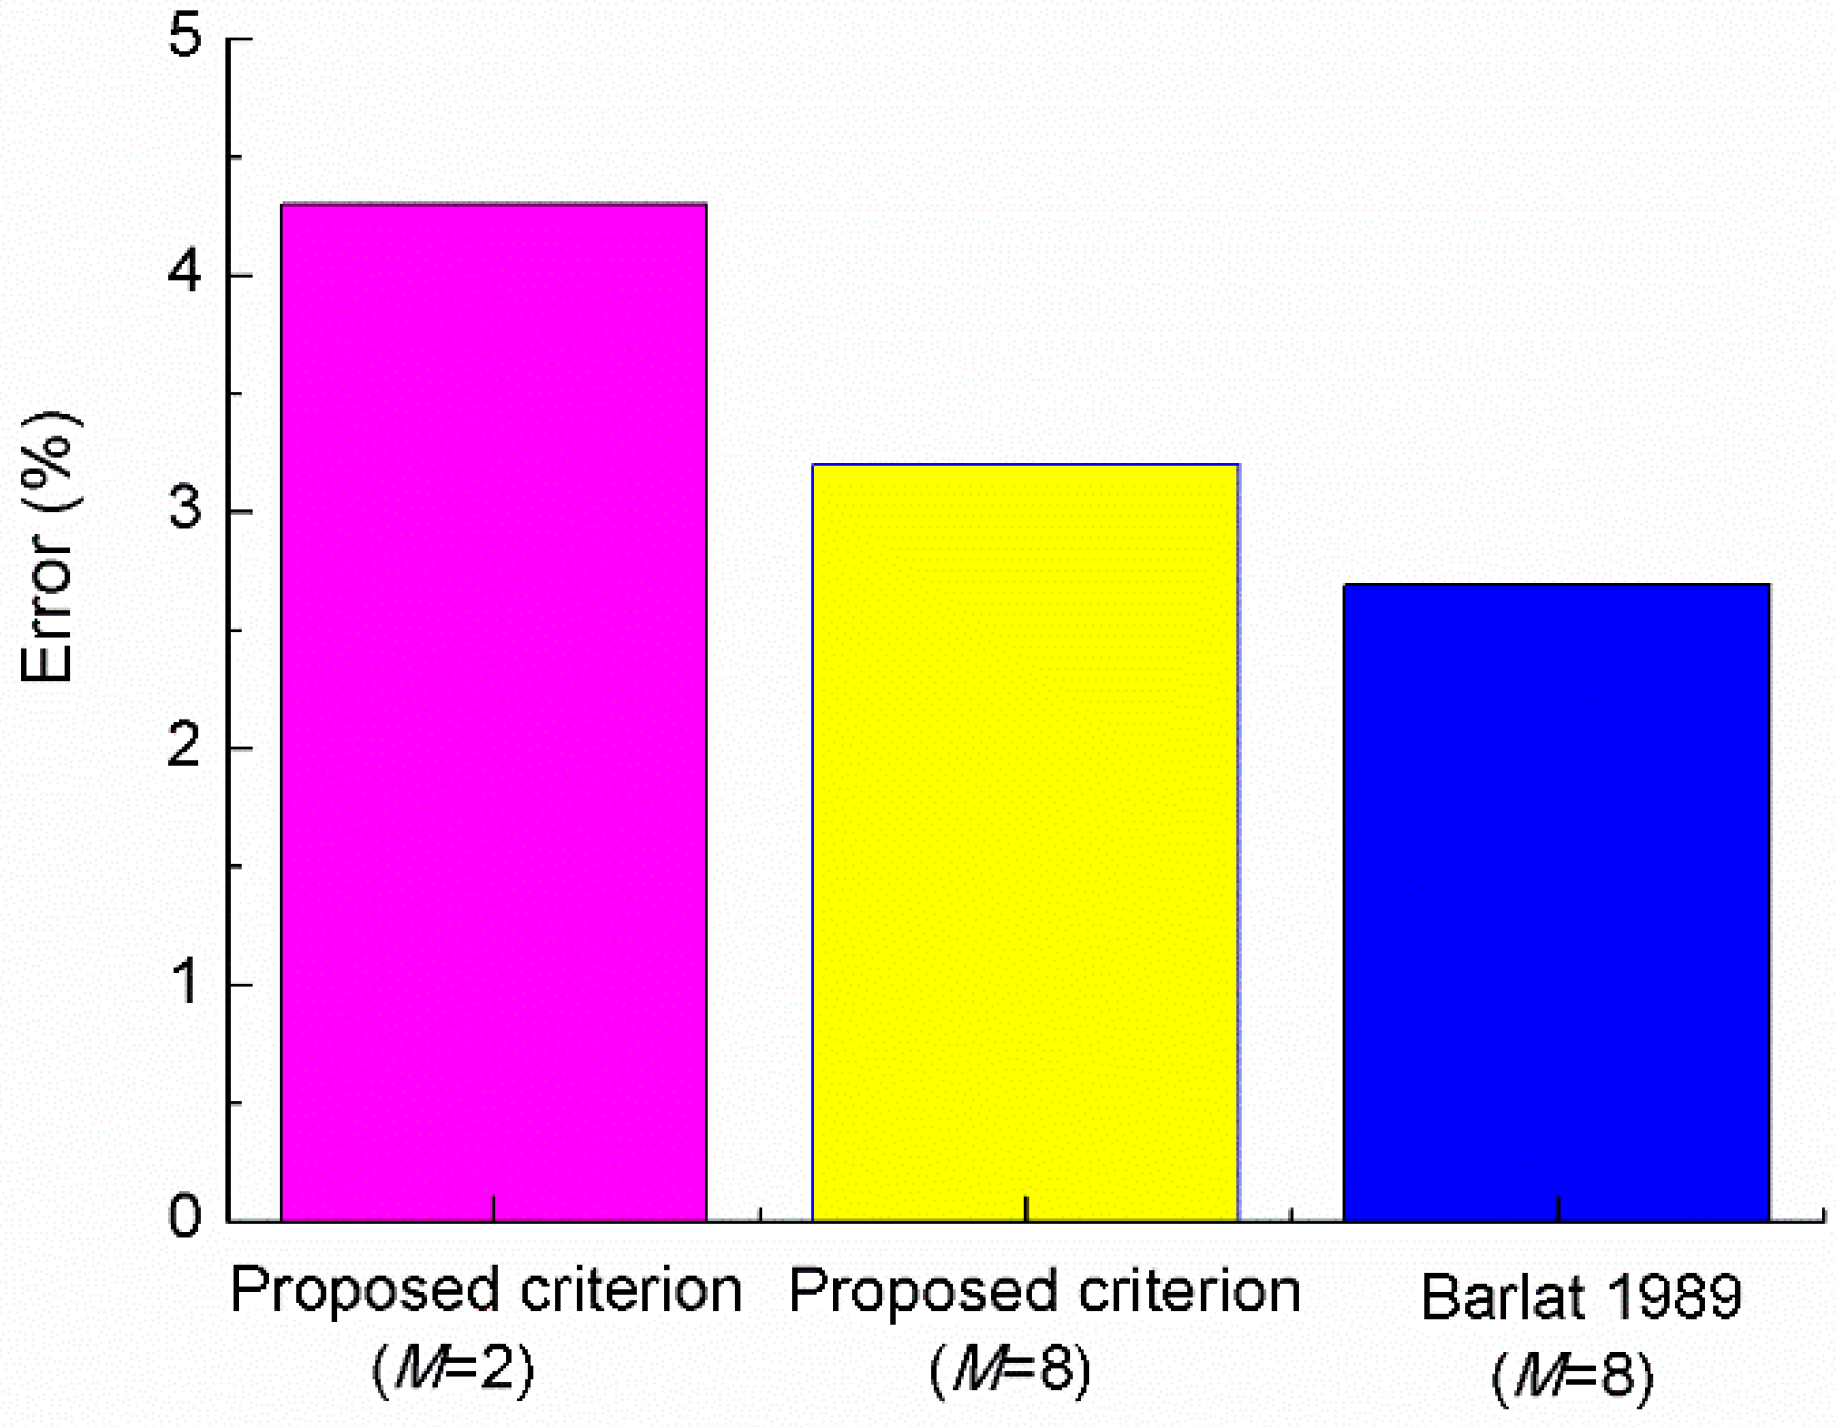
In order to compare the predictive capability quantitatively between each criterion, an error formulation was defined as follows:
E r = 1 n ( i = 1 n d i x i 2 + y i 2 )
where (xi, yi) are the coordinates of experimental data and n is the number of experiment points. The parameter di is defined as:
I.
the difference between experimental value and theoretical prediction in the case of uniaxial stress states;
II.
the normal distance between experimental point and the predicted yield locus in the case of biaxial stress states.
Obviously, Er can be regarded as the average relative error between the experiment points and the theoretical predictions. Figure 11 shows the calculated error Er for different yield criteria. The average relative error is less than 5% for all cases, which indicates all yield functions can predict the yielding behavior of IC10 quit well. The proposed criterion with M = 8 fits the experimental data much better than that with M = 2. Surprisingly, the Barlat (1989) criterion fits the experimental results best. The results may be explained by the special yielding behavior of IC10 as discussed above. For metals with less significant yielding asymmetry, such as IC10, the prediction error is relatively small when using symmetric yield functions.

4.4. Applications to DP980 Steel and 6022-T4 Aluminum

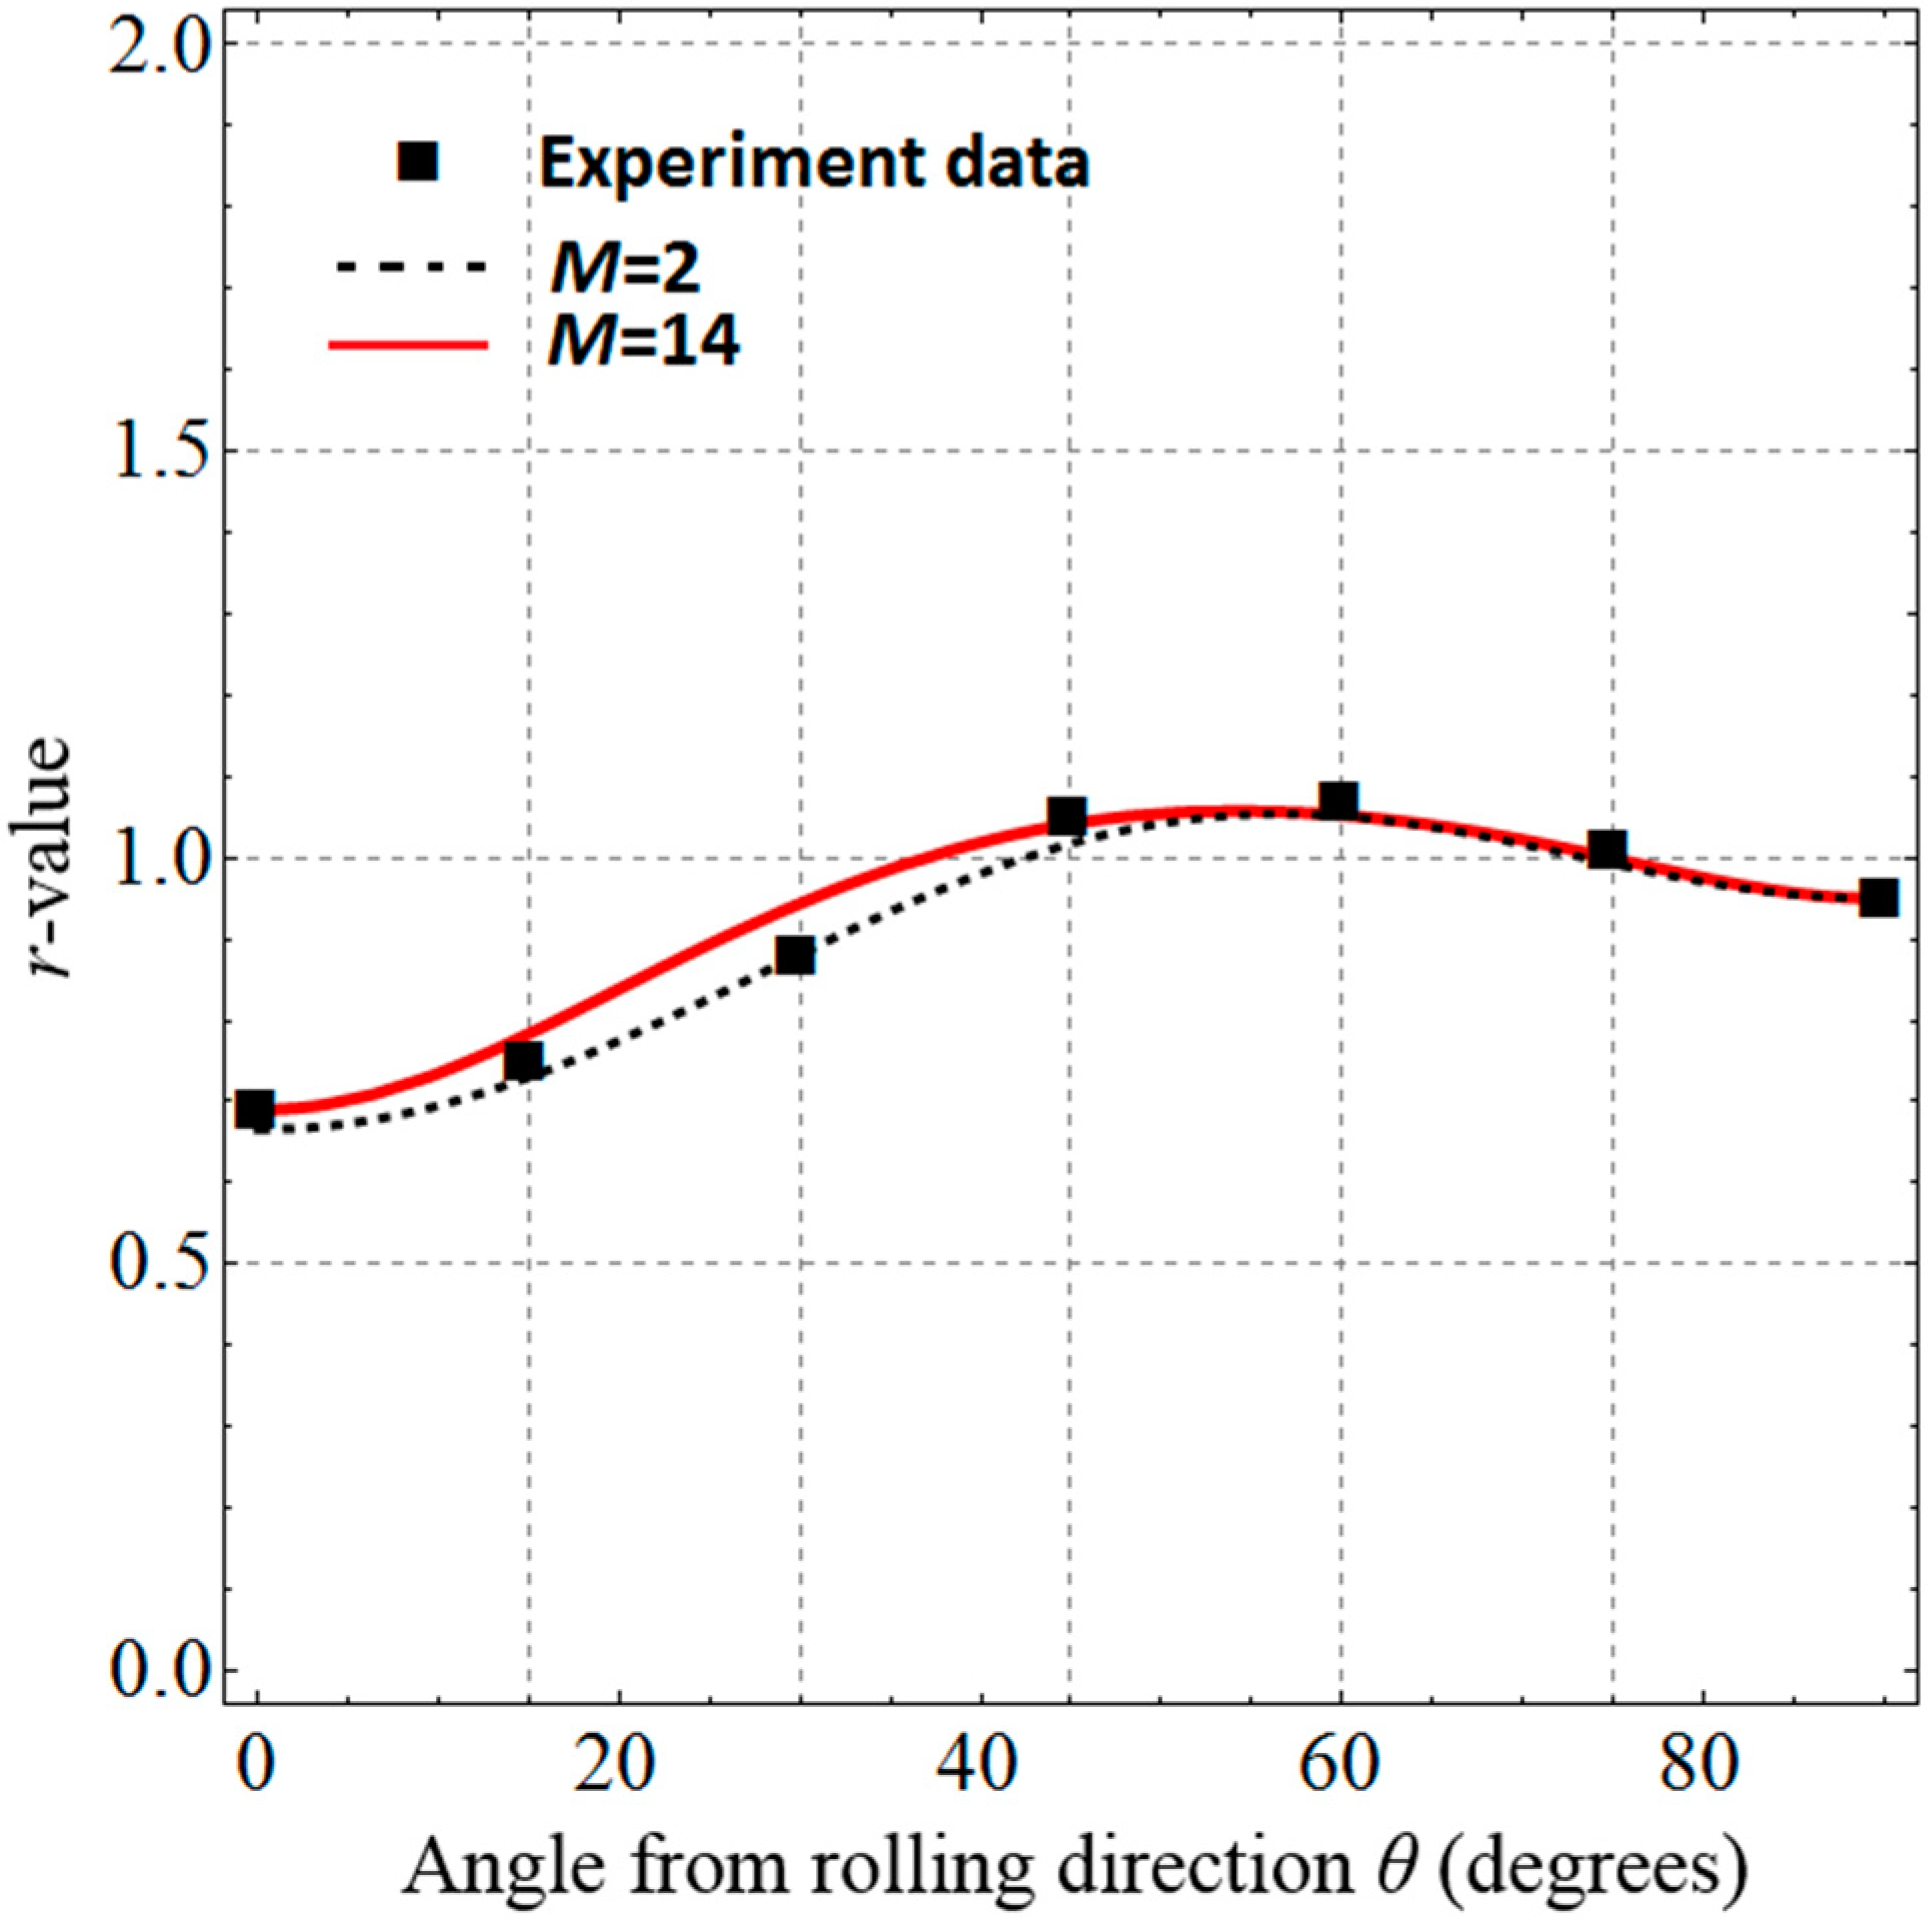
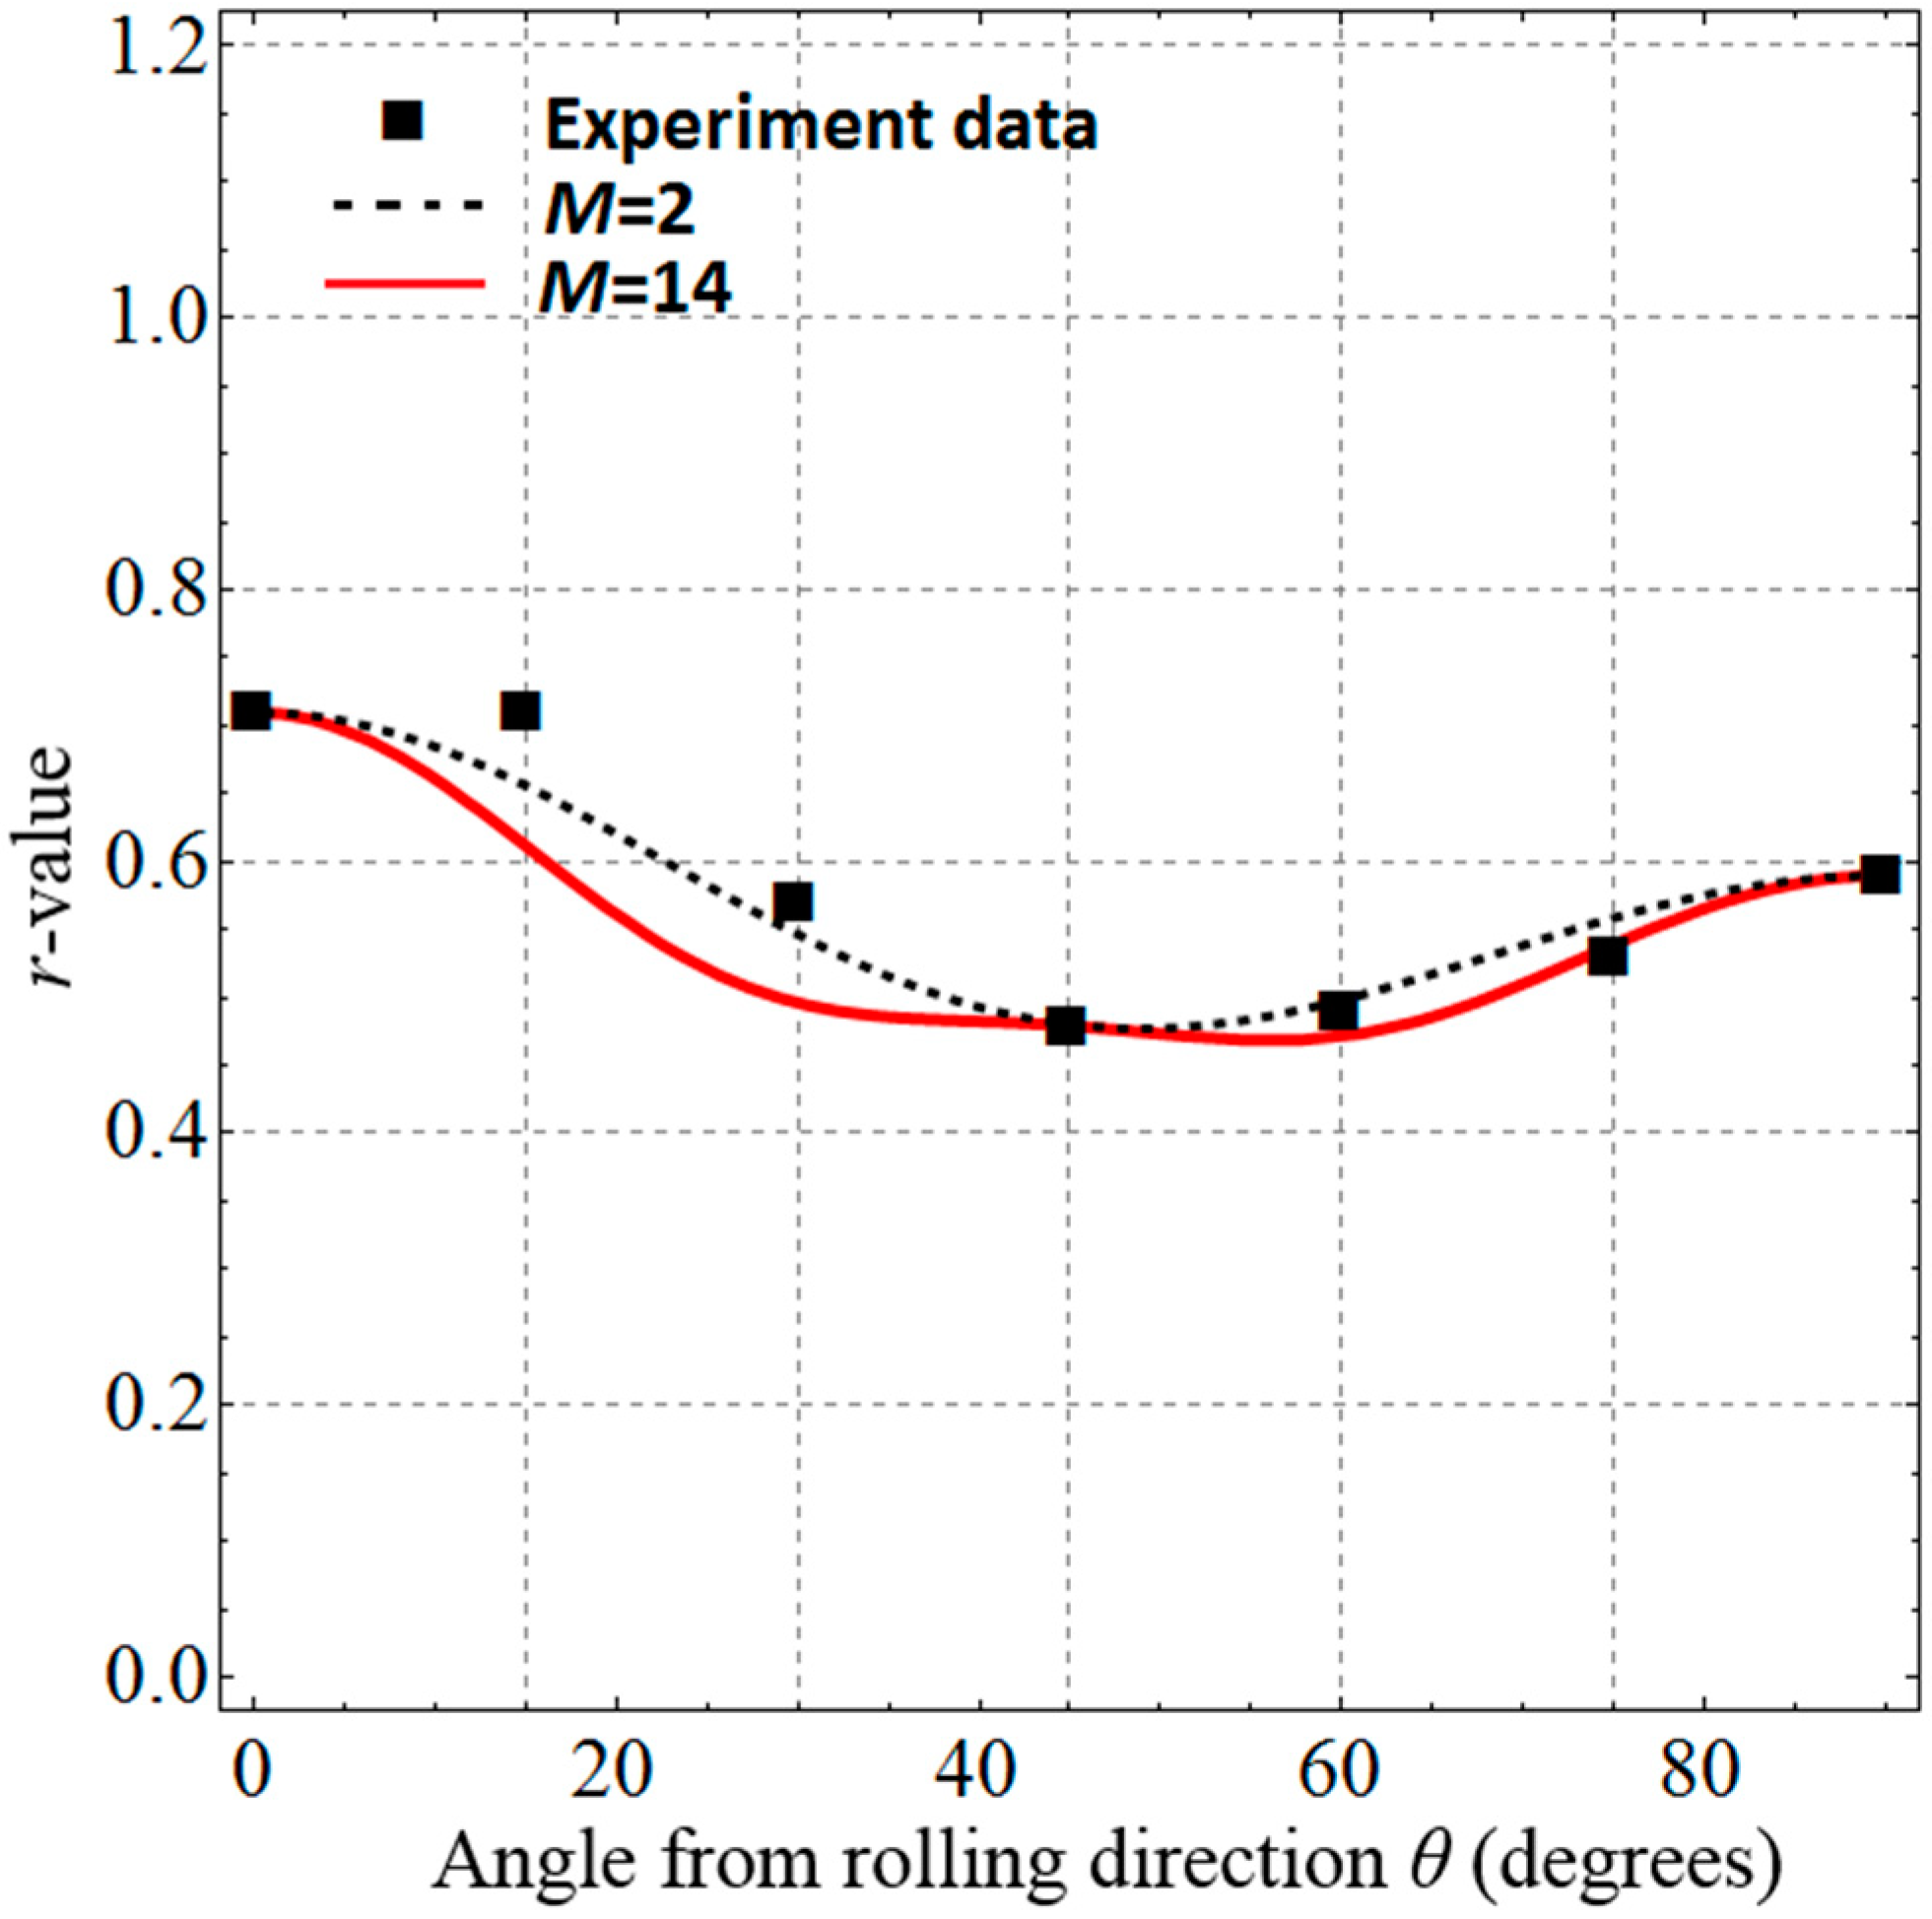
In order to evaluate the ability to model the plastic anisotropy of metals, the proposed yield criterion is applied to textured steel and aluminum alloys. Here, we just focus on the Lankford coefficient (r-value), which can reflect the plastic anisotropy of materials. The first example is textured DP980 steel sheet, whose experimental r-values for seven orientations in the (RD, TD) plane were reported by Hama et al. [49]. In order to calibrate the proposed yield function (Equation (22)), the following experimental data have been selected as input data: r 0 exp = 0.69, r 45 exp = 1.05, r 90 exp = 0.95. The next example is a 6022-T4 aluminum sheet, whose experiment data was taken from Barlat et al. [50]. In order to model the r-values with better accuracy, experimental r-values rather than yield stresses are usually used to determine the coefficents of yield functions. The experiment data: r 0 exp = 0.71, r 45 exp = 0.48, r 90 exp = 0.59 are selected to calculated the coefficients of the proposed criterion. Because of the lack of compressive r-values, equal tensile and compressive r-values are assumed here. As a result, the tension–compression asymmetry coefficient λ equals zero. It should be mentioned that, with λ 0 , the proposed criterion can model different tensile and compressive r-values. The calculated parameters of the proposed criterion using Equation (33) for DP980 steel sheet and 6022-T4 aluminum sheet are given in Table 8 and Table 9, respectively. Note that, for different exponent M, only the value of parameter p changes.
Figure 12 and Figure 13 are shown the comparison between experimental data and the predicted r-values variation with the loading orientation according to the proposed criterion. Results show that the proposed criterion captures the anisotropy in r-values of both DP980 and 6022-T4 very well with M = 2. The proposed criterion with a high value of exponent M underestimates the r-values of 6022-T4 at 15° and 30° with RD.

5. Conclusions

In this study, Barlat’s two famous yield criteria, Barlat (1987) criterion for isotropic materials [20] and Barlat (1989) criterion for anisotropic materials [21], are extended to deal with the cases of tension–compression asymmetry. The novel method originally introduced by Khan [44] is employed to decouple the anisotropy and tension–compression asymmetry characteristics. Therefore, the anisotropic coefficients and the parameters for describing tension–compression asymmetry in the proposed criteria can be determined independently, which is much more convenient to be achieved through experimental data compared with the traditional methods. Moreover, compared to existing theories, the proposed anisotropic yield criterion has a much smaller number of parameters, which is a big advantage for applications.
The effectiveness and flexibility of the new yield criterion have been verified by applying to different materials. Experiment results show that the proposed theory can describe well the asymmetric yielding behavior of Ti-6Al-4V titanium alloy and Ni3Al based super-alloy IC10 under biaxial stress states. In addition, application to Cu-Al-Be SMA shows that the proposed theory can model the transformation onset of the shape memory alloy with high-accuracy. Moreover, the proposed criterion captures the anisotropy in r-values of both DP980 steel and 6022-T4 aluminum very well, showing excellent predictive ability and flexibility.

Author Contributions

Conceptualization, methodology, investigation, writing—original draft preparation, supervision—L.C.; analysis, writing—review and editing, project administration—H.Z.; software, validation, visualization—M.S. All authors have read and agreed to the published version of the manuscript.

Funding

This study was supported by Natural Science Foundation of Jiangsu Province, China (Grant No. BK20160486, No. BK20170521) and Jiangsu University Natural Science Foundation (Grant No. 17KJB130006)

Acknowledgments

The authors gratefully acknowledge Yanshan Lou, Xi’an Jiaotong University, for valuable discussions.

Conflicts of Interest

The authors declare no conflict of interest.

Appendix A. Discussion on the Convexity of the Proposed Yield Function
Convexity of yield surface should be satisfied in modeling the plastic behavior of metals. For yield function with simple expression, convexity of yield surface can be easily checked by assuming that its Hessian matrix is positive semi-definite. However, for anisotropic yield function which contains more parameters and with complex mathematical expression, the convexity requirement would not be easy to check. In this case, the convexity of yield criterion for a specific material can be investigated by graphical method. Khan et al. [44] have adopted this method to check the convexity of the extended Hill (1948) yield criterion.
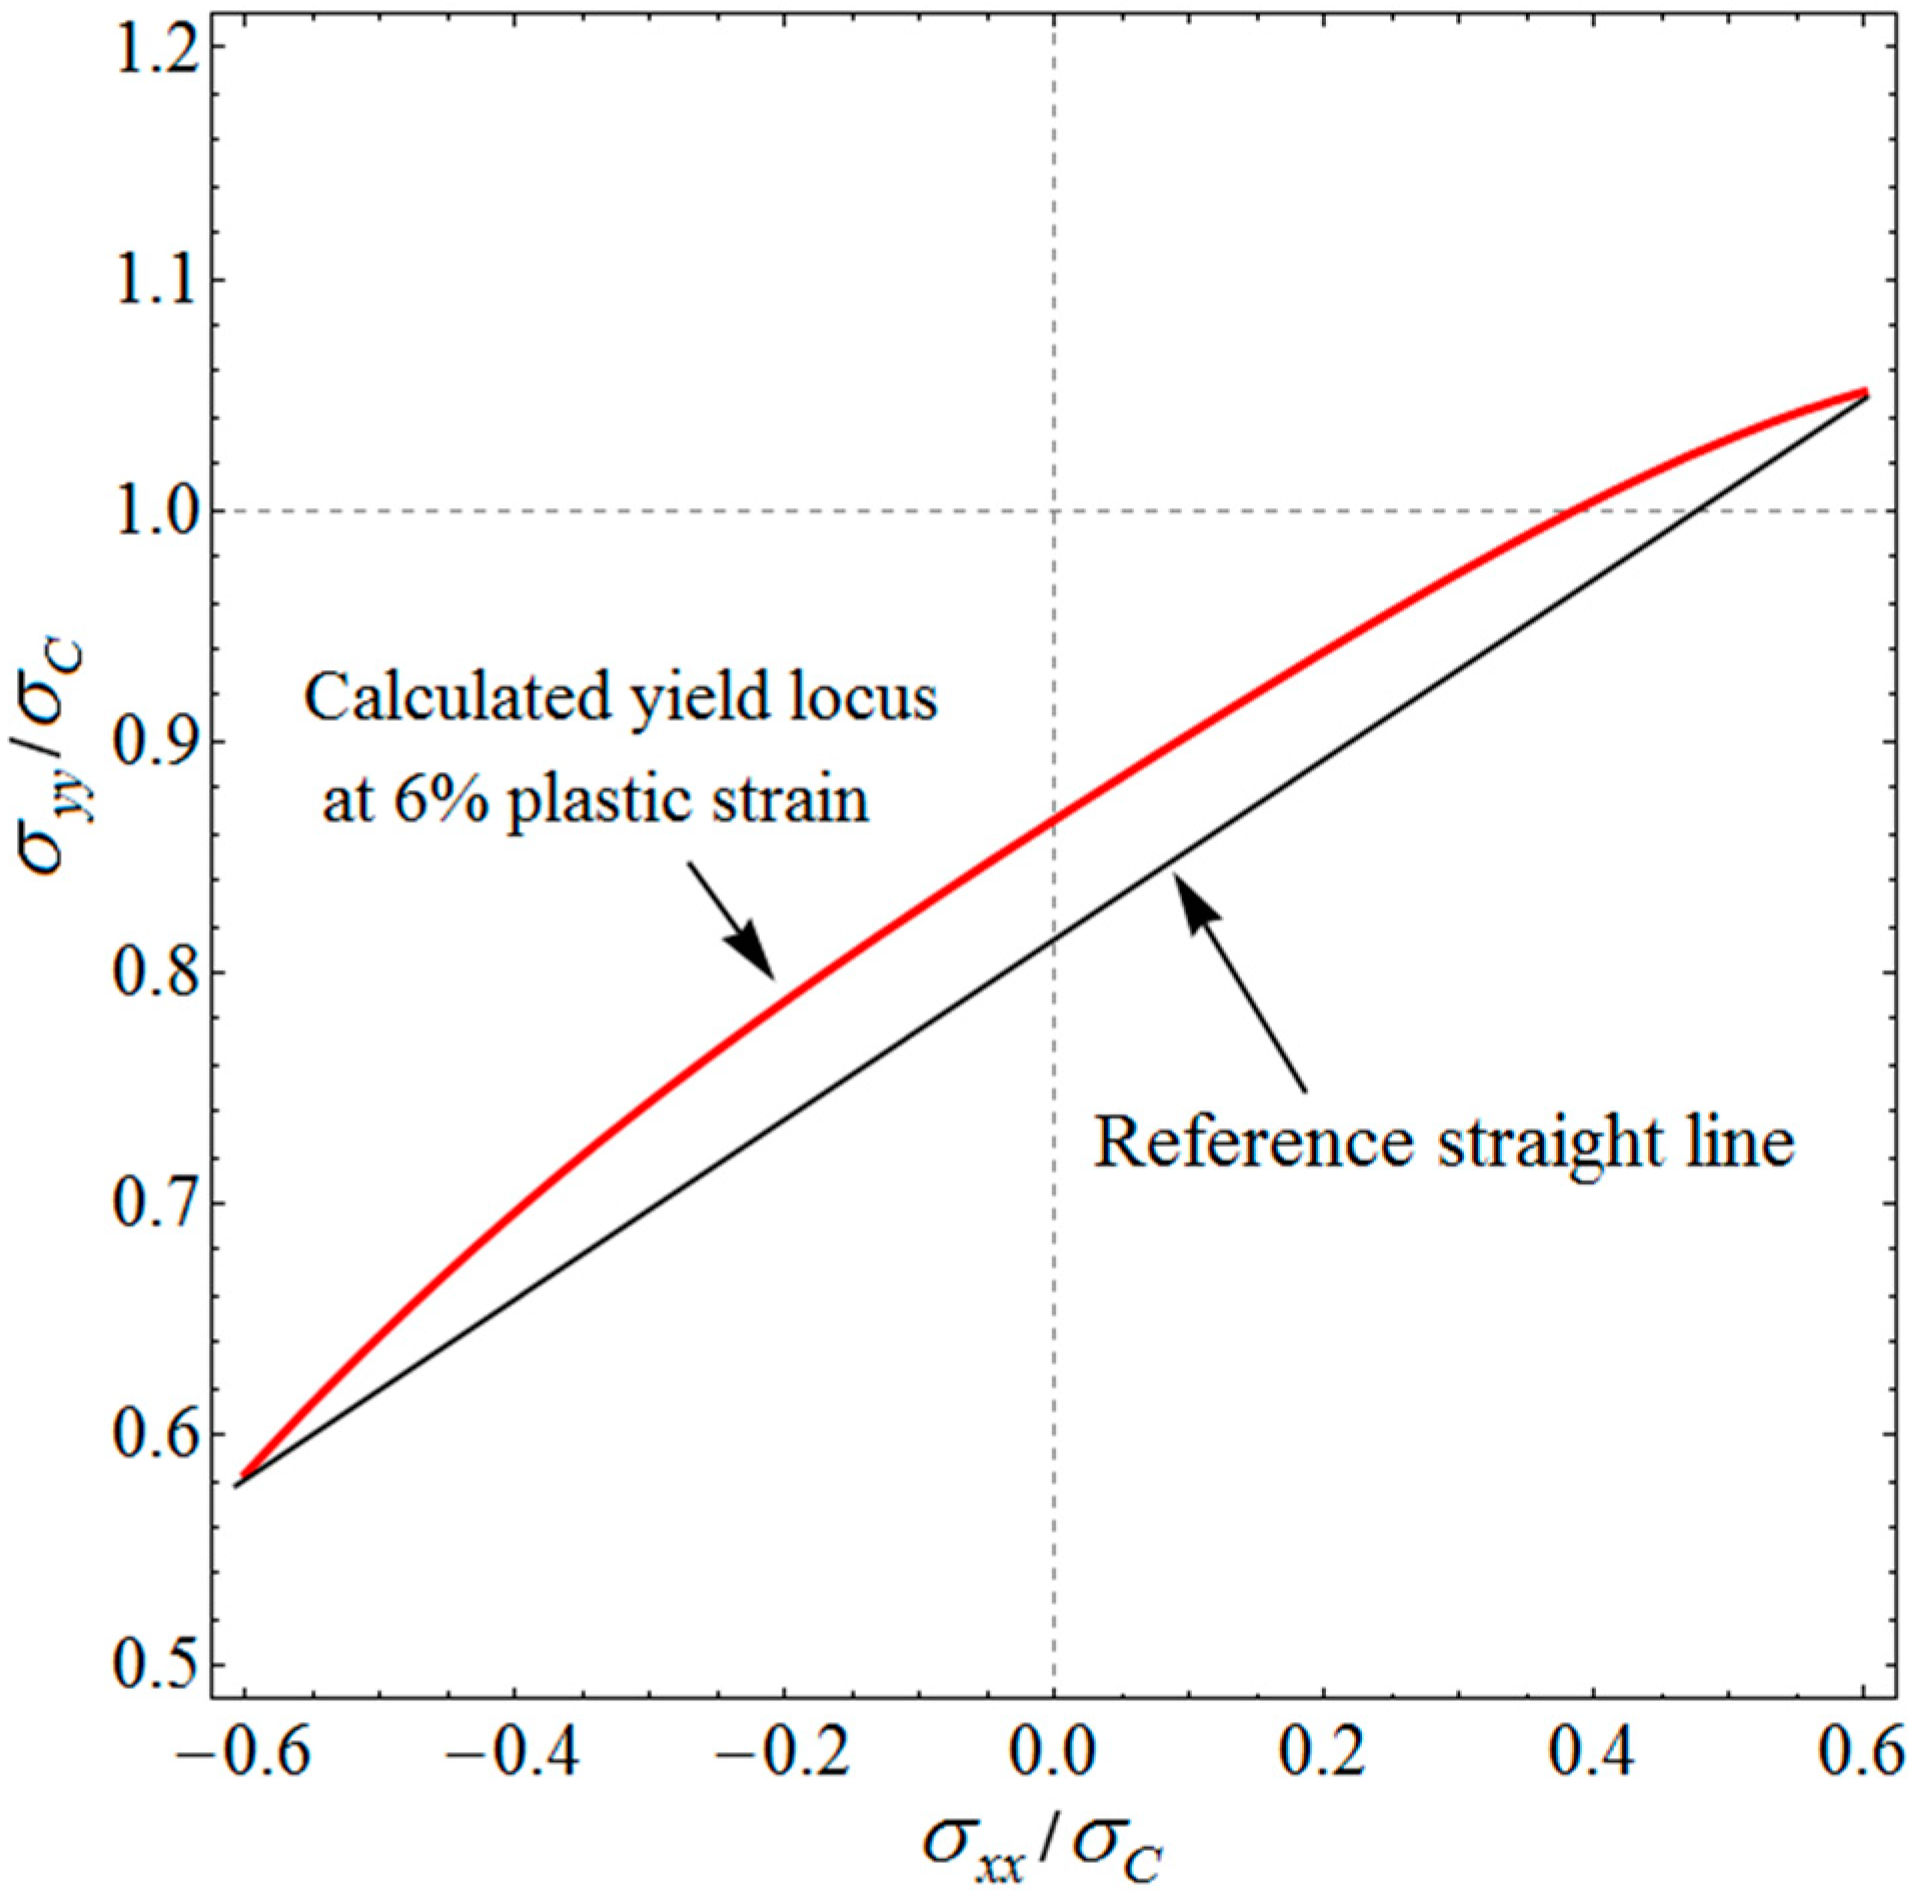
In this research, the convexity of the proposed yield criterion for Ti–6Al–4V alloy will be checked by graphical method. From Figure 7 and Figure A1, it can be seen that the curvature of some segments on yield loci decrease with the increase of plastic strain. This trend is very obvious near the uniaxial tension point along transverse-to-rolling direction. Figure A2 shows the zoomed segment on the yield locus at 6% plastic strain near the uniaxial tension point along transverse-to-rolling direction. In order to check the convexity of yield locus near this area, a reference straight line has been plotted. It can be observed that segments of the yield locus with the smallest curvature are convex. This indicates that the whole yield locus at 6% plastic strain is convex. As the curvature on yield loci increases with the decrease of plastic strain, the yield loci obtained with plastic strain lower than 6% can satisfy the condition of convexity. Based on above discussions, the convexity of the proposed yield function for Ti–6Al–4V can be satisfied in engineering applications.
Figure A1. The calculated yield loci of Ti-6Al-4V by the proposed yield function at different plastic strains.
Metals 10 00713 g0a1
Figure A2. The zoomed segment of the yield locus of the proposed yield function for Ti-6Al-4V at 6% plastic strain.
Metals 10 00713 g0a2
By applying the same method to other materials, it shows that the convexity of the proposed yield function for Cu-Al-Be SMA and Ni3Al based alloy IC10 can be satisfied in engineering applications too.

References

  1. Gantar, G.; Pepelnjak, T.; Kuzman, K. Optimization of sheet metal forming processes by the use of numerical simulations. J. Mater. Process. Technol. 2002, 130, 54–59. [Google Scholar] [CrossRef]
  2. Yang, H.; Fan, X.G.; Sun, Z.C.; Guo, L.G.; Zhan, M. Recent developments in plastic forming technology of titanium alloys. Sci. China Technol. Sci. 2011, 54, 490–501. [Google Scholar]
  3. Zhang, F.F.; Chen, J.S.; Chen, J.; Huang, X.Z.; Lu, J. Review on development and experimental validation for anisotropic yield criterions. Adv. Mech. 2012, 42, 68–80. (In Chinese) [Google Scholar]
  4. Drucker, D.C. Relation of experiments to mathematical theories of plasticity. J. Appl. Mech. 1949, 16, 349–357. [Google Scholar]
  5. Hershey, A.V. The plasticity of an isotropic aggregate of anisotropic face centered cubic crystals. J. Appl. Mech. Trans. ASME 1954, 21, 241–249. [Google Scholar]
  6. Yu, M.H.; He, L.N.; Song, L.Y. Twin shear stress strength theory and its generalization. Sci. China Ser. A 1985, 12, 1113–1120. (In Chinese) [Google Scholar]
  7. Zhang, S.H.; Guan, M.; Wu, G.J.; Gao, S.W.; Chen, X.D. An ellipsoidal yield criterion for porous metals with accurate descriptions of theoretical strength and Poisson’s ratio. Acta Mech. 2017, 228, 4199–4210. [Google Scholar] [CrossRef]
  8. Cazacu, O. New yield criteria for isotropic and textured metallic materials. Int. J. Solids Struct. 2018, 139–140, 200–210. [Google Scholar] [CrossRef]
  9. Zhang, S.H.; Jiang, X.R.; Xiang, C.C.; Deng, L.; Li, Y.X. Proposal and application of a new yield criterion for metal plastic deformation. Arch. Appl. Mech. 2020. [Google Scholar] [CrossRef]
  10. Hill, R. A theory of the yielding and plastic flow of anisotropic metals. Proc. Soc. London A 1948, 193, 281–297. [Google Scholar]
  11. Banabic, D. Anisotropy of Sheet Metal. In Formability of Metallic Materials; Banabic, D., Ed.; Springer: Berlin, Germany, 2000; pp. 119–172. [Google Scholar]
  12. Yu, M.H. Advances in strength theories for materials under complex stress state in the 20th Century. Appl. Mech. Rev. 2002, 55, 198–218. [Google Scholar] [CrossRef]
  13. Hill, R. Theoretical plasticity of textured aggregates. Math. Proc. Camb. Phil. Soc. 1979, 85, 179–191. [Google Scholar] [CrossRef]
  14. Hill, R. Constitutive modelling of orthotropic plasticity in sheet metals. J. Mech. Phys. Solids 1990, 38, 405–417. [Google Scholar] [CrossRef]
  15. Hill, R. A user-friendly theory of orthotropic plasticity in sheet metals. Int. J. Mech. Sci. 1993, 35, 19–25. [Google Scholar] [CrossRef]
  16. Hill, R.; Hecker, S.S.; Stout, M.G. An investigation of plastic flow and differential work hardening in orthotropic brass tubes under fluid pressure and axial load. Int. J. Solids Struct. 1994, 31, 2999–3021. [Google Scholar] [CrossRef]
  17. Hosford, W.F. Texture strengthening. Met. Eng. Quart. 1966, 6, 13–19. [Google Scholar]
  18. Hosford, W.F. A generalized isotropic yield criterion. J. Appl. Mech. 1972, 39, 607–609. [Google Scholar] [CrossRef]
  19. Hosford, W.F.; Allen, T.J. Twining and directional slip as a cause for strength differential effect. Met. Trans. 1973, 4, 1424–1425. [Google Scholar] [CrossRef]
  20. Barlat, F.; Richmond, O. Prediction of tricomponent plane stress yield surfaces and associated flow and failure behavior of strongly textured F.C.C. polycrystalline sheets. Mater. Sci. Eng. 1987, 95, 15–29. [Google Scholar] [CrossRef]
  21. Barlat, F.; Lian, J. Plastic behavior and stretchability of sheet Metals. Part I: Yield function for orthotropic sheets under plane stress conditions. Int. J. Plast. 1989, 5, 51–66. [Google Scholar] [CrossRef]
  22. Barlat, F.; Lege, D.J.; Brem, J.C. A six-component yield function for anisotropic materials. Int. J. Plast. 1991, 7, 693–712. [Google Scholar] [CrossRef]
  23. Barlat, F.; Brem, J.C.; Yoon, J.W.; Chung, K.; Dicke, R.E.; Lege, D.J.; Pourboghrat, F.; Choi, S.H.; Chuh, E. Plane stress yield function for aluminum alloy sheets—Part 1: Theory. Int. J. Plast. 2003, 19, 1297–1319. [Google Scholar] [CrossRef]
  24. Barlat, F.; Yoon, J.W.; Cazacu, O. On linear transformations of stress tensors for the description of plastic anisotropy. Int. J. Plast. 2007, 23, 876–896. [Google Scholar] [CrossRef]
  25. Cazacu, O. New mathematical results and explicit expressions in terms of the stress components of Barlat et al. (1991) orthotropic yield criterion. Int. J. Solids Struct. 2019, 176, 86–95. [Google Scholar] [CrossRef]
  26. Gröger, R.; Vitek, V. Impact of non-Schmid stress components present in the yield criterion for bcc metals on the activity of {110}<111> slip systems. Comput. Mater. Sci. 2019, 159, 297–305. [Google Scholar] [CrossRef]
  27. Liu, W.C.; Chen, B.K.; Pang, Y. Numerical investigation of evolution of earing, anisotropic yield and plastic potentials in cold rolled FCC aluminum alloy based on the crystallographic texture measurements. Eur. J. Mech. A Solids 2019, 75, 41–55. [Google Scholar] [CrossRef]
  28. Lou, Y.S.; Yoon, J.W. Alternative approach to model ductile fracture by incorporating anisotropic yield function. Int. J. Solids Struct. 2019, 164, 12–24. [Google Scholar] [CrossRef]
  29. Wang, X.S.; Hu, W.L.; Huang, S.J.; Ding, R. Experimental investigations on extruded 6063 aluminum alloy tubes under complex tension–compression stress states. Int. J. Solids Struct. 2019, 168, 123–137. [Google Scholar] [CrossRef]
  30. Cazacu, O. New expressions and calibration strategies for Karafillis and Boyce (1993) yield criterion. Int. J. Solids Struct. 2020, 186, 410–422. [Google Scholar] [CrossRef]
  31. Ezz, S.S.; Pope, D.P.; Paidar, V. The tension/compression flow stress asymmetry in Ni3 (Al, Nb) single crystals. Acta Metall. 1982, 30, 921–926. [Google Scholar] [CrossRef]
  32. Cazacu, O.; Barlat, F. A criterion for description of anisotropy and yield differential effects in pressure-insensitive metals. Int. J. Plast. 2004, 20, 2027–2045. [Google Scholar] [CrossRef]
  33. Plunkett, B.; Cazacu, O.; Barlat, F. Orthotropic yield criteria for description of the anisotropy in tension and com-pression of sheet metals. Int. J. Plast. 2008, 24, 847–866. [Google Scholar] [CrossRef]
  34. Cazacu, O.; Ioan, R.I.; Yoon, J.W. Orthotropic strain rate potential for the description of anisotropy in tension and compression of metals. Int. J. Plast. 2010, 26, 887–904. [Google Scholar] [CrossRef]
  35. Lou, Y.S.; Huh, H.; Yoon, J.W. Consideration of strength differential effect in sheet metals with symmetric yield functions. Int. J. Mech. Sci. 2013, 66, 214–223. [Google Scholar] [CrossRef]
  36. Chen, L.; Wen, W.D.; Cui, H.T. Generalization of Hill’s yield criterion to tension–compression asymmetry materials. Sci. China Technol. Sci. 2013, 56, 89–97. [Google Scholar] [CrossRef]
  37. Cazacu, O.; Stewart, J.B. Analytical criterion for porous solids containing cylindrical voids in an incompressible matrix exhibiting tension–compression asymmetry. Philos. Mag. 2013, 93, 1520–1548. [Google Scholar] [CrossRef]
  38. Yoon, J.W.; Lou, Y.S.; Yoon, J.H.; Glazoff, M.V. Asymmetric yield function based on the stress invariants for pressure sensitive metals. Int. J. Plast. 2014, 56, 184–202. [Google Scholar] [CrossRef]
  39. Tang, B.T.; Wang, Z.M.; Guo, N.; Wang, Q.L.; Liu, P.X. An Extended Drucker Yield Criterion to Consider Tension–Compression Asymmetry and Anisotropy on Metallic Materials: Modeling and Verification. Metals 2020, 10, 20. [Google Scholar] [CrossRef] [Green Version]
  40. Verma, R.K.; Kuwabara, T.; Chung, K.; Haldar, A. Experimental evaluation and constitutive modeling of non-proportional deformation for asymmetric steels. Int. J. Plast. 2011, 27, 82–101. [Google Scholar] [CrossRef]
  41. Steglich, D.; Brocks, W.; Bohlen, J.; Barlat, F. Modeling direction-dependent hardening in magnesium sheet forming simulations. Int. J. Mater Form. 2011, 4, 243–253. [Google Scholar] [CrossRef] [Green Version]
  42. Andar, M.O.; Kuwabara, T.; Steglich, D. Material modeling of AZ31 Mg sheet considering variation of r-values and asymmetry of the yield locus. Mater. Sci. Eng. A 2012, 549, 82–92. [Google Scholar] [CrossRef]
  43. Abedini, A.; Butcher, C.; Worswick, M.J. Application of an Evolving Non-Associative Anisotropic-Asymmetric Plasticity Model for a Rare-Earth Magnesium Alloy. Metals 2018, 8, 1013. [Google Scholar] [CrossRef] [Green Version]
  44. Khan, A.S.; Yu, S.J.; Liu, H.W. Deformation induced anisotropic responses of Ti–6Al–4V alloy Part II: A strain rate and temperature dependent anisotropic yield criterion. Int. J. Plast. 2012, 7, 14–26. [Google Scholar] [CrossRef]
  45. Khan, A.S.; Yu, S.J. Deformation induced anisotropic responses of Ti–6Al–4V alloy, Part I: Experiments. Int. J. Plast. 2012, 38, 1–13. [Google Scholar] [CrossRef]
  46. Bouvet, C.; Calloch, S.; Lexcellent, C. Mechanical behavior of a Cu–Al–Be shape memory alloy under multiaxial proportional and non-proportional loadings. J. Eng. Mater. Technol. 2002, 124, 112–124. [Google Scholar] [CrossRef]
  47. Zhao, X.H.; Huang, Z.H.; Tan, Y.N.; Zhang, Q.; Jia, X.Y.; Xu, H.B. New Ni3Al-based directionally-solidified superalloy IC10. J. Aeronaut. Mater. 2006, 26, 20–24. (In Chinese) [Google Scholar]
  48. Chen, L.; Wen, W.D.; Cui, H.T. Yielding description for a Ni3Al based intermetallic alloy. Mater Des. 2012, 41, 192–197. [Google Scholar] [CrossRef]
  49. Hama, T.; Kuroda, M.; Kuwabara, T.; Takahashi, S.; Yamanaka, A. DP980 material characterization for benchmark 1 of Numisheet 2018. In Proceedings of the 11th International Conference and Workshop on Numerical Simulation of 3D Sheet Metal Forming Processes, Tokyo, Japan, 30 July–3 August 2018. [Google Scholar]
  50. Barlat, F.; Maeda, Y.; Chung, K.; Yanagawa, M.; Brem, J.C.; Hayashida, Y.; Lege, D.J.; Matsui, K.; Murtha, S.J.; Hattori, S.; et al. Yield function development for aluminum alloy sheets. J. Mech. Phys. Solids 1997, 45, 1727–1763. [Google Scholar] [CrossRef]
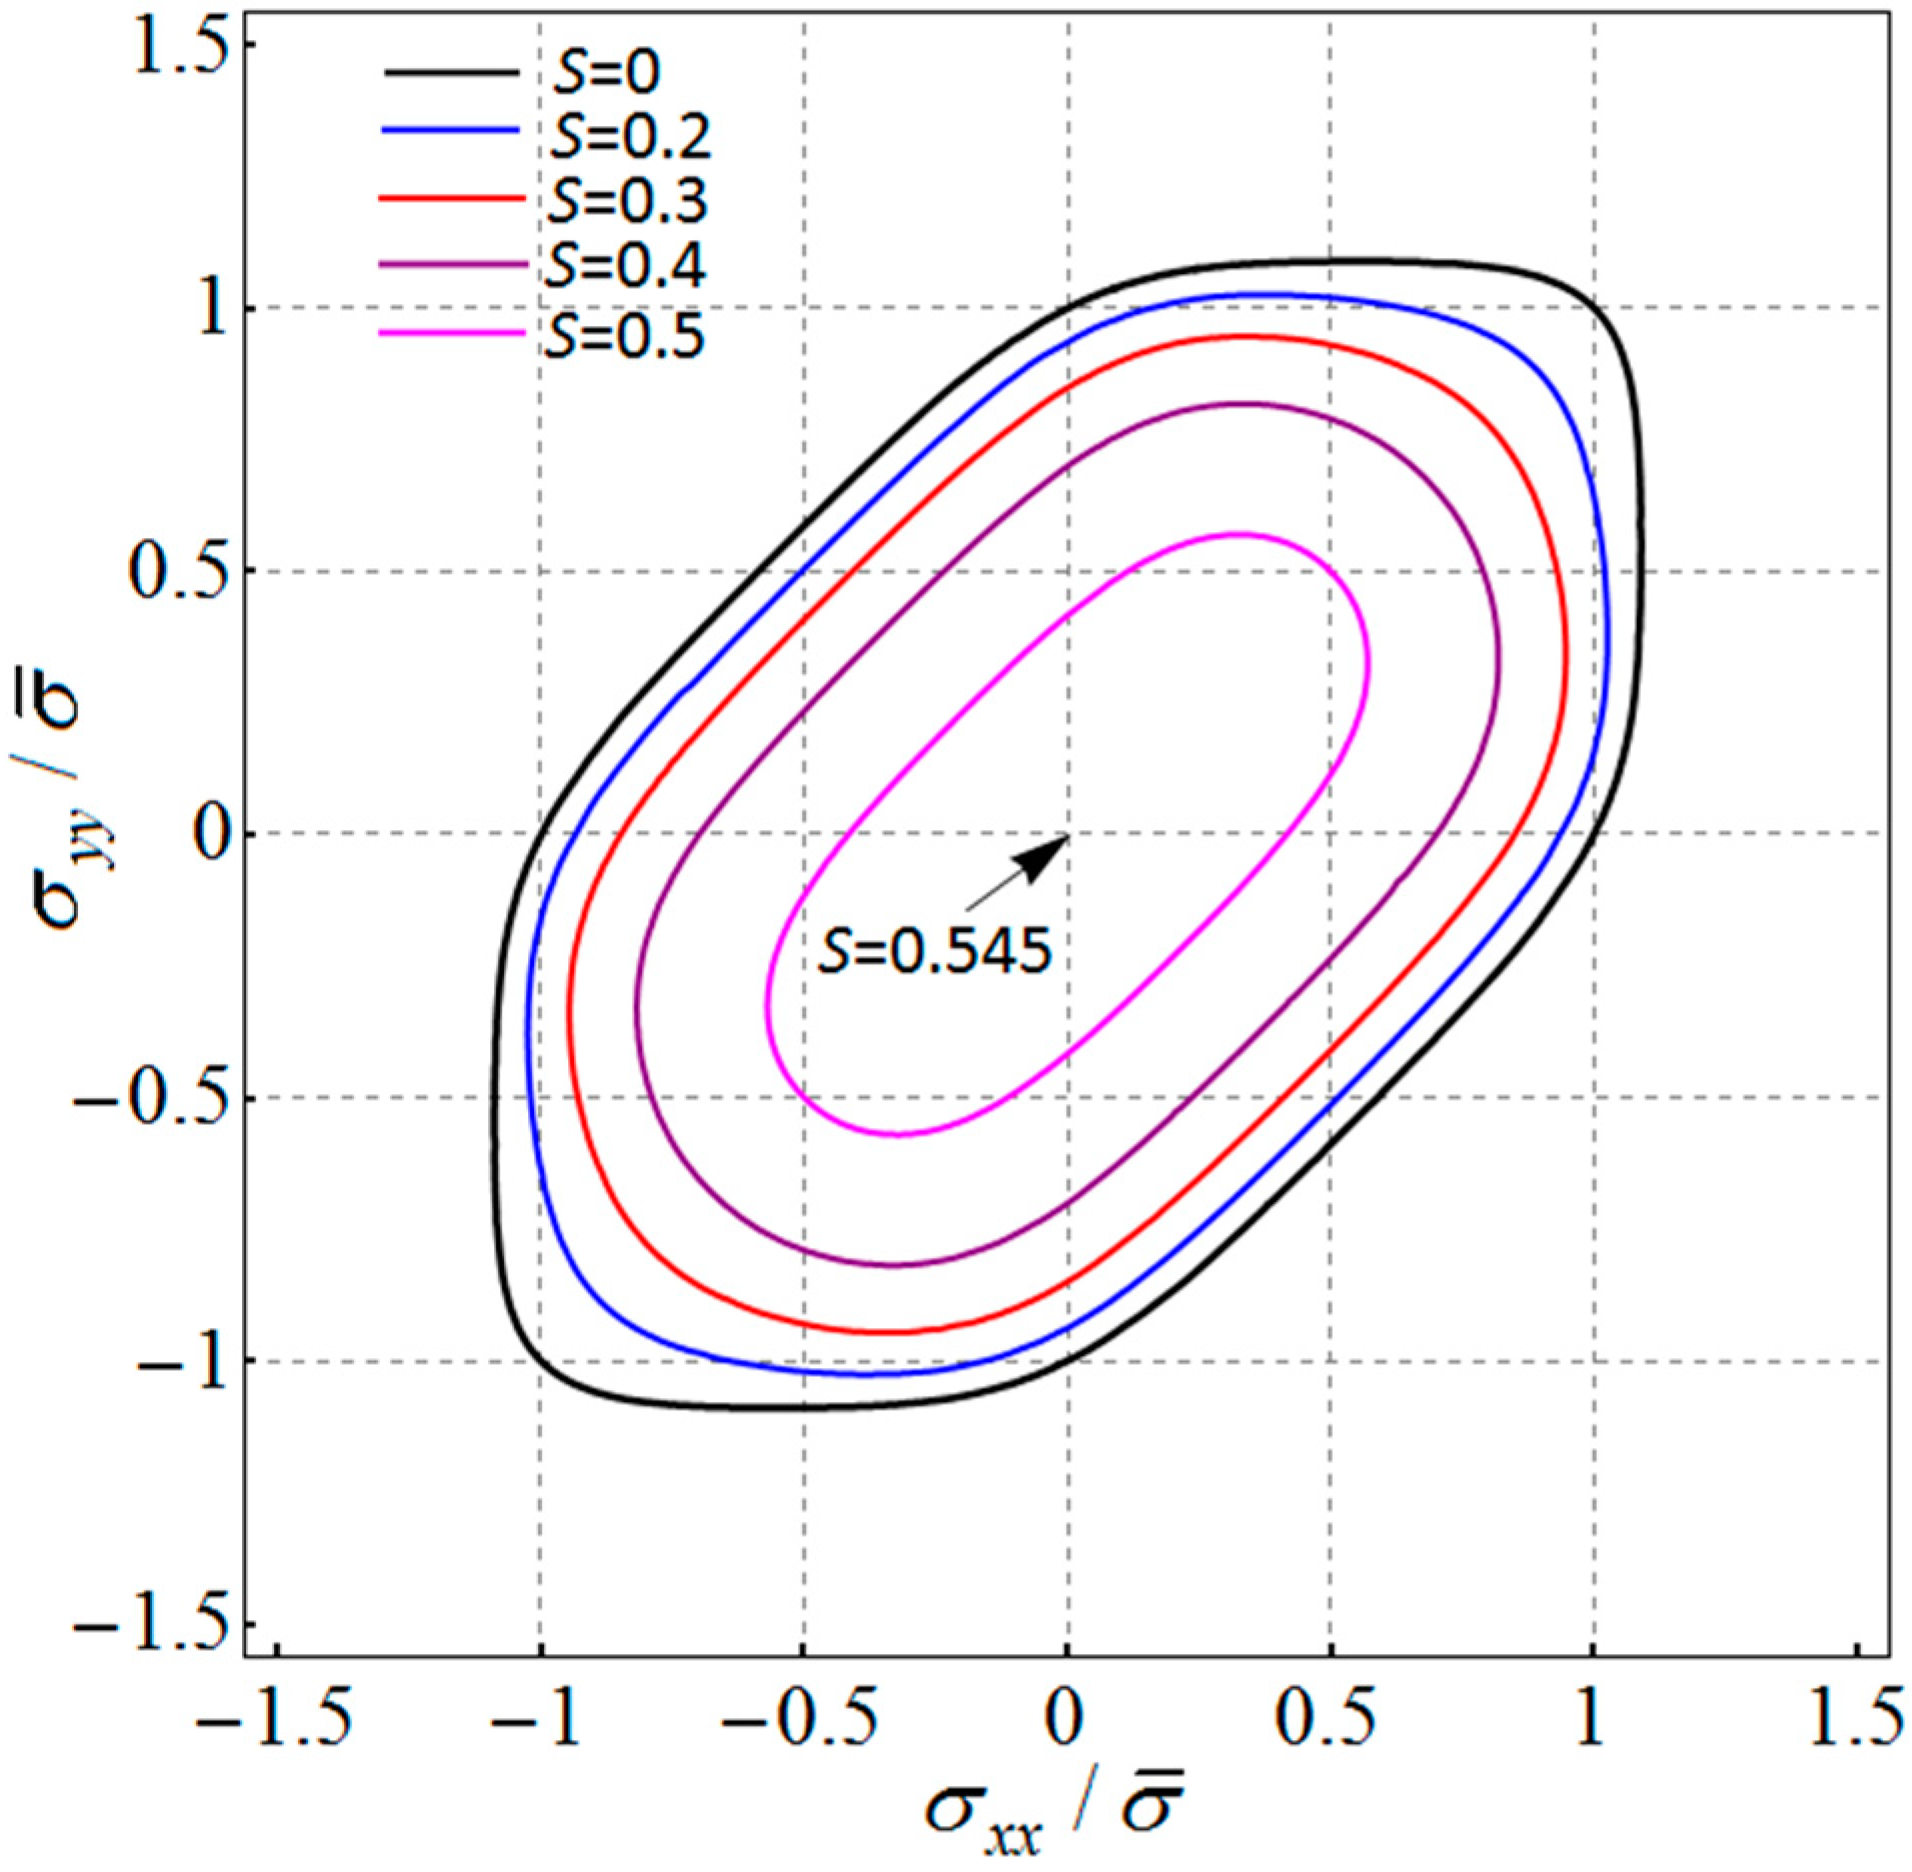
Figure 1. Tricomponent yield surfaces of the Barlat (1987) isotropic yield criterion (M = 8). The line represents the section of the yield surface by a plane parallel to ( σ x x / σ ¯ , σ y y / σ ¯ ) for different value S = σ x y / σ ¯ .
Metals 10 00713 g001
Figure 2. Yield loci predicted by the proposed isotropic yield function (M = 6), according to σ T / σ C = 4/3, 1 (Barlat 1987), 4/3. ( σ 1 and σ 2 are the principal values of the Cauchy stress).
Metals 10 00713 g002
Figure 3. Yield loci predicted by the proposed isotropic yield function with different exponent M, according to σ T / σ C = 1.2 ( σ 1 and σ 2 are the principal values of the Cauchy stress).
Metals 10 00713 g003
Figure 4. The influence of the parameter λ on the ratio of σ T / σ C , for various values of exponent M.
Metals 10 00713 g004
Figure 5. Yield loci predicted by the proposed isotropic yield function in the (σ, τ) plane for various k = σ T / σ C values and M = 2 (fixed), in comparison with Tresca and von Mises (k = 1) loci.
Metals 10 00713 g005
Figure 6. Yield loci predicted by the proposed isotropic yield function in the (σ, τ) plane for different values of M and σ T / σ C = 4 / 5 (fixed).
Metals 10 00713 g006
Figure 7. Comparison of yield loci for Ti–6Al–4V predicted by the proposed theory and experimental results for different plastic strains (data from Khan et al. [44]).
Metals 10 00713 g007
Figure 8. Comparison of the yield locus for Cu-Al-Be SMA predicted by yield criteria and experiments (data from Bouvet [46]).
Metals 10 00713 g008
Figure 9. Comparison of the yield locus for alloy IC10 predicted by the proposed yield criterion with different λ and experiments: (a) λ > 0; (b) λ < 0.
Metals 10 00713 g009aMetals 10 00713 g009b
Figure 10. Comparison of the yield locus for alloy IC10 predicted by yield criteria and experiments.
Metals 10 00713 g010
Figure 11. Relative error between theoretical prediction and experimental data for alloy IC10 using different yield criteria.
Metals 10 00713 g011
Figure 12. Distribution of the Lankford coefficients with respect to the angle from rolling direction predicted by the proposed criterion for DP980 steel sheet (data from Hama et al. [49]).
Metals 10 00713 g012
Figure 13. Distribution of the Lankford coefficients with respect to the angle from rolling direction predicted by the proposed criterion for 6022-T4 alloy sheet (data from Barlat et al. [50]).
Metals 10 00713 g013
Table 1. Number of parameters for different yield criteria in full plane stress state.
Cazacu 2004 [32]Chen 2013 [36]Yoon 2014 [38]Present Paper
11795
Table 2. Experimental material data of Ti-6Al-4V (the results are normalized by the 0.2% yield compressive stress along RD direction, data after Khan et al. [44]).
Plastic Strain σ 0 T   σ 0 C σ 90 T σ 90 C σ b T σ b C
0.2%
2%
4%
6%
0.900
0.920
0.936
0.967
1.000
1.082
1.113
1.156
0.800
0.863
0.868
0.890
0.860
0.962
0.988
1.008
0.870
0.946
0.985
1.013
0.800
0.830
0.845
0.870
Table 3. Anisotropic and tension–compression asymmetry coefficients of the proposed criterion (M = 2) for Ti-6Al-4V.
Plastic Strainhac λ
0.2%
2%
4%
6%
1.163
1.125
1.127
1.147
0.557
0.491
0.452
0.426
0.443
0.363
0.356
0.322
−0.089
−0.151
−0.151
−0.152
Table 4. Anisotropic and tension-compression asymmetry coefficients of yield criteria for Cu-Al-Be SMA.
Yield Criterionhac λ
Extended Barlat 1989 (M = 2)
Extended Barlat 1989 (M = 8)
Barlat 1989 (M = 8)
1.03
1.03
1.03
4.572 × 10⁻⁵
3.483 × 10⁻¹⁷
0.882
4.854 × 10⁻⁵
4.412 × 10⁻¹⁷
1.118
−0.196
−0.784
-
Table 5. Mechanical property parameters of IC10.
Plastic Strain σ 0 T   ( MPa ) σ 0 C   ( MPa ) σ 90 T   ( MPa ) σ 90 C   ( MPa ) σ b T   ( MPa )
0.2%825760715766775
Table 6. Anisotropic and tension–compression asymmetry coefficients of the proposed criterion for alloy IC10 with λ calculated by experimental data of 0° and 90°, respectively.
Yield Criterionhac λ * λ * *
Extended Barlat 1989 (M = 2)
Extended Barlat 1989 (M = 8)
0.992
0.992
8.39 × 10⁻⁷
3.963 × 10⁻²⁴
8.923 × 10⁻⁷
5.022 × 10⁻²⁴
0.082
0.328
−0.069
−0.276
* Calculated by experimental data of 0° direction; ** Calculated by experimental data of 90° direction.
Table 7. Anisotropic and tension–compression asymmetry coefficients of yield criteria for alloy IC10 with average λ calculated by experimental data of 0° and 90°.
Yield Criterionhac λ
Extended Barlat 1989 (M = 2)
Extended Barlat 1989 (M = 8)
Barlat 1989 (M = 8)
0.992
0.992
1.154
8.39 × 10⁻⁷
3.963 × 10⁻²⁴
0.796
8.923 × 10⁻⁷
5.022 × 10⁻²⁴
1.204
0.007
0.026
-
Table 8. Calculated coefficients of the proposed criterion for the DP980 steel sheet.
Yield Criterionhacp λ
Extended Barlat 1989 (M = 2)
Extended Barlat 1989 (M = 8)
0.915
0.915
1.108
1.108
0.892
0.892
0.739
0.852
0
0
Table 9. Calculated coefficients of the proposed criterion for the 6022-T4 alloy sheet.
Yield Criterionhacp λ
Extended Barlat 1989 (M = 2)
Extended Barlat 1989 (M = 14)
1.058
1.058
1.215
1.215
0.785
0.758
0.672
0.809
0
0