Effects of On-Line Vortex Cooling on the Microstructure and Mechanical Properties of Wire Arc Additively Manufactured Al-Mg Alloy

Abstract
:1. Introduction
2. Experiment
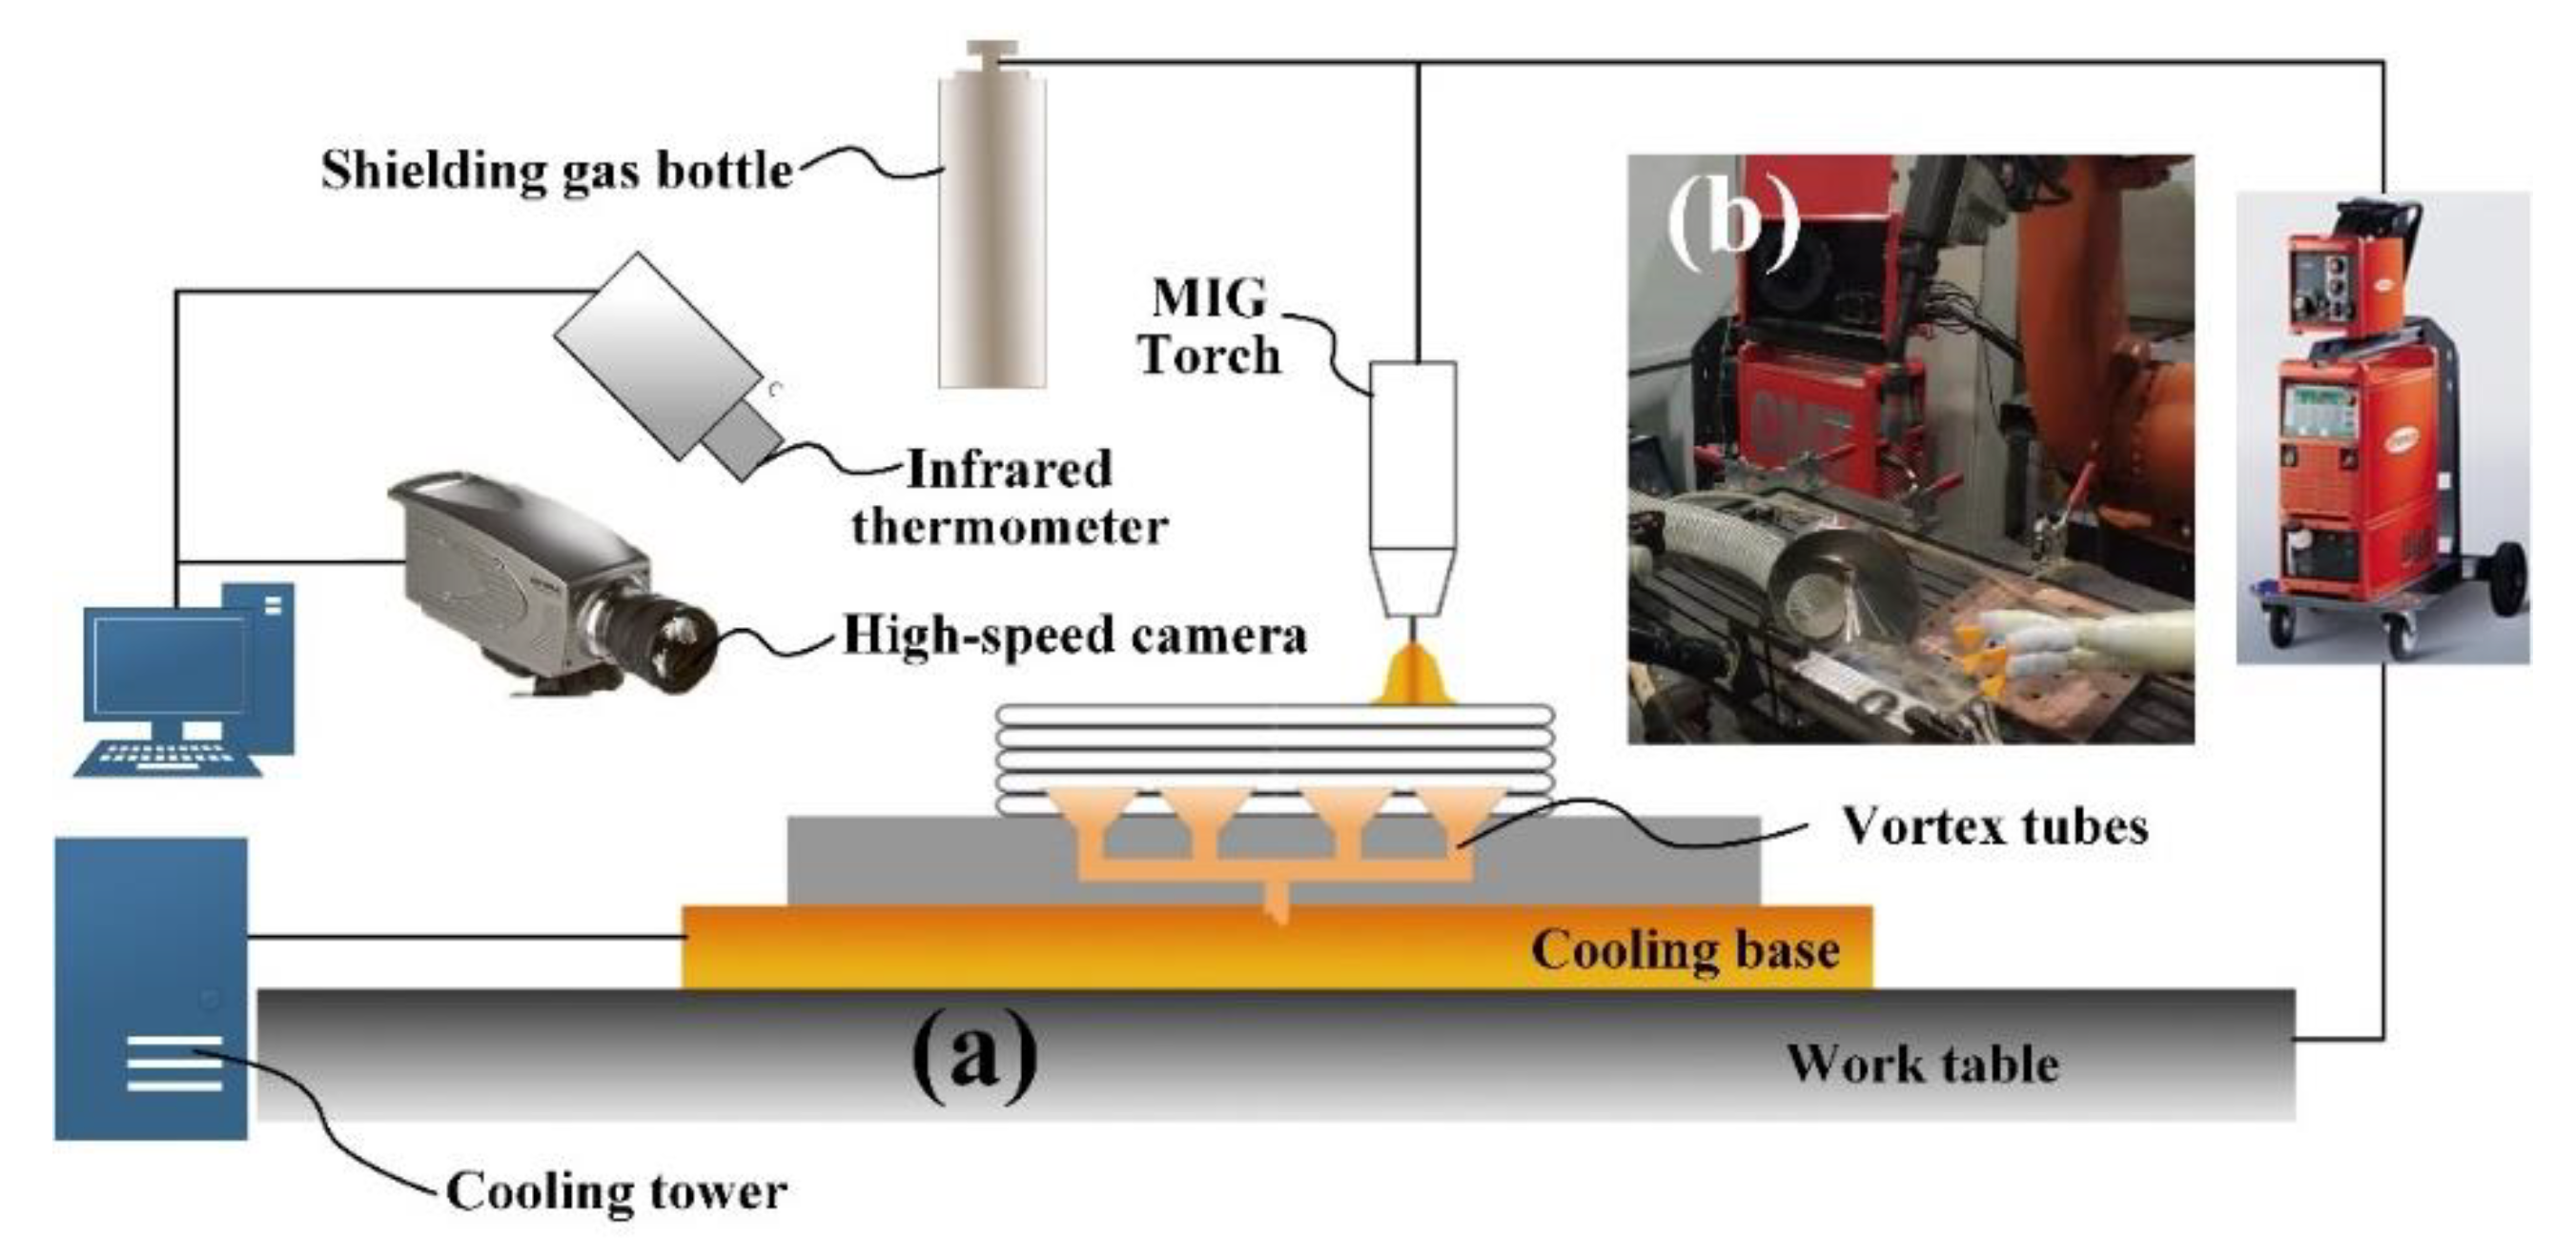
2.1. Experiment Setup
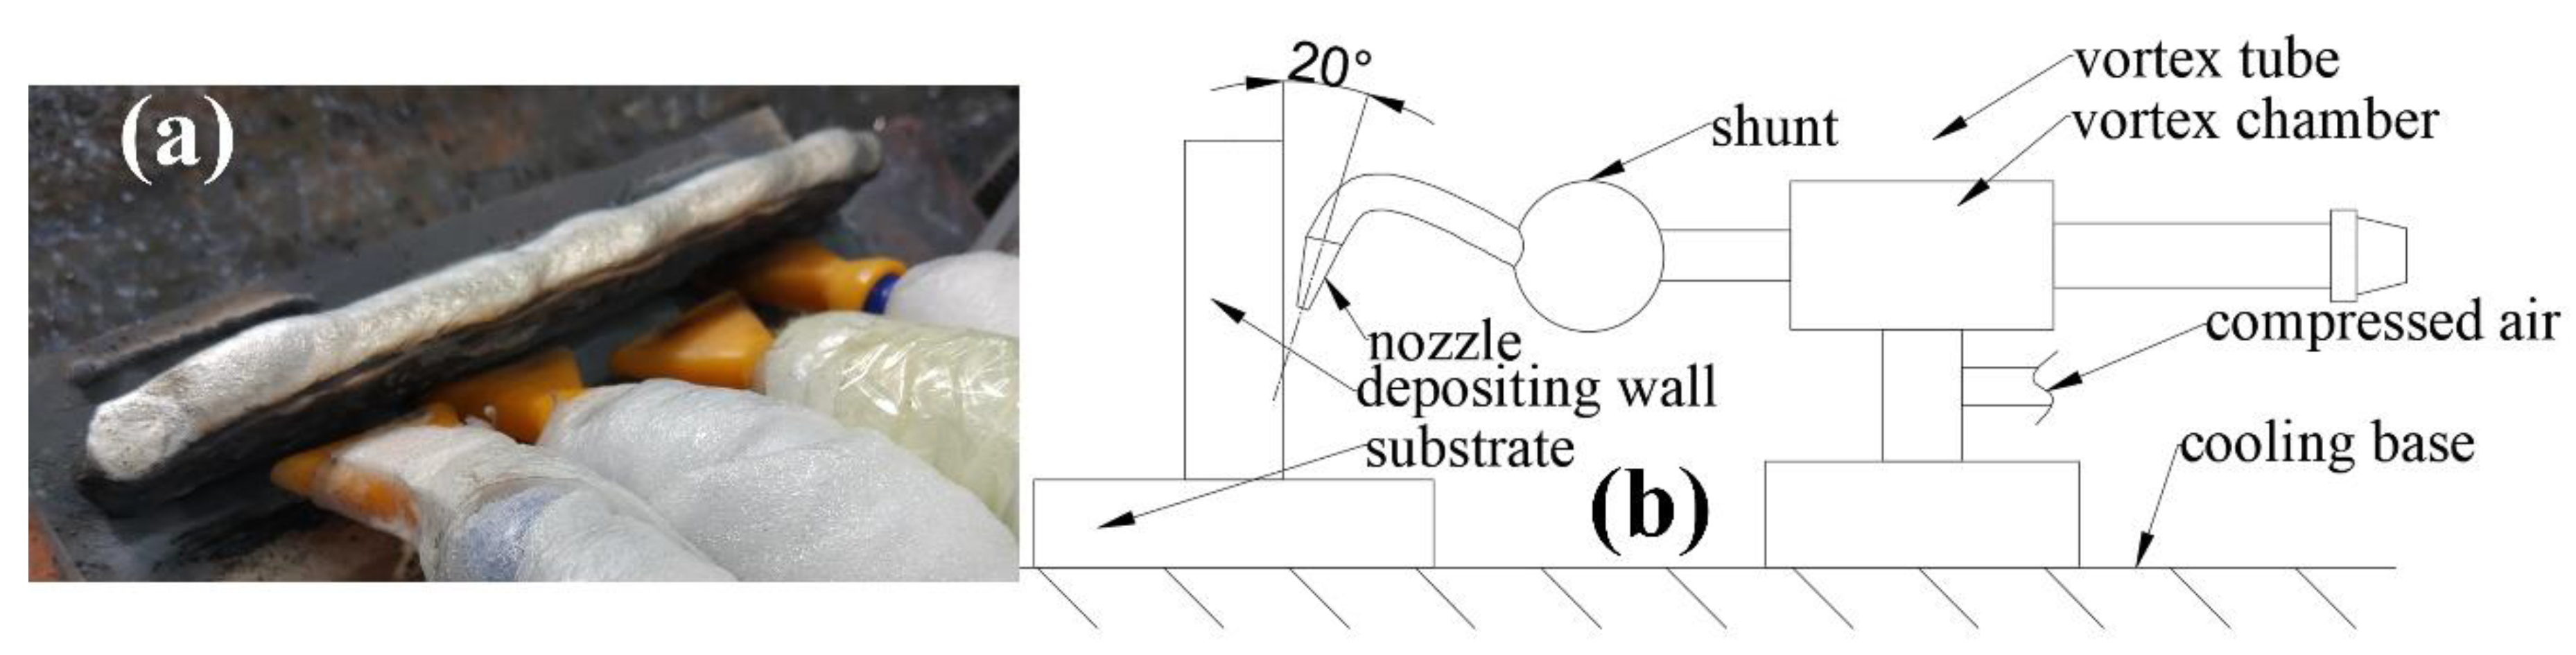
2.2. Fast Cooling System
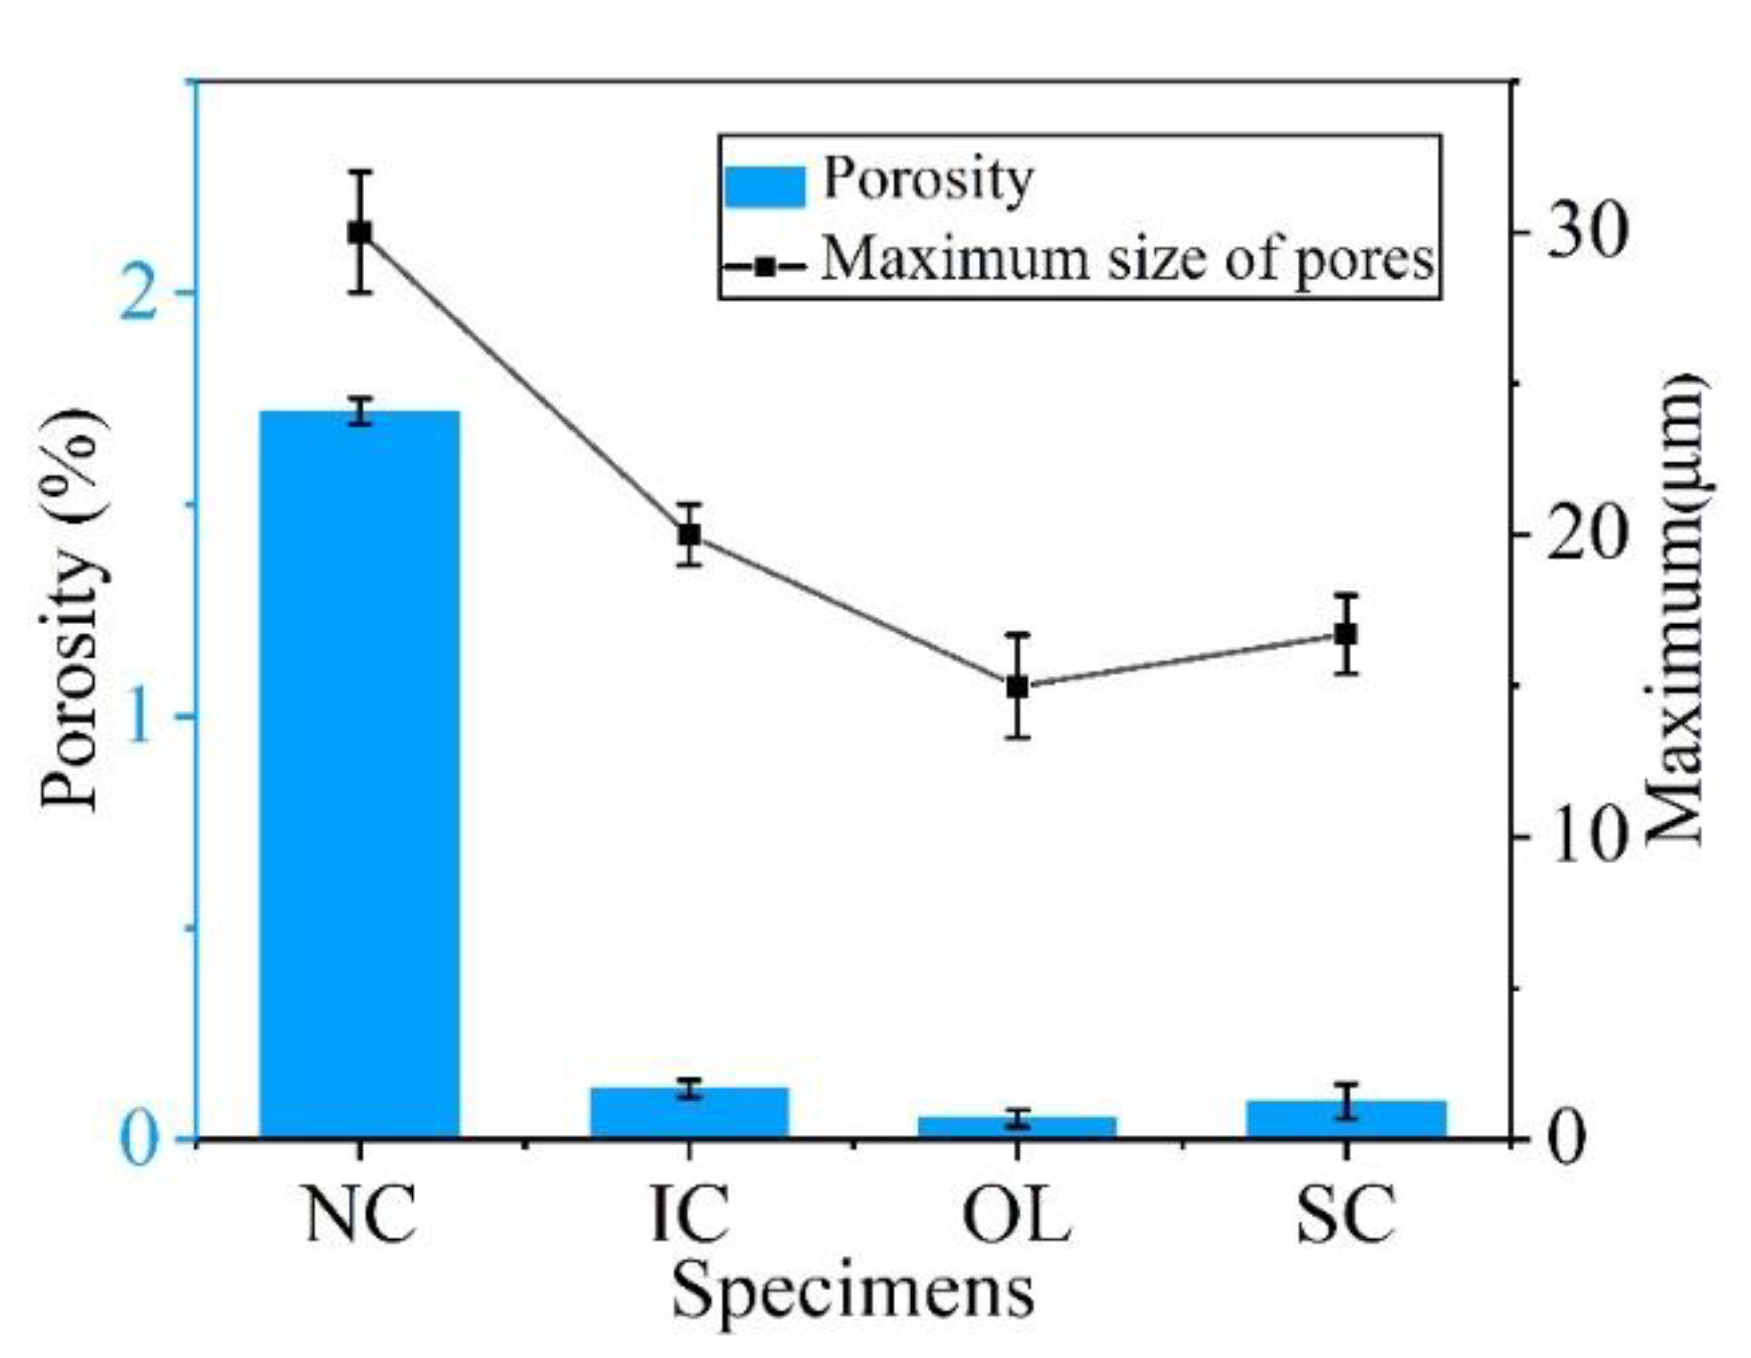
2.3. Porosity
2.4. Material Characterization Techniques
3. Results and Discussion
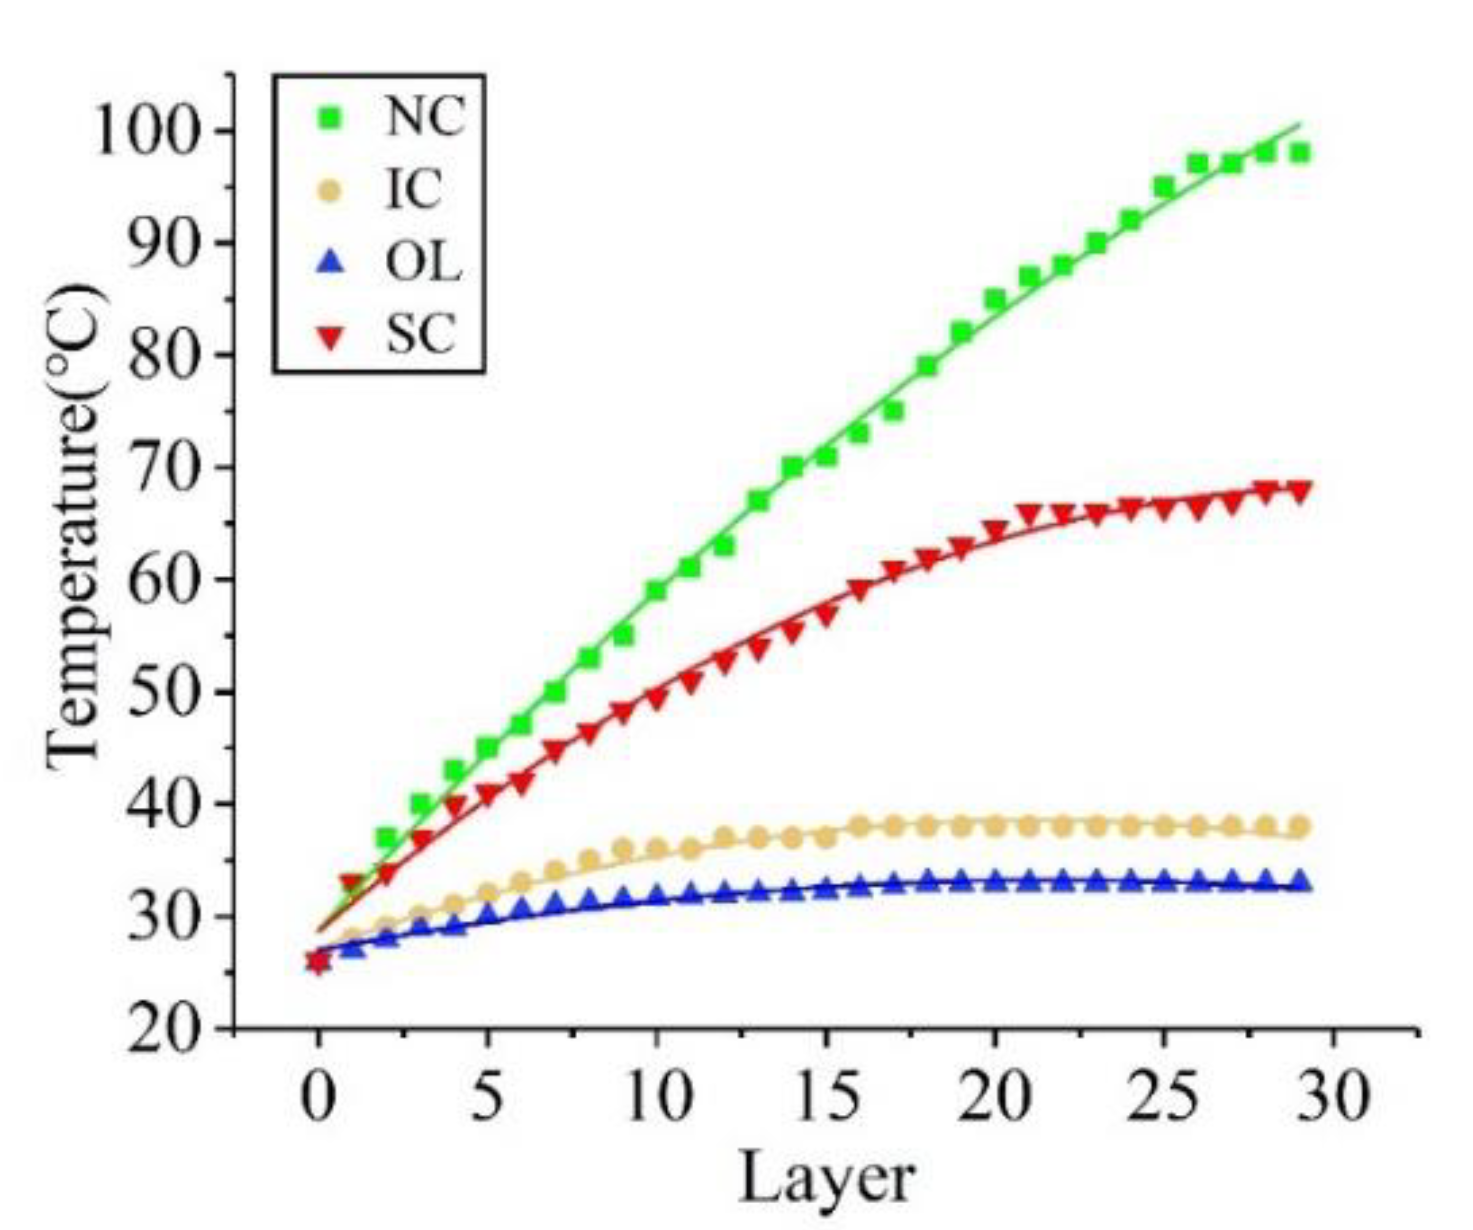
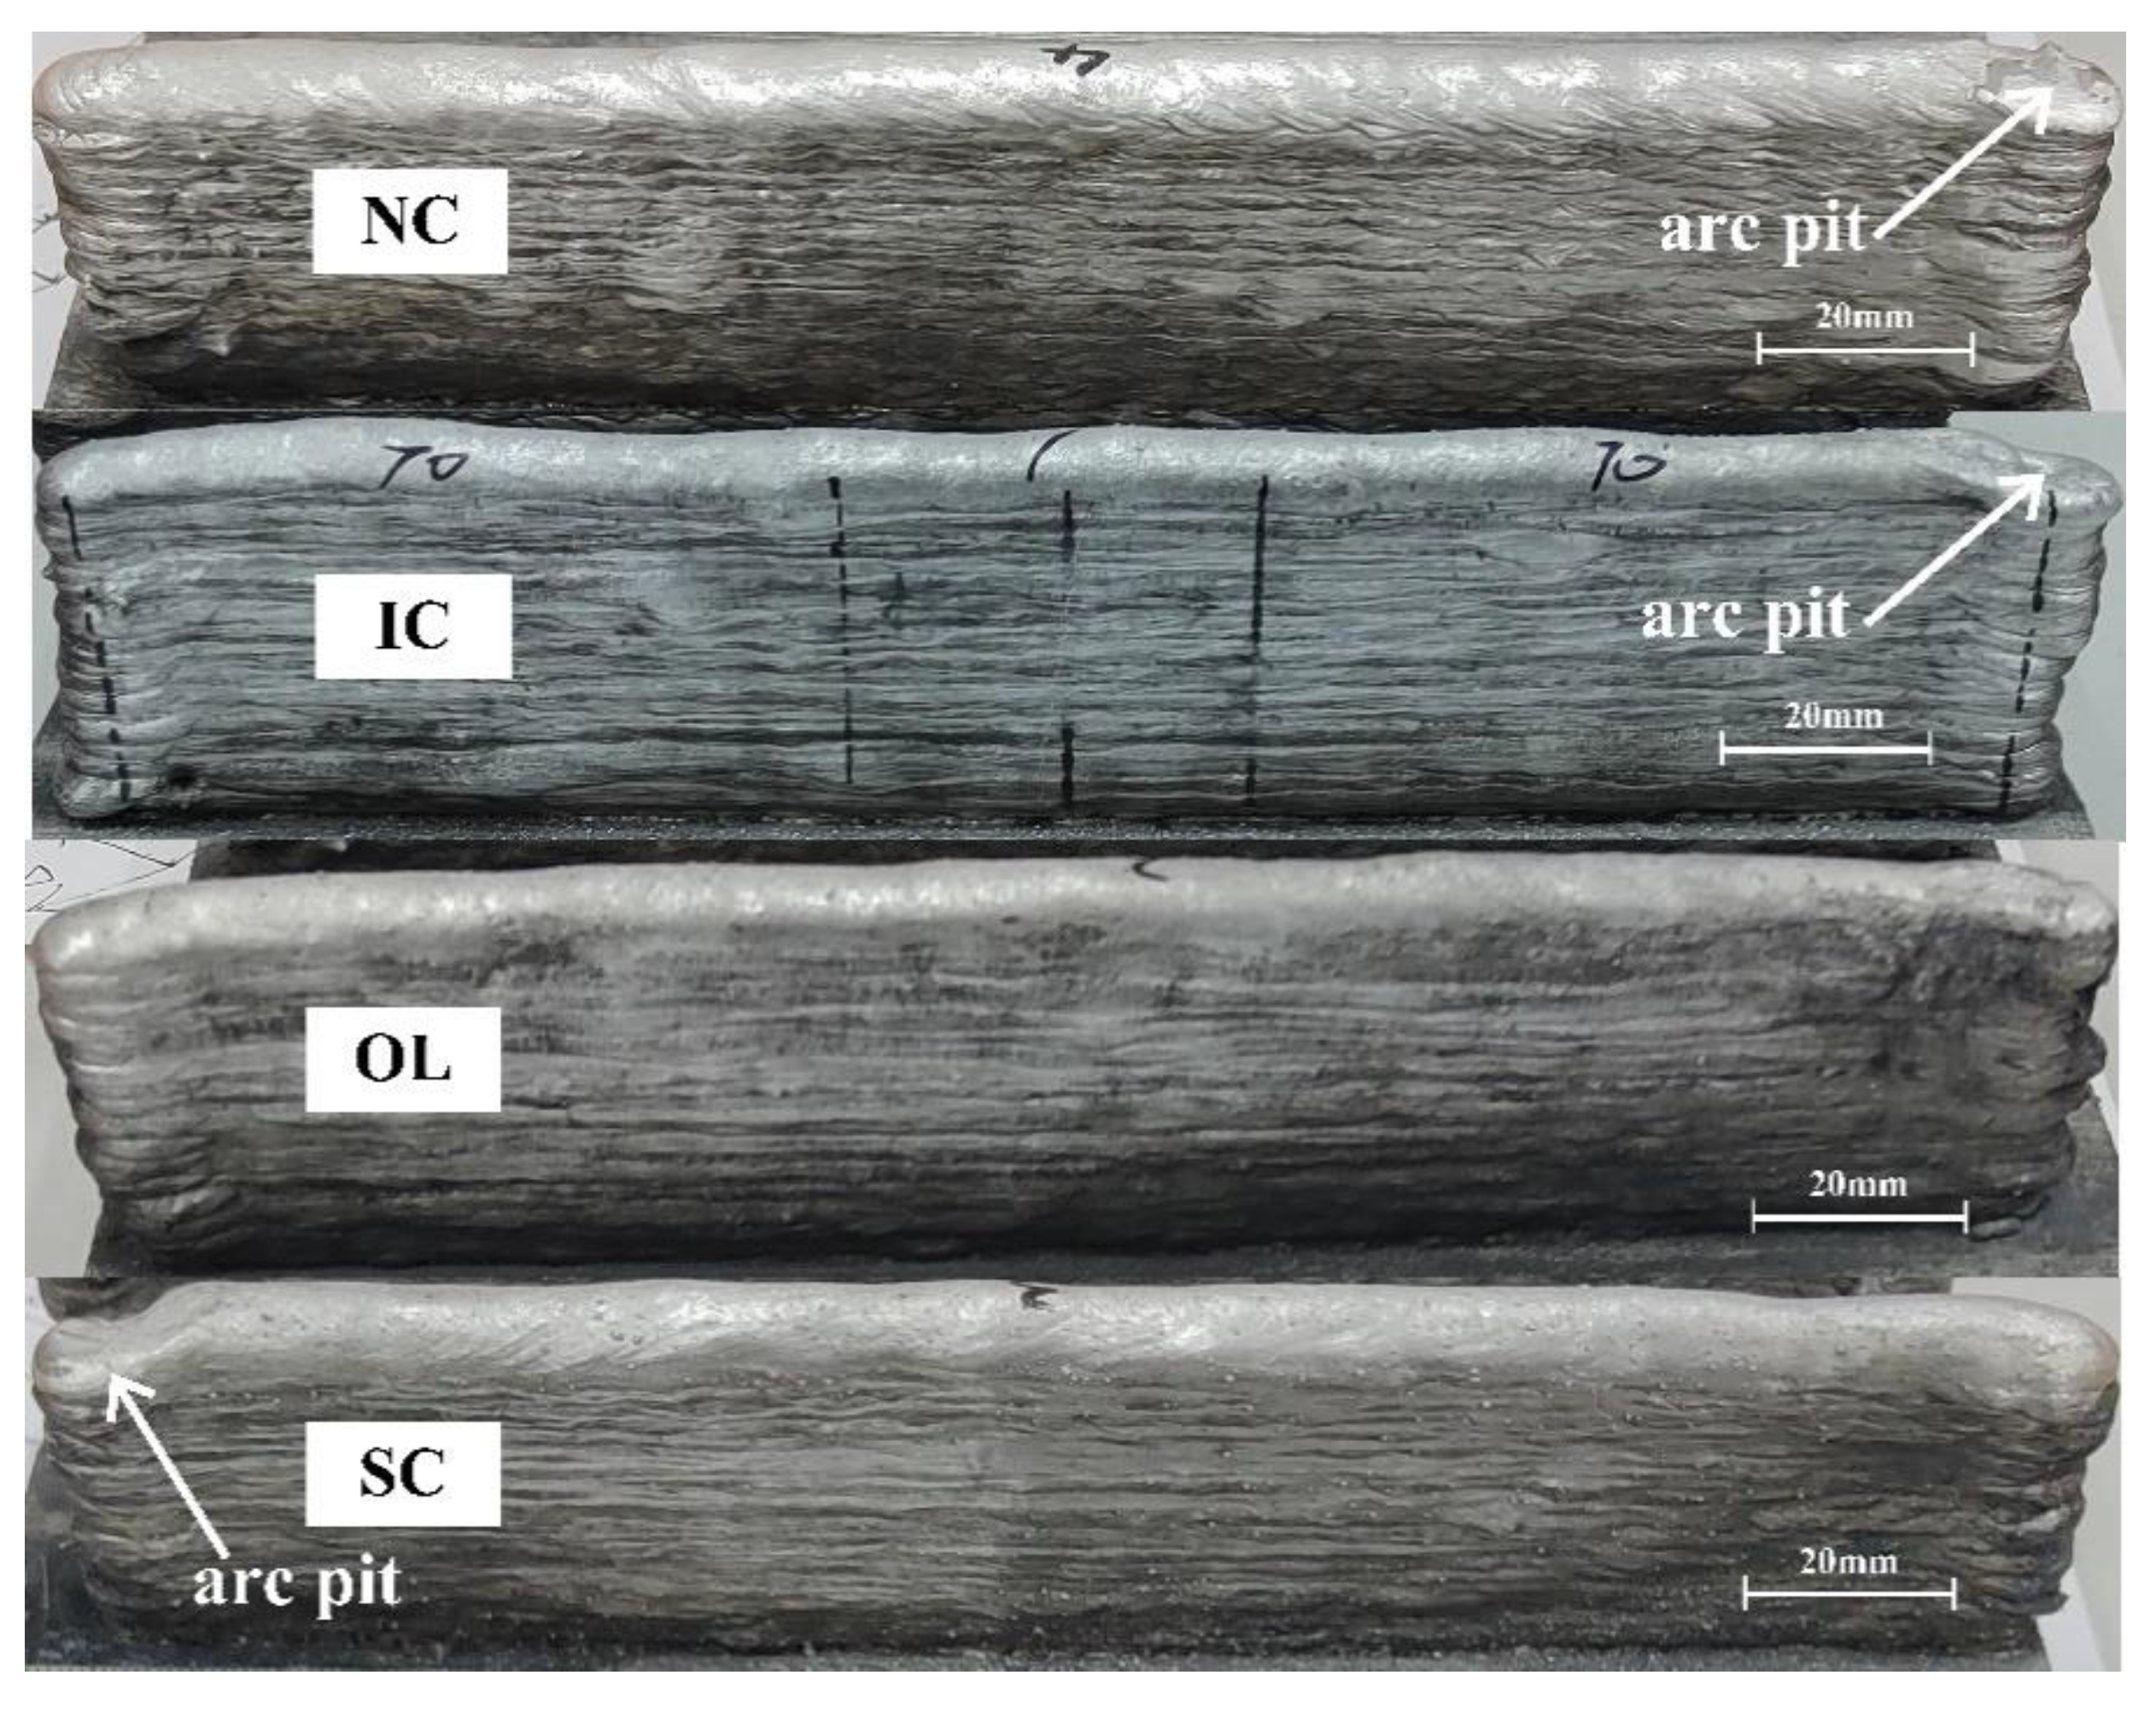
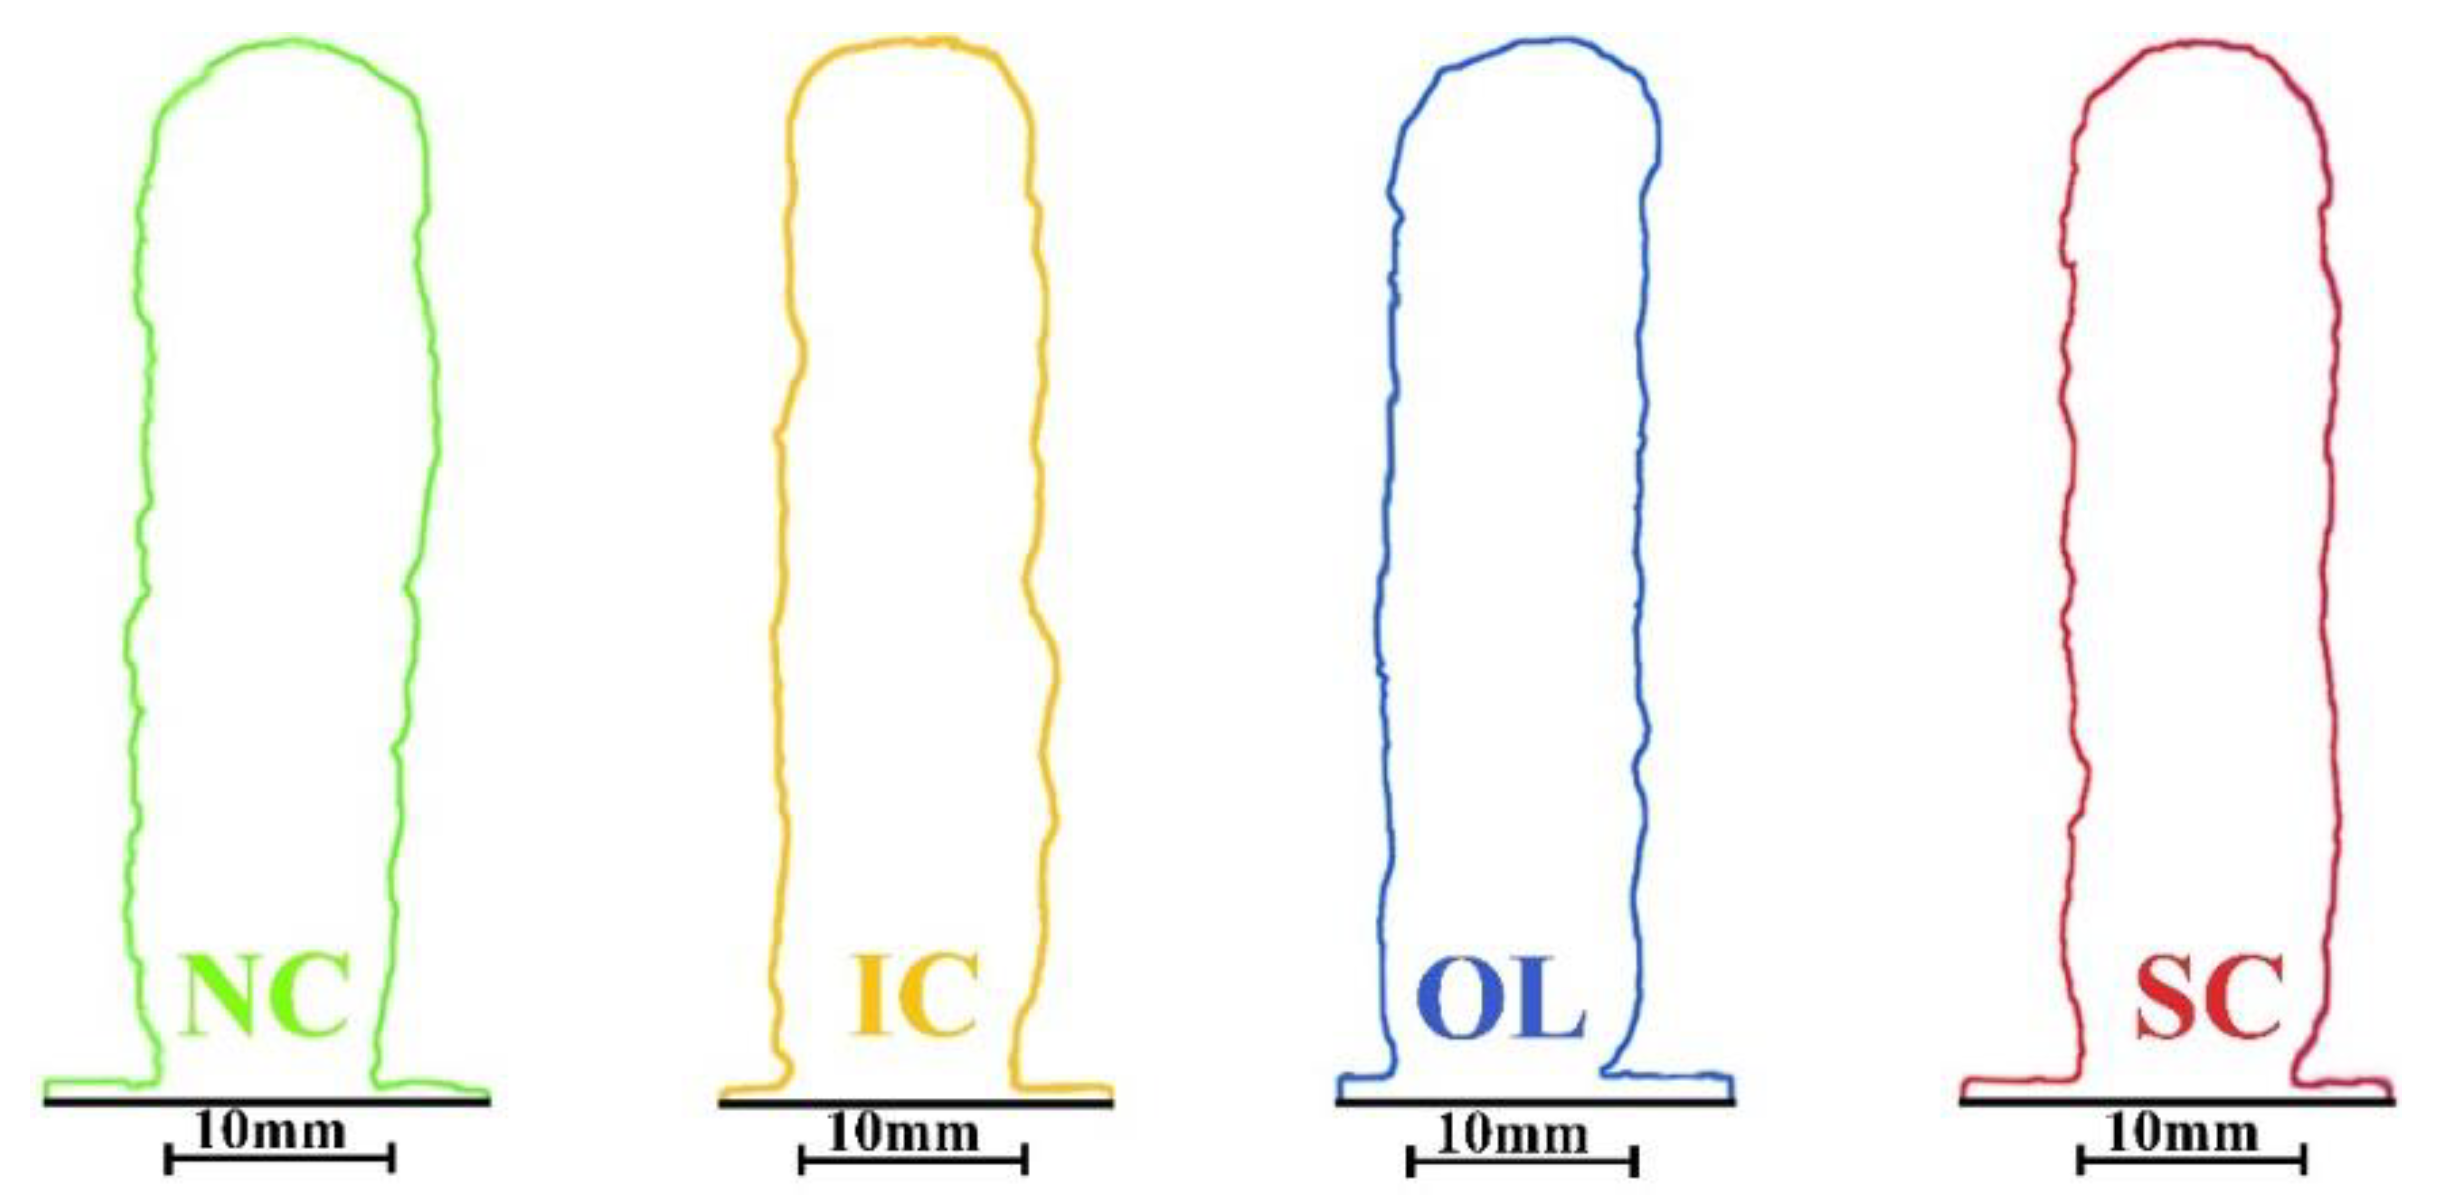
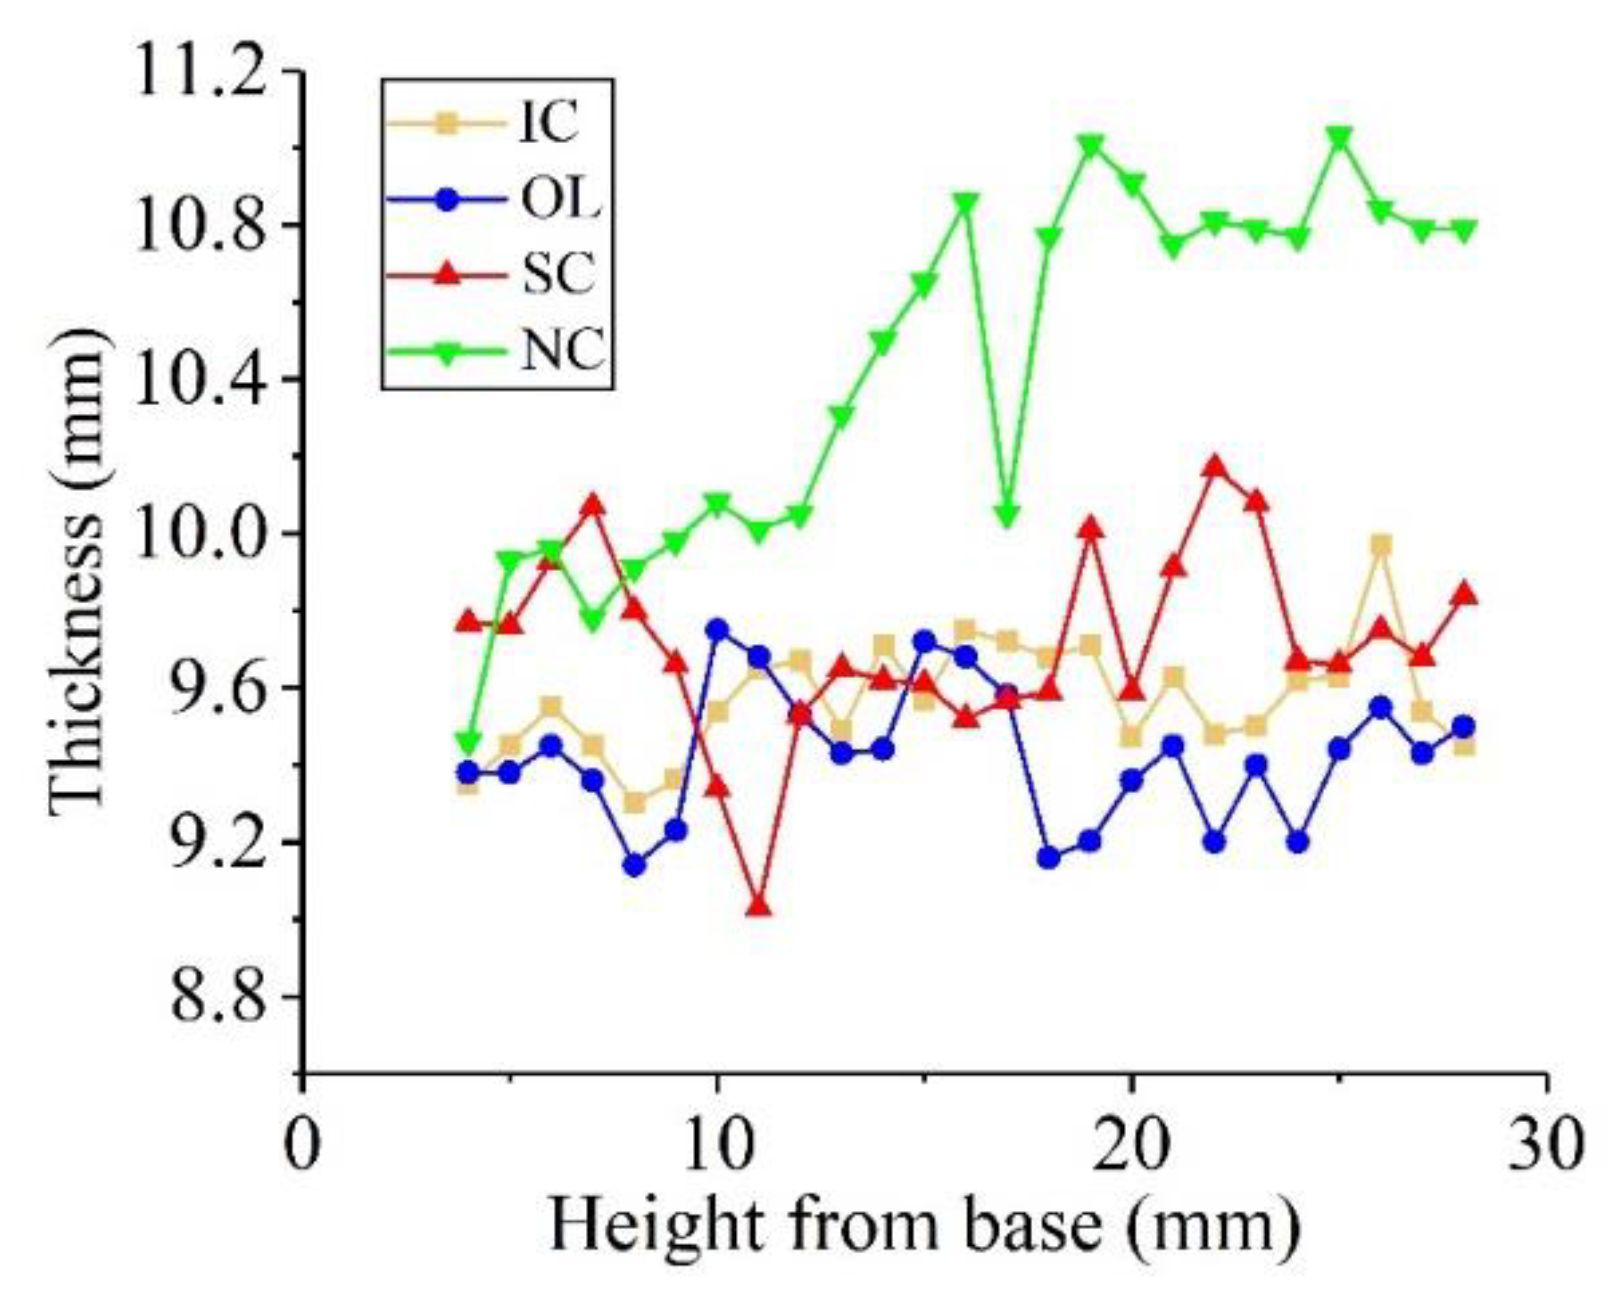
3.1. Geometry
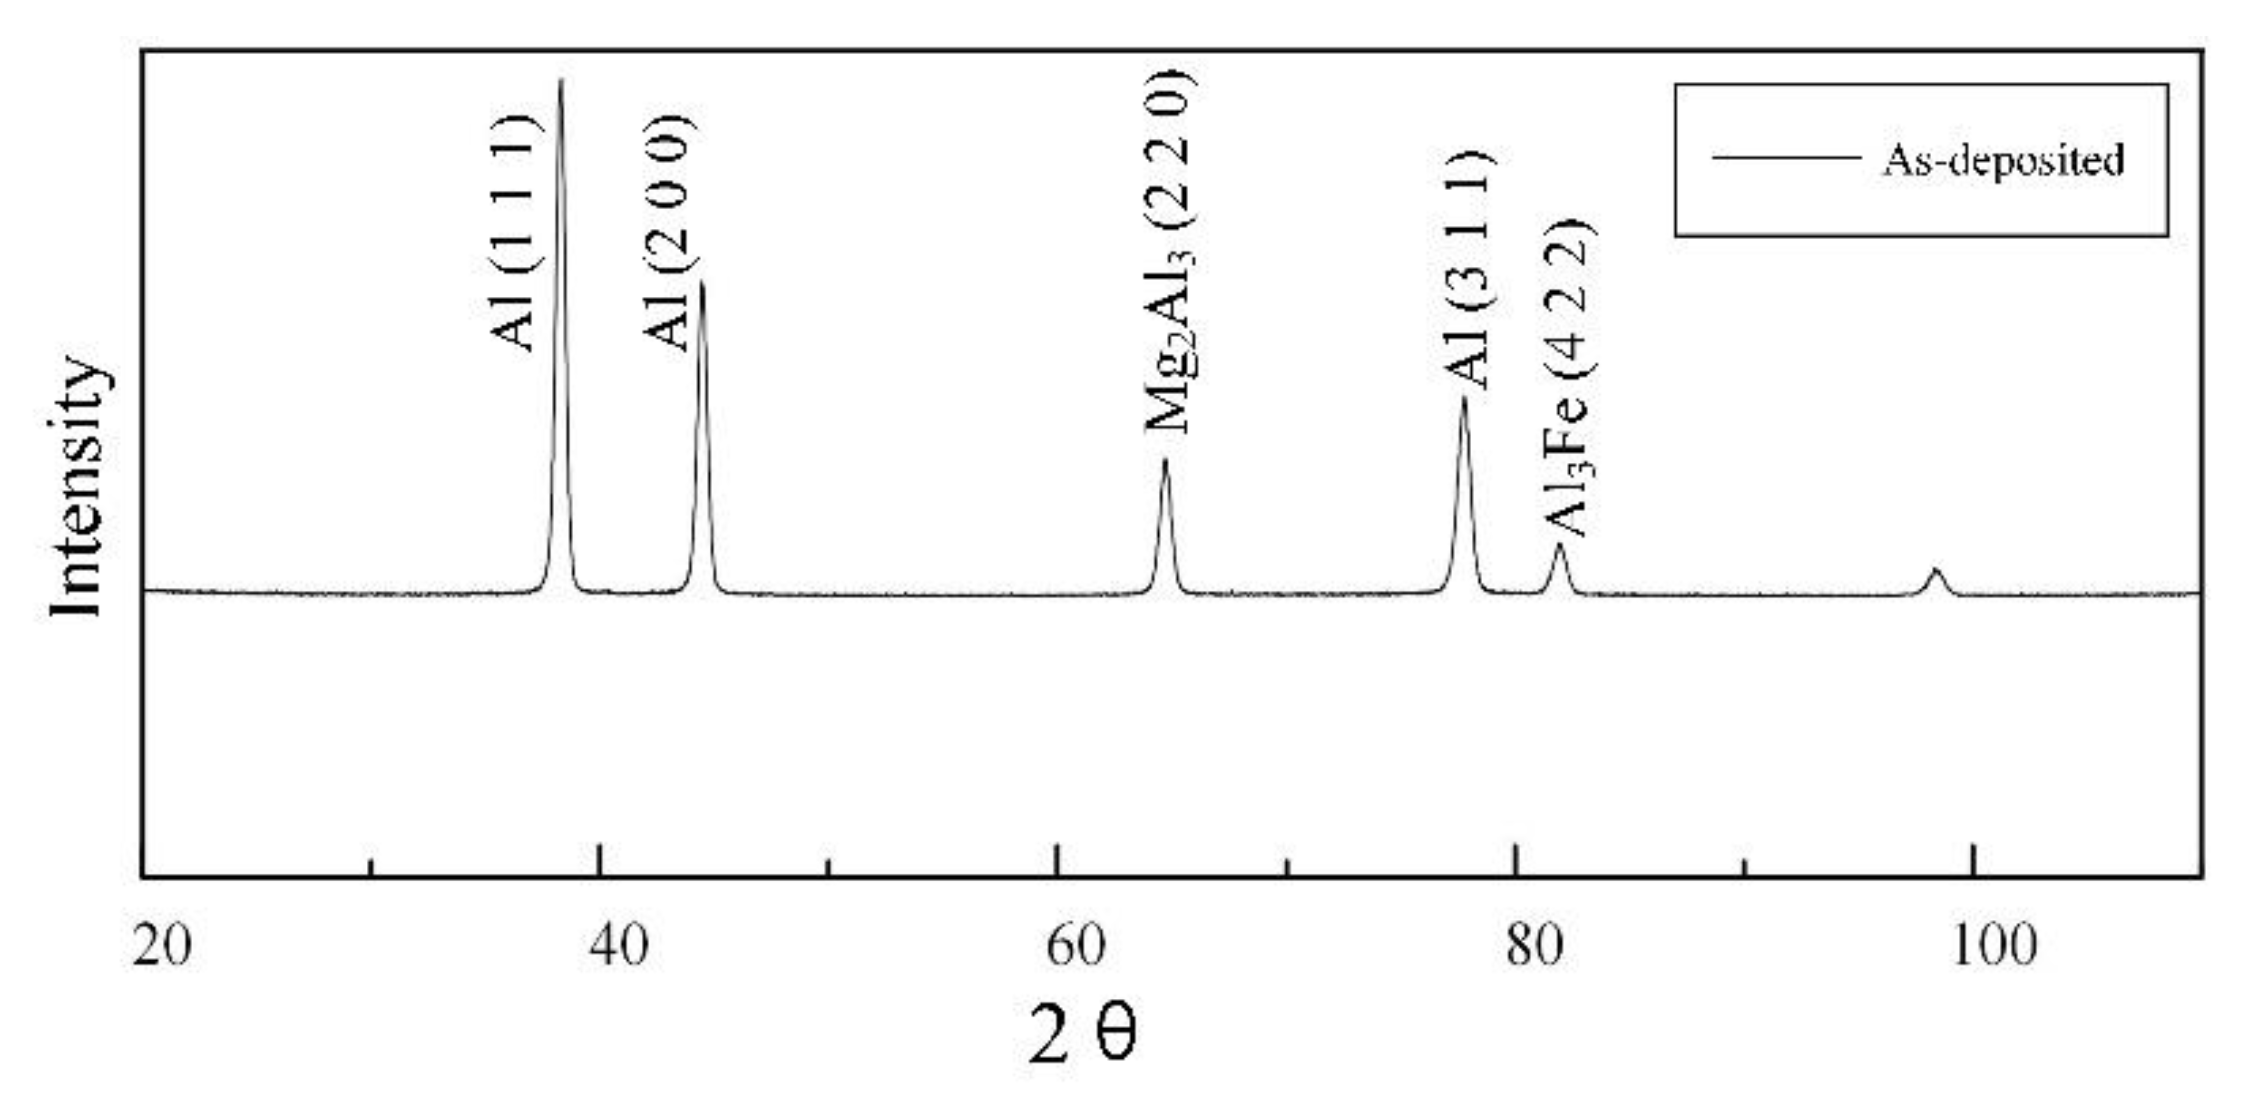
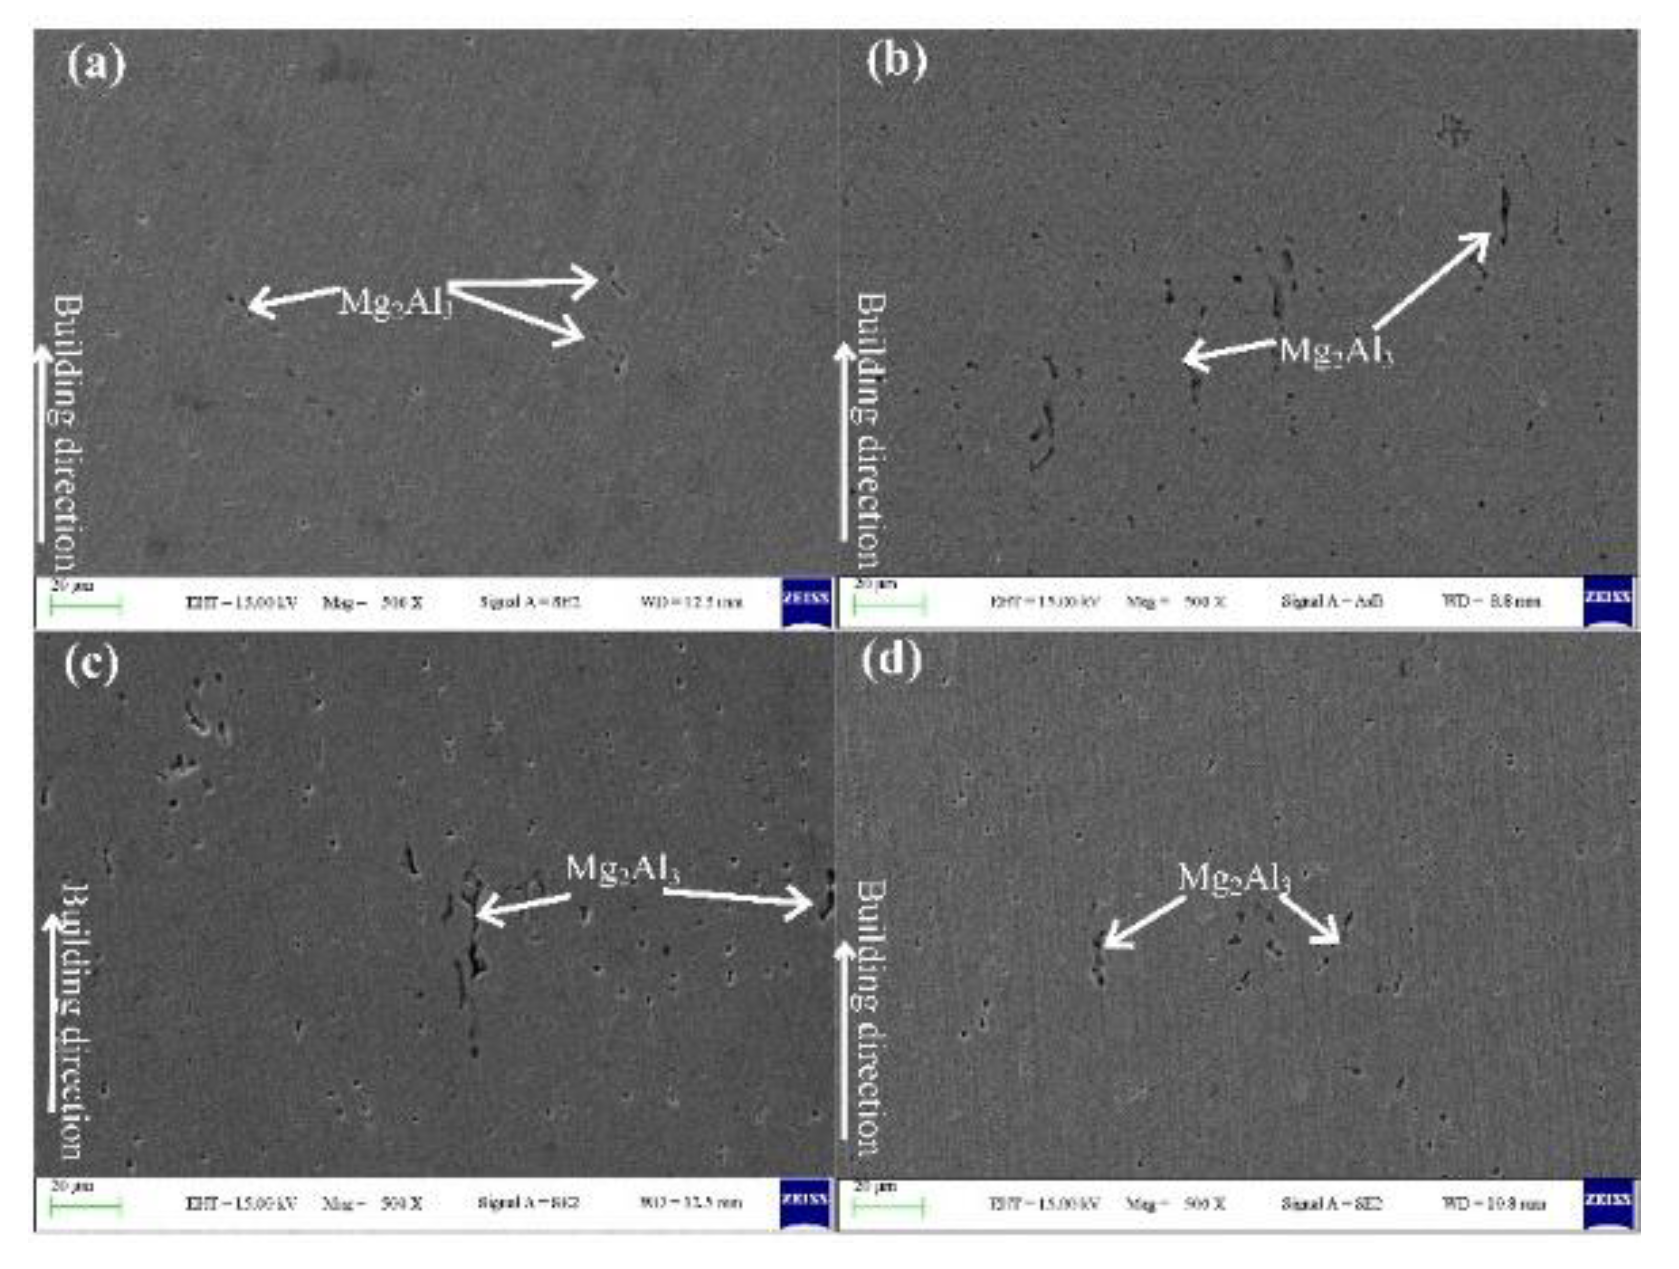
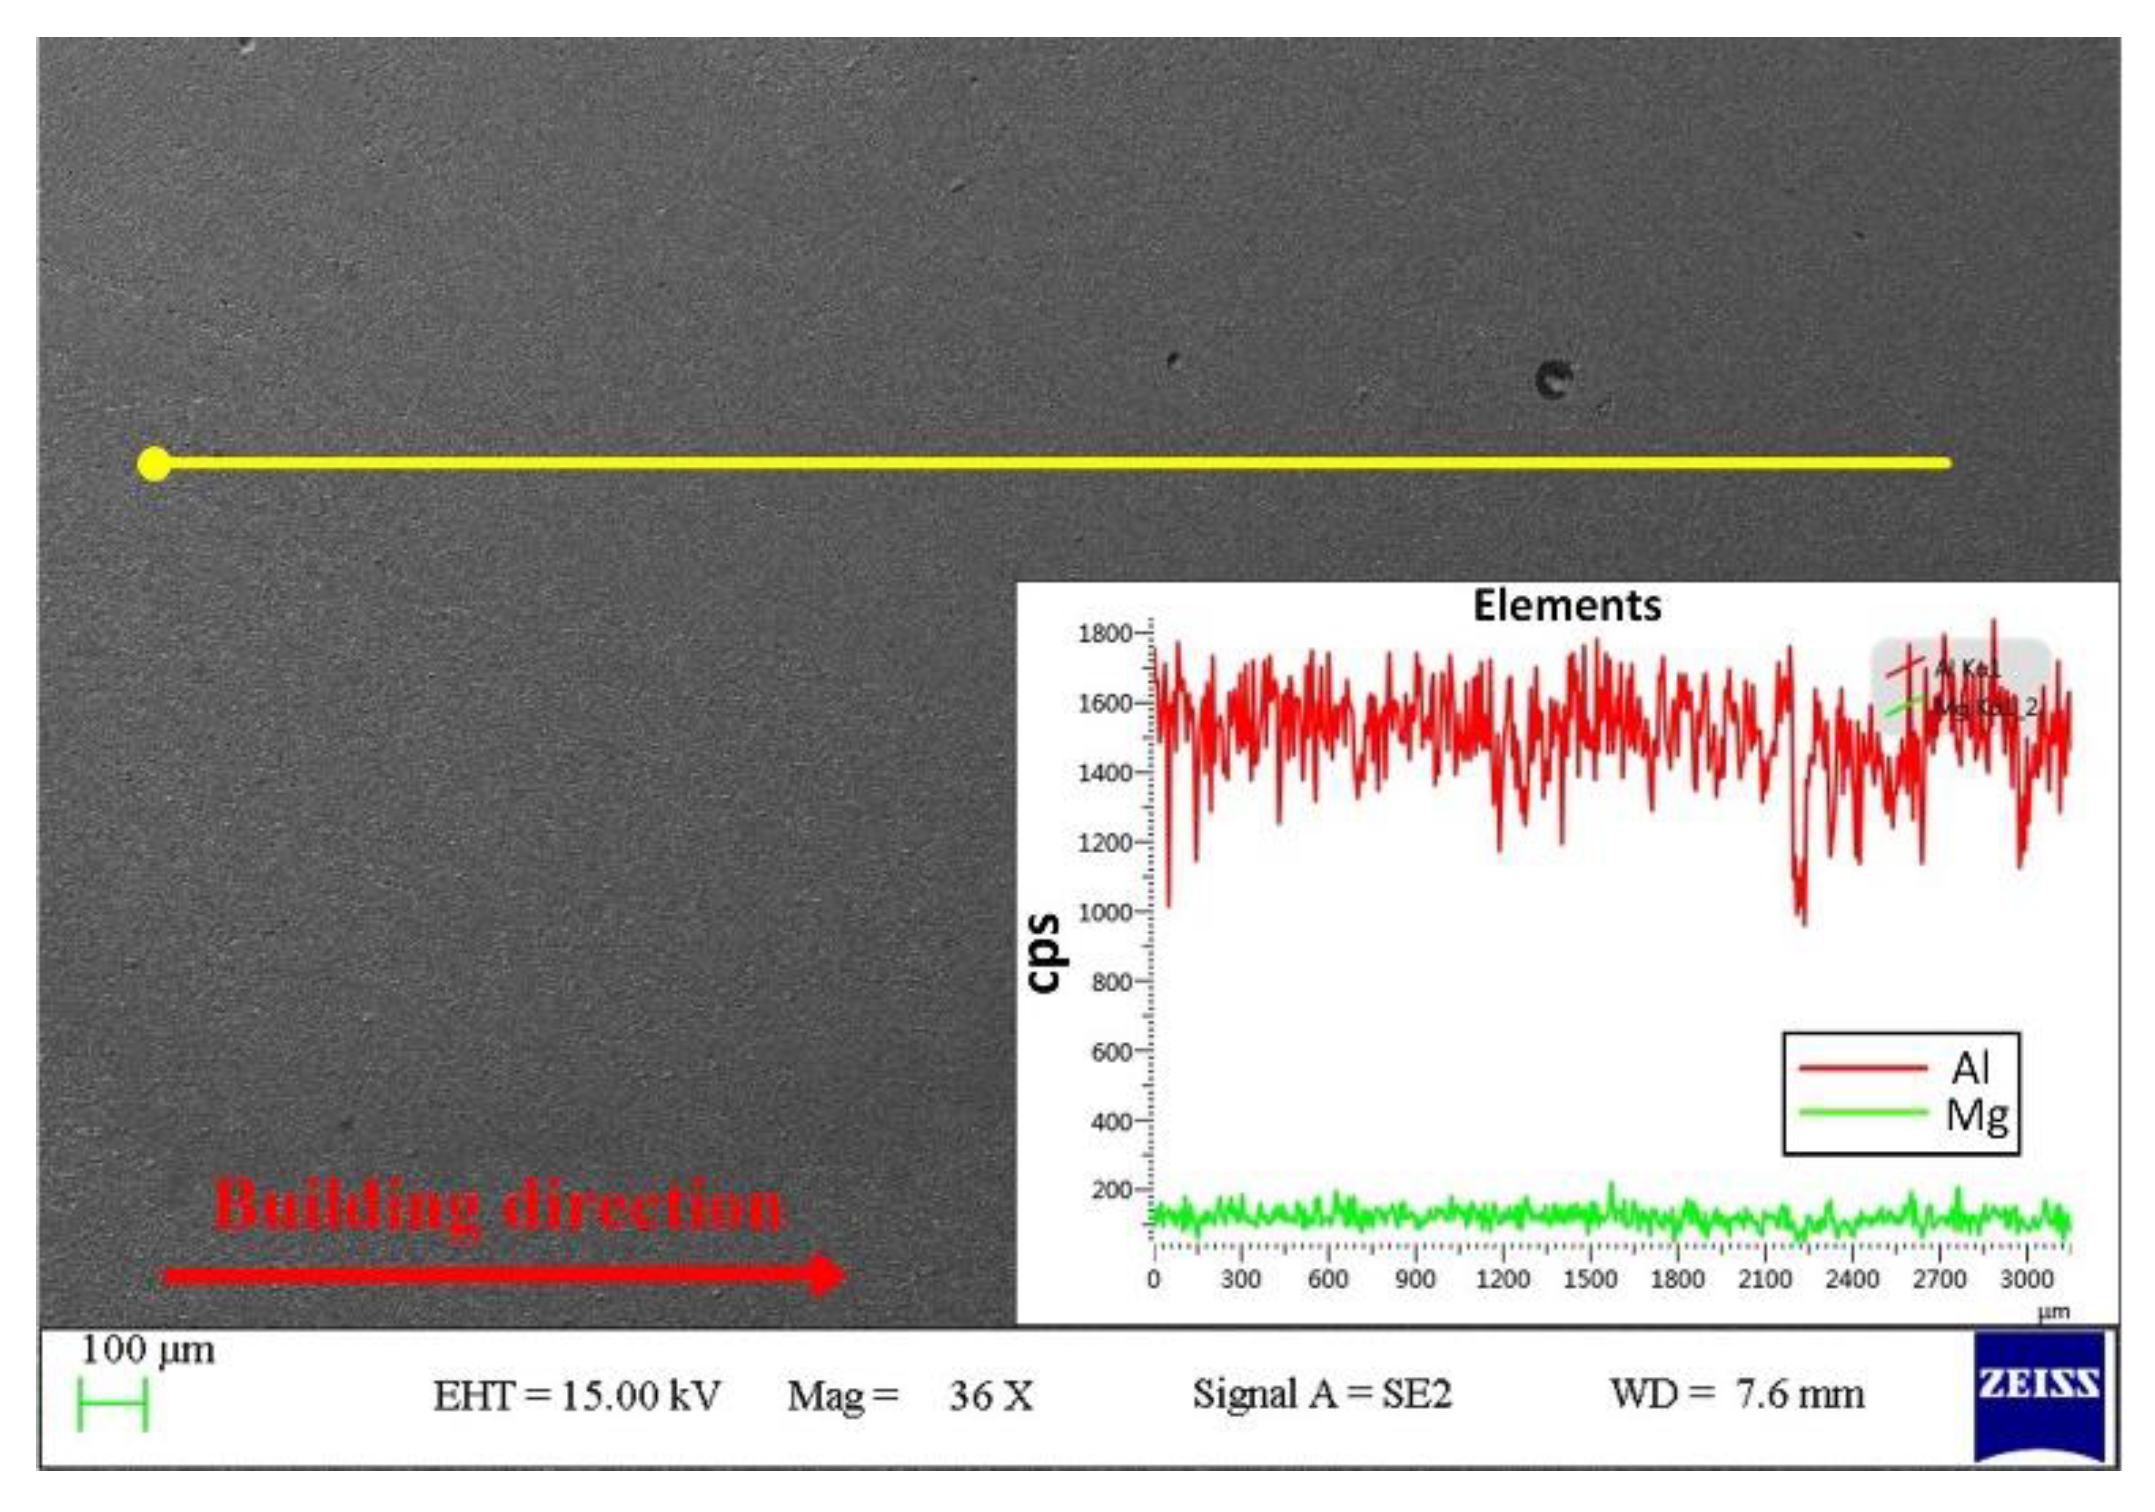
3.2. Microstructure
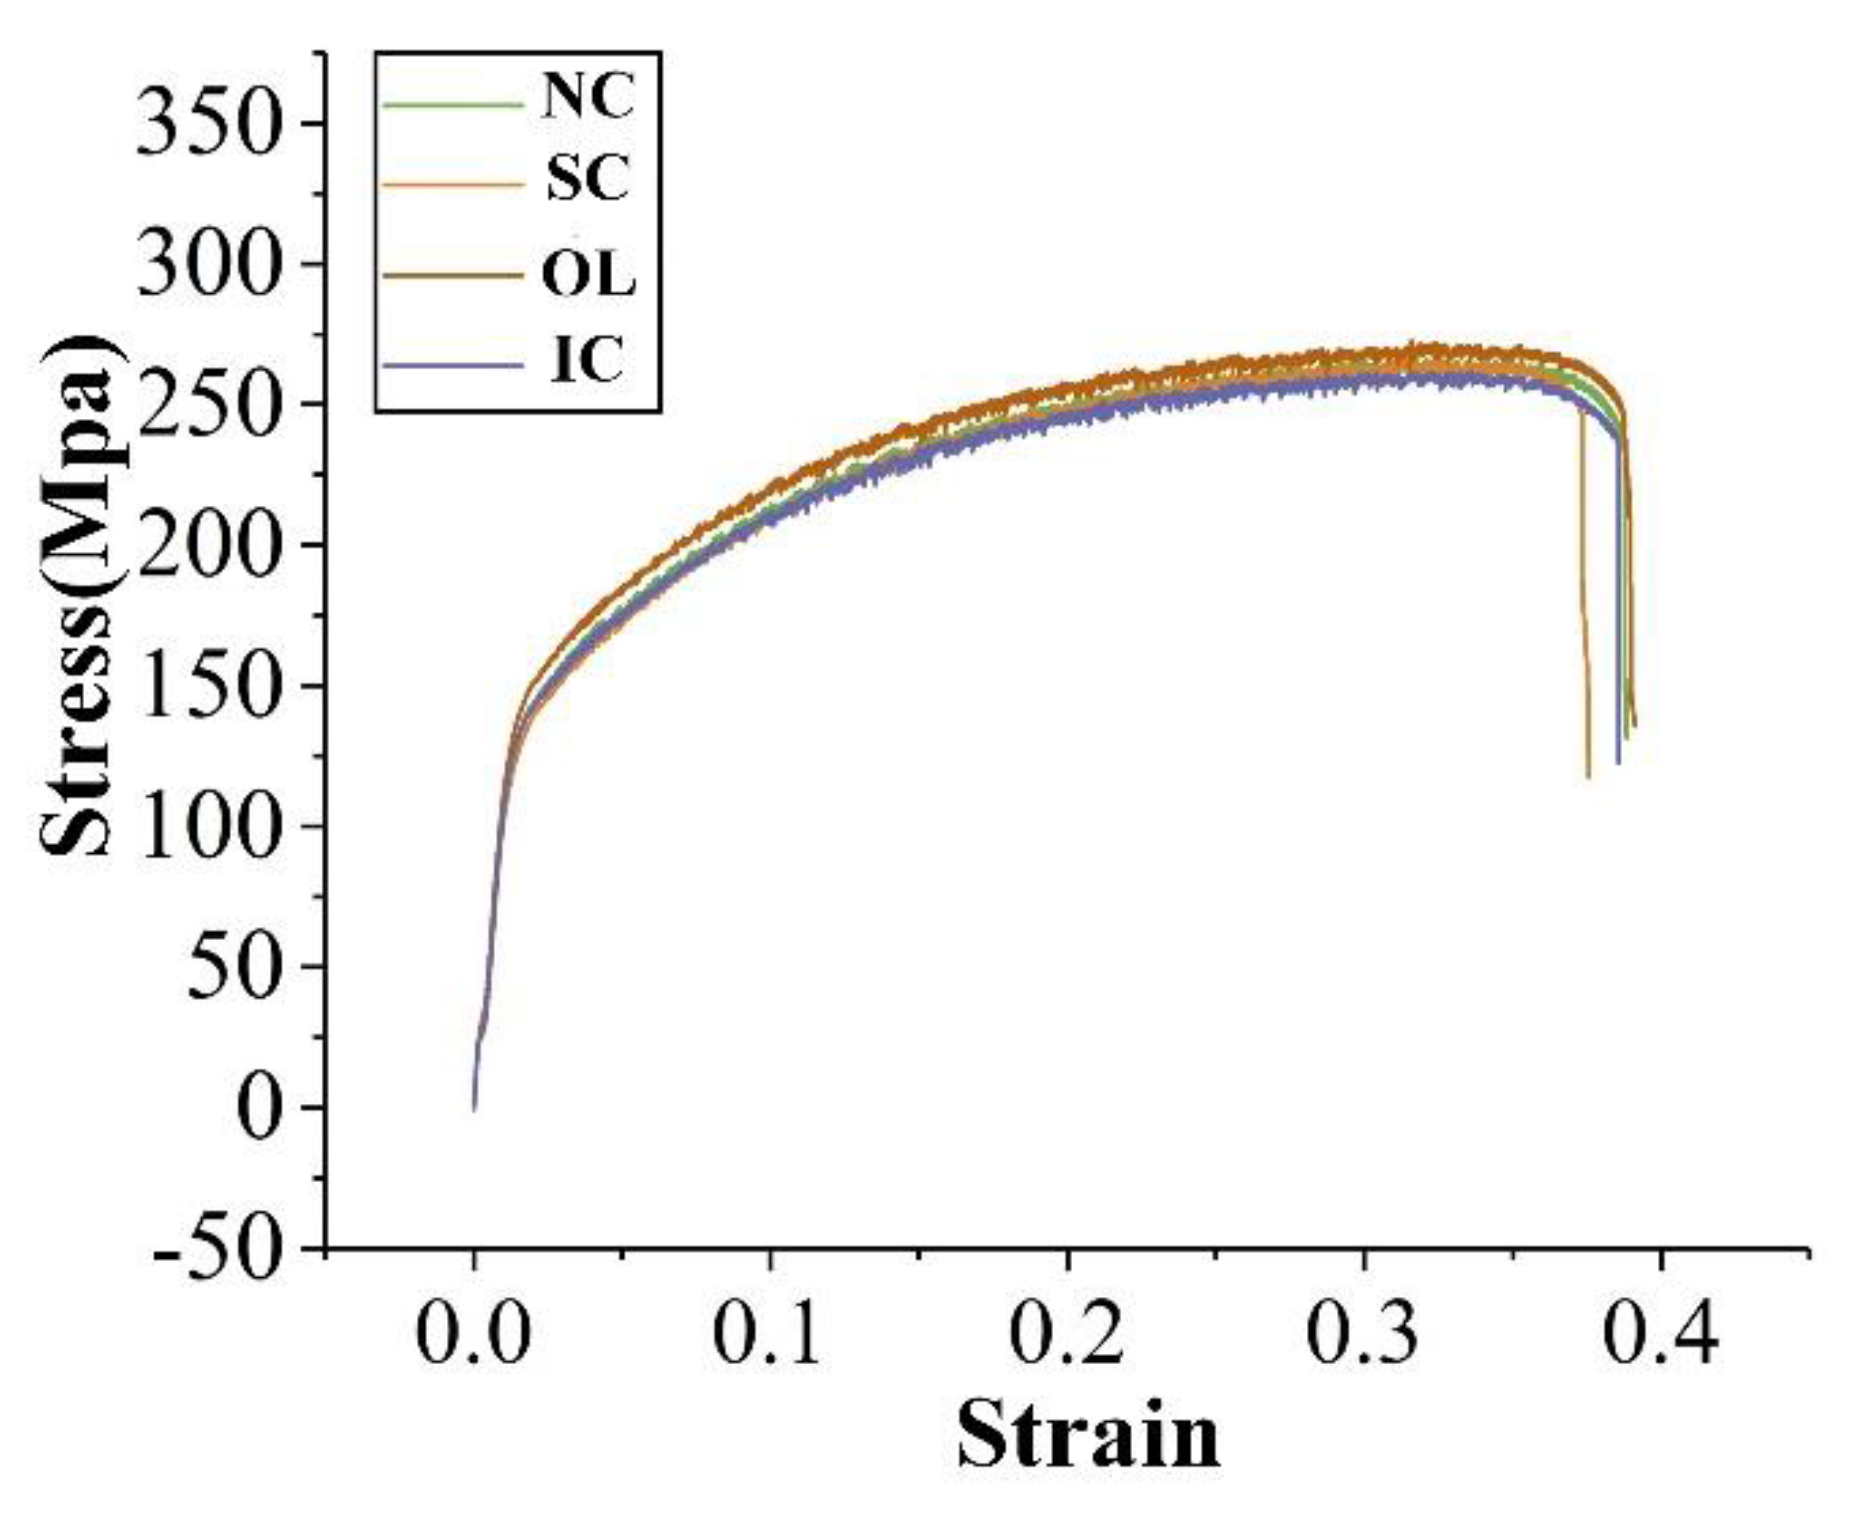
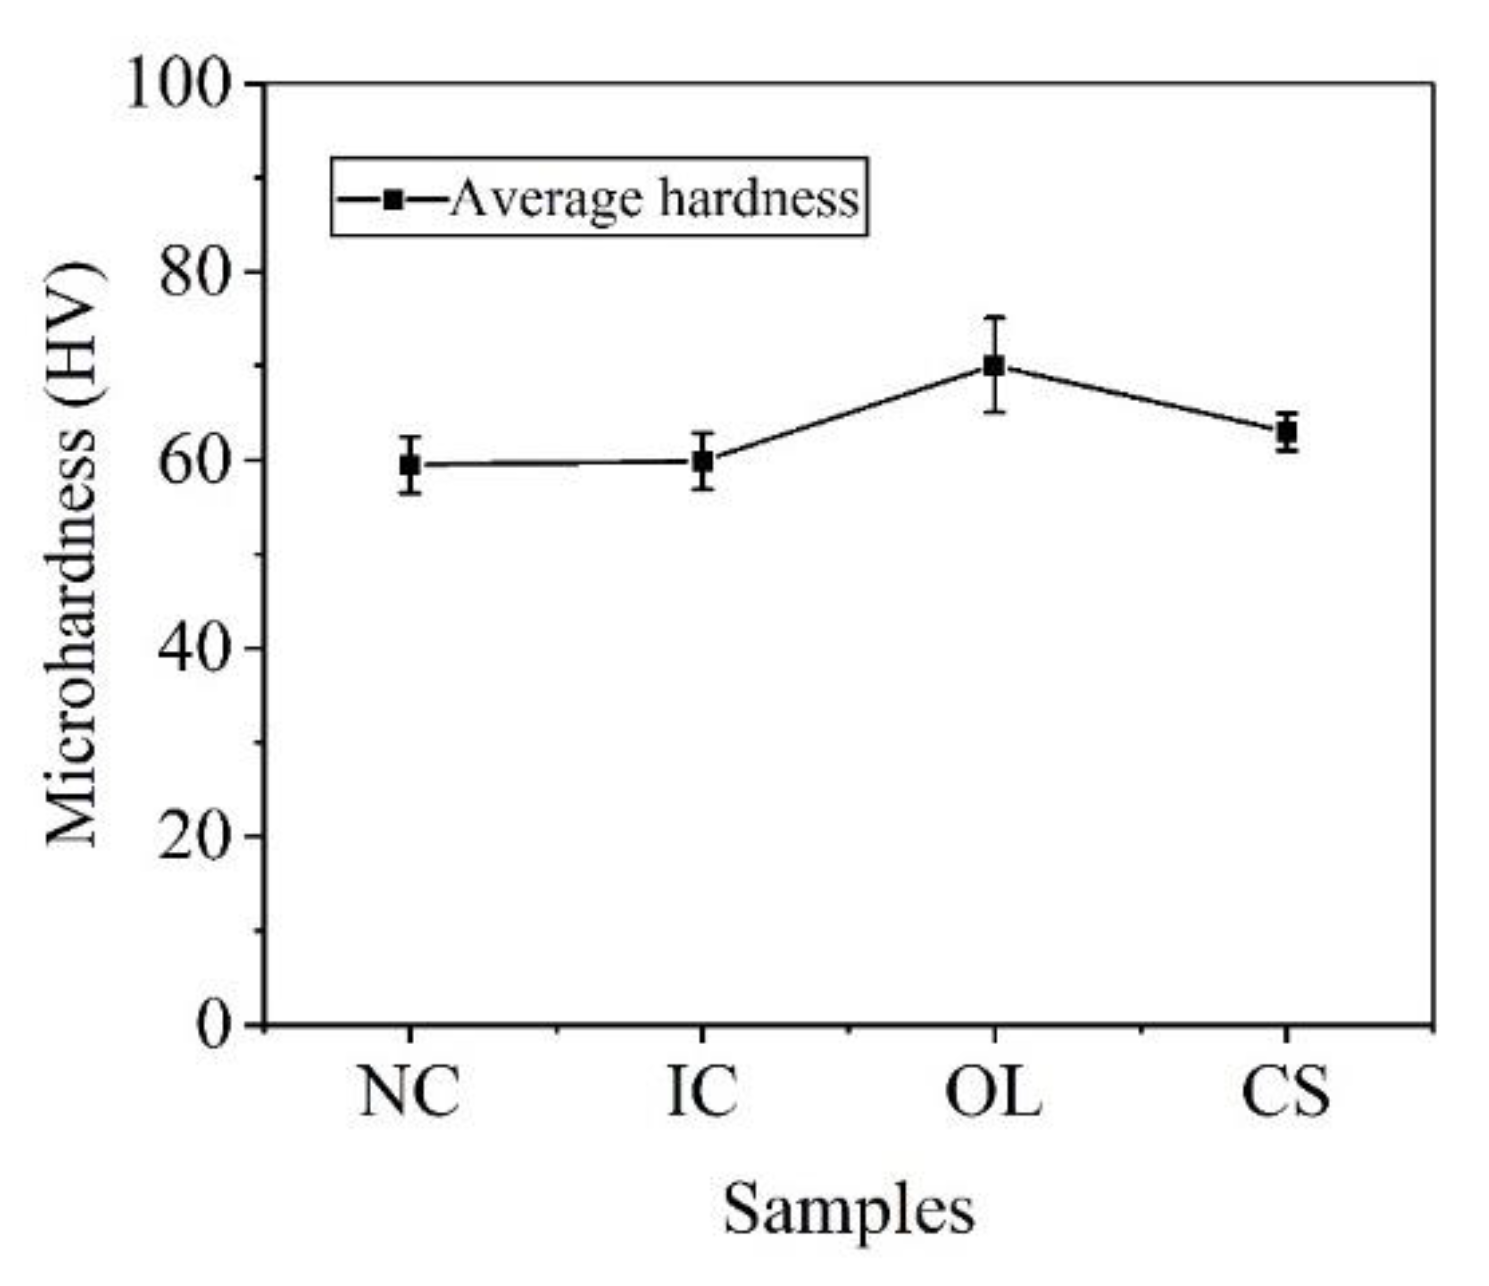
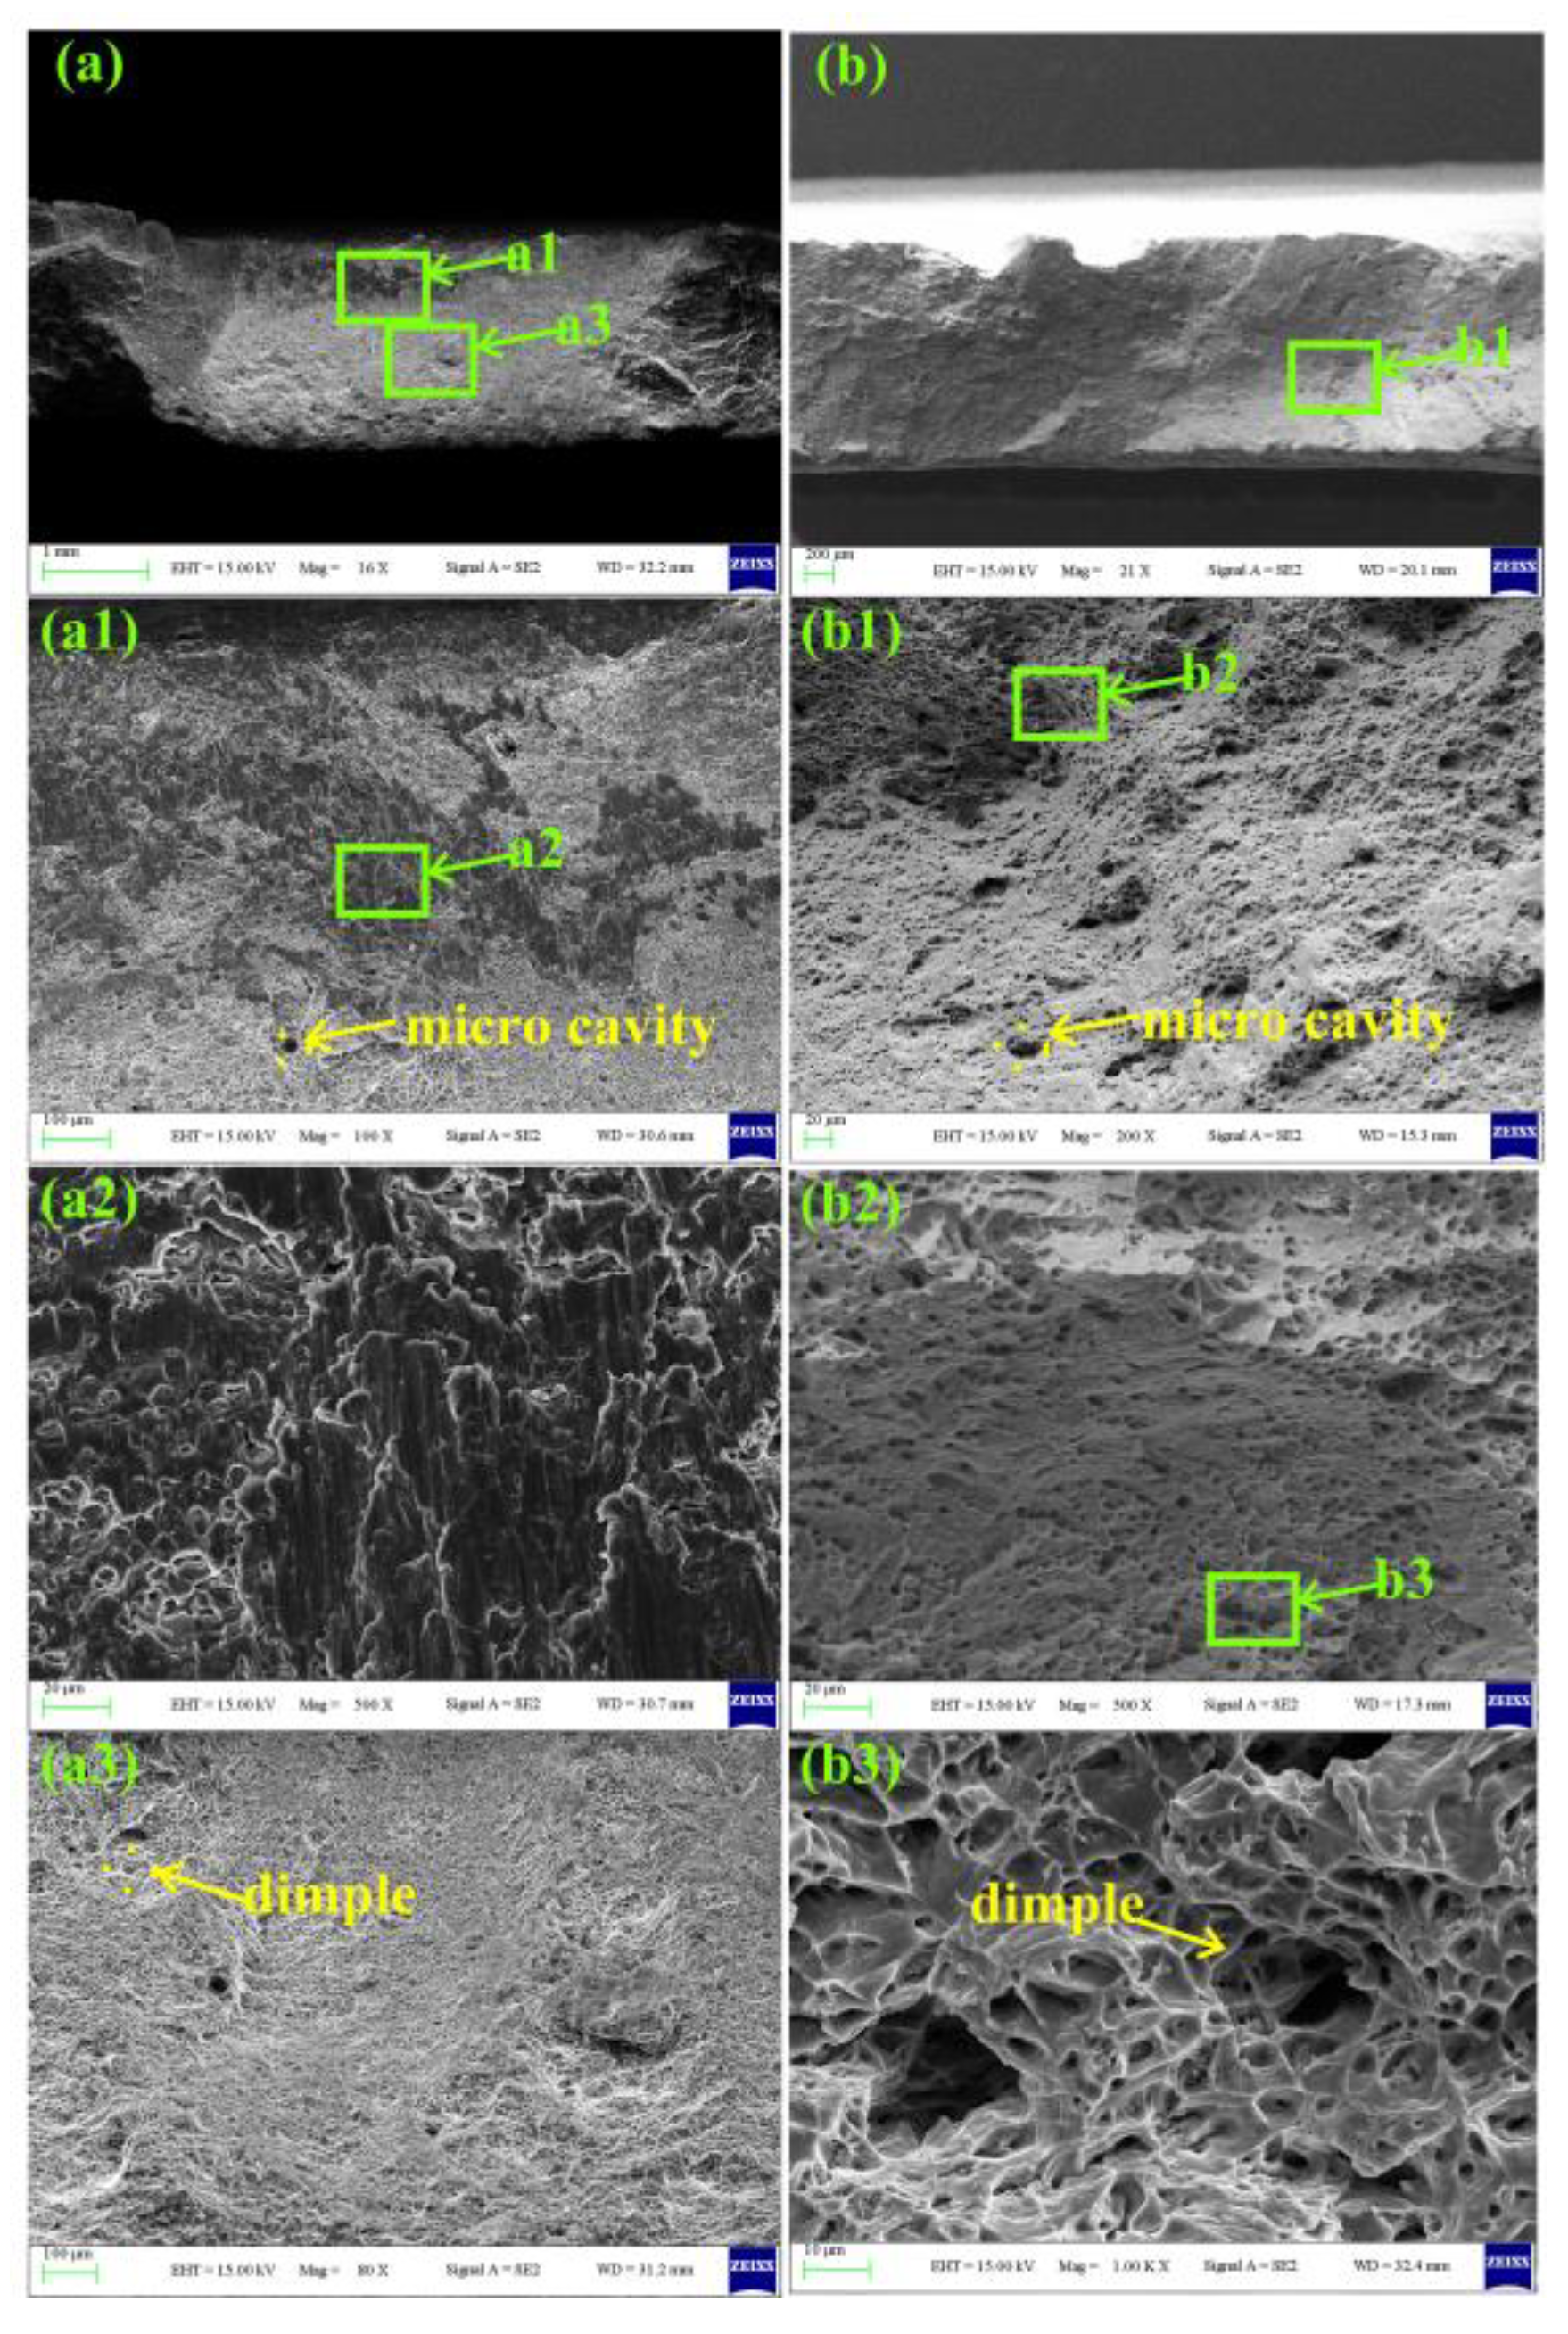
3.3. Mechanical Properties
4. Conclusions
Author Contributions
Funding
Acknowledgments
Conflicts of Interest
References
- Rodrigues, T.A.; Duarte, V.; Miranda, R.M.; Santos, T.G.; Oliveira, J.P. Current Status and Perspectives on Wire and Arc Additive Manufacturing (WAAM). Materials 2019, 12, 1121. [Google Scholar] [CrossRef] [PubMed] [Green Version]
- Wang, Y.; Chen, X.; Konovalov, S.V. Additive Manufacturing Based on Welding Arc: A low-Cost Method1. J. Surf. Investig. X-Ray Synchrotron Neutron Tech. 2017, 6, 1317–1328. [Google Scholar] [CrossRef]
- Shamsaei, N.; Yadollahi, A.; Bian, L.; Thompson, S.M. An overview of Direct Laser Deposition for additive manufacturing; Part II: Mechanical behavior, process parameter optimization and control. Addit. Manuf. 2015, 8, 12–35. [Google Scholar] [CrossRef]
- Kruth, J.P.; Froyen, L.; Van Vaerenbergh, J.; Mercelis, P.; Rombouts, M.; Lauwers, B. Selective laser melting of iron-based powder. J. Mater. Process. Technol. 2004, 149, 616–622. [Google Scholar] [CrossRef]
- Williams, S.W.; Martina, F.; Addison, A.C.; Ding, J.; Pardal, G.; Colegrove, P. Wire + Arc Additive Manufacturing. Mater. Sci. Technol.-Lond. 2016, 7, 641–647. [Google Scholar] [CrossRef] [Green Version]
- Colegrove, P.; Williams, S. High Deposition Rate High Quality Metal Additive Manufacture Using Wire+ Arc Technology; Cranfield University: Bedford, UK, 30 December 2013; pp. 1–42. [Google Scholar]
- Zhang, C.; Li, Y.; Gao, M.; Zeng, X. Wire arc additive manufacturing of Al-6Mg alloy using variable polarity cold metal transfer arc as power source. Mater. Sci. Eng. A 2018, 711, 415–423. [Google Scholar] [CrossRef]
- Derekar, K.; Lawrence, J.; Melton, G.; Addison, A.; Zhang, X.; Xu, L. Influence of Interpass Temperature on Wire Arc Additive Manufacturing (WAAM) of Aluminium Alloy Components. MATEC Web Conf. 2019, 269, 5001. [Google Scholar] [CrossRef]
- Ren, L.; Gu, H.; Wang, W.; Wang, S.; Li, C.; Wang, Z.; Zhai, Y.; Ma, P. Effects of Interpass Cooling on Material Properties of Wire Arc Additive Manufactured Al–6.3Mg Alloy. 3D Print. Addit. Manuf. 2019, 6, 344–353. [Google Scholar] [CrossRef]
- Geng, H.; Li, J.; Xiong, J.; Lin, X. Optimisation of interpass temperature and heat input for wire and arc additive manufacturing 5A06 aluminium alloy. Sci. Technol. Weld. Join. 2017, 22, 472–483. [Google Scholar] [CrossRef]
- Henckell, P.; Günther, K.; Ali, Y.; Bergmann, J.P.; Scholz, J.; Forêt, P. The Influence of Gas Cooling in Context of Wire Arc Additive Manufacturing—A Novel Strategy of Affecting Grain Structure and Size. In Proceedings of the TMS 2017 146th Annual Meeting & Exhibition Supplemental Proceedings, San Diego, CA, USA, 30 March 2017; Society, M.M., Ed.; Springer: Cham, Switzerland; San Diego, CA, USA, 2017; pp. 147–156. [Google Scholar]
- Henckell, P.; Gierth, M.; Ali, Y.; Reimann, J.; Bergmann, J.P. Reduction of Energy Input in Wire Arc Additive Manufacturing (WAAM) with Gas Metal Arc Welding (GMAW). Materials 2020, 13, 2491. [Google Scholar] [CrossRef]
- Su, C.; Chen, X.; Gao, C.; Wang, Y. Effect of heat input on microstructure and mechanical properties of Al-Mg alloys fabricated by WAAM. Appl. Surf. Sci. 2019, 486, 431–440. [Google Scholar] [CrossRef]
- Wu, B.; Pan, Z.; Ding, D.; Cuiuri, D.; Li, H. Effects of heat accumulation on microstructure and mechanical properties of Ti6Al4V alloy deposited by wire arc ad-ditive manufacturing. Addit. Manuf. 2018, 23, 151–160. [Google Scholar] [CrossRef]
- Wu, B.; Pan, Z.; Ding, D.; Cuiuri, D.; Li, H.; Fei, Z. The effects of forced interpass cooling on the material properties of wire arc additively manufactured Ti6Al4V alloy. J. Mater. Process. Technol. 2018, 258, 97–105. [Google Scholar] [CrossRef] [Green Version]
- Li, F.; Chen, S.; Shi, J.; Zhao, Y.; Tian, H. Thermoelectric Cooling-Aided Bead Geometry Regulation in Wire and Arc-Based Additive Manufacturing of Thin-Walled Structures. Appl. Sci. 2018, 8, 207. [Google Scholar] [CrossRef] [Green Version]
- Gu, J.; Ding, J.; Williams, S.W.; Gu, H.; Ma, P.; Zhai, Y. The effect of inter-layer cold working and post-deposition heat treatment on porosity in additively manufactured aluminum alloys. J. Mater. Process. Technol. 2016, 230, 26–34. [Google Scholar] [CrossRef]
- Mullins, W.W.; Sekerka, R.F. Stability of a Planar Interface during Solidification of a Dilute Binary Alloy. J. Appl. Phys. 1964, 35, 444–451. [Google Scholar] [CrossRef]
- Okamoto, H. Al-Mg (aluminum-magnesium). J. Phase Equilibria Diffus. 1998, 6, 598. [Google Scholar] [CrossRef]
- Bai, J.Y.; Fan, C.L.; Lin, S.B.; Yang, C.L.; Dong, B.L. Effects of thermal cycles on microstructure evolution of 2219-Al during GTA-additive manufacturing. Int. J. Adv. Manuf. Technol. 2016, 87, 2615–2623. [Google Scholar] [CrossRef]
- Thangaraju, S.; Heilmaier, M.; Murty, B.S.; Vadlamani, S.S. On the Estimation of True Hall-Petch Constants and Their Role on the Superposition Law Exponent in Al Alloys. Adv. Eng. Mater. 2012, 14, 892–897. [Google Scholar] [CrossRef]
- Dieter, G.E.; Bacon, D.J. Mechanical Metallurgy, 1st ed.; McGraw-Hill: New York, NY, USA, 1986; Volume 1, p. 609. [Google Scholar]
- Hull, D.; Bacon, D.J. Introduction to Dislocations, 4th ed.; Butterworth-Heinemann: Woburn, UK, 2001; Volume 1, p. 250. [Google Scholar]
- Ryen, Ø.; Nijs, O.; Lander, E.S.; Holmedal, B.; Ekström, H.E.; Nes, E. Strengthening Mechanisms in Solid Solution Aluminum Alloys. Metall. Mater. Trans. A 2006, 6, 1999–2006. [Google Scholar] [CrossRef]


| Composition | Mg | Mn | Cr | Cu | Zn | Fe + Si | Al |
|---|---|---|---|---|---|---|---|
| ER5356 | 4.5–5.5 | 0.05–0.2 | 0.15–0.35 | 0.1 | 0.1 | 0.5 | Bal. |
| 5052 | 2.2–2.8 | 0.1 | 0.05–0.2 | 0.1 | 0.1 | 0.45 | Bal. |
| Process Parameters | Details | Parameter |
|---|---|---|
| Deposition power | Current | 160 A |
| Arc voltage | 23 V | |
| Speed | Travel speed | 0.022 m/s |
| Wire feed speed | 11 m/min | |
| Distance and angle | Contact tube to workpiece | 12 mm |
| filler wire to workpiece | 90° | |
| Flow rate(argon) | WAAM torch | 24 L/min |
| Deposition power setting | MIG/MAG | - |
| Parameters Unit | Air Pressure Bar | Gas Consumption Stard Liter Per Minute (SLPM) | Cooling Capacity Kcal/hr |
|---|---|---|---|
| Details | 6.9 | 1410 | 857 |
© 2020 by the authors. Licensee MDPI, Basel, Switzerland. This article is an open access article distributed under the terms and conditions of the Creative Commons Attribution (CC BY) license (http://creativecommons.org/licenses/by/4.0/).
Share and Cite
Wang, B.; Yang, G.; Zhou, S.; Cui, C.; Qin, L. Effects of On-Line Vortex Cooling on the Microstructure and Mechanical Properties of Wire Arc Additively Manufactured Al-Mg Alloy. Metals 2020, 10, 1004. https://doi.org/10.3390/met10081004
Wang B, Yang G, Zhou S, Cui C, Qin L. Effects of On-Line Vortex Cooling on the Microstructure and Mechanical Properties of Wire Arc Additively Manufactured Al-Mg Alloy. Metals. 2020; 10(8):1004. https://doi.org/10.3390/met10081004
Chicago/Turabian StyleWang, Baoxing, Guang Yang, Siyu Zhou, Can Cui, and Lanyun Qin. 2020. "Effects of On-Line Vortex Cooling on the Microstructure and Mechanical Properties of Wire Arc Additively Manufactured Al-Mg Alloy" Metals 10, no. 8: 1004. https://doi.org/10.3390/met10081004