Abstract
Laser welding is widely used for the joining of aluminum alloy in the automotive industry, and the vehicles produced are inevitably subjected to high strain rate loading during their service. Therefore, this paper studied the mechanical properties of 6061-T6 aluminum alloy and its laser welded joint at strain rates between 0.0003 and 1000 s−1. Results showed that the microstructure of welded material (WM) was much finer than base material (BM), typical columnar crystals grew perpendicularly to the fusion line, and the minimum hardness value (~56 HV) was obtained inside WM. The strength and dynamic factors of BM and WM increased with increasing strain rate, and the strength of WM was less sensitive to strain rate compared with BM. The strain rate effect was not homogenous in the plastic deformation region. The modified Johnson–Cook (J–C) model which introduced the term C = C1 + C2·ε could well describe the dynamic plastic deformation of BM. However, the fitted results of the simplified J–C model were overall better than the modified J–C model for WM, especially for high strain rate (1000 s−1). These findings will benefit the determination of the dynamic deformation behavior of laser welded aluminum alloy under high strain rates, and could provide a better understanding of lightweight and the safety of vehicles.
1. Introduction
With the development of lightweight technology, the requirements for automotive materials are becoming more stringent in order to make vehicles more energy-efficient and ensure the safety of passengers. Aluminum alloy has become the preferred material for the alternative structural steel in the automotive industry because of its low density, high strength, good weldability, and corrosion resistance [1,2,3].
It is unavoidable to adopt welding technology for automobiles due to their complex structure. Laser welding, characterized by high energy density, is widely used in the automotive industry [4]. However, the performance between the welded joint and base material often differs, so the welded parts become easier to fracture. Besides, vehicles are inevitably subjected to high strain rate loading during their service. Therefore, it is of great importance to study the high strain rate behavior of aluminum alloy welded joints.
Some researchers have studied the dynamic mechanical properties of aluminum alloys. Ye et al. [5] investigated the dynamic deformation behavior of 6063 alloy with different initial aging conditions at different strain rates ranging from 1000–5000 s−1 by split Hopkinson pressure bar, and found that the dynamic evolution of the precipitates had a great effect on the mechanical property of the impacted 6063 alloy. Olasumboye et al. [6] found that the rate of strain hardening decreased with the increase in strain rate when studying the micromechanical properties of aluminum alloy at strain rate 1000–3500 s−1. Tiwai et al. [7] investigated the deformation behavior of aluminum alloy at high strain rate using Split Hopkinson Torsional Bar at strain rates ranging from 700–2000 s−1 and found that the overall texture weakened with increase in strain rate and strain.
Constitutive models of aluminum alloy have been studied by some researchers. Xie et al. [8] studied the constitutive model of 6063 aluminum alloy under ultrasonic vibration upsetting based on the Johnson–Cook model, the new constitutive model is accurate and the maximum error of which is 5.71%. Khan et al. [9] studied the thermo-mechanical responses of Al 2024-T351 at strain rates from 10−4 to 103 s−1 under different temperatures, and the Khan–Liu phenomenological constitutive model was proposed to predict the mechanical behavior of the alloy over wide ranges of strain rate and temperature. Tan et al. [10] described the dynamic mechanical properties of aluminum alloy at room temperature by modifying the strain rate hardening coefficient in the Johnson–Cook (J–C) constitutive model.
As can be seen, many researches have focused on the dynamic deformation behavior of aluminum alloys at strain rates larger than 103 s−1 by the split-Hopkinson bar test, which has been widely used at a strain rate range of 103–105 s−1. However, the maximum strain rate of automotive structural parts in a general vehicle frontal crash test is within 103 s−1 [11], and the mechanical properties and deformation behavior of materials under the different strain rates were significantly different [12]. Besides, investigation on the mechanical properties of laser welded aluminum alloy under high strain rate is very limited, especially for the establishment of constitutive models. It is necessary to make clear the dynamic deformation behavior of laser welded aluminum alloy under high strain rates to provide a better understanding of lightweight and the safety of vehicles.
This paper, therefore, aims to study the microstructural evolution and mechanical properties of 6061-T6 aluminum alloy and its laser welded joint at strain rates of 0.0003–1000 s−1, and a simplified and modified Johnson–Cook model was adopted to describe the constitutive equation of the investigated materials.
2. Materials and Methods
The base materials (BM) investigated in this study were 3.0 mm thick 6061-T6 aluminum alloy sheets. The main chemical composition is as follows: 0.4–0.8% Si, 0.7% Fe, 0.15–0.40% Cu, 0.15% Mn, 0.8–1.2% Mg, 0.04–0.35% Cr, 0.15% Ti, 0.25% Zn, 0.015% Ni (in wt%), and the remainder is Al. The plates with dimensions of 500 mm × 150 mm were joined along the rolling direction by a YLS-6000 fiber laser (IPG Photonics Co., Oxford, MA, USA) after grinding and cleaning the butt surfaces. High-purity argon was used as shielding gas with a flow rate of 10 L/min. The laser power and welding speed were chosen as 3 kW and 3 m/min, respectively.
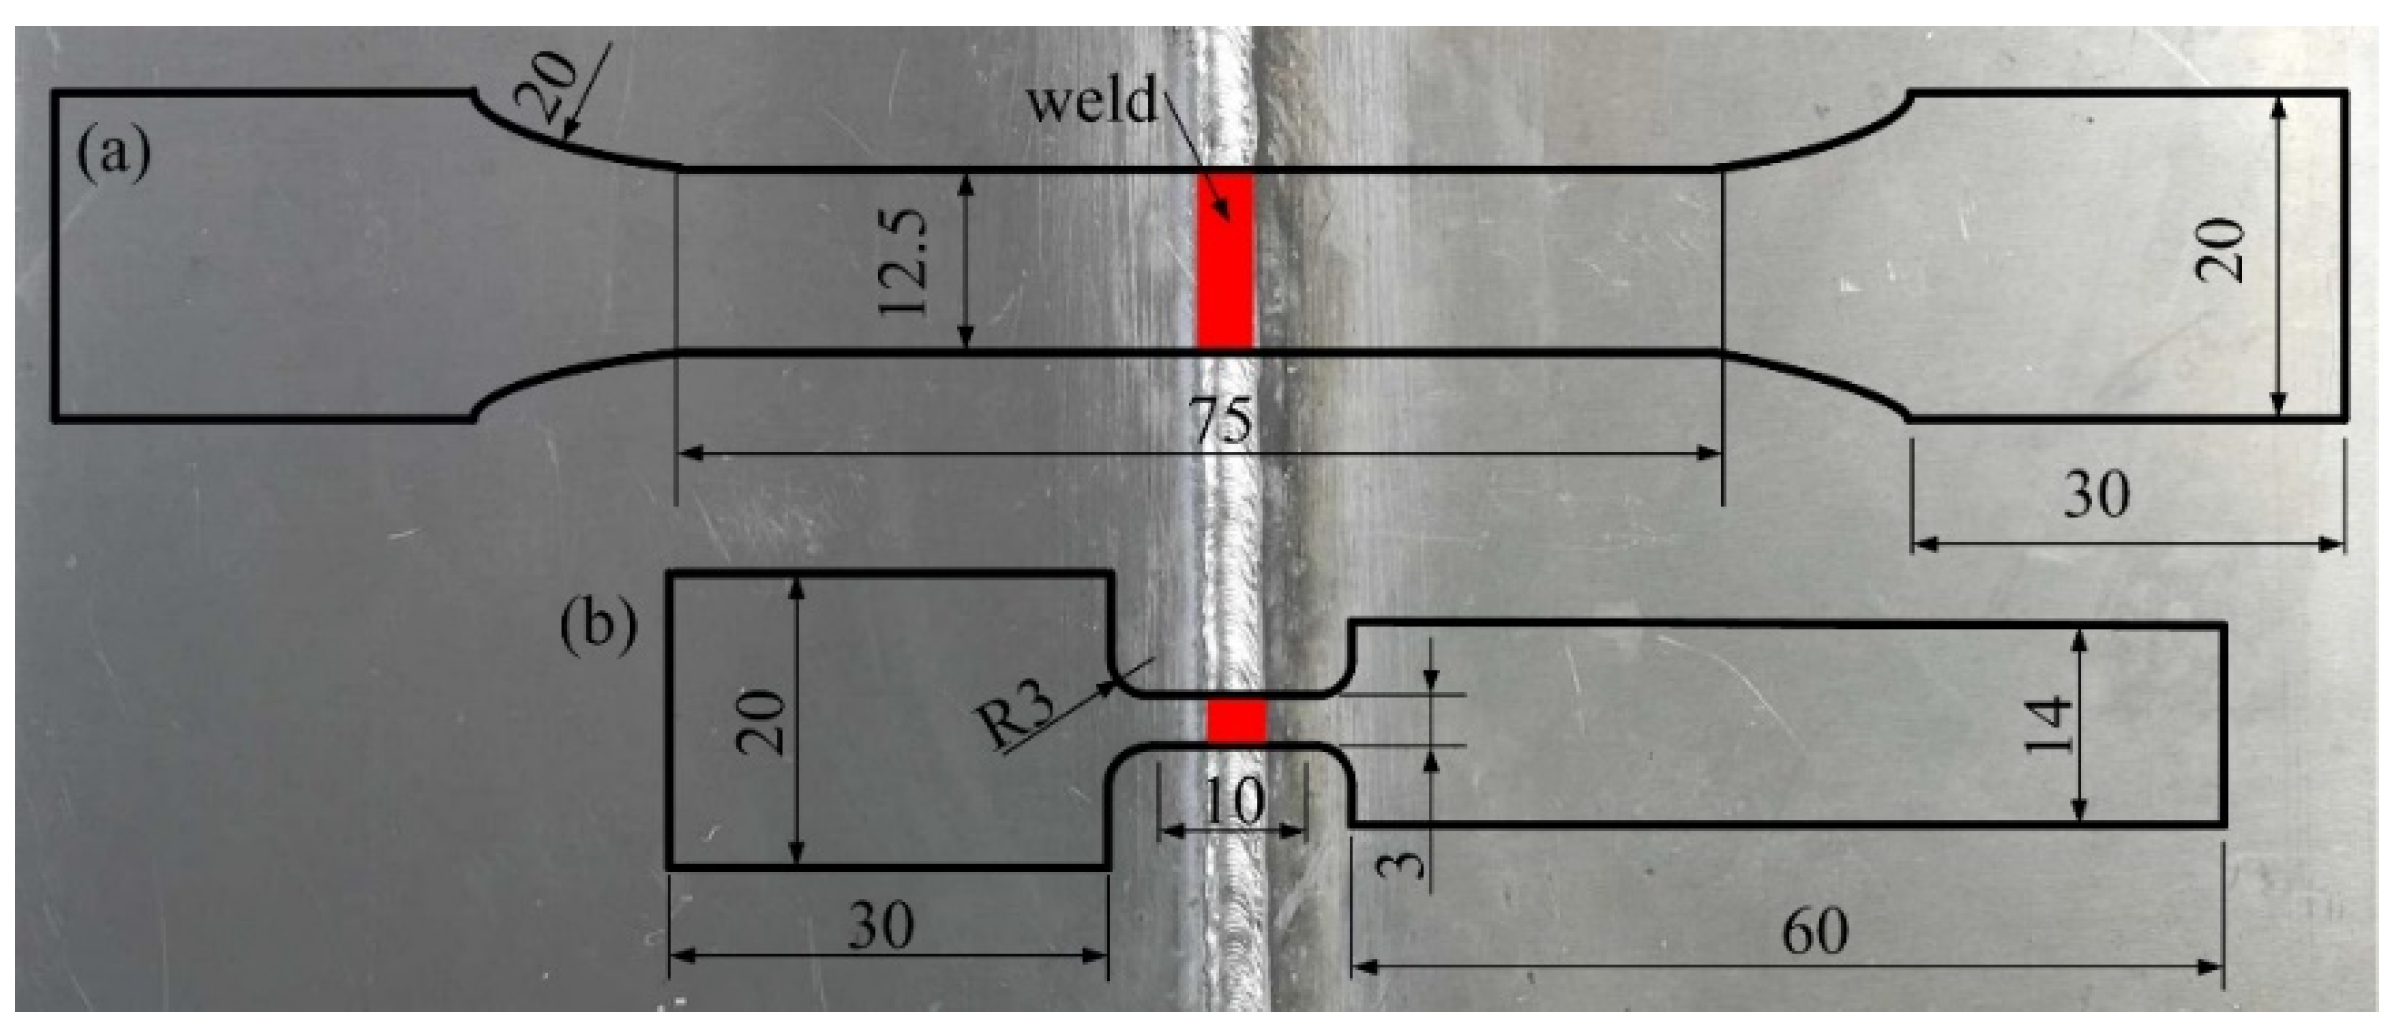
The samples for tensile tests were cut by electrical discharge machining. For the laser welded plates, the weld was positioned at the center of the gauge length. Figure 1a shows the specimen dimensions for low strain rate (0.0003 s−1), and Figure 1b for high strain rates (1–1000 s−1). The gauge length-to-width ratio for the high strain rate sample was 3.33, so it could effectively reduce the error during the test and obtain more accurate data [13]. Tensile tests at a strain rate of 0.0003 s−1 for both BM and welded material (WM) were conducted at room temperature by an MTS 810 machine (MTS Systems Co., Eden Prairie, MN, USA). The ZWICK HTM5020 high-speed tensile testing machine (Zwick GmbH & Co. KG, Ulm, Germany) was adopted for the high strain rate tests (1– 1000 s−1) at room temperature, which could achieve a constant loading speed of 0–20 m·s−1 and a maximum load of 50 kN. Detailed description of the experimental technique was presented in our earlier publication [14]. All the samples were broken in the gauge section, and the welded sheets were broken in the weld.
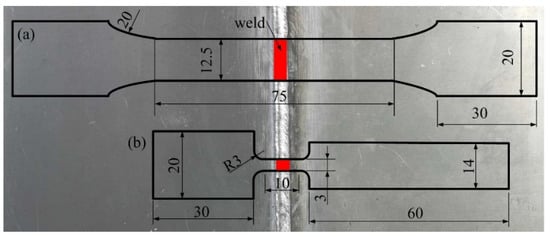
Figure 1.
Geometry of the tensile specimen for (a) low strain rates and (b) high strain rates. (in mm).
The fracture morphology was observed by scanning electronic microscopy (SEM). The metallographic samples of weld joint and surface morphology near the fracture were cut and etched by Keller reagent after grinding and polishing, then the microstructure was observed by optical microscopy (OM). The hardness across the weld joint was measured by a Vickers hardness tester with a load of 200 g and dwell time of 10 s.
3. Results and Discussion
3.1. Microstructure and Hardness Profile
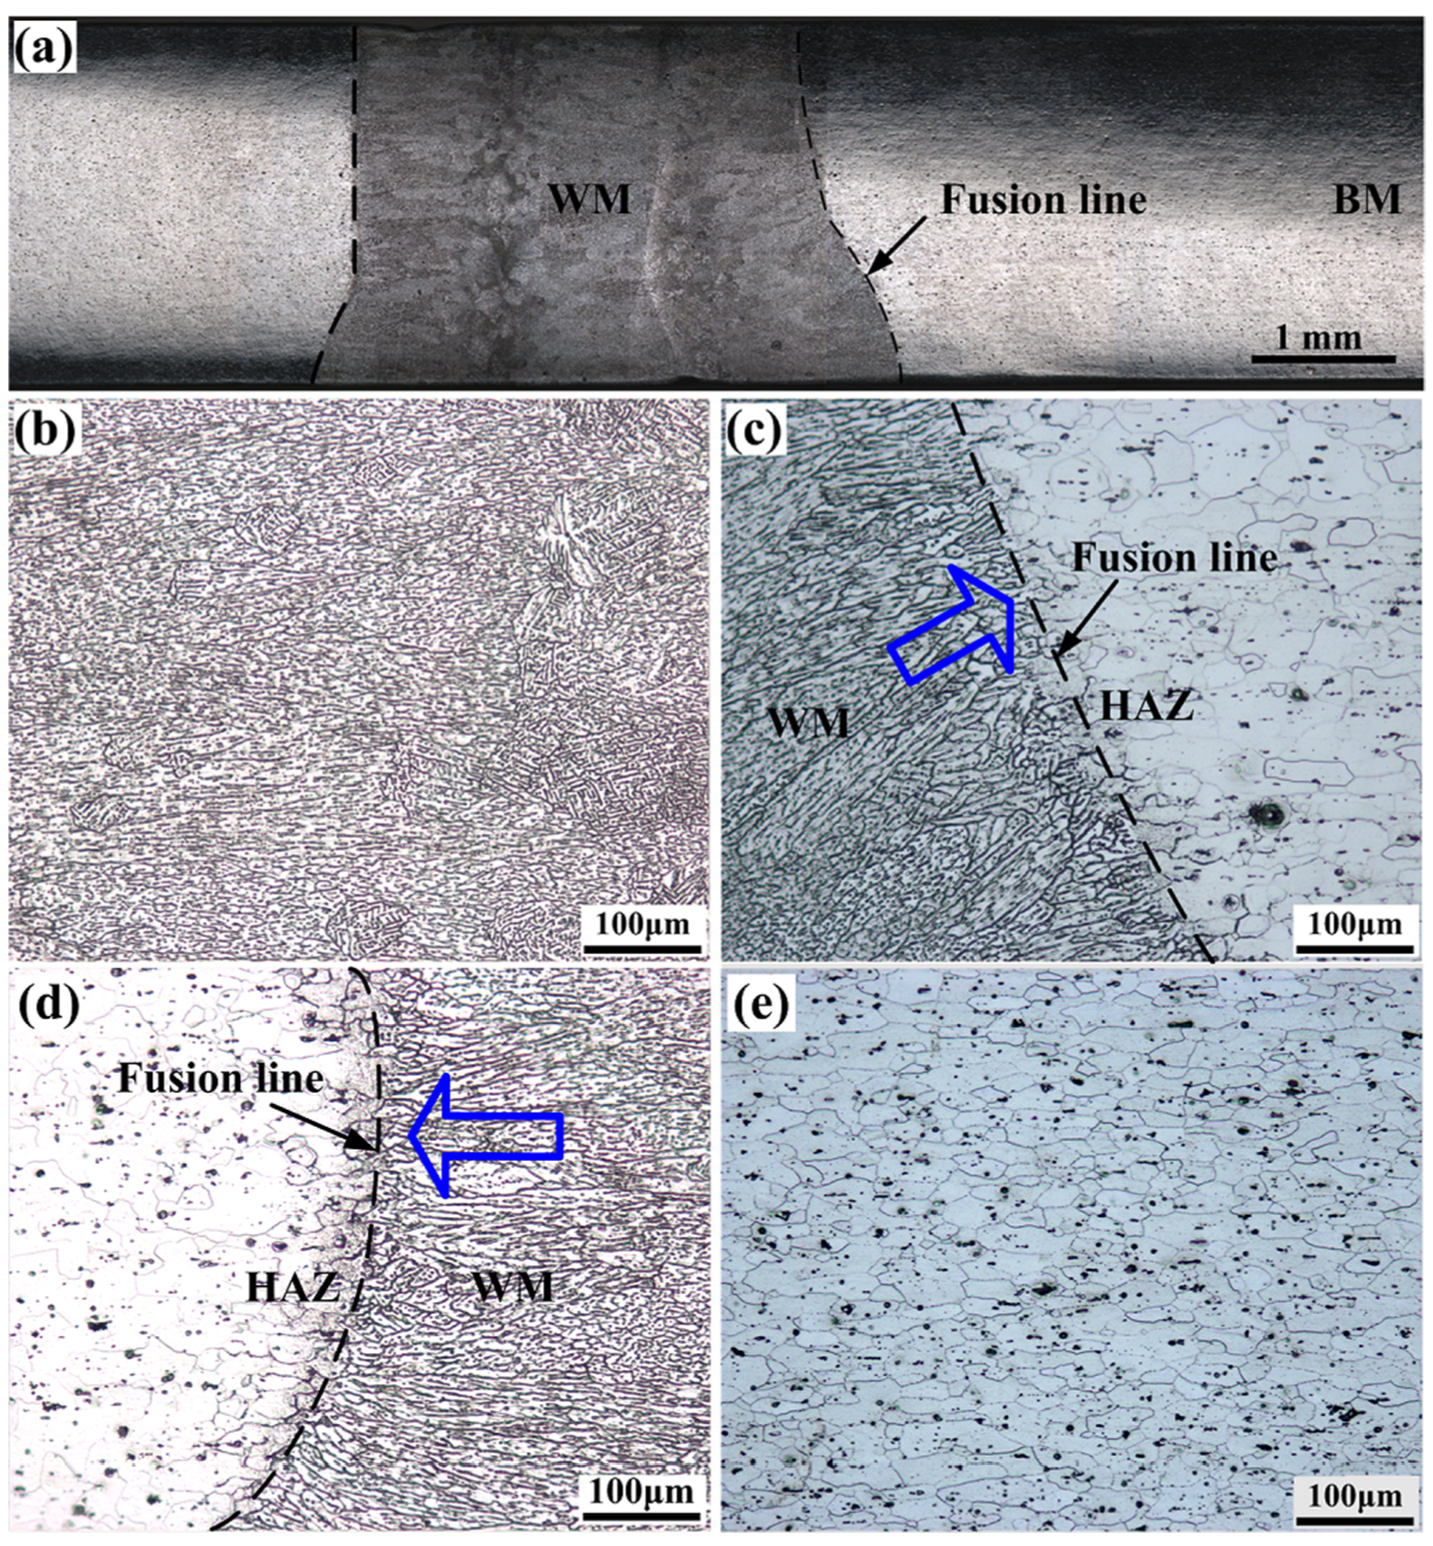
Figure 2a shows the overall view of the weld cross section. It is clear that fully penetrated weld metals with a typical wine glass shape were obtained. The microstructure of the WM was composed of dendrites, as shown in Figure 2b, and it was much finer than that of BM (Figure 2e) and attributed to the high heating and cooling rates during the laser welding. Figure 2c,d represents the microstructure near the fusion line, and shows that the transition between the material that was fused to the material was only affected by the heat generated during welding. Typical columnar crystals which were perpendicular to the fusion line were observed, as indicated by the blue arrows. This is because the growth rate of columnar crystals is characterized by anisotropy, the growth rates vary in different crystallographic directions, and tend to grow along the fastest direction of heat dissipation, which should be perpendicular to the isotherm [15]. In laser welding, the fastest cooling direction is perpendicular to the fusion line, so the columnar grains near the fusion line grow perpendicularly to it. Since the heat was very localized, the area that experienced obvious microstructural changes was small, and the microstructure of the heat affected zone (HAZ) was similar to BM.
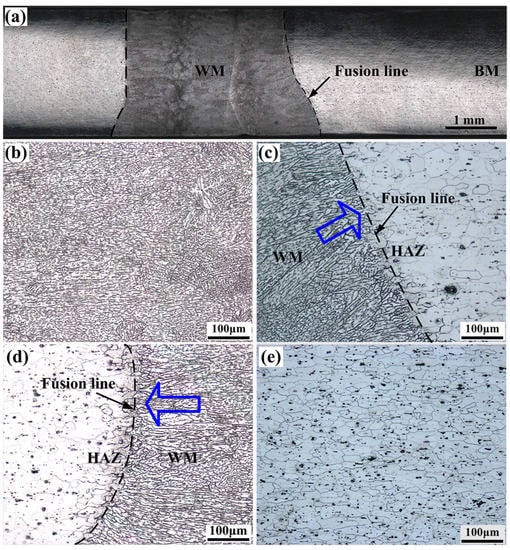
Figure 2.
Microstructure evolution of laser welded joint: (a) overall view of the cross section; (b) welded material (WM); (c) fusion line; (d) fusion line; (e) base material (BM).
Figure 3 shows the hardness distribution of the laser welded joint. As can be seen, the minimum hardness value (~56 HV) was obtained inside the WM. The WM presented a width of 3.8 mm and the HAZ had a width of approximately 0.5 mm from each side of the WM. Laser welding guarantees a high energy density and a small heat input, so the size of HAZ was very small. This narrow HAZ could reduce many of the problems that readily occur in the heat affected zone, and this is an advantage of laser welding compared to other welding methods.
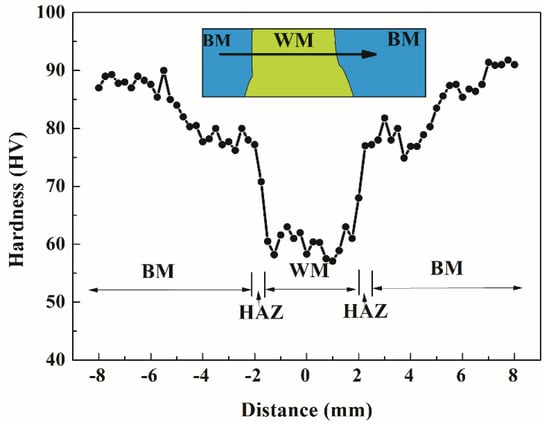
Figure 3.
Hardness distribution of laser welded joint. HAZ = heat affected zone.
The weld metal was rapidly heated to a molten state under the high temperature of the laser, and the temperature of WM exceeded the melting temperature of the strengthening phase in the Al matrix, resulting in the major strengthening phases being dissolved in the molten pool, and hardly being re-precipitated within the weld [2,16]. Instead, the reversion of Mg2Si, which contributes little to the hardness, occurred in WM. As a result, the strengthening effect of BM introduced by thermomechanical treatment and aging disappeared, leading to a decrease in hardness of WM. The softening phenomenon of HAZ was mainly due to the occurrence of over-aging in the welding heat-affected zone, the second phase dissolved, precipitated, and then grew, so the hardness of HAZ was lower than BM.
3.2. Mechanical Properties
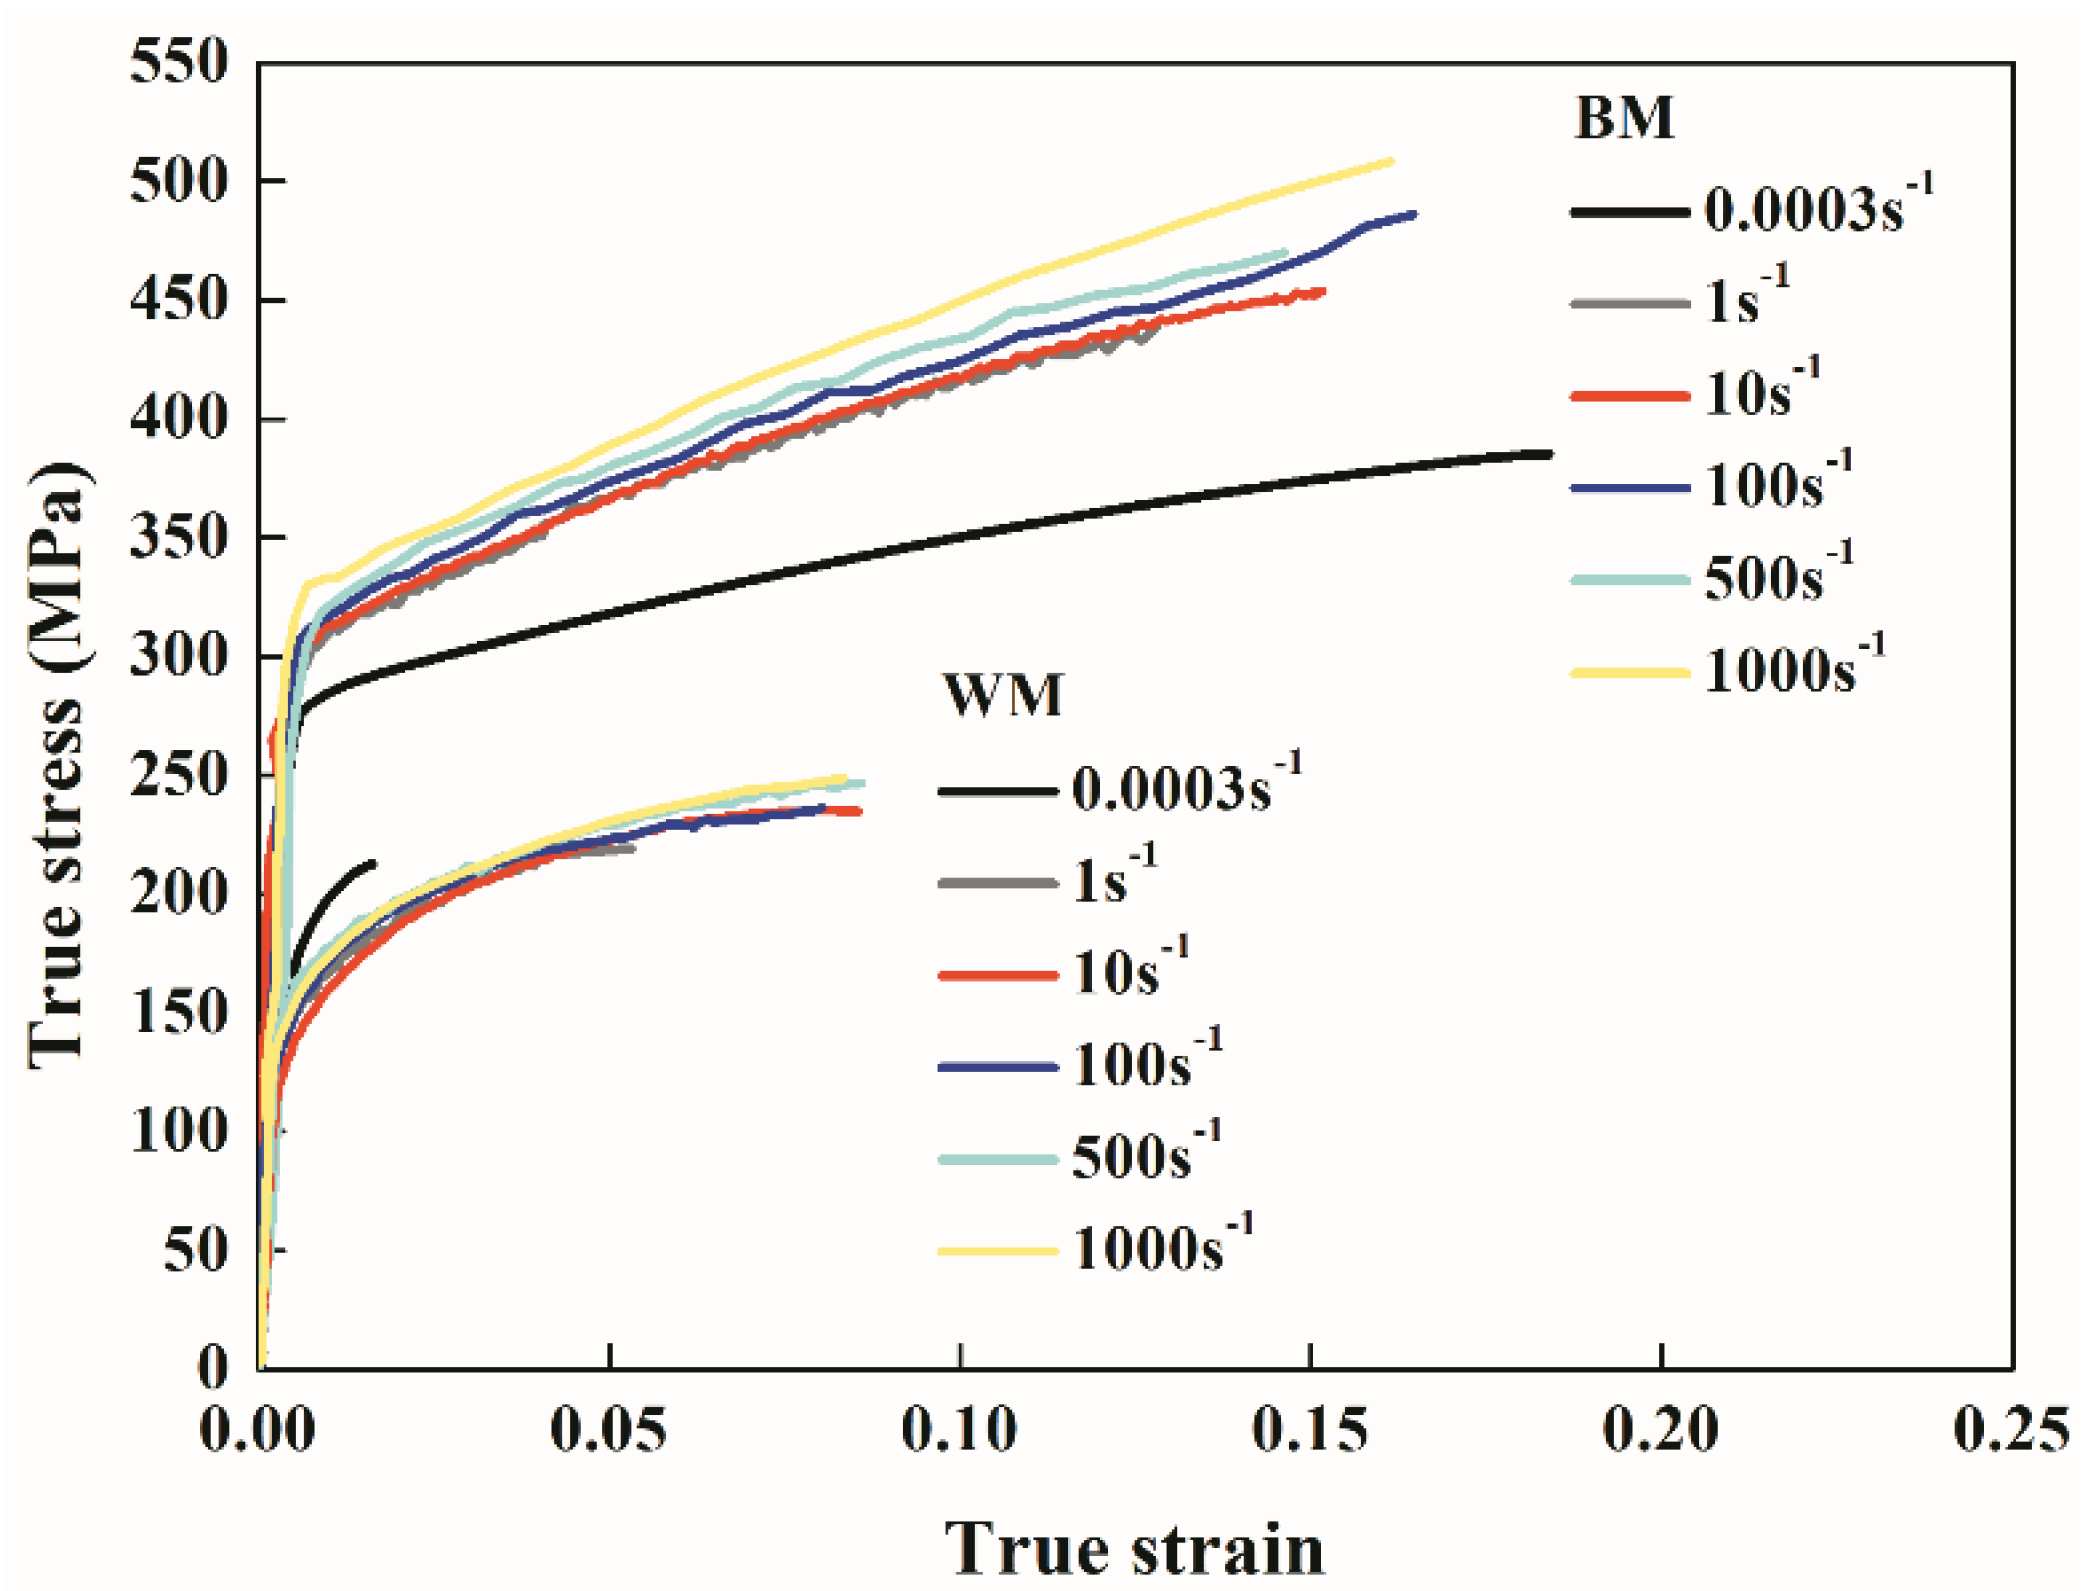
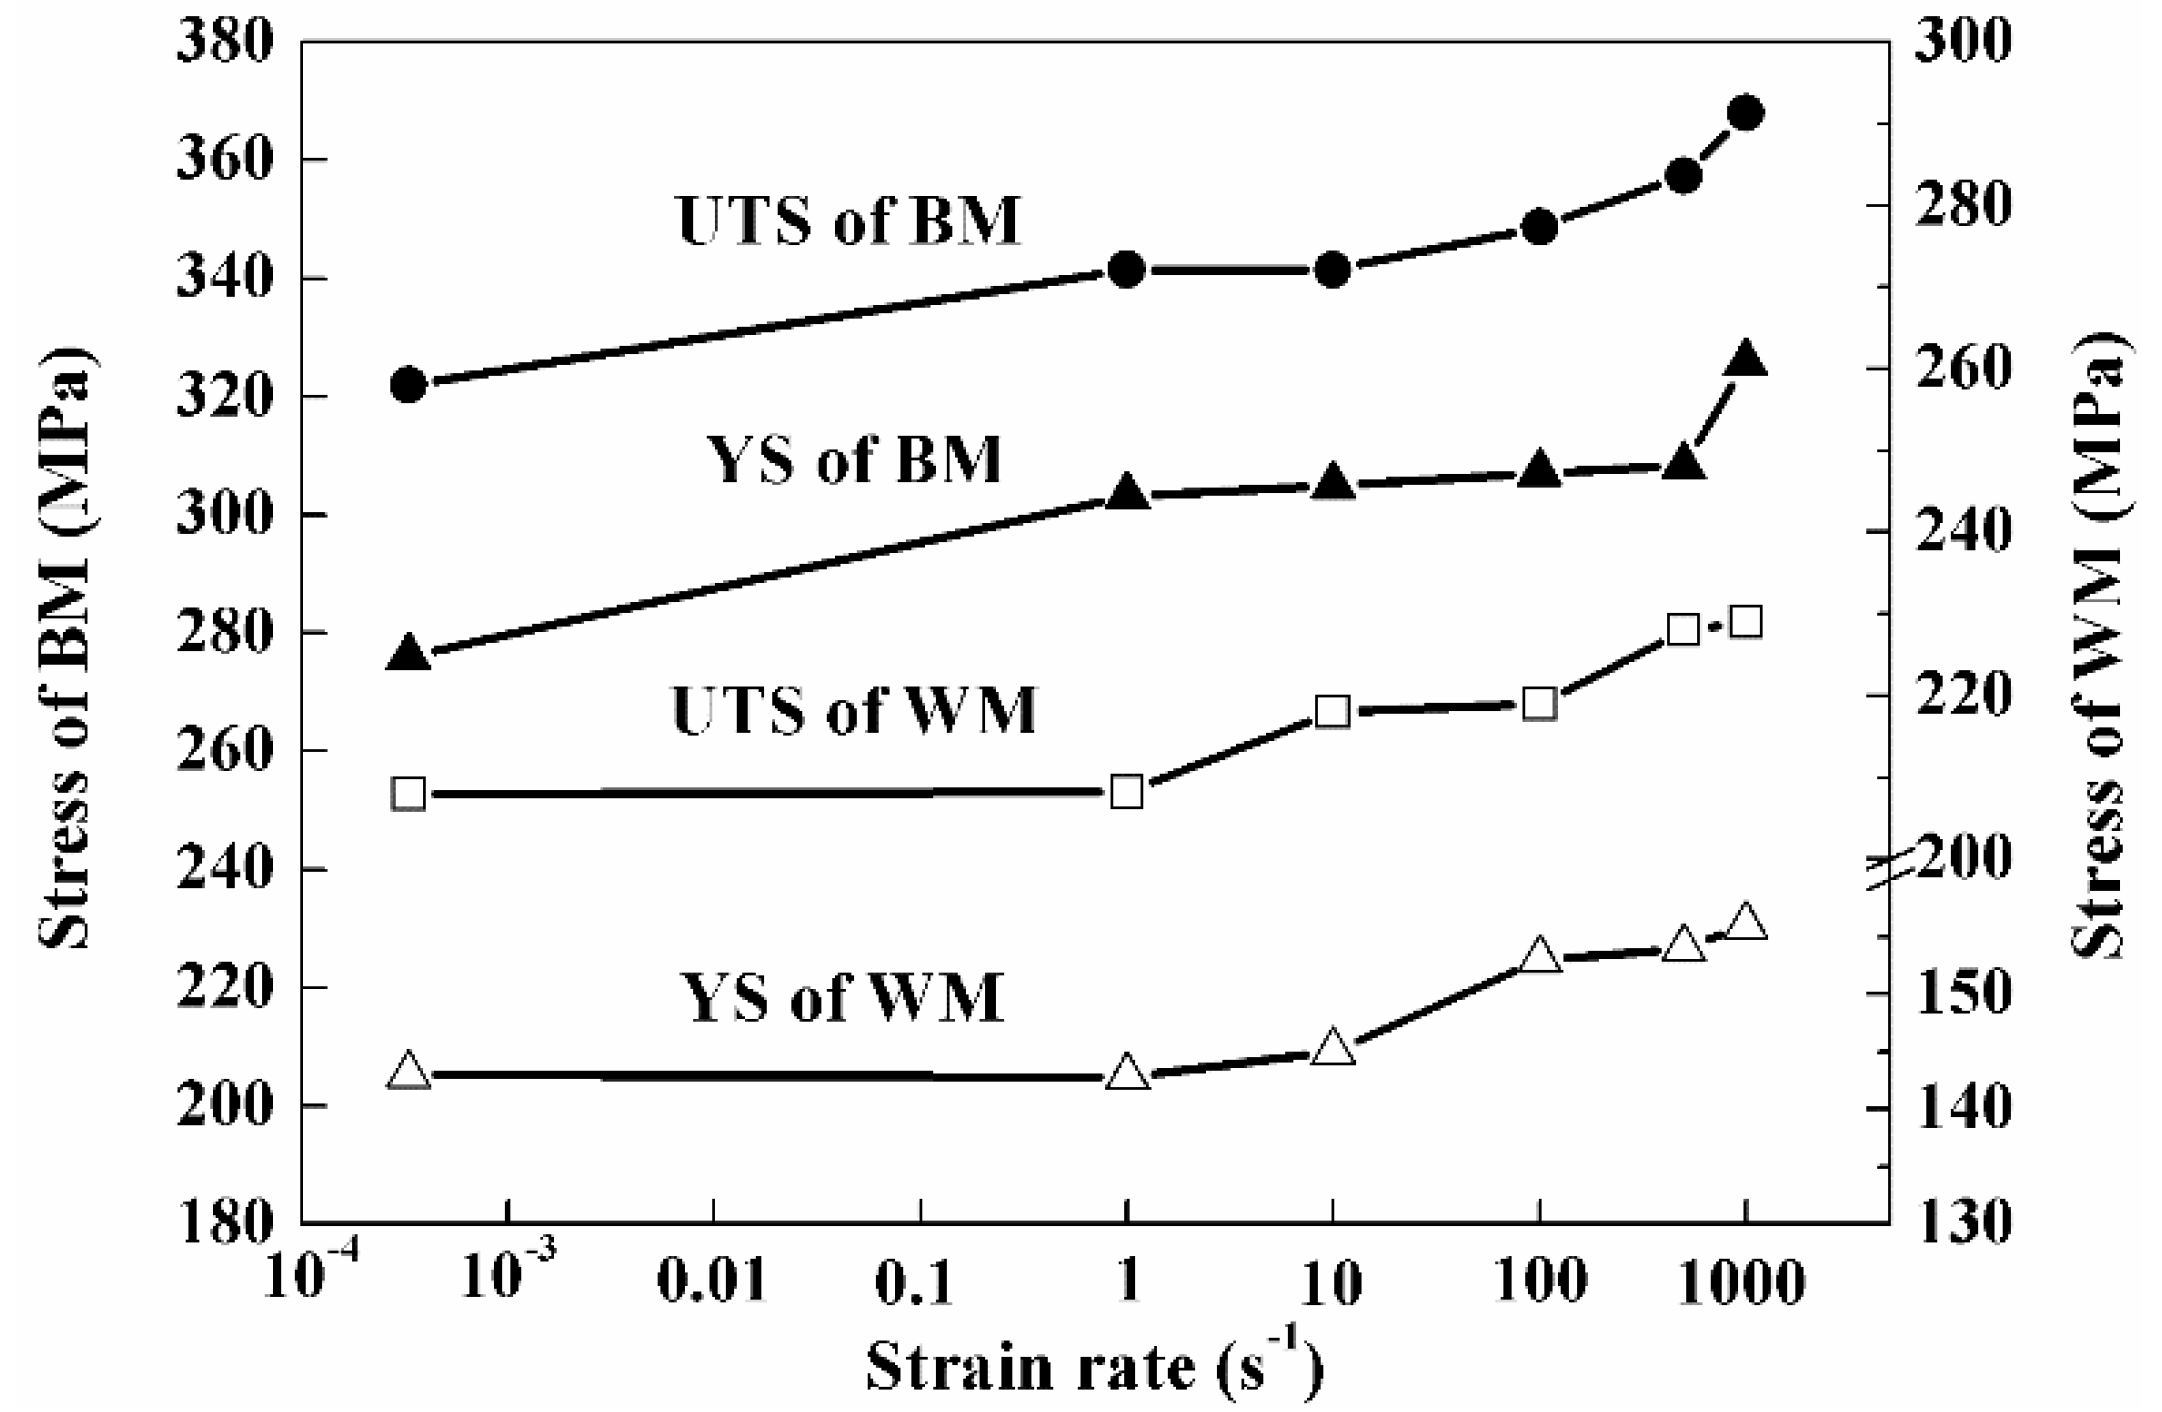
Figure 4 shows the true stress-strain curve of BM and the welded aluminum alloy under different strain rates, while Figure 5 summarizes the trend of mechanical properties. As can be seen, the yield strength (YS) and ultimate tensile strength (UTS) of BM and WM tend to increase with the increasing strain rate. Plastic deformation is achieved by the slip of dislocations, which can be hindered and constrained by various defects when sliding in the crystal lattice. With increasing loading speed, the dislocation density increased and the crystal surface rotated deficiently, so that it was difficult for the slip to penetrate the entire grain, the growth and extension of slip was blocked [12]. Therefore, the force required to overcome the barrier became larger, i.e., the strength of the specimen increased.
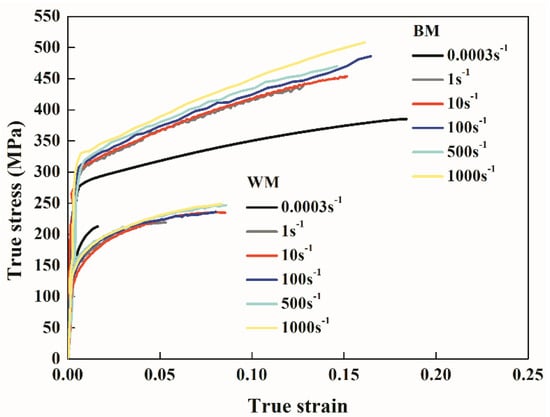
Figure 4.
True stress-true strain curve of BM and WM at different strain rates.
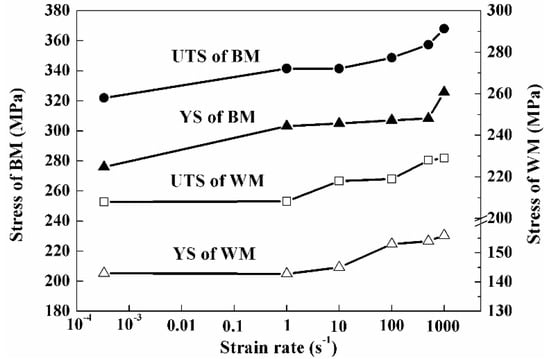
Figure 5.
Yield strength (YS) and ultimate tensile strength (UTS) of BM and WM at different strain rates.
Besides, the strength of 6061-T6 aluminum changed significantly after welding. The strength of WM was lower than that of BM, the joint efficiency reached 61.3%. First, there were some inevitable defects in the weld zone. Second, the dissolution of hardening precipitates and the burning loss of elements due to the thermal cycle during the laser welding process also contributed to the decrease of strength.
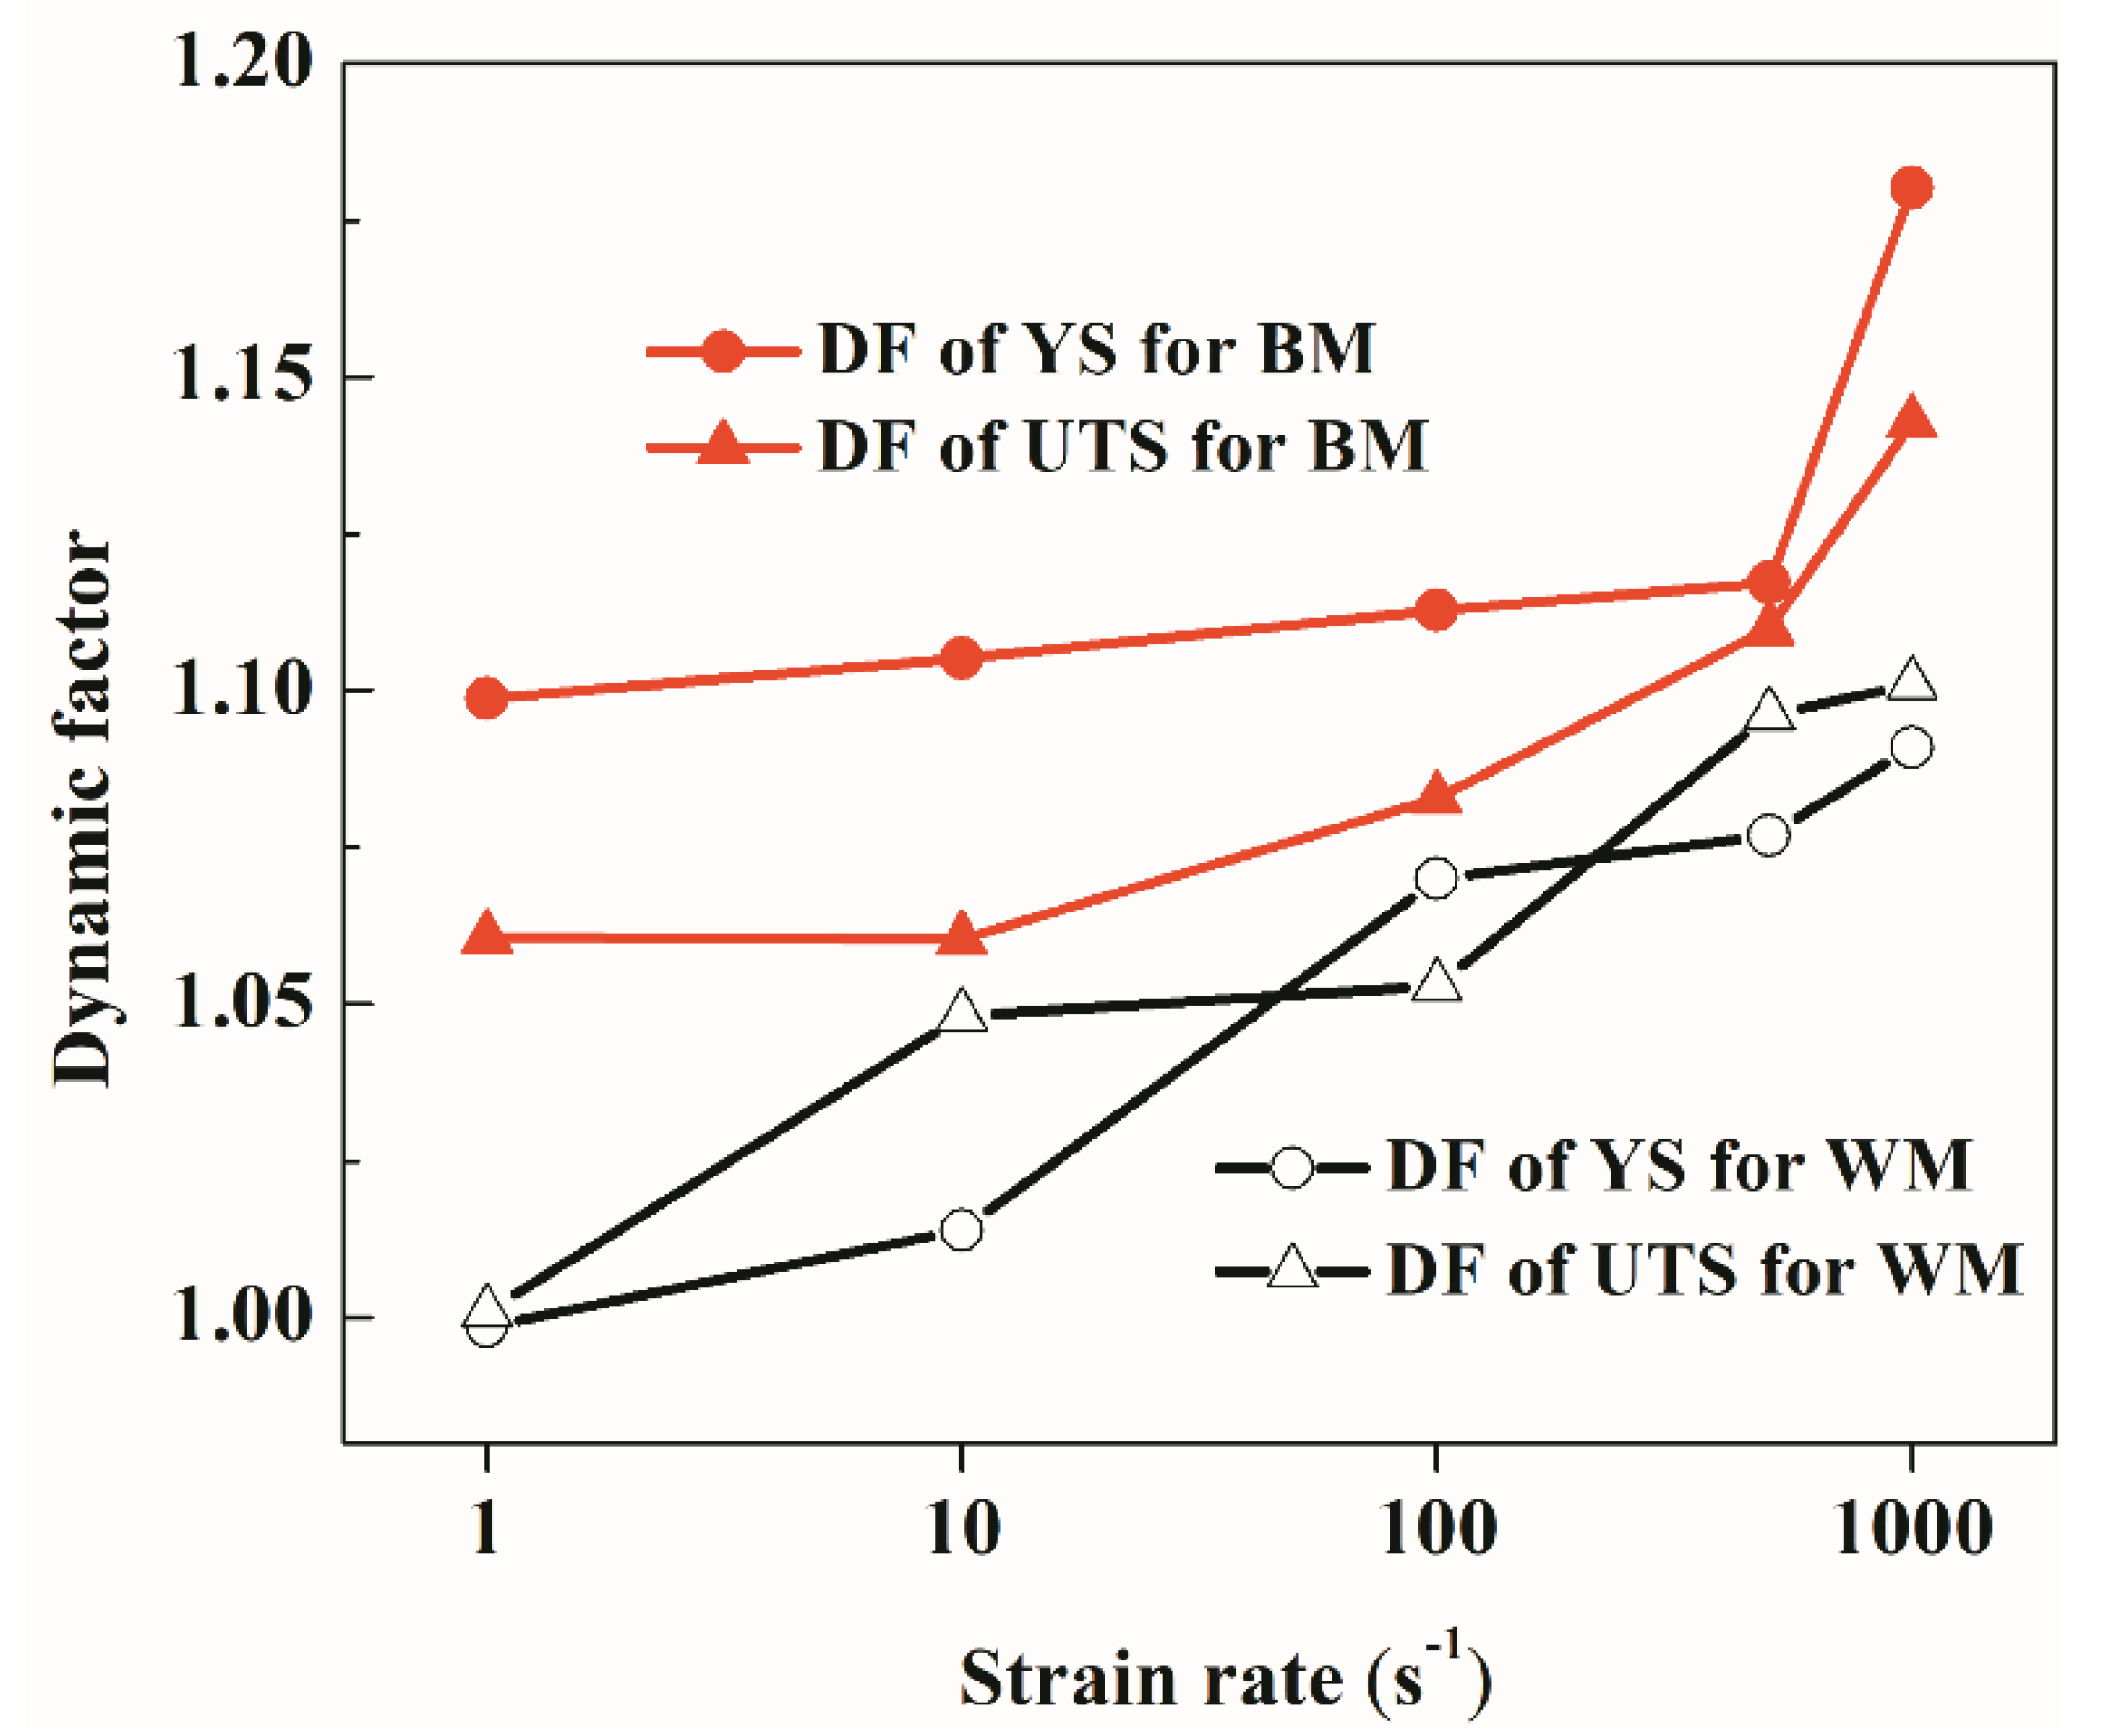
Dynamic factor (DF, the ratio of strength under different strain rate) is usually used to evaluate the strain rate sensitivity of materials [17]. Here, the strength at 0.0003 s−1 was chosen as reference to calculate the dynamic factor of YS and UTS, as shown in Figure 6. It can be seen that both the dynamic factor of YS and UTS for BM and WM increased with increasing strain rate, indicating the strain rate hardening phenomenon of 6061 aluminum alloy. However, the DF of WM was significantly smaller than that of BM, which means the strength of the alloy after laser welding was less sensitive to the strain rate compared with BM. This was because the elongation of WM was much smaller than BM due to the weld defects, so strain hardening effect could not be fully exerted. Besides, a sudden rise in DF for BM was seen between 500–1000 s−1 strain rate. As mentioned above, when the strain rate reached 1000 s−1, the loading speed became so fast that the rotation of the crystal surface was not sufficient so that the force required to overcome the barrier became larger, and the degree of dislocation tangles became so severe that the multisystem slips could not offset the increase of dislocation motion resistance.
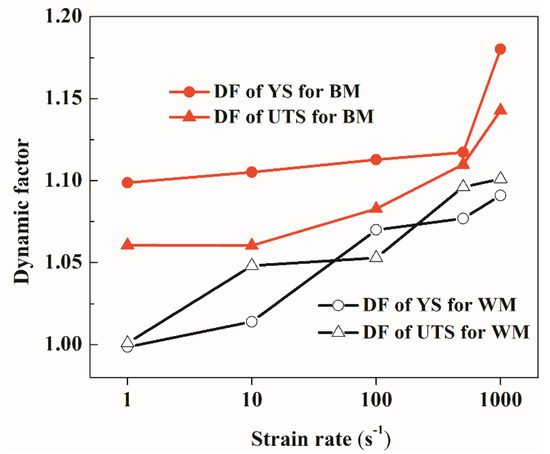
Figure 6.
Dynamic factors (DF) of the investigated material at different strain rates.
3.3. Fracture Mechanism
The fracture morphology of BM and laser WM at strain rate of 1 s−1 and 1000 s−1 are shown in Figure 7. The BM shows the characteristics of transgranular ductile fracture. The fracture morphology of the same material exhibited no significant change under different strain rates. However, the dimples of WM were much finer than those of BM, which is consistent with the microstructure analyzed in Section 3.1.
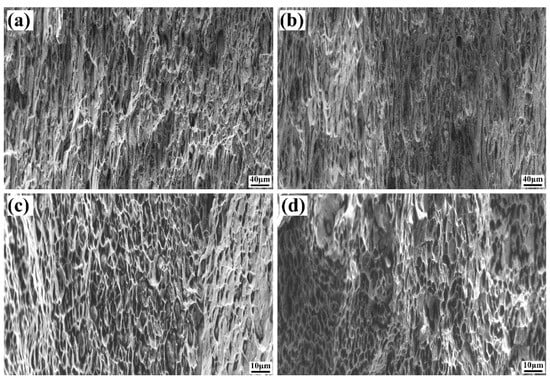
Figure 7.
Fracture morphology of the investigated material at different strain rates: (a) BM at 1 s−1; (b) BM at 1000 s−1; (c) HAZ at 1 s−1; (d) HAZ at 1000 s−1.
Figure 8 shows the microstructure of BM after fracture at 500 s−1. It is obvious that the grains near the fracture tip (Figure 8b) elongated along the loading direction, while the grains at 6 mm away from the fracture tip (Figure 8c) became more equiaxed. The Feret ratios, the ratio of grain size along and perpendicular to the loading direction [18], were calculated to evaluate the plastic deformation in the microstructure. More than 200 grains of each position (every 1 mm from the fracture tip) were measured by Imagetool software to ensure accuracy.
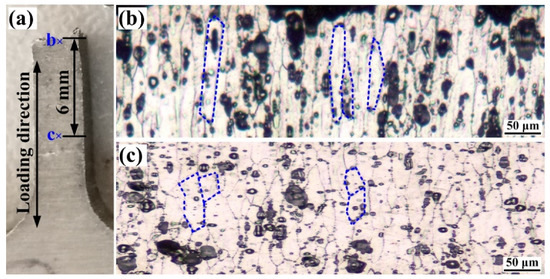
Figure 8.
Overall view (a) of the sample fractured at a strain rate of 500 s−1 and microstructure near the fracture(b) and 6 mm away from the fracture tip (c).
Figure 9 shows that the Feret ratio decreased nonlinearly with increasing distance from the fracture tip, indicating the strain rate effect was not homogenous in the plastic deformation region, the microstructure near the crack tip deformed more severely. Moreover, the Feret ratio tended to increase with the strain rate between 1–500 s−1. But the Feret ratio at 1000 s−1 was abnormally low because the degree of dislocation tangles under such high strain rate became so severe that the grains were restricted in being able to deform sufficiently. As shown in Figure 2b, the grains in WM are too small to measure, so the Feret ratio of WM was not calculated.
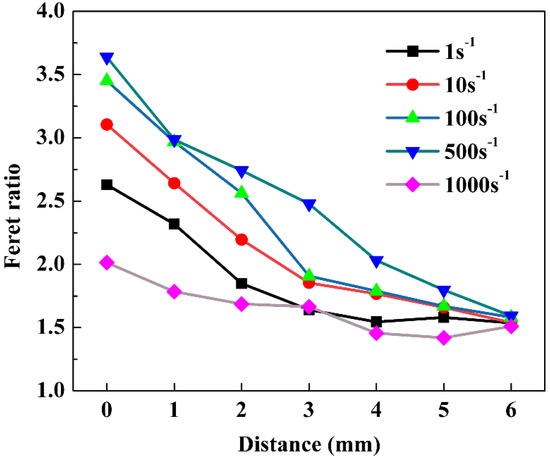
Figure 9.
Feret ratio as a function of distance from the fracture tip of BM at different stain rates.
3.4. Constitutive Model of Base Material
The simplified Johnson–Cook (J–C) constitutive model [14,19], which considers the work hardening and strain rate hardening, is commonly used to describe the behavior of materials under different strain rates at room temperature. This model is given by Equation (1).
where σ is the effective stress (MPa); A, B, n and C are constants for a certain material; ε is the effective plastic strain;
is the strain rate (s−1);
is the reference strain rate, chosen as 0.0003 s−1 in this paper. Therefore, when was 0.0003 s−1, i.e., the reference strain rate, and if ε = 0, A should be the corresponding effective stress value 276 MPa, and the logarithm of Equation (1) can be expressed as Equation (2).
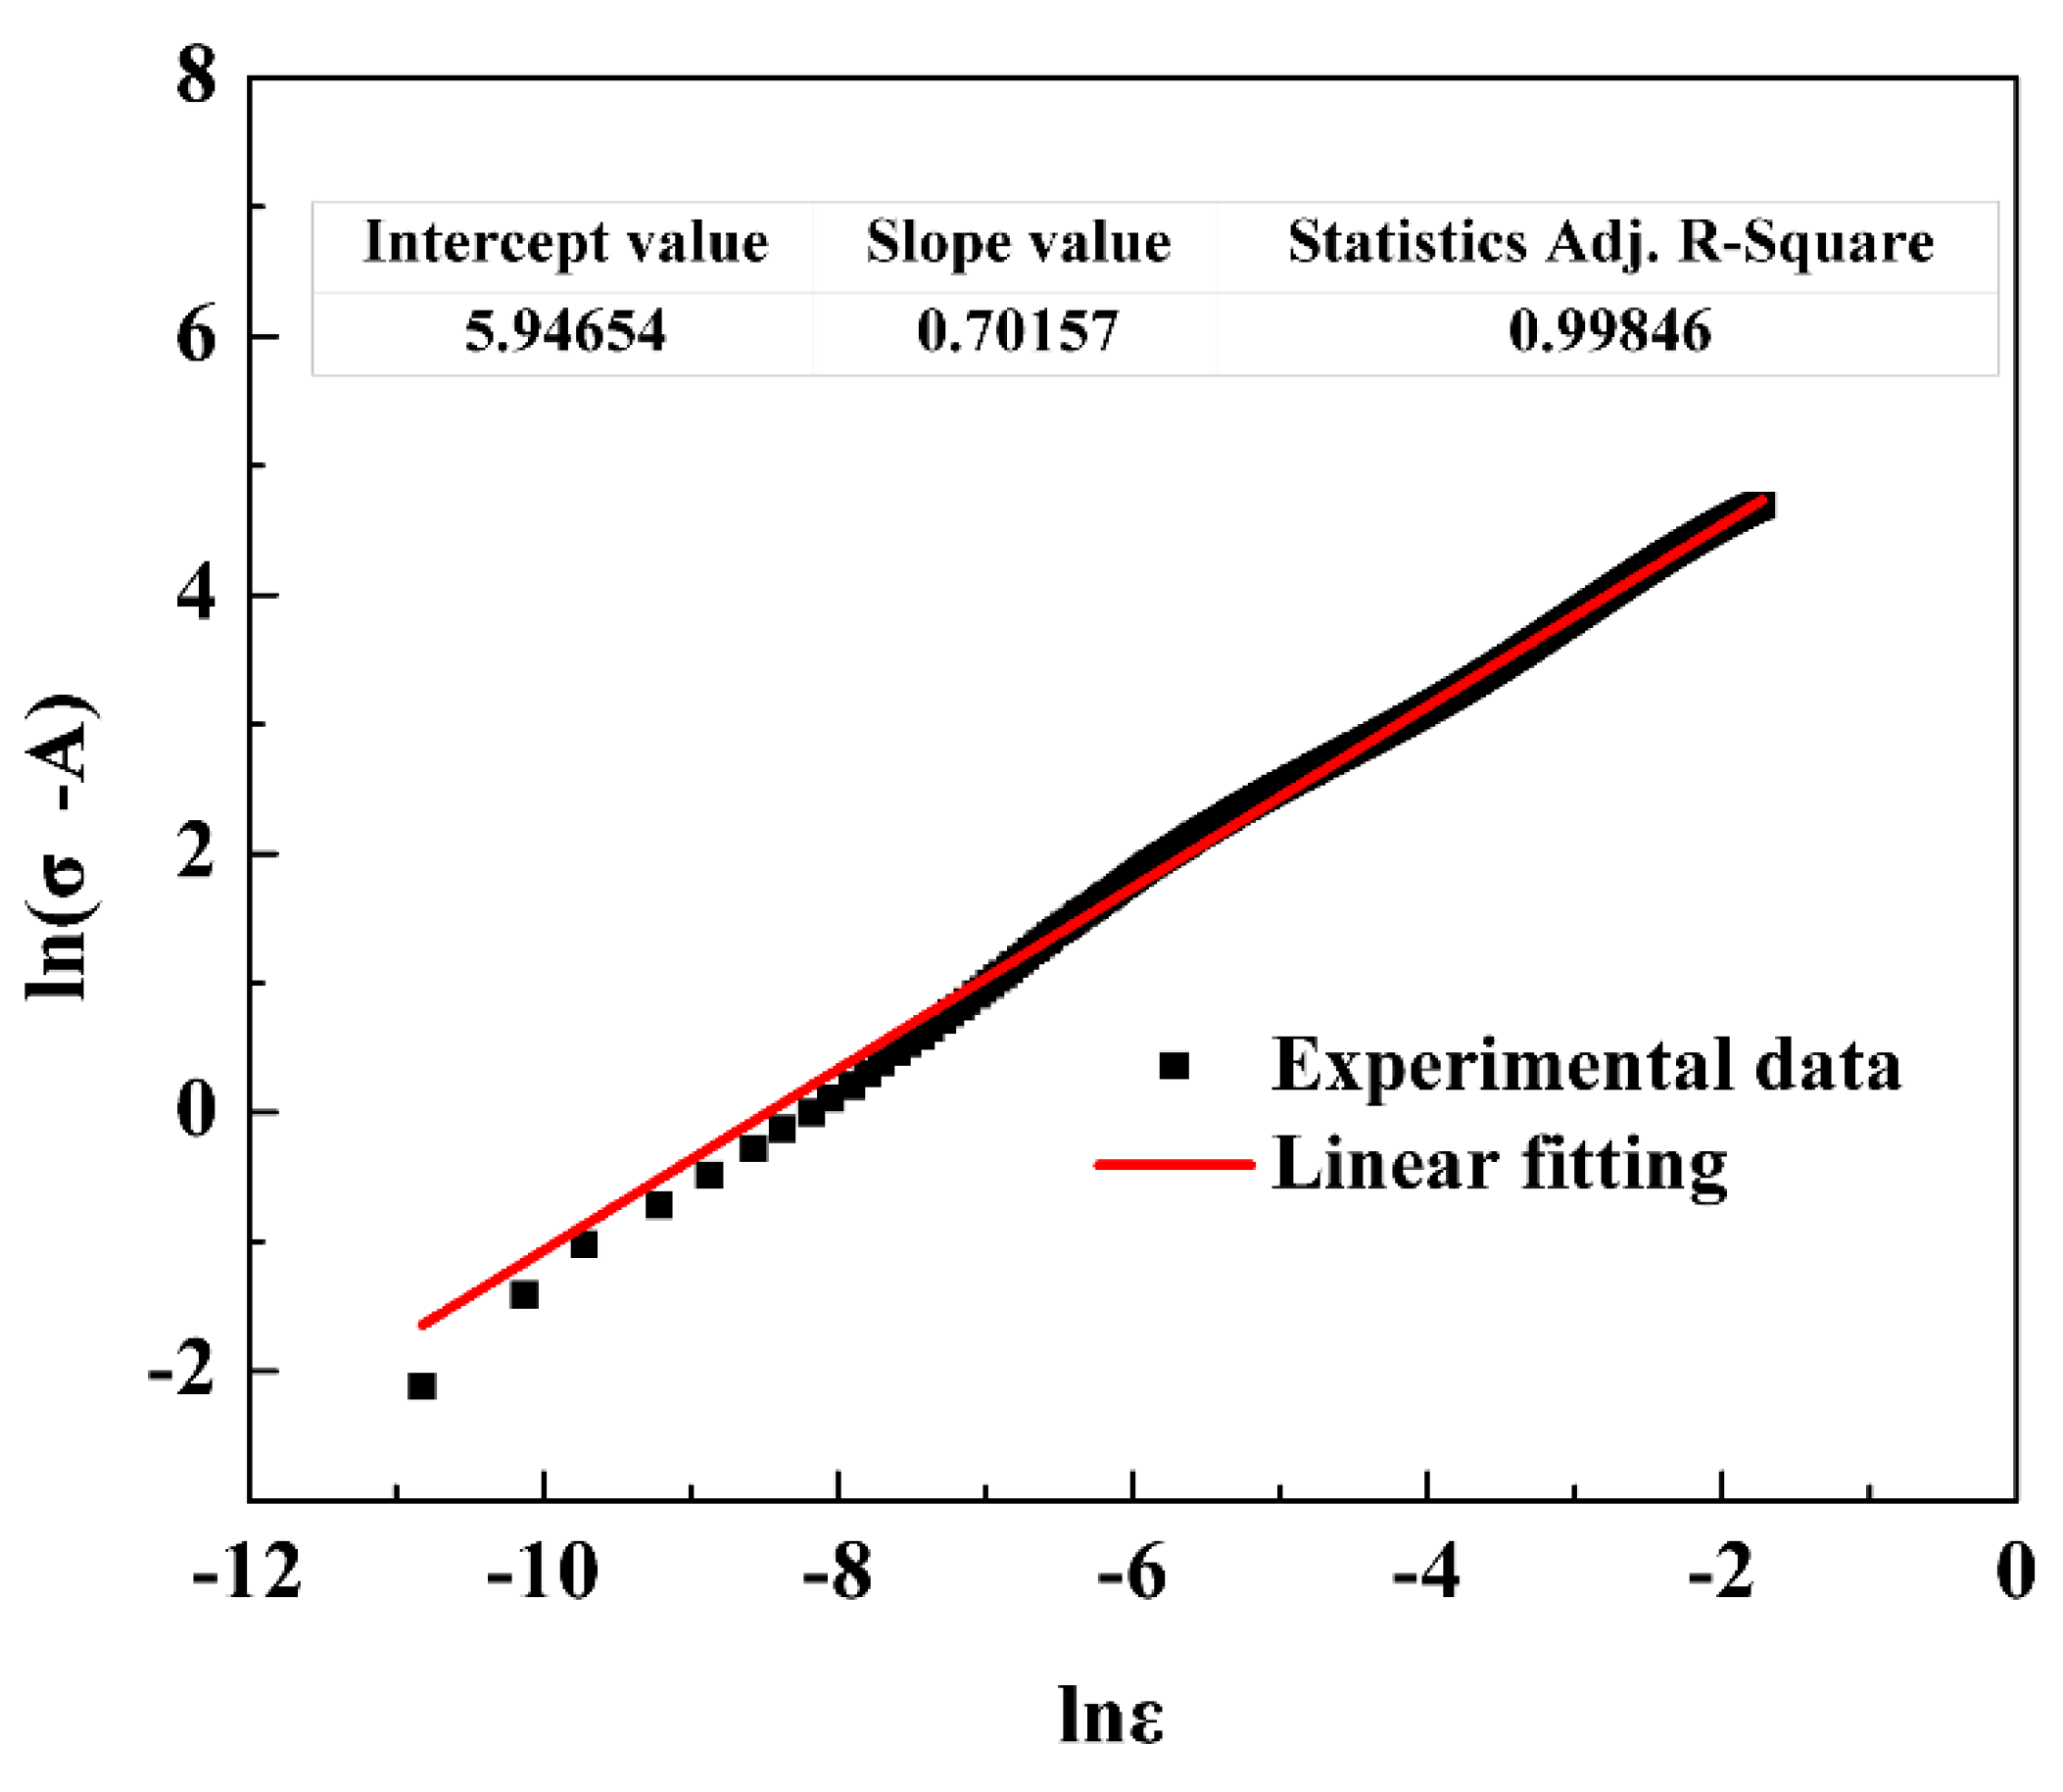
ln(σ − A) = lnB + n·lnε
The experimental date of σ and ε at a strain rate of 0.0003 s−1 were introduced into Equation (2), and the ln(σ − A) − lnε plot was fitted, as shown in Figure 10. It was calculated that B = 382, n = 0.70157.

Figure 10.
curve of BM at a strain rate of 0.0003 s−1.
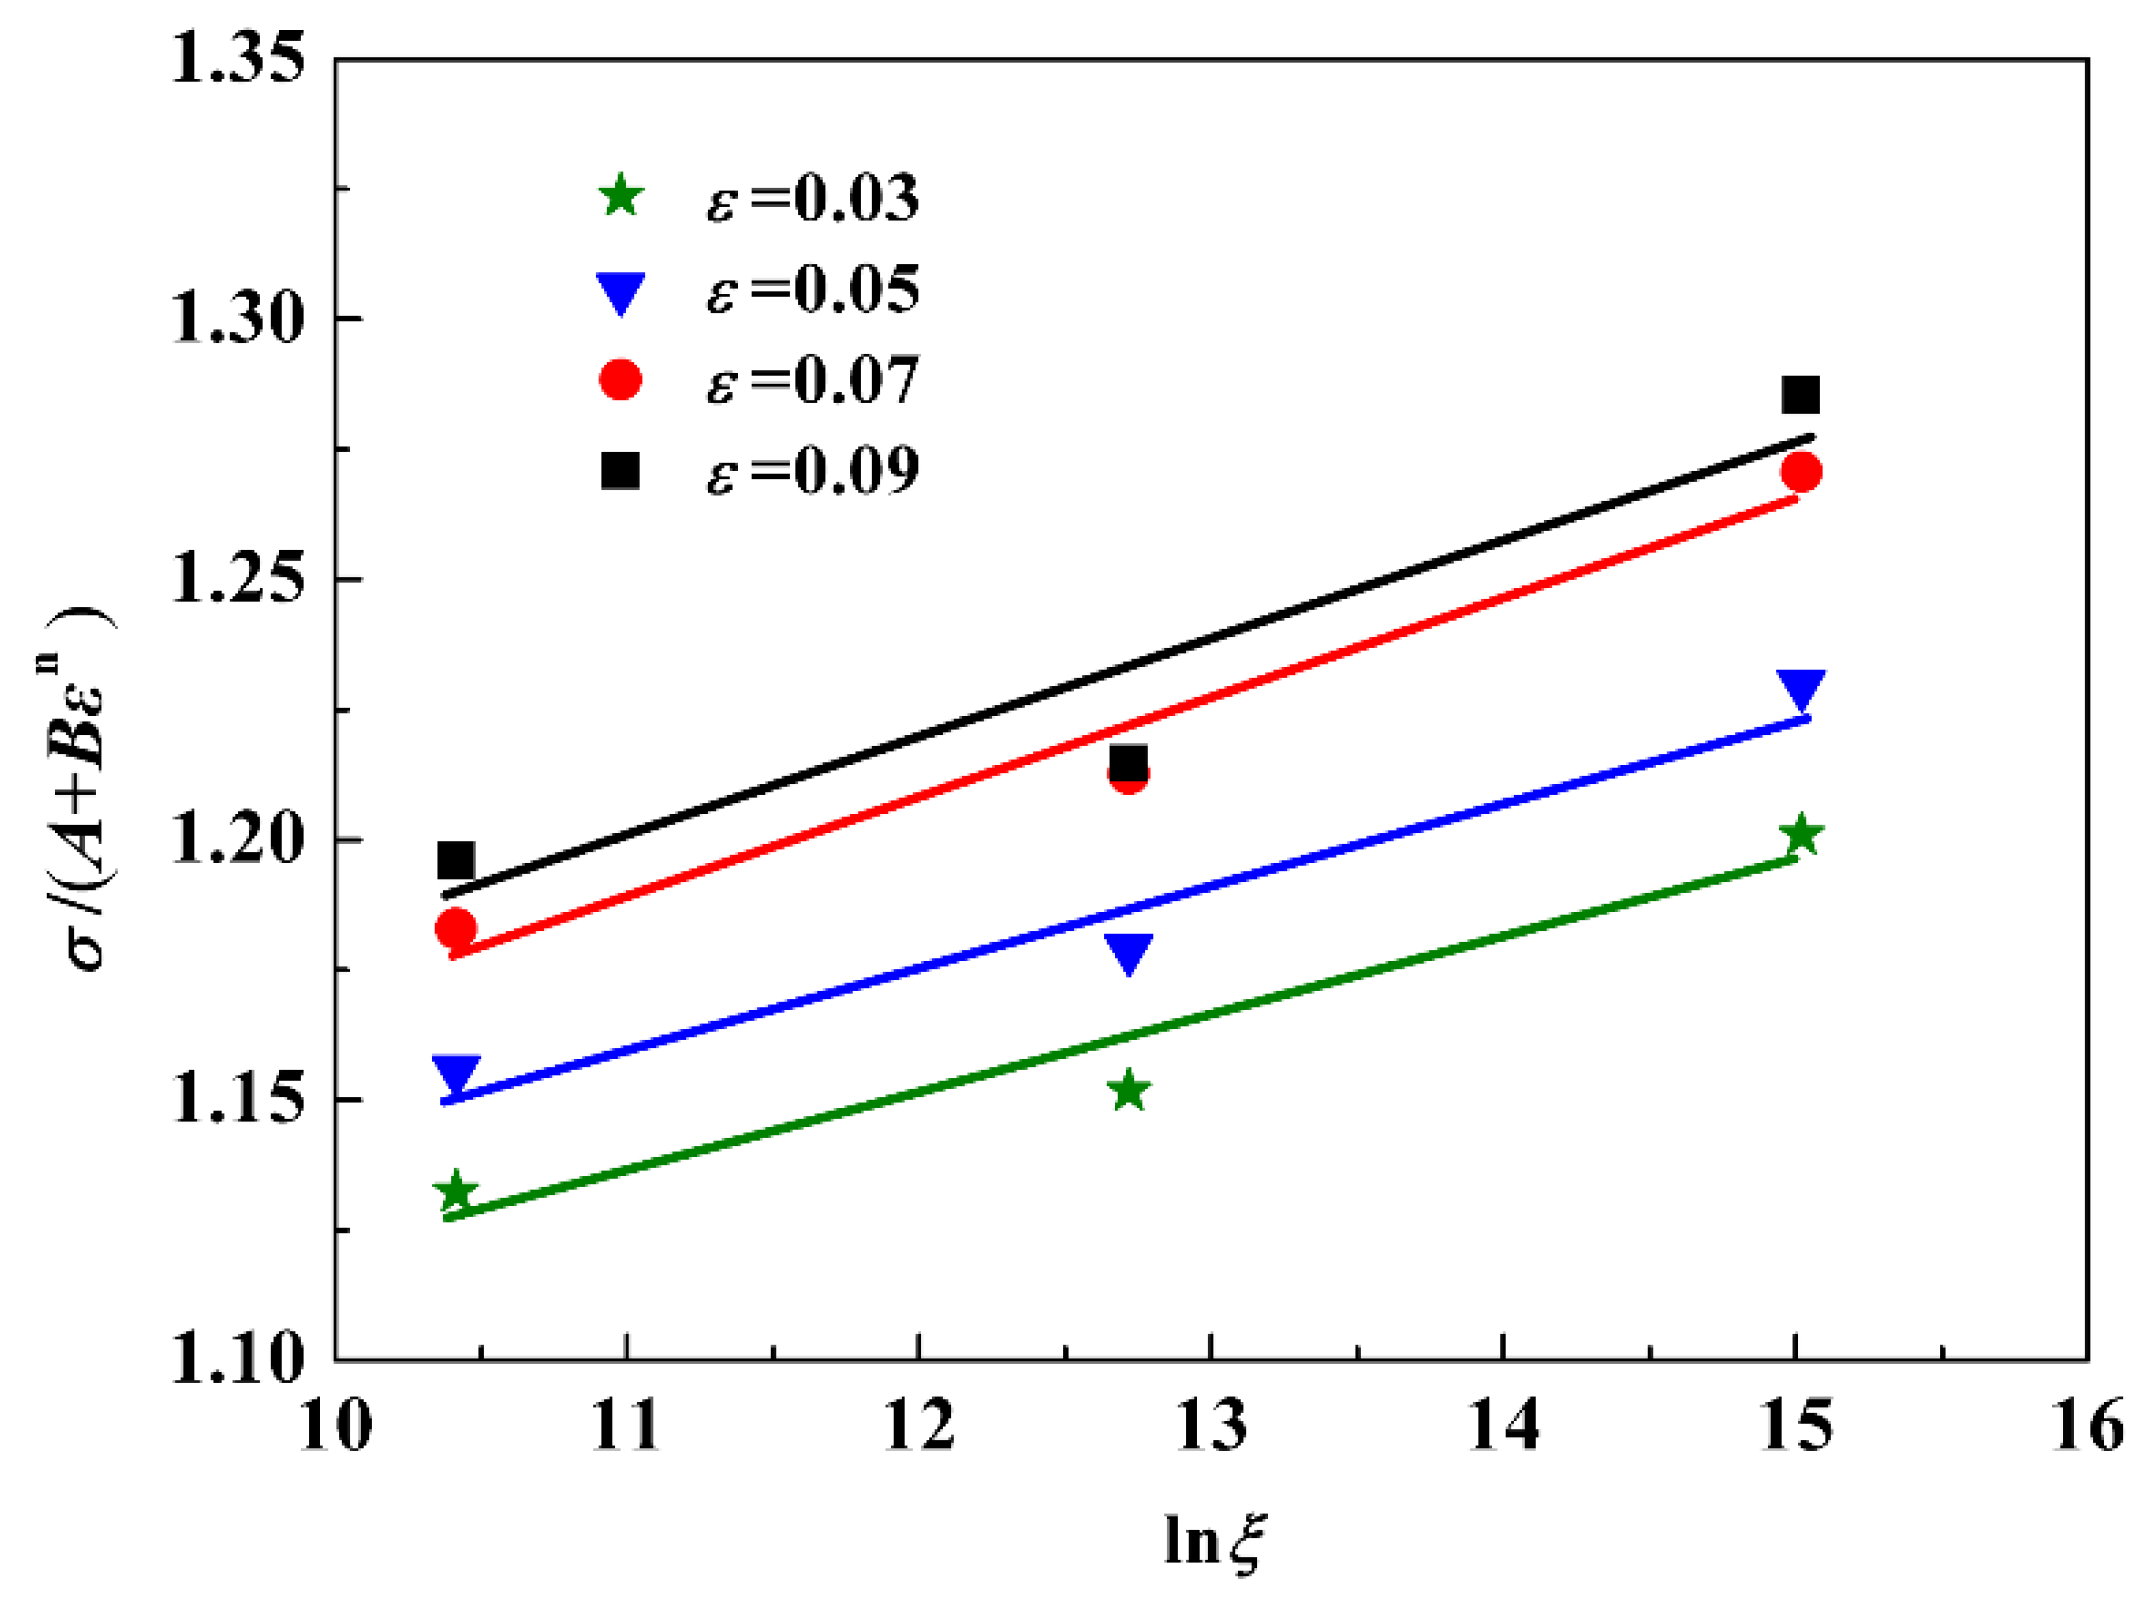
Further, Equation (1) was translated into Equation (3) to plot the σ(A + Bεn) − lnξ curve, where , as shown in Figure 11. The curves were linearly fitted to obtain the slope, which equals C. The values of C under different effective plastic strains are shown in Table 1. The average value 0.01737 was taken as the C value in the constitutive model.
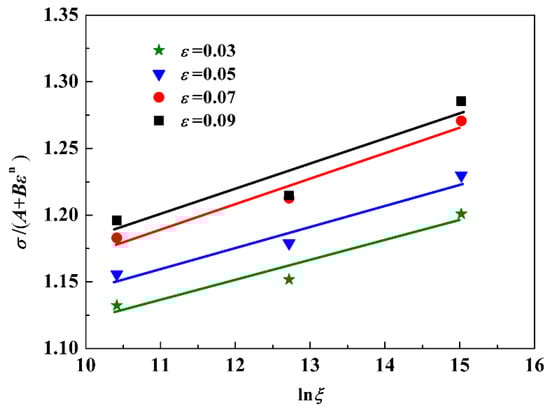
Figure 11.
− curve of BM at different plastic strains

Table 1.
The value of C under different effective plastic strains.
In conclusion, the constitutive equation of the investigated 6061-T6 BM can be expressed as Equation (4).
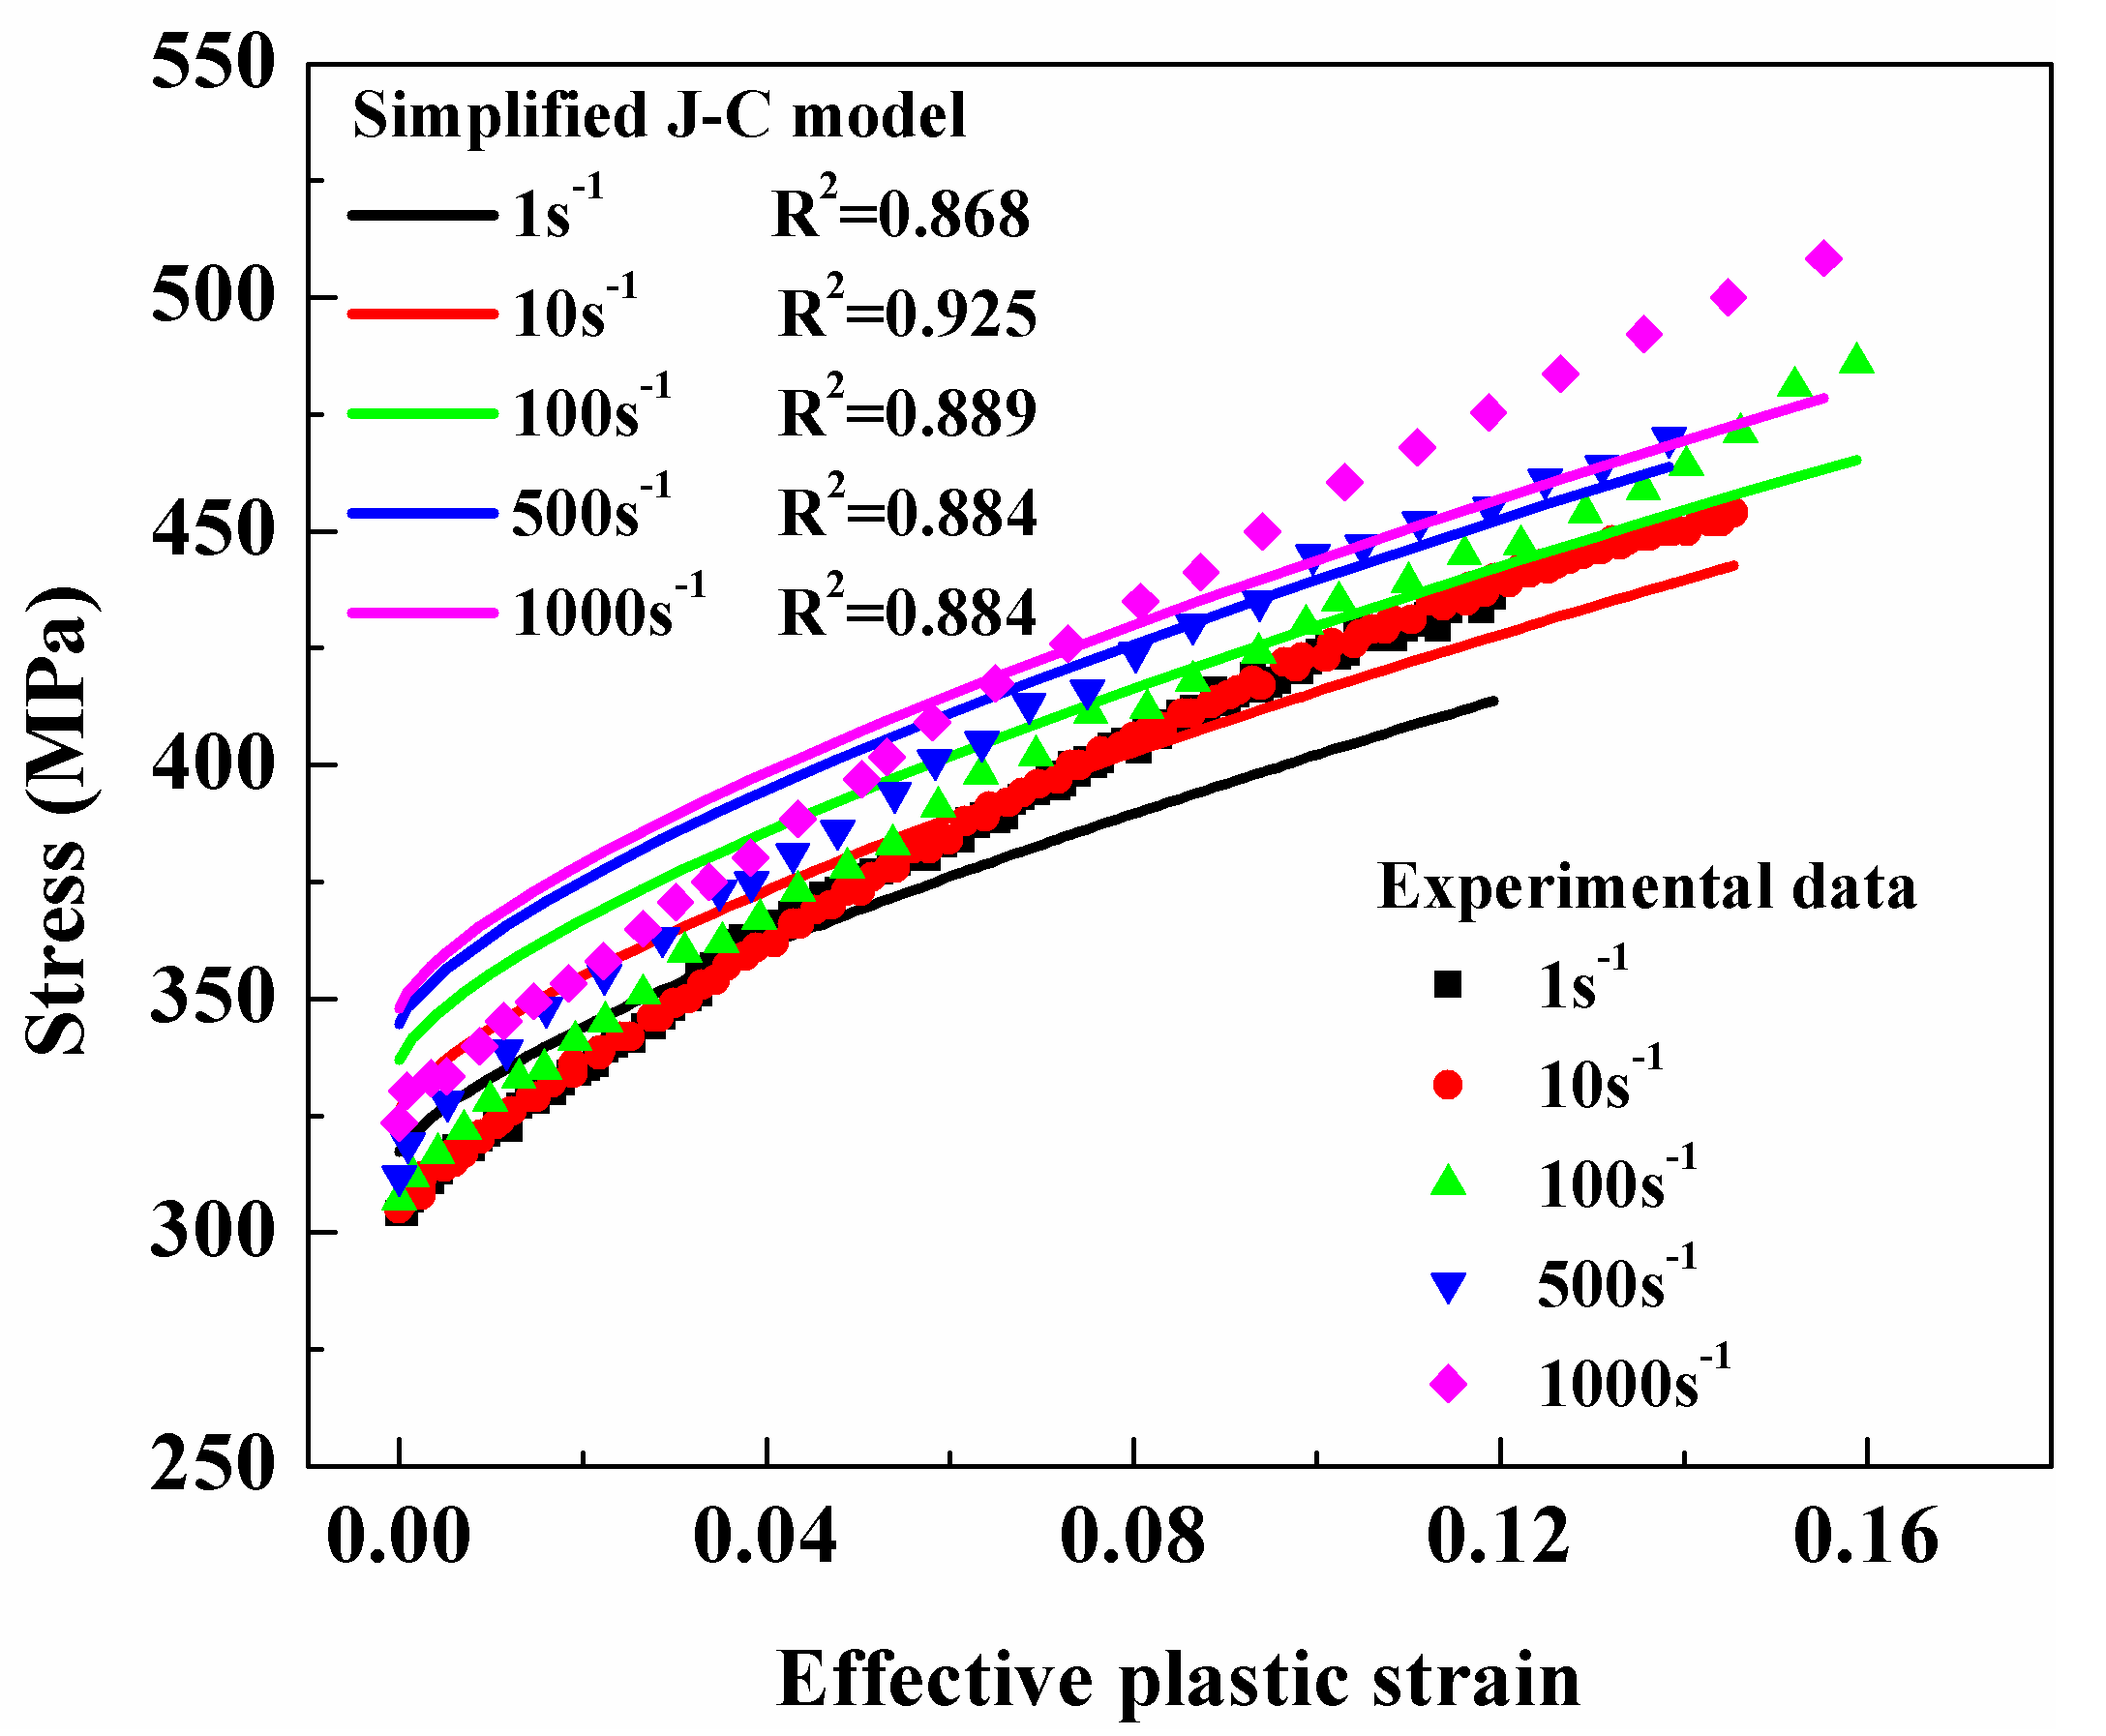
Figure 12 shows the stress–strain curves by Equation (4) and the experimental results. It can be seen that the simplified J–C constitutive model was not in good accordance with the experimental data. It was necessary to optimize this model, which is discussed in the following section.
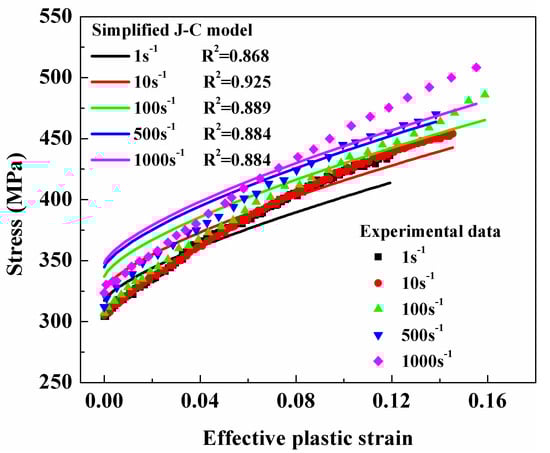
Figure 12.
Comparisons of experimental results with simplified J–C model prediction for BM. R2 is the coefficient of determination.
3.5. Modification of the Simplified Johnson–Cook Model
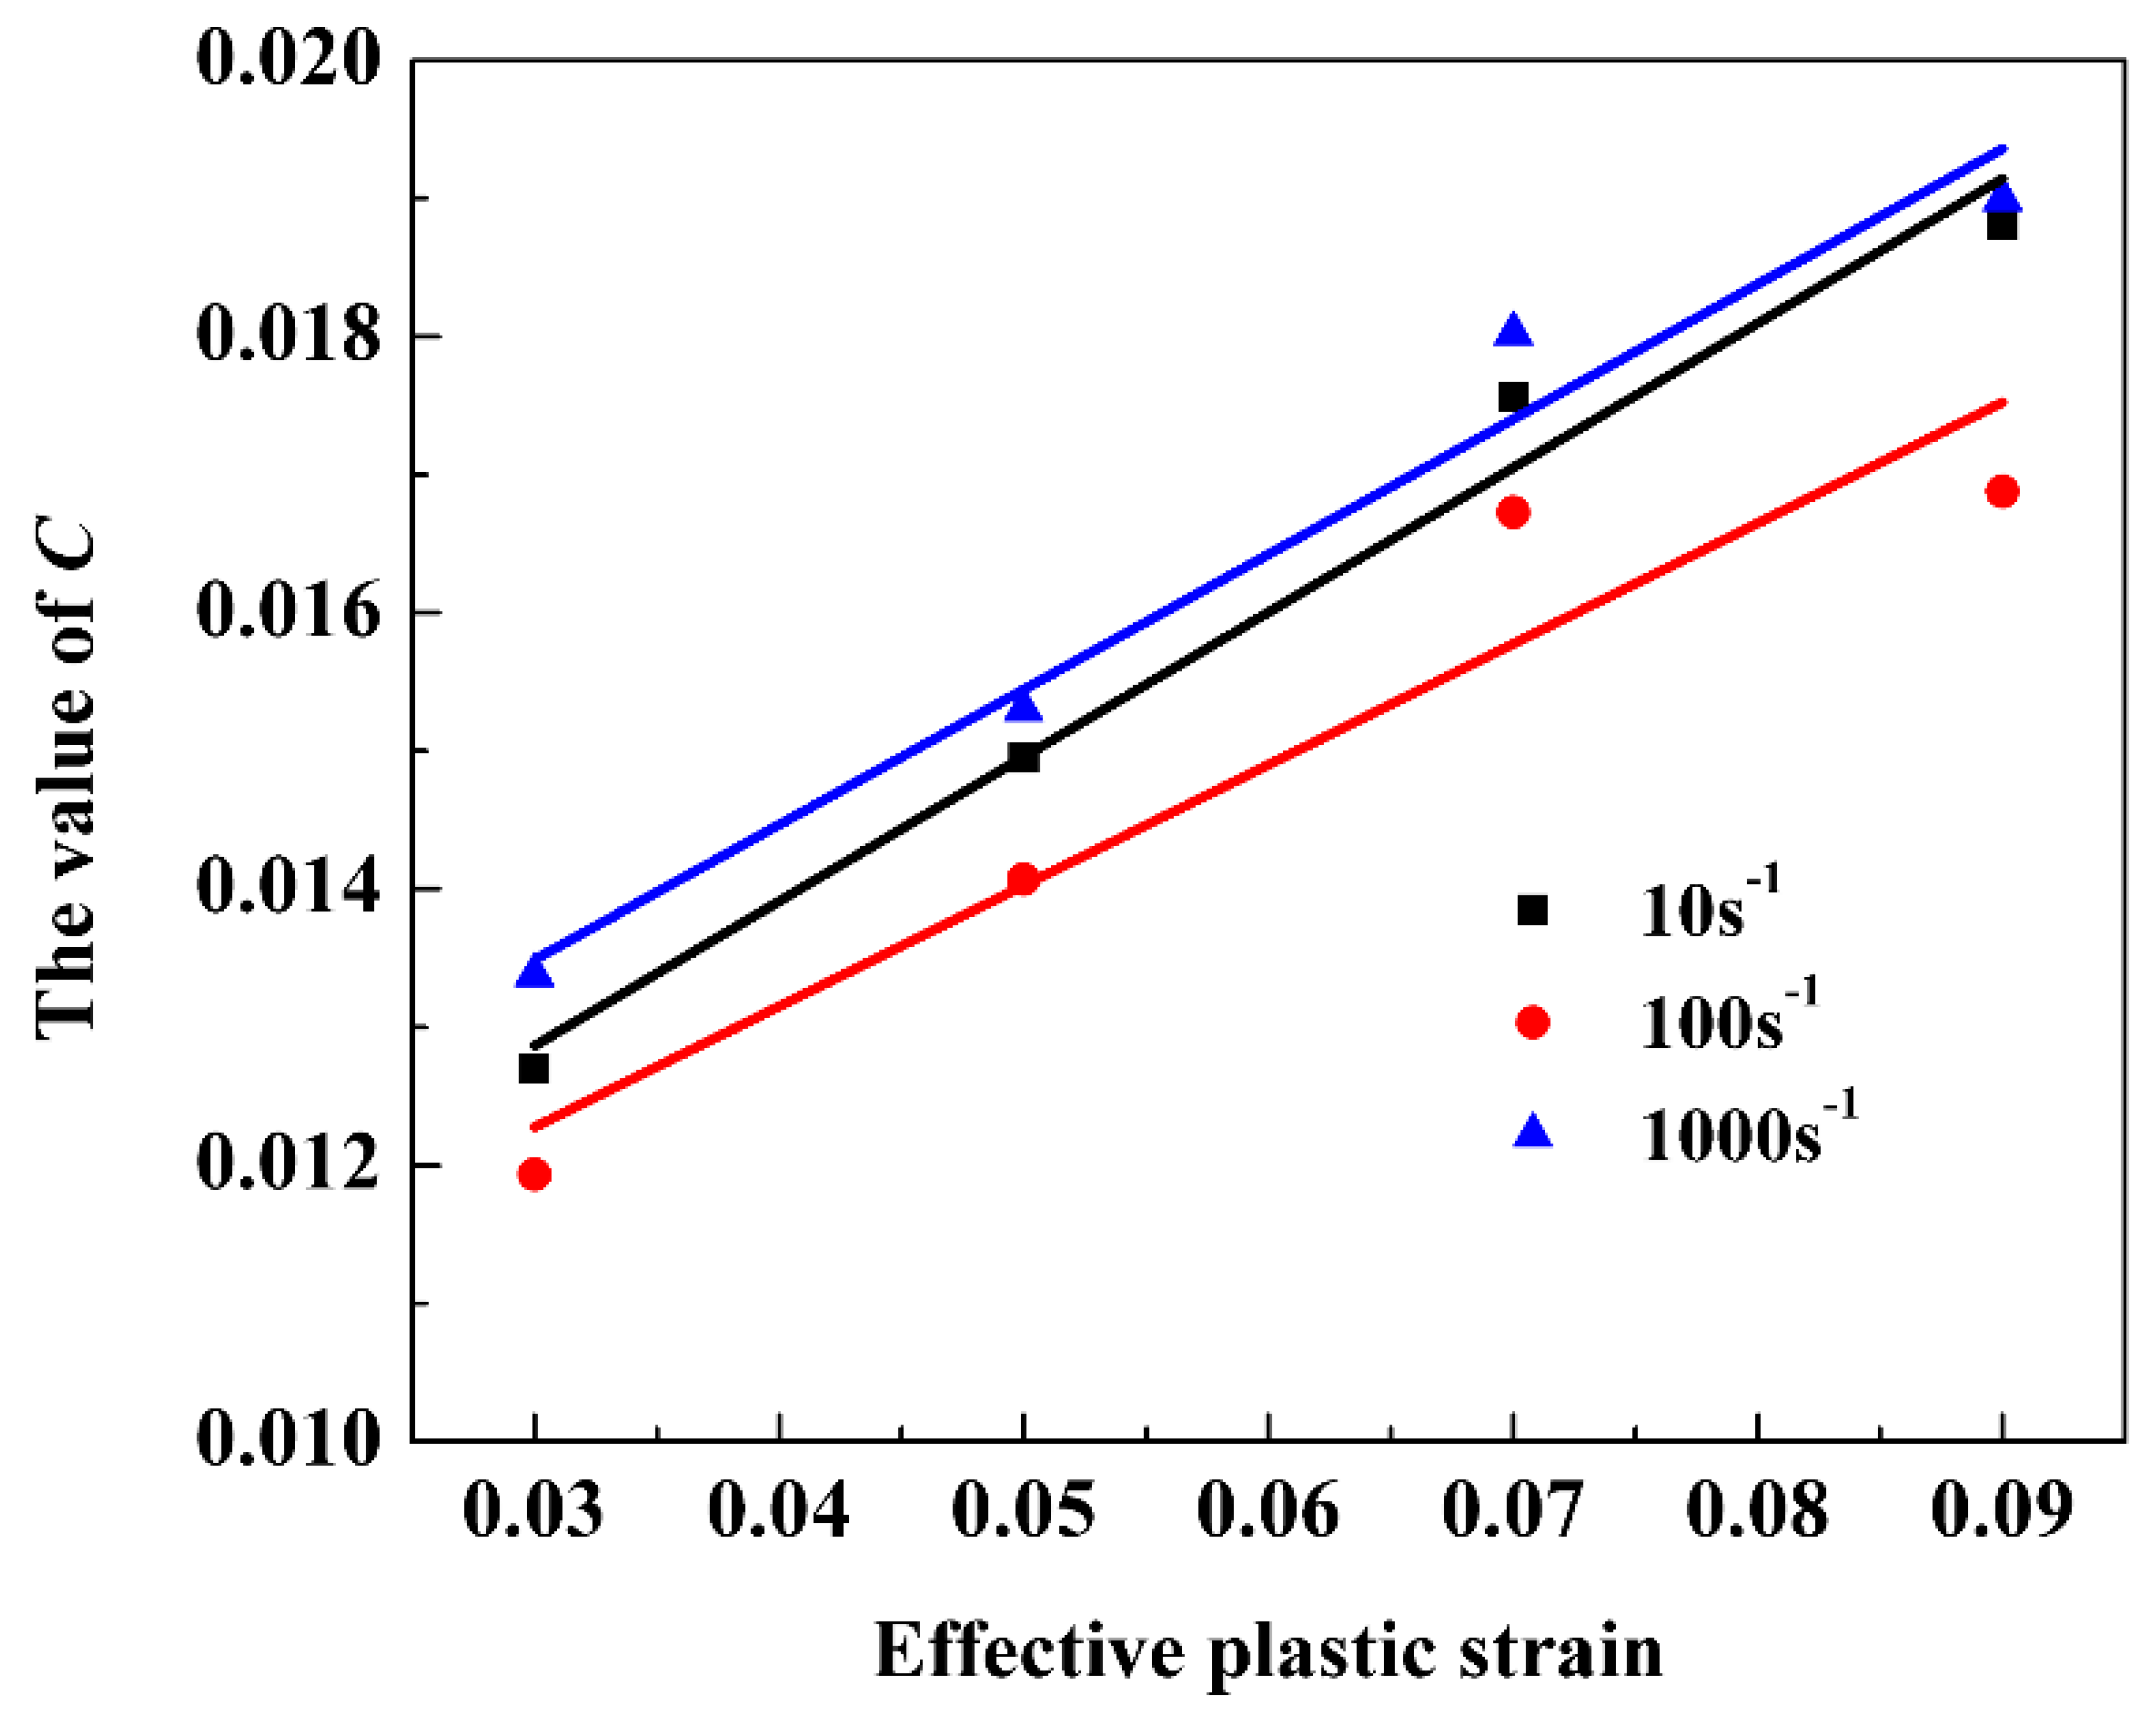
It can be seen that the value of C was not unique according to the above discussion and using the average value for different effective plastic strains would lead to a large deviation between the fitted curve and the experimental data. It is observed from Table 1 that the value of C increased with increasing ε. By fitting the curve between C and ε, as shown in Figure 13, it was concluded that the C value and the effective strain were approximately in a linear relationship, so the C value was modified as C = C1 + C2·ε and the values of C1 and C2 were 0.00998 and 0.09666, respectively. Therefore, the modified Johnson–Cook constitutive model of BM can be expressed as Equation (5).
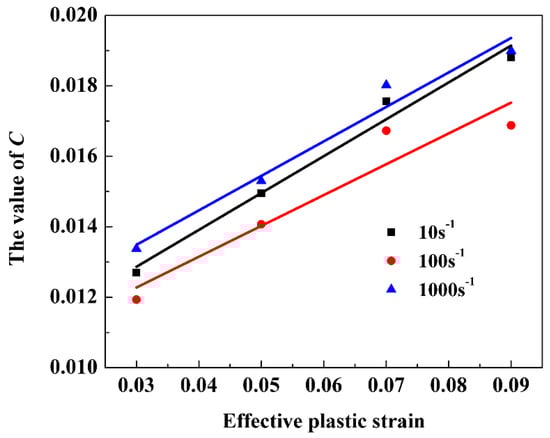
Figure 13.
The relationship between C and effective plastic strain.
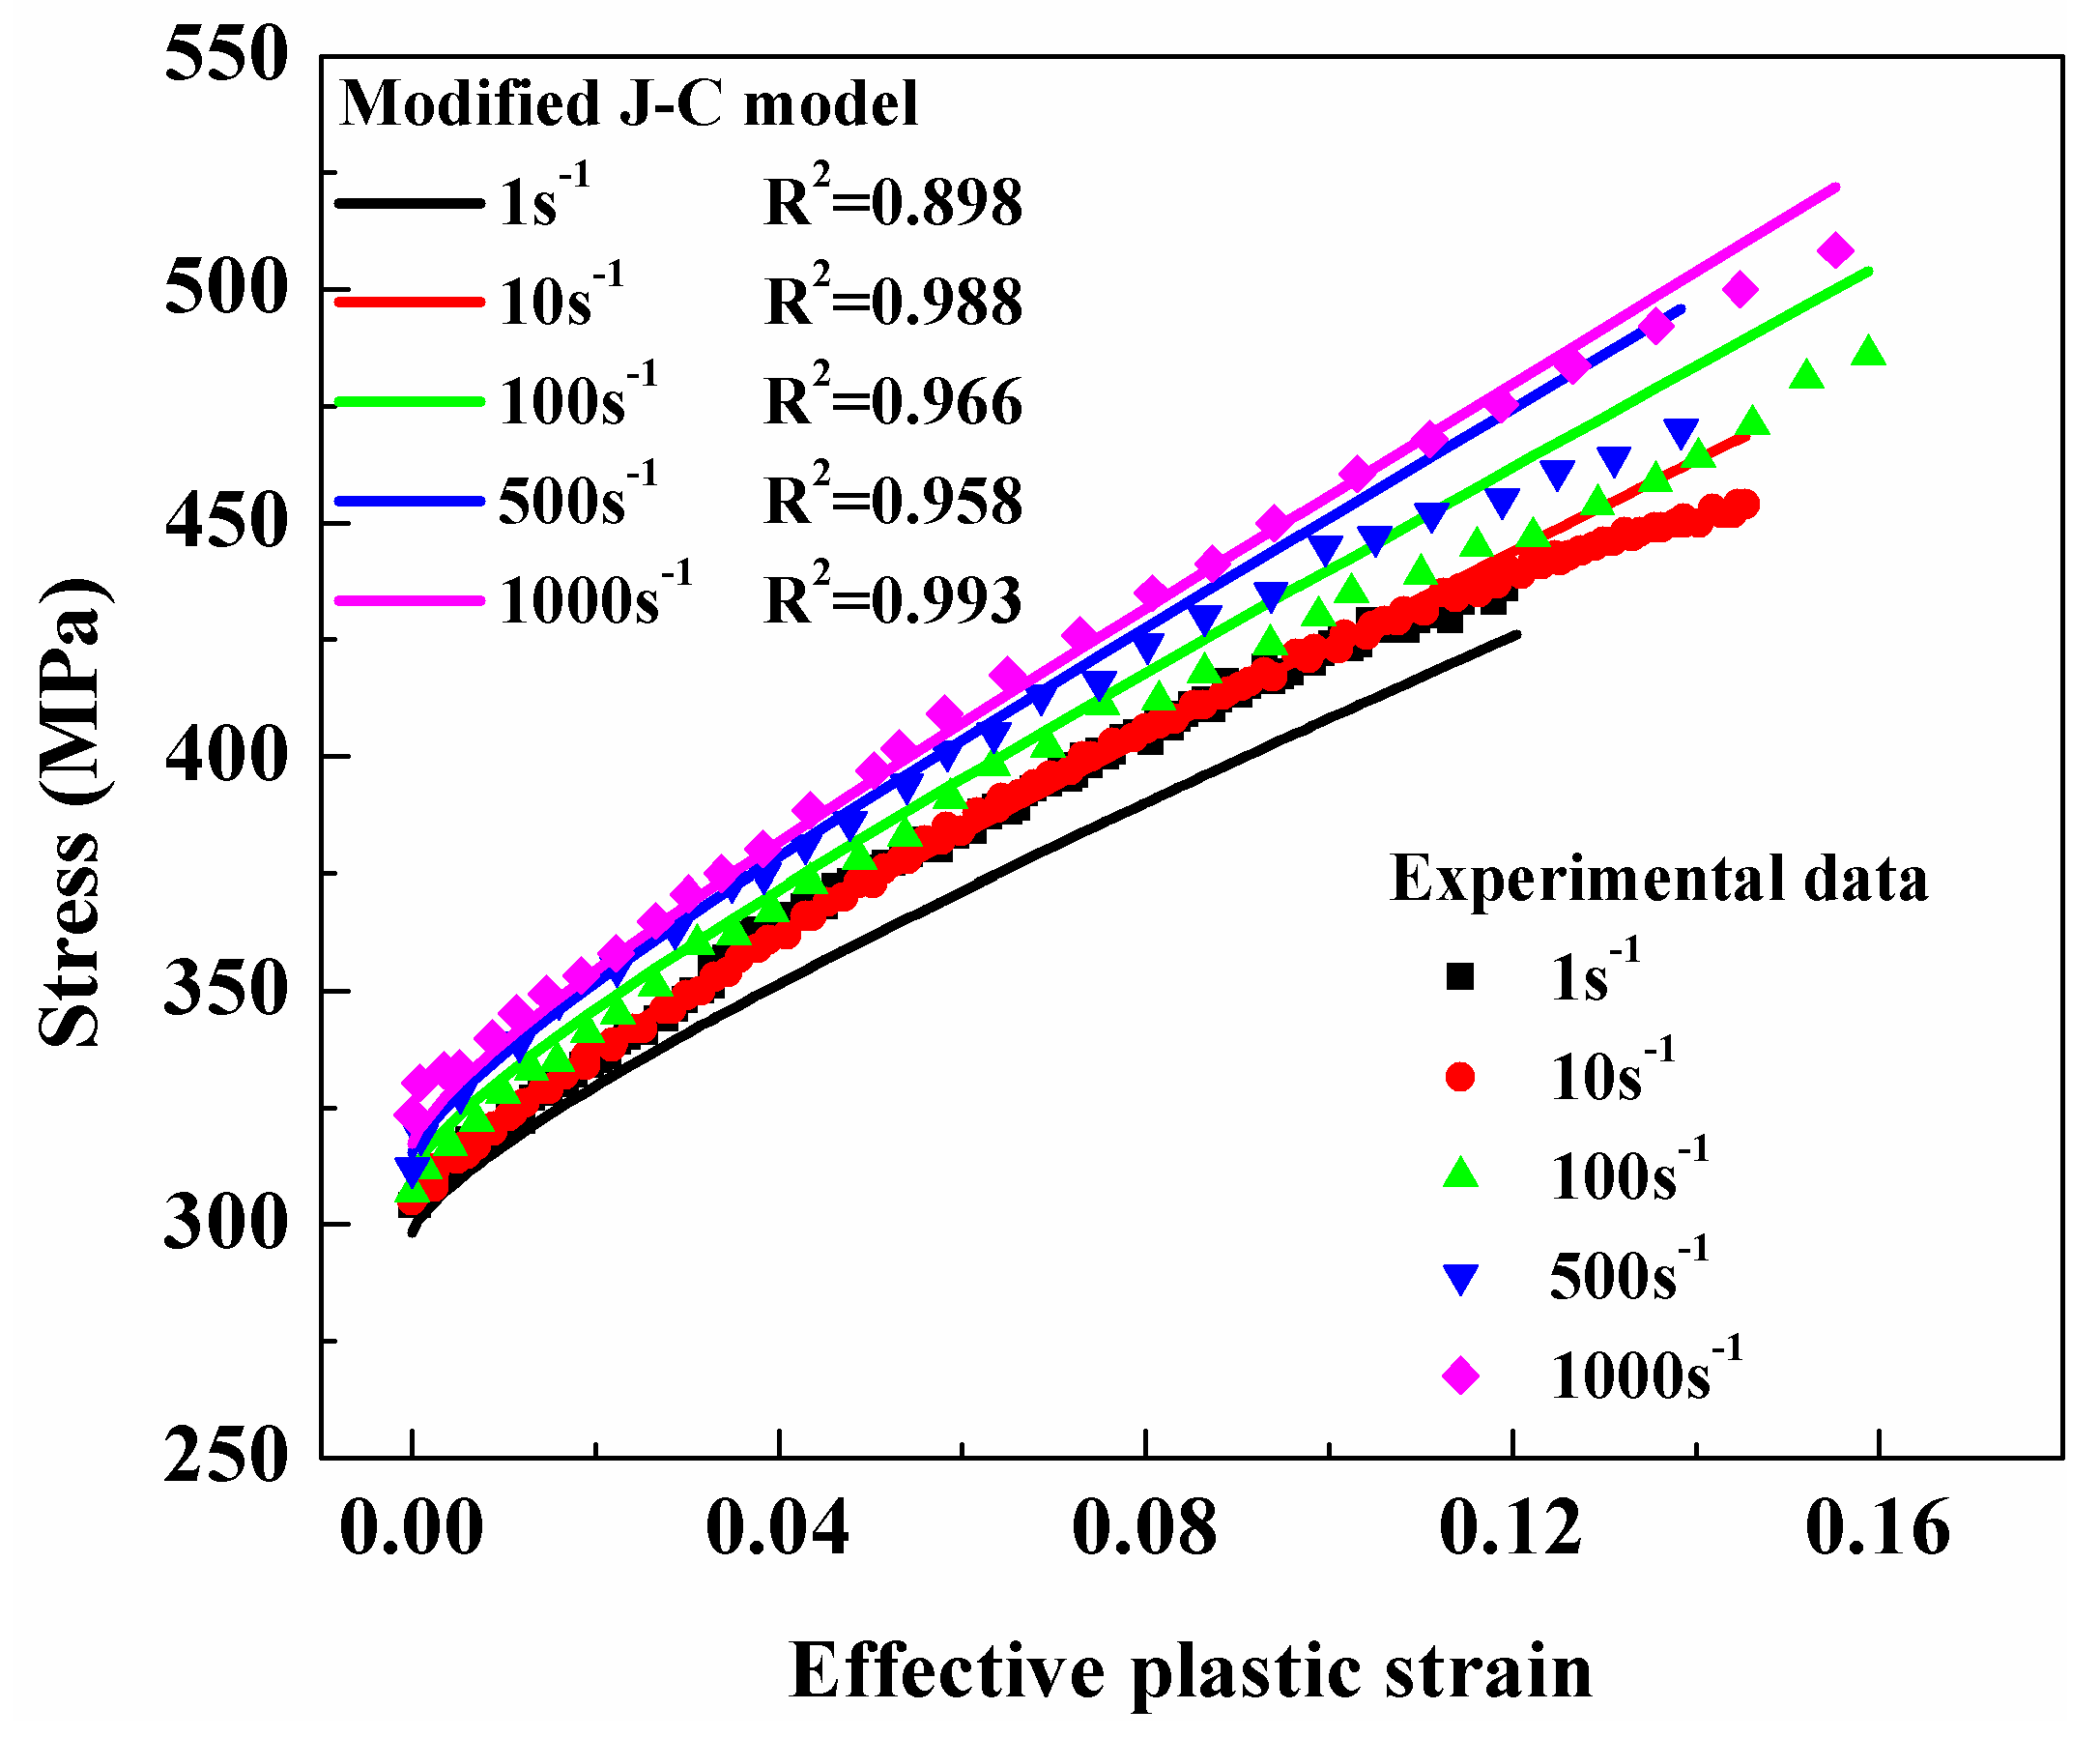
The stress-strain curves of BM at different strain rates were fitted according to Equation (5) and compared with the experimental curves, as shown in Figure 14. It can be seen that the experimental results can be more accurately predicted by the modified J–C model than the simplified J–C model in Figure 12. Therefore, the modified J–C model could well describe the dynamic plastic deformation of BM, which can be used in finite element method simulation models.
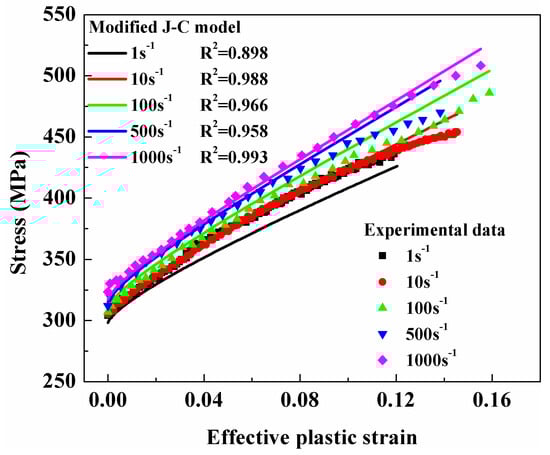
Figure 14.
Comparisons of experimental results with modified J–C model prediction for BM. R2 is the coefficient of determination.
3.6. Constitutive Model of Welded Material
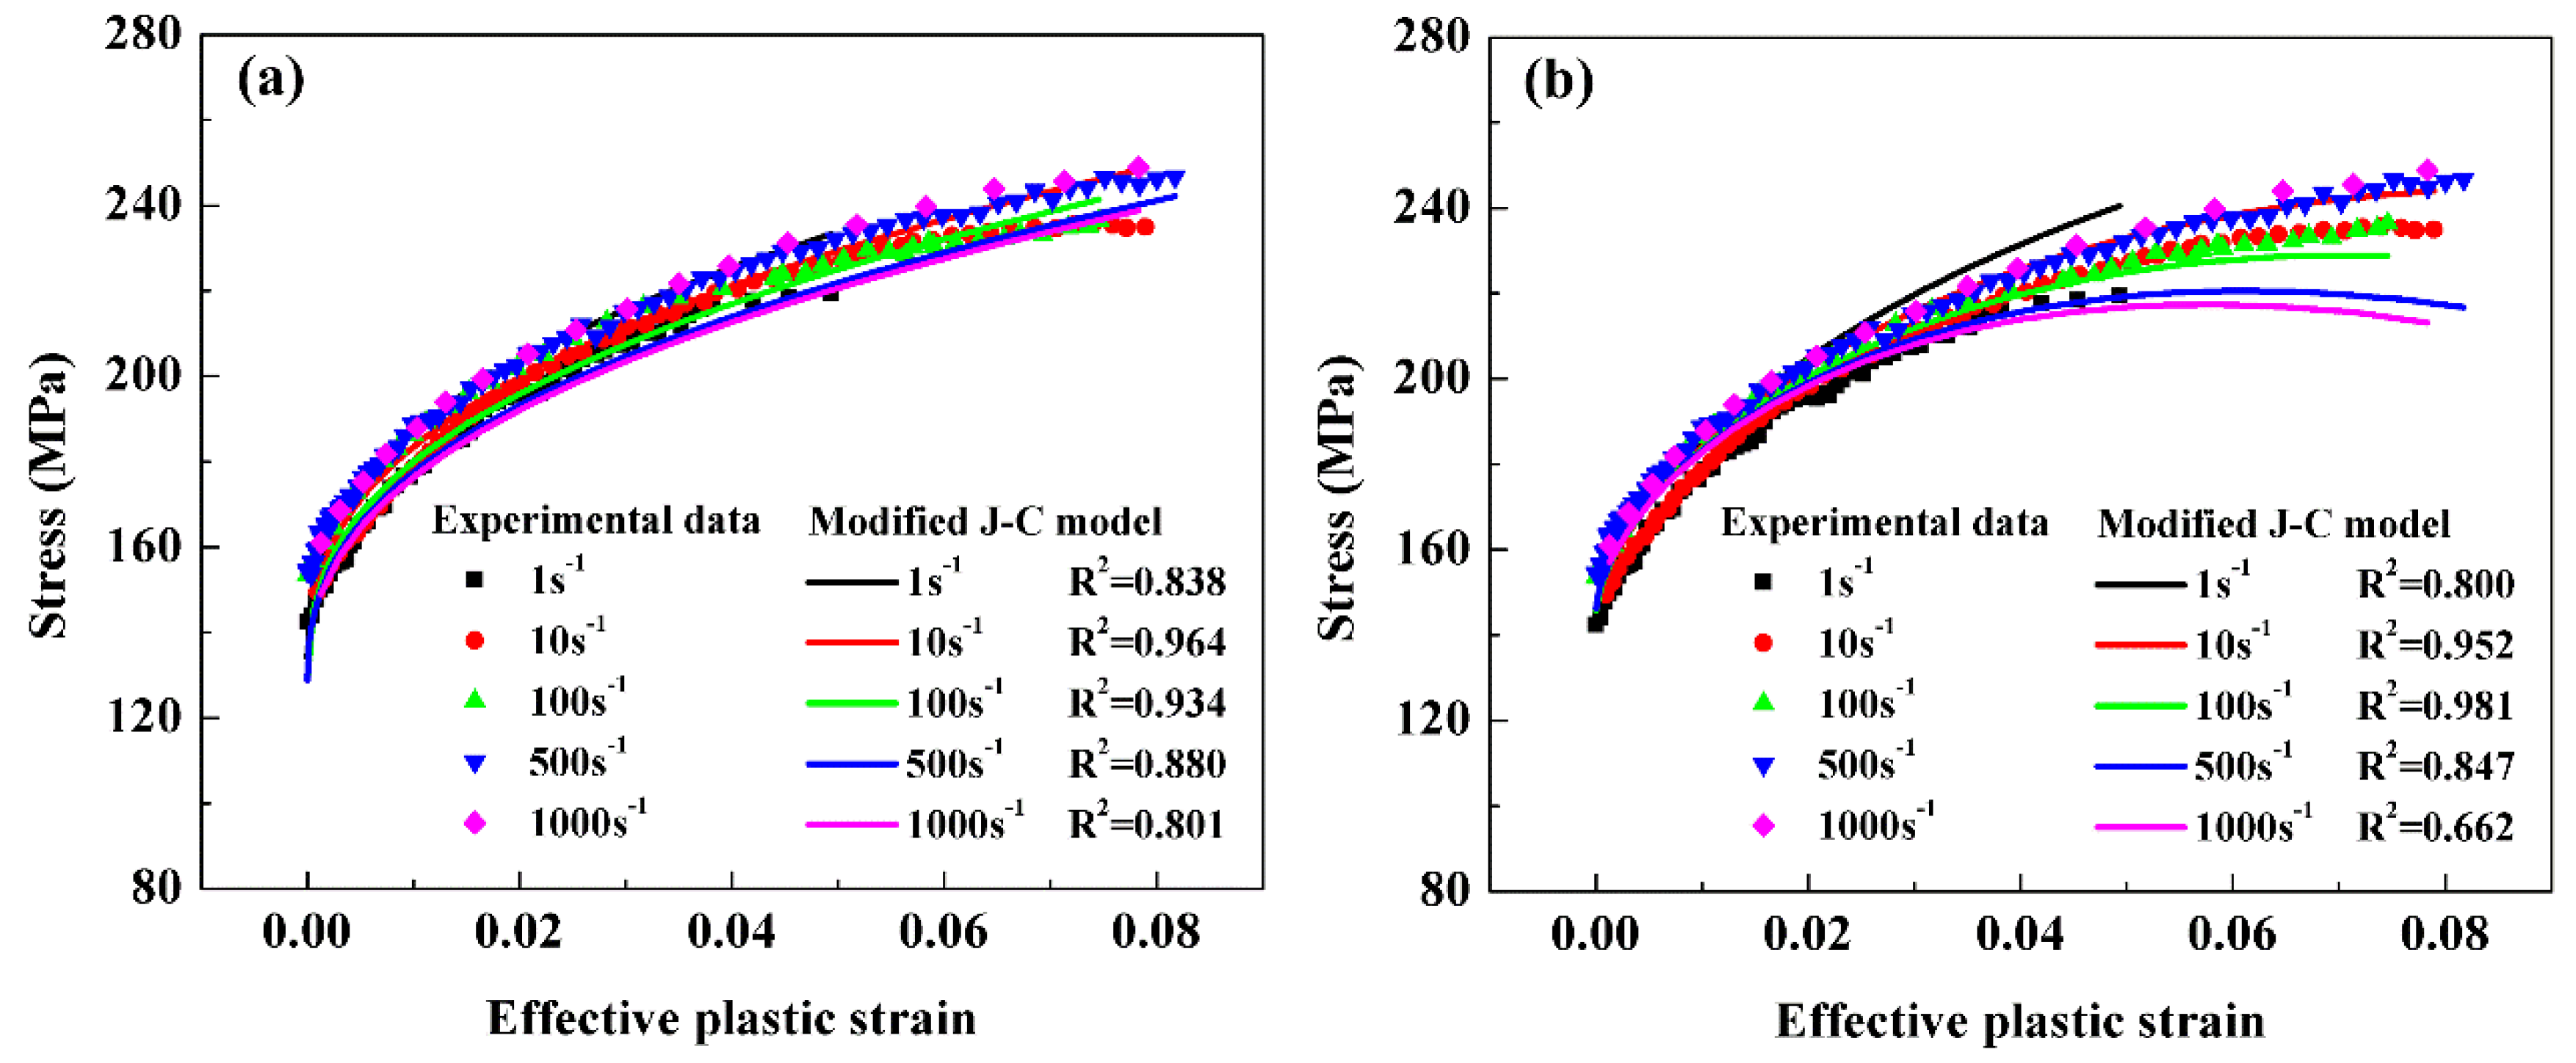
For the constitutive model of the laser welded 6061-T6 aluminum alloy, the simplified J–C model was used to describe the experimental results according to the method introduced in Section 3.4, as shown in Figure 15a. Figure 15b shows the stress–strain curves of the laser WM by the modified J–C model as introduced in Section 3.5 and compared with the experimental curves. As can be seen, the fitted results of the simplified J–C constitutive model were overall better than the modified J–C model, especially for high strain rate (1000 s−1).
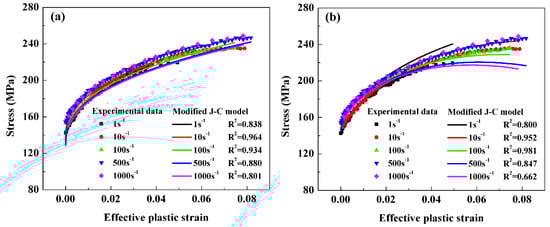
Figure 15.
Comparisons of experimental results with (a) simplified and (b) modified J–C model prediction for WM. R2 is the coefficient of determination.
The linear fitting results of curves show that the slope, i.e., the value of C, for BM increased with increasing ε, while the value of C for WM did not show this phenomenon. That is why the fitted results of the simplified J–C model were overall better than the modified model for WM, while the modified model was better for BM, as shown in Table 2. However, the coefficient of determination between the experimental data and the model for WM at 1000 s−1 was relatively low (R2 = 0.801) because the dynamic deformation behavior of WM can be affected by many aspects such as the complicated weld joint microstructural factors, so it is difficult to predict the constitutive model precisely. Further study is still needed in this area.
Table 2.
Comparation of the coefficient of determination R2 for simplified and modified models under different strain rates.
4. Conclusions
In this paper, the microstructural evolution and the mechanical properties of 6061-T6 laser welded joint at strain rates of 0.0003–1000 s−1 were studied, the constitutive equation of the investigated materials was optimized based on the Johnson–Cook model. The main conclusions are summarized as follows:
- (1)
- The microstructure of WM was composed of dendrites, which was much finer than that of BM; typical columnar crystals grew perpendicularly to the fusion line; the microstructure of HAZ was similar to BM, and the minimum hardness (~56 HV) was obtained inside WM.
- (2)
- The joint efficiency reached 61.3%; the strength and dynamic factor of both BM and WM increased with increasing strain rate. The strength of WM was less sensitive to strain rate compared with BM.
- (3)
- The dimples of WM after fracture were much finer than those of BM. The Feret ratio decreased nonlinearly with increasing distance from the fracture tip and increased with the strain rate between 1–500 s−1, but was abnormally low at 1000 s−1.
- (4)
- The modified J–C model which introduced C = C1 + C2·ε could well describe the dynamic plastic deformation of BM. However, the fitted results of the simplified J–C constitutive model were overall better than the modified J–C model for WM, especially for high strain rate (1000 s−1).
Author Contributions
Methodology, H.Z.; formal analysis, J.N.; investigation, C.H.; data curation, X.L.; writing—original draft preparation, J.N.; writing—review and editing, S.L. and R.G.; funding acquisition, J.C. and S.L. All authors have read and agreed to the published version of the manuscript.
Funding
This research was funded by the National Natural Science Foundation of China, grant number 51961013 and Jiangxi Provincial Postdoctoral Research Excellent Funding, 2019KY55.
Conflicts of Interest
The authors declare no conflict of interest.
References
- Chen, L.; Wang, C.; Xiong, L.; Zhang, X.; Mi, G. Microstructural, porosity and mechanical properties of lap joint laser welding for 5182 and 6061 dissimilar aluminum alloys under different place configurations. Mater. Des. 2020, 191, 108625. [Google Scholar] [CrossRef]
- Zhang, L.; Zhong, H.; Li, S.; Zhao, H.; Chen, J.; Qi, L. Microstructure, mechanical properties and fatigue crack growth behavior of friction stir welded joint of 6061-T6 aluminum alloy. Int. J. Fatigue 2020, 135, 105556. [Google Scholar] [CrossRef]
- Dhakal, B.; Swaroop, S. Effect of laser shock peening on mechanical and microstructural aspects of 6061-T6 aluminum alloy. J. Mater. Process. Technol. 2020, 282, 116640. [Google Scholar] [CrossRef]
- Geng, S.; Jiang, P.; Guo, L.; Gao, X.; Mi, G. Multi-scale simulation of grain/sub-grain structure evolution during solidification in laser welding of aluminum alloys. Int. J. Heat Mass Transf. 2020, 149, 119252. [Google Scholar] [CrossRef]
- Ye, T.; Wu, Y.; Liu, A.; Xu, C.; Li, L. Mechanical property and microstructure evolution of aged 6063 aluminum alloy under high strain rate deformation. Vacuum 2019, 159, 37–44. [Google Scholar] [CrossRef]
- Olasumboye, A.T.; Owolabi, G.M.; Odeshi, A.G.; Yilmaz, N.; Zeytinci, A. Dynamic Behavior of AA2519-T8 Aluminum Alloy Under High Strain Rate Loading in Compression. J. Dynam. Behav. Mater. 2018, 4, 151–161. [Google Scholar] [CrossRef]
- Tiwari, S.; Mishra, S.; Odeshi, A.G.; Szpunar, J.A.; Chopkar, M.K. Evolution of texture and microstructure during high strain rate torsion of aluminum zinc magnesium copper alloy. Mater. Sci. Eng. A 2017, 683, 94–102. [Google Scholar] [CrossRef]
- Xie, Z.; Guan, Y.; Lin, J.; Zhai, J.; Zhu, L. Constitutive model of 6063 aluminum alloy under the ultrasonic vibration upsetting based on Johnson-Cook model. Ultrasonics 2019, 96, 1–9. [Google Scholar] [CrossRef] [PubMed]
- Khan, A.S.; Liu, H. Variable strain rate sensitivity in an aluminum alloy: Response and constitutive modeling. Int. J. Plast. 2012, 36, 1–14. [Google Scholar] [CrossRef]
- Tan, J.Q.; Zhan, M.; Liu, S.; Huang, T.; Guo, J.; Yang, H. A modified Johnson–Cook model for tensile flow behaviors of 7050-T7451 aluminum alloy at high strain rates. Mater. Sci. Eng. A 2015, 631, 214–219. [Google Scholar] [CrossRef]
- Itabashi, M.; Kawata, K. Carbon content effect on high-strain-rate tensile properties for carbon steels. Int. J. Impact Eng. 2000, 24, 117–131. [Google Scholar] [CrossRef]
- Li, S.; Kang, Y.; Zhu, G.; Kuang, S. Effects of Strain Rates on Mechanical Properties and Fracture Mechanism of DP780 Dual Phase Steel. J. Mater. Eng. Perform. 2015, 24, 2426–2434. [Google Scholar] [CrossRef]
- Song, R.-B.; Dai, Q.-F. Dynamic Deformation Behavior of Dual Phase Ferritic-Martensitic Steel at Strain Rates From 10−4 to 2000 s−1. J. Iron Steel Res. Int. 2013, 20, 48–53. [Google Scholar] [CrossRef]
- Li, S.; Zhang, L.; Zhao, H.; Qi, L.; Kang, Y. Mechanical behavior of DP780 dual phase steel at a wide range of strain rates. Mater. Res. Express 2018, 5, 096519. [Google Scholar] [CrossRef]
- Chu, Q.; Bai, R.; Jian, H.; Lei, Z.; Hu, N.; Yan, C. Microstructure, texture and mechanical properties of 6061 aluminum laser beam welded joints. Mater. Charact. 2018, 137, 269–276. [Google Scholar] [CrossRef]
- Abdulstaar, M.; Al-Fadhalah, K.J.; Wagner, L. Microstructural variation through weld thickness and mechanical properties of peened friction stir welded 6061 aluminum alloy joints. Mater. Charact. 2017, 126, 64–73. [Google Scholar] [CrossRef]
- Qu, J.; Dabboussi, W.; Hassani, F.; Nemes, J.; Yue, S. Effect of microstructure on the dynamic deformation behavior of dual phase steel. Mater. Sci. Eng. A 2008, 479, 93–104. [Google Scholar] [CrossRef]
- Oliver, S.; Jones, T.; Fourlaris, G. Dual phase versus TRIP strip steels: Microstructural changes as a consequence of quasi-static and dynamic tensile testing. Mater. Charact. 2007, 58, 390–400. [Google Scholar] [CrossRef]
- Johnson, G.R.; Cook, W.H. Fracture characteristics of three metals subjected to various strains, strain rates, temperatures and pressures. Eng. Fract. Mech. 1985, 21, 31–48. [Google Scholar] [CrossRef]


© 2020 by the authors. Licensee MDPI, Basel, Switzerland. This article is an open access article distributed under the terms and conditions of the Creative Commons Attribution (CC BY) license (http://creativecommons.org/licenses/by/4.0/).