Article

Effect of V2O5 Additive on Micro-Arc Oxidation Coatings Fabricated on Magnesium Alloys with Different Loading Voltages

State Key Laboratory of Advanced Processing and Recycling of Nonferrous Metals, Lanzhou University of Technology, Lanzhou 730050, China
*
Author to whom correspondence should be addressed.
Metals 2020, 10(9), 1146; https://doi.org/10.3390/met10091146
Submission received: 20 July 2020 / Revised: 18 August 2020 / Accepted: 20 August 2020 / Published: 25 August 2020

Abstract

:
Effect of V2O5 additive in silicate-containing electrolyte on AZ91D magnesium alloys treated by micro-arc oxidation (MAO) technology under different loading voltages was investigated. The results showed that vanadium was well up-taken into the coating chemically. Moreover, a new phase of MgV2O4 with spinel structure was obtained in MAO coatings due to V2O5 added into the electrolyte. The MgV2O4 phase was responsible for the coatings exhibiting brown color and also was beneficial to improving the anti-corrosion property. In spotting tests, the corrosion resistances of coatings prepared under the high voltage are about 6–9 times higher than those of the low voltage because of the thicker coatings of the former. In potentiodynamic polarization tests, the coatings’ corrosion resistances were improved with the addition of V2O5, which was more significant under the low voltage than that under the high voltage. When the concentration of V2O5 was 0.2 g/L, the corrosion current density of the coating was the lowest, which means that the coating’s corrosion resistance under the low voltage is the best. Hence, it is necessary to carry out targeted design of the coating’s microstructure according to the different applications.

1. Introduction

Magnesium and magnesium alloys exhibit superior advantages in various applications such as aviation, transportation, and 3C products, due to their outstanding properties like low density, high specific stiffness, and strength to weight ratio [1]. Unfortunately, Mg is the most negative metallic structural material, and its standard electrode potential is only −2.37 V. Therefore, the corrodibility of Mg alloys is a remarkable barrier to wide applications. Micro-arc oxidation (MAO), as a technique developed in the last two decades based on traditional anodic oxidation, is carried out generally in alkaline electrolytes to develop oxide layers on the surface of valve metal. During the MAO process, the localized instantaneous high temperature sintering of the oxide promotes the formation of the ceramic-like coatings with compact structure, good adhesion with substrate, superior corrosion resistance, and excellent comprehensive performance [2,3,4,5]. A relatively thick coating with modified microstructure and phase composition can be produced by optimizing the electrolyte composition to further improve the performance of the coating [6,7,8,9].
To date, studies on the electrolyte formulas of the MAO process mainly focus on silicate, phosphate, sodium hydroxide, and aluminate system, etc.; the combination of the above several kinds of systems; or joining different additives into the electrolyte system to obtain good performance coatings [6,8,9,10,11,12,13,14,15]. Up to now, reports about soluble oxides, which also have a relatively low cost attribute compared to those nanoparticles [16,17,18,19,20], as additives in MAO electrolyte are still very rare. Vanadium is widely used in metallurgy and chemical industries due to its brilliant mechanical properties, good corrosion resistance to acid and alkali, good abrasion resistance, etc. [21,22]. For the past few years, vanadium pentoxide, one of the most common vanadic oxides, was mainly used as an additive for the improvement of the wear and corrosion resistances of the substrate in various surface treatment processes [23,24,25]. Furthermore, the voltage, as the most important electrical parameter, exhibits a serious effect on the property of the coating by affecting the thickness and microstructure of the coating. With an increase of the voltage, the coating thickness increases but the pore size also enlarges [2,26,27], so the corrosion resistance of the coating maynot be always improved.
Besides, based on studies on the effects of pH and/or chloride ion on the corrosion of magnesium and its alloys [28,29,30,31], the corrosion is closely related to environmental factors. Whereas, little research up to now has been descriptive of the influence of the corrosive media on the corrosion of surface coated Mg alloys [32]. In order to study the effect of V2O5 on the coating and further understand the corrosion mechanisms in different corrosive media, two types of coatings were prepared on AZ91D Mg alloys in MAO electrolyte with V2O5 additive under two loading voltages. The results and corrosion mechanisms in acidic and neutral chloride corrosion environments were discussed, and were expected to enhance the coating’s corrosion resistance under different application scenarios.

2. Experimental

2.1. Material Preparation

Test coupons of AZ91D Mg alloy cut from commercial cast ingot (mass fraction: Al 8.2–9.8%, Zn 0.3–1.0%, Mn 0.1–0.3%, Si ≤ 0.09%, Cu ≤ 0.025%, Ni ≤ 0.001%, Fe ≤ 0.004%, and Mg balance) were chosen as the matrix to be treated in this study. Samples with dimensions of Φ28 mm × 12 mm, were metallographically polished by 150#, 400#, and 800# silicon carbide abrasive paper consecutively. Then, the samples were degreased with acetone, followed by thorough rinsing with demineralized water, and finally dried in an warm air stream before treatment.

2.2. Coating Fabrication

The treatment was implemented using a home-made, pulsed DC power device up to the two limiting voltages, UL = 380 V or 480 V for 30 min. The frequency and the duty cycle were 700 Hz and 20%, respectively. The specimen was used as the anode, and a piece of stainless steel sheet was employed as the cathode. The MAO electrolytes were composed of sodium silicate (Na2SiO3, 15 g/L) and potassium fluoride (KF, 13 g/L), with V2O5 additive of 0 g/L, 0.2 g/L, 0.5 g/L, and 0.8 g/L, respectively. V2O5 was purchased from Tianjin Sitong Chemical Plant (Tianjin, China). All the other chemicals, such as Na2SiO3, KF, and KMnO4, were supplied by Sinopharm Chemical Reagent Co., Ltd., (Shanghai, China). All the reagents, unless otherwise noted, were of analytical grade. The electrolyte was controlled at a temperature range of 20–40 °C by a stirring and water cooling device. At this point, all MAO specimens were entirely rinsed in deionized water, dried with the blower, and then stored in a drying cabinet before characterization.

2.3. Coating Characterization

An eddy meter (TT260, Time Company, Beijing, China) was used to assess the thickness of MAO coatings. Eight parallel samples were selected to be examined and 10 points were taken on each sample surface.
The coatings’ surface morphologies and cross-sectional elemental analyses were performed with a scanning electron microscopy (SEM, JSM-6700F, Jeol, Tokyo, Japan) coupled with energy dispersive spectroscopy (EDS). Quantitative SEM image analysis was done with the software Image J to obtain the distribution of the micropore and the surface porosity. The phase composition was identified by X-ray diffraction (XRD, D/Max-2400. Rigaku, Tokyo, Japan) with a Cu Kα target in a scan range from 20° to 100° (in 2θ) and a step size of 0.02°.
For the purpose of appraising the coating corrosion resistance in an acidic condition, the spotting test was conducted based on the standard HB5061-77, but the concentration of HNO3 was increased to 2.5 times [33]. Therefore, the recipe of the spotting solution was as follows: 0.05 g KMnO4, 12.5 mL HNO3, and 87.5 mL H2O. The device is shown in Figure 1 below. The sample was installed on the device and the screws were tightened to avoid the liquid missing the test hole. Titration was taken with a 1 mL dropper held vertically and approximately 5 mm above the test hole (note: there should be no gas in the dropper). Stopwatch timing started after continuous dropping of 2 drops, and the timing ended when the liquid completely changed from burgundy to colorless. When the spotting solution was dropped on the surface of the sample, HNO3 reacted preferentially with MgO (the main composition of the coating) and further corroded the substrate by the following reactions:
MgO + 2HNO3 → Mg(NO3)2 + H2O
Mg + 10H+ + 2NO3 → Mg2+ + N2O (↑) + 5H2O
Mg + 12H+ + 2NO3 → 5Mg2+ + N2 (↑) + 6H2O
At the same time, KMnO4 reacts with reducing substance (Mg substrate) in a strong acidic environment (Equations (2) and (3)), and the resulting Mn2+ is colorless.
MnO4 + 8H+ + 5e → Mn2+ + 4H2O
For electrochemical testing, the potentiodynamic polarization (PDP) curves were obtained by an electrochemical workstation (CHI660C, Chenhua, Shanghai, China) controlled by a computer connecting to a conventional three-electrode system assisted by a platinum sheet auxiliary electrode, a Hg/Hg2Cl2/sat KCl reference electrode, and the testing sample for a working electrode. The test was operated at a sweep rate of 10 mV·s−1 and a scan range of −1.8 V to −0.8 V after 24 h immersion in a 3.5 wt% sodium chloride aqueous solution (1 cm2 exposed surface area). To ensure the repeatability of the above tests, 8 groups of parallel experiments coming from two sides of 4 samples were carried out.
It should be pointed out that the thickness and anti-corrosion values were final average values after removing exceptional data by Grubbs test.

3. Results and Discussion

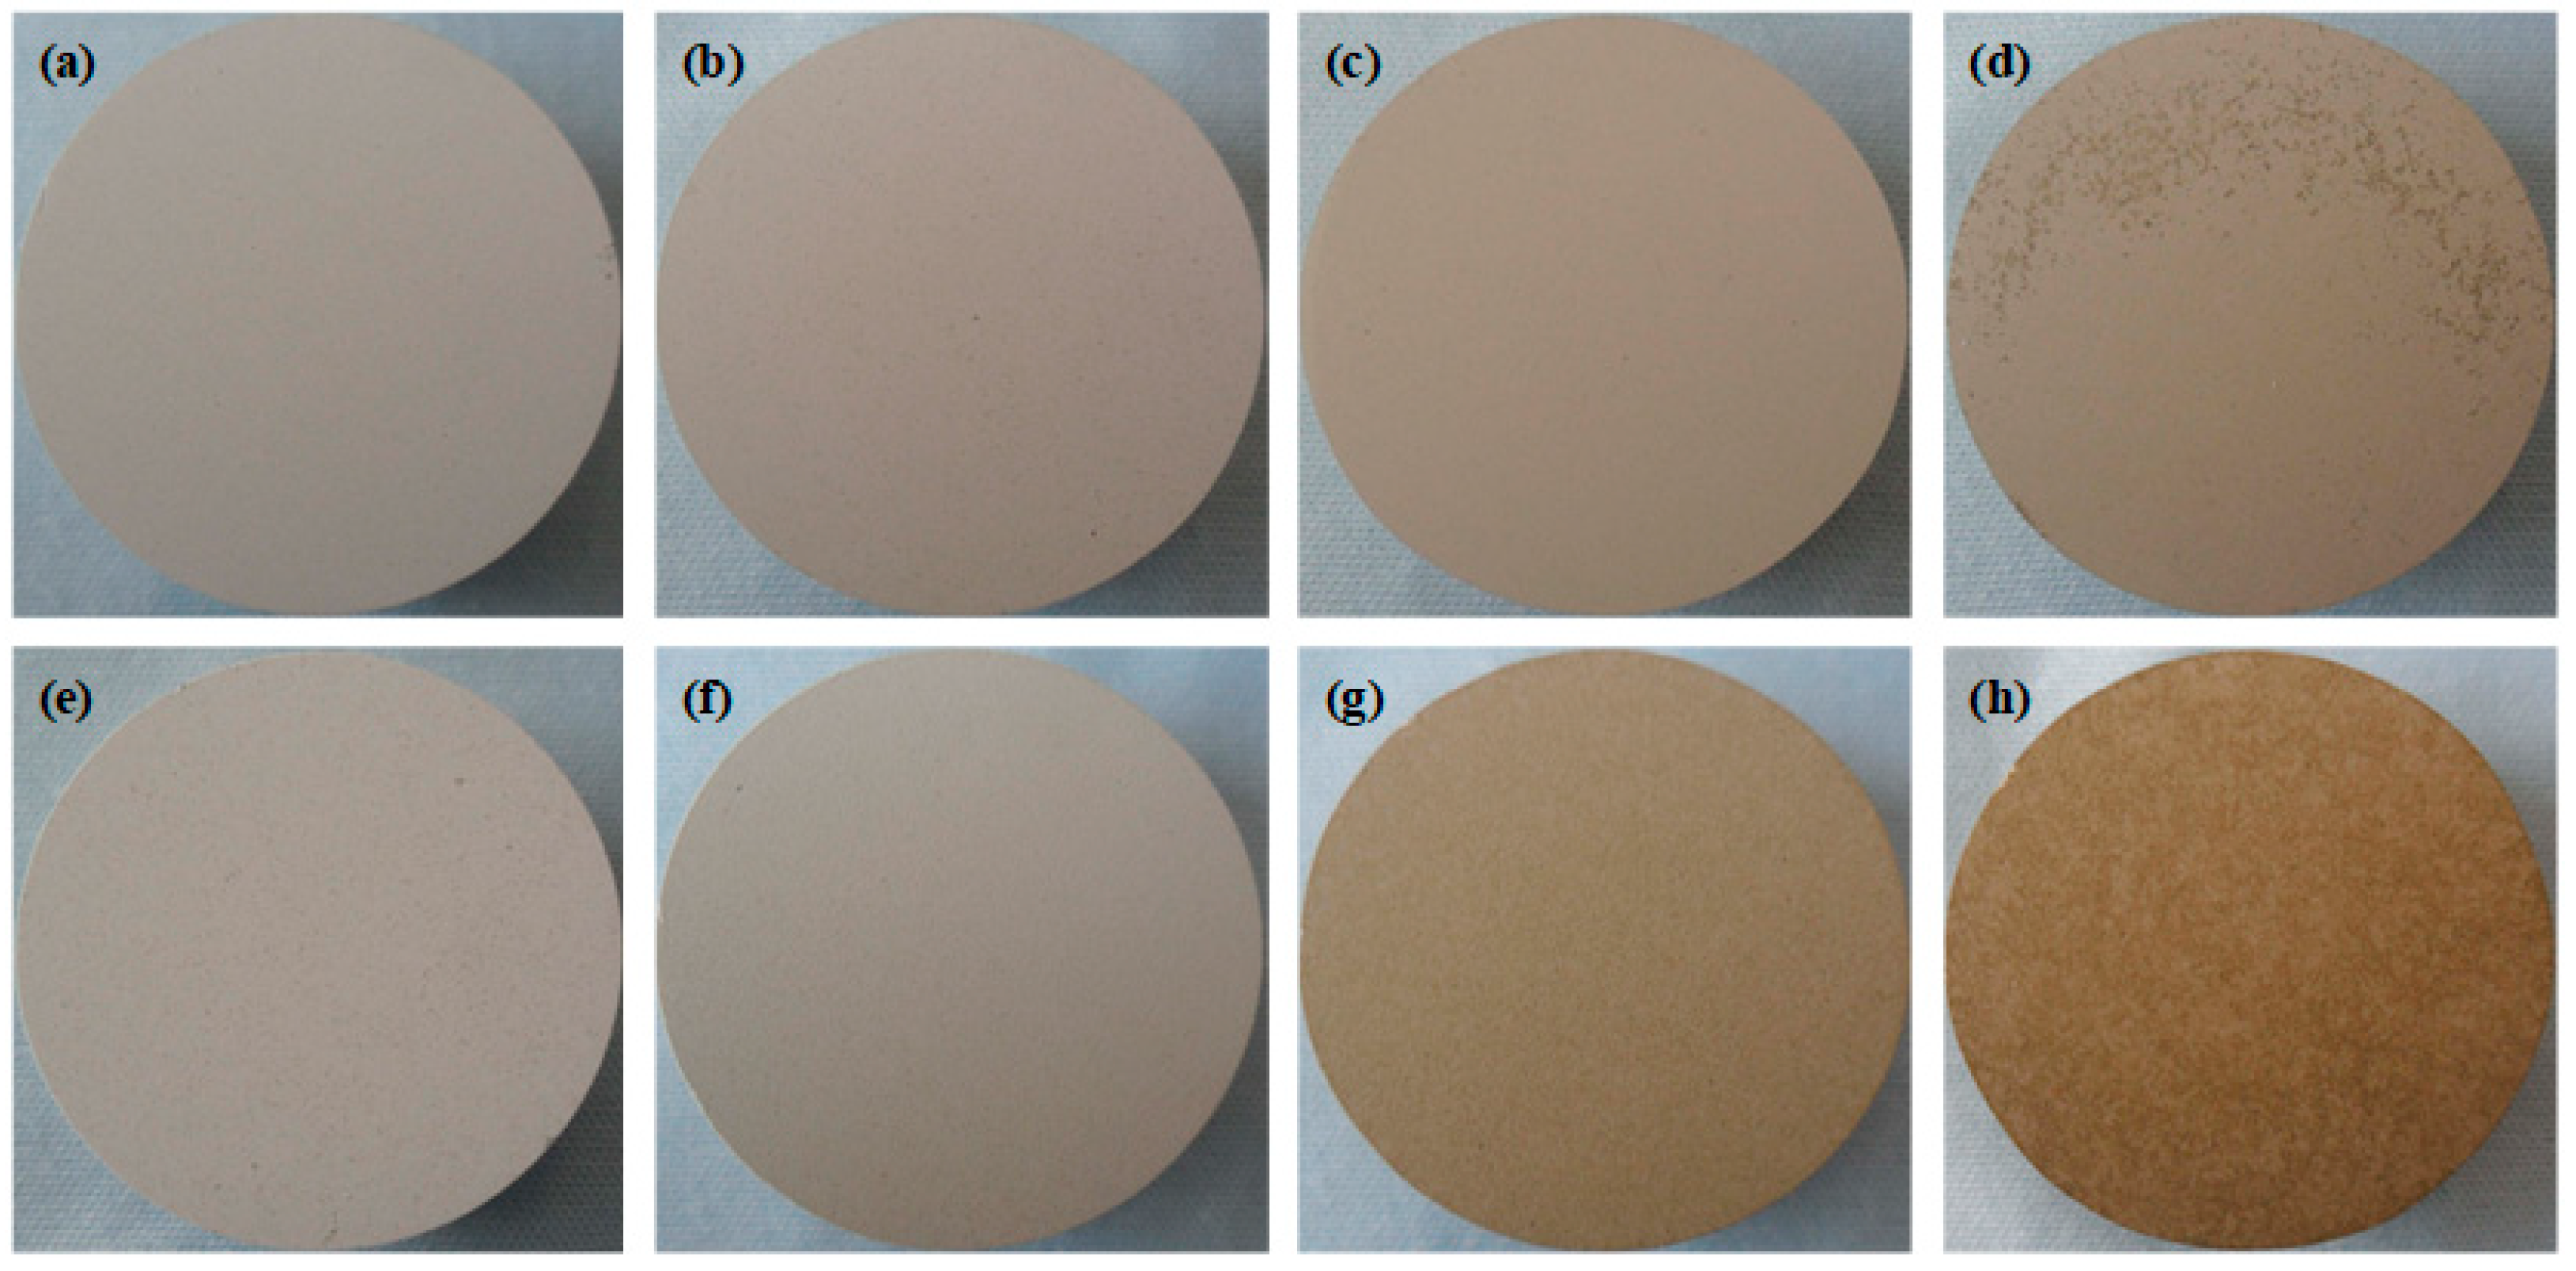
3.1. Macroscopic Morphologies

Figure 2 depicts the macro photographs of MAO coatings with various V2O5 concentrations under different loading voltages. As shown in Figure 2, the substrates were coated with MAO layer and the color depended on both the UL and V2O5 contents. The MAO of tantalum also marked similar observations [34]. The color of the coatings gradually darkened from the initial grey to the final brown with the increase of the UL and V2O5 contents. When V2O5 was 0.2 g/L, the color of the coatings was similar to their counterpart coatings without the V2O5 additive, as shown in Figure 2a,b,e,f, and the coatings exhibited an obvious brown color under both two loading voltages when V2O5 was 0.8 g/L. Interestingly, the uneven color on the coating surface was visible to the naked eye with concentrations of V2O5 up to 0.8 g/L, as evident in Figure 2d, which indicated the concentration should not be too high.

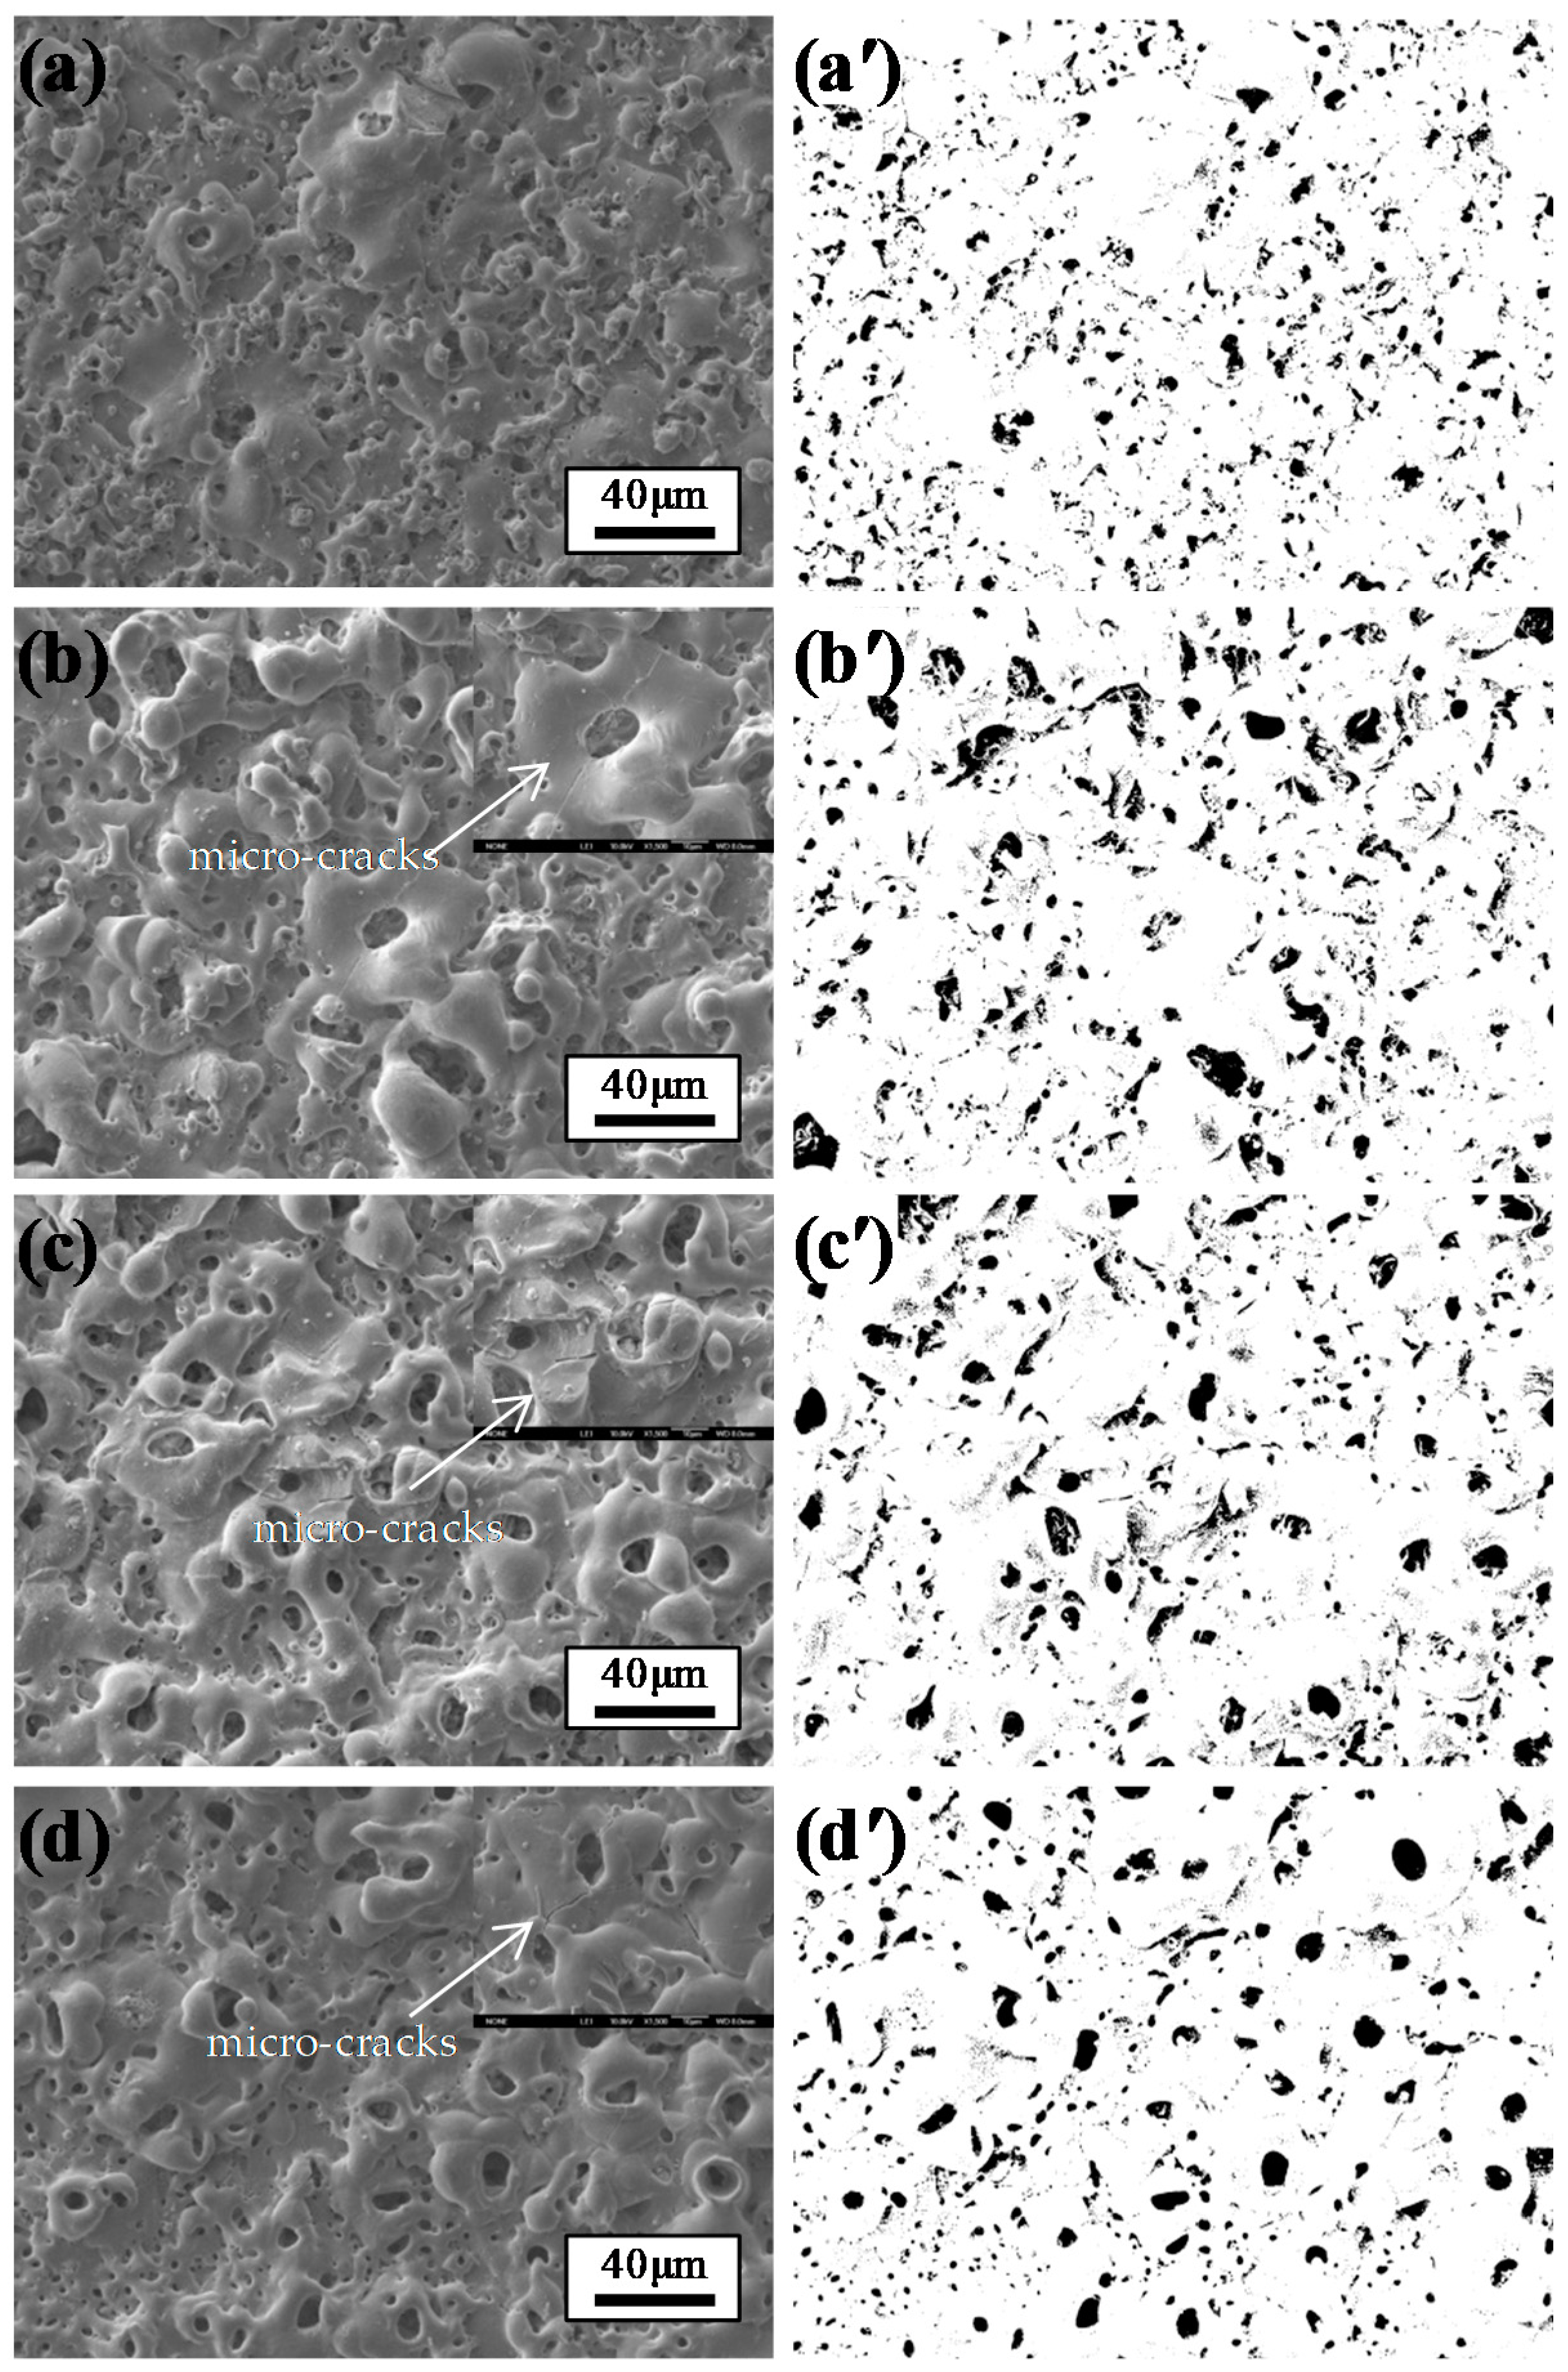
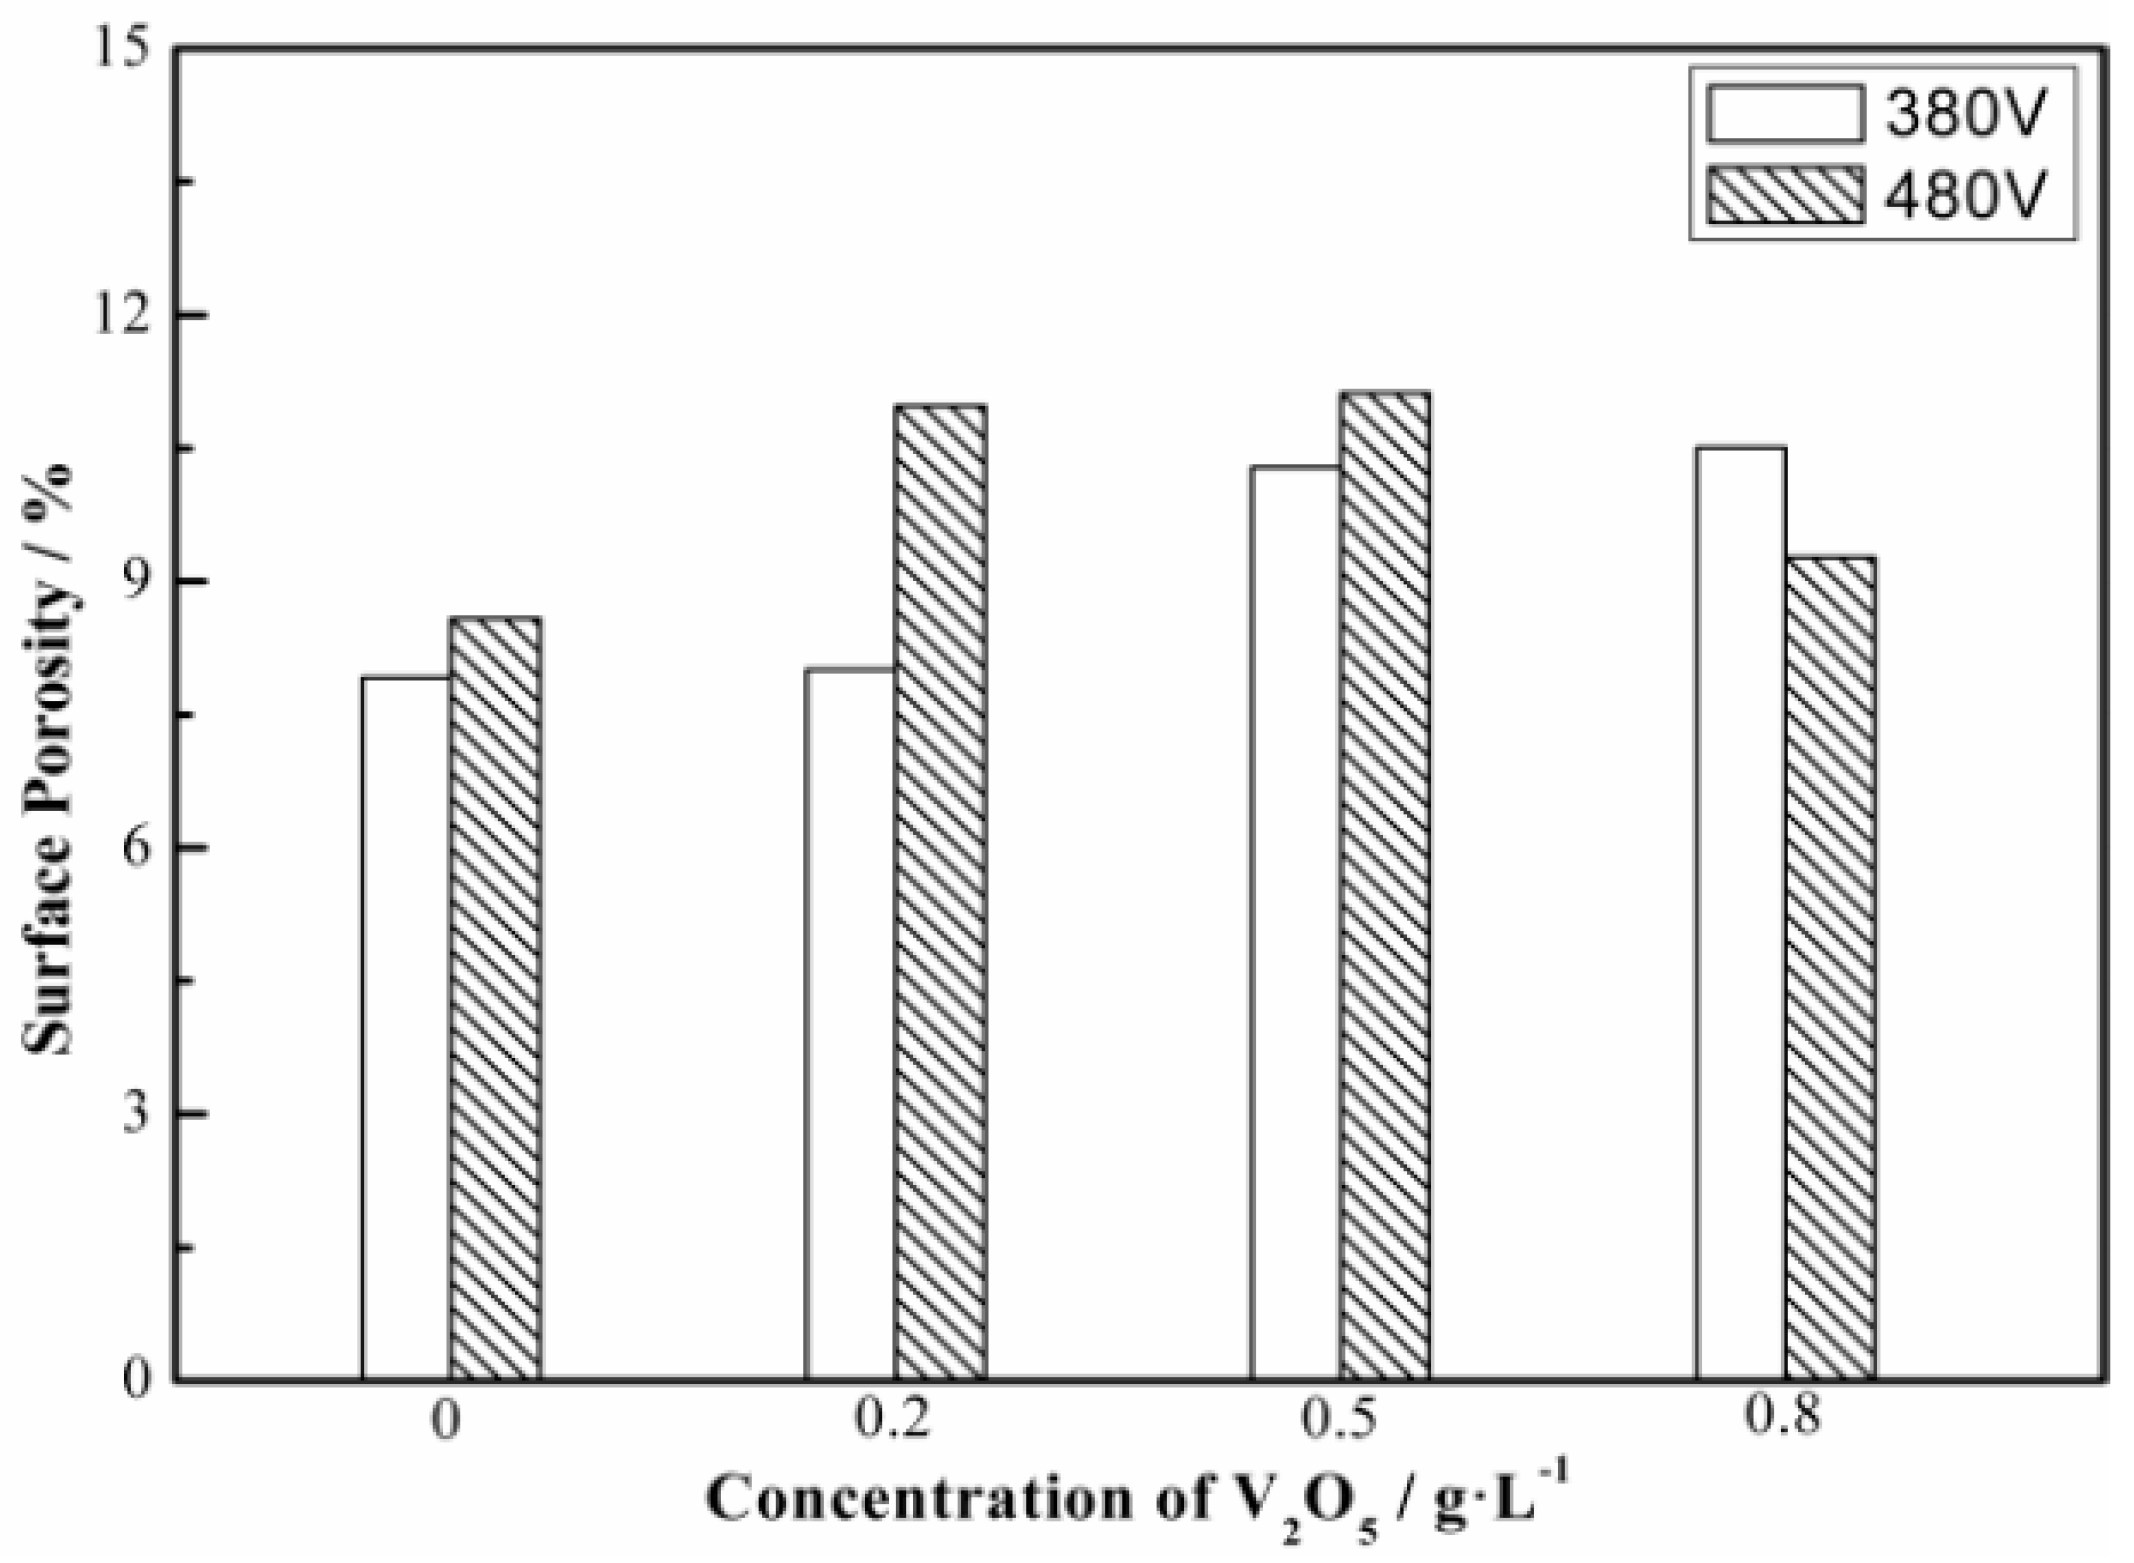
3.2. Microscopy Morphologies

The surface SEM images and the distribution of micro pores of MAO coatings prepared under various conditions are displayed in Figure 3 and Figure 4. Quantitative statistical results of the surface porosity of the coatings are shown in Figure 5. The surface of the coating possesses numerous irregular micro-pores with different sizes, which were formed during the breakdown of the coating under the strong electric field. These micro-pores were also the discharge channels within the coating, releasing the melts and gas outward to the coating surface. Comparing the surface morphology of the coatings under different voltages, the amount of micro-pores on the surfaces prepared under 480 V is lower than that under 380 V, but the pores’ size and the corresponding surface porosity is larger, as illustrated in Figure 4 and Figure 5. This was mainly because the sample obtained more energy during MAO treatment under the high voltage, and the breakdown occurred easily so the pores size on the surfaces is larger and micro-cracks also appear (Figure 4a–d). On the other hand, it can be seen from Figure 5 that, with the addition of V2O5 to the electrolyte, the surface porosity of the coatings under both voltages increased. As the concentration of V2O5 increases from 0.2 g/L to 0.8 g/L, the surface porosity of the coatings under 480 V first increased slightly and then decreased, whereas under 380 V, it increased gradually. The coating with minimal V2O5 concentration presents the preferable compactness. Furthermore, large protrusions and valleys were locally distributed on the coatings’ surfaces (Figure 3c,d). This phenomenon is consistent with the uneven color appearance of the macro morphology, especially in Figure 2d.
According to the literatures [35,36], V2O5 reacts in water to give vanadic and metavanadic acid after adding it into the solution (Equations (5) and (6)).
V2O5 + 2OH → 2VO3 + H2O
V2O5 + 6OH → 2VO43− + 3H2O
The detailed pH and conductivity of the electrolytes are presented in Table 1. The electrolytes were abbreviated as 0 g/L V2O5 (base electrolyte: 15 g/L Na2SiO3 + 13 g/L KF), 0.2 g/L V2O5 (base electrolyte + 0.2 g/L V2O5), 0.5 g/L V2O5 (base electrolyte + 0.5 g/L V2O5), and 0.8 g/L V2O5 (base electrolyte + 0.8 g/L V2O5). It can be seen that the alkalinity of the electrolyte composed of Na2SiO3 and KF decreases after the addition of V2O5, and the acidity of the electrolyte increases with the increasing of the V2O5 concentration. In addition, with an increase of the amount of V2O5 added, the conductivity of the electrolyte also decreases. It is generally believed that the MAO process involves the dissolution of old coatings and the formation of new coatings, resulting in a competition in both processes [27,37]. The decrease of pH and conductivity changes the properties of the electrolytes, which affects the formation of passivation film in the initial stage of MAO and the discharge characteristics of the coatings. Therefore, the addition of V2O5 to the solution accelerates the dissolution process due to the reduced alkalinity and conductivity, and may result in the decreased growth rate and a weak state in a certain local area on the coating surface where the continual breakdown occurs, inducing the emergence of the large-size micropores and microcracks, which in turn become the access for corrosive media entering into the coating, and thus affects the corrosion resistance of the coating.

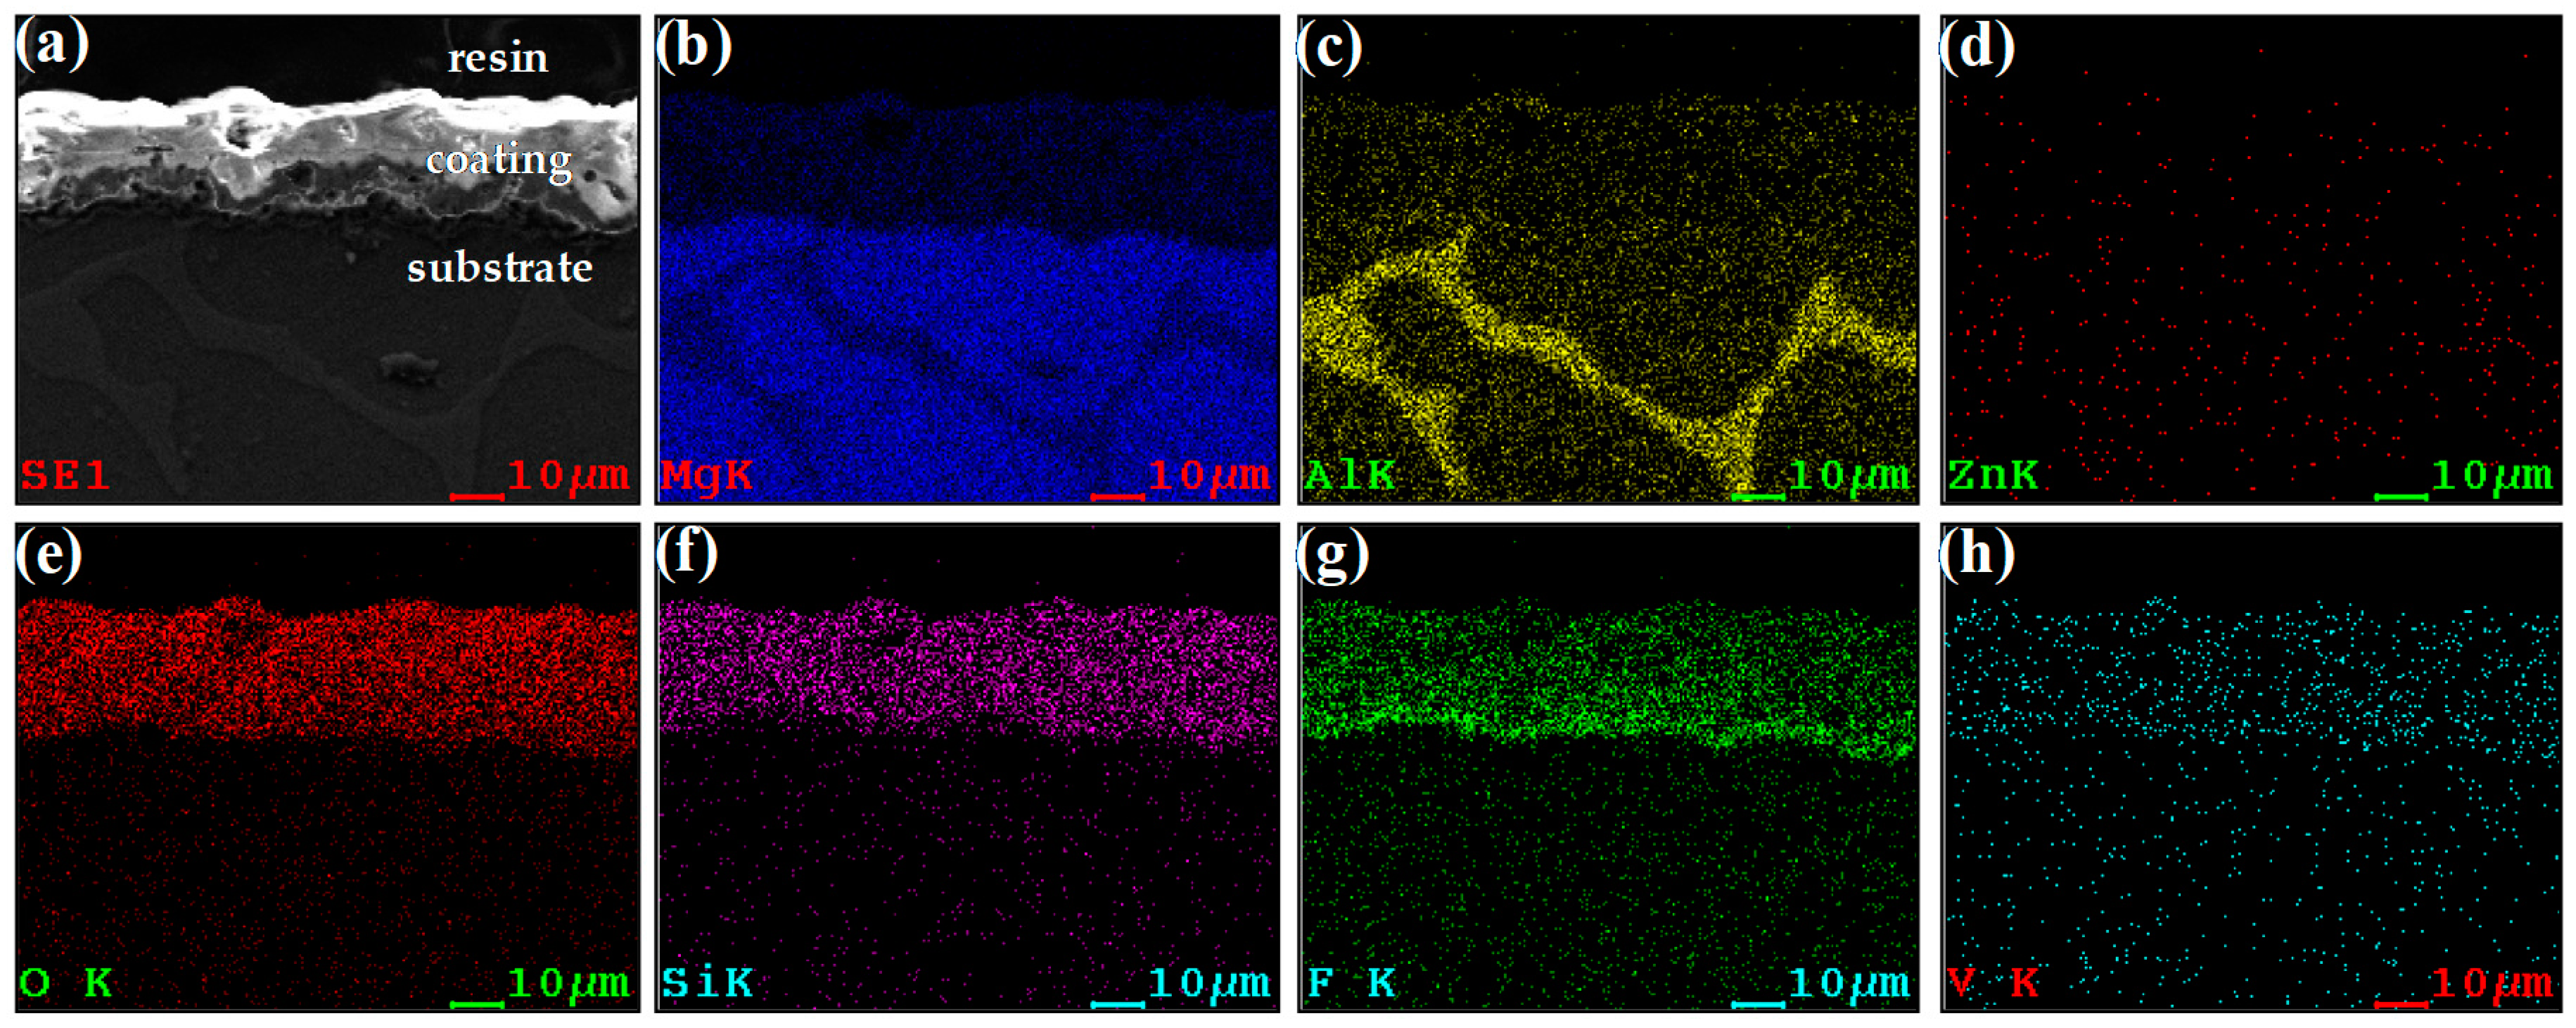
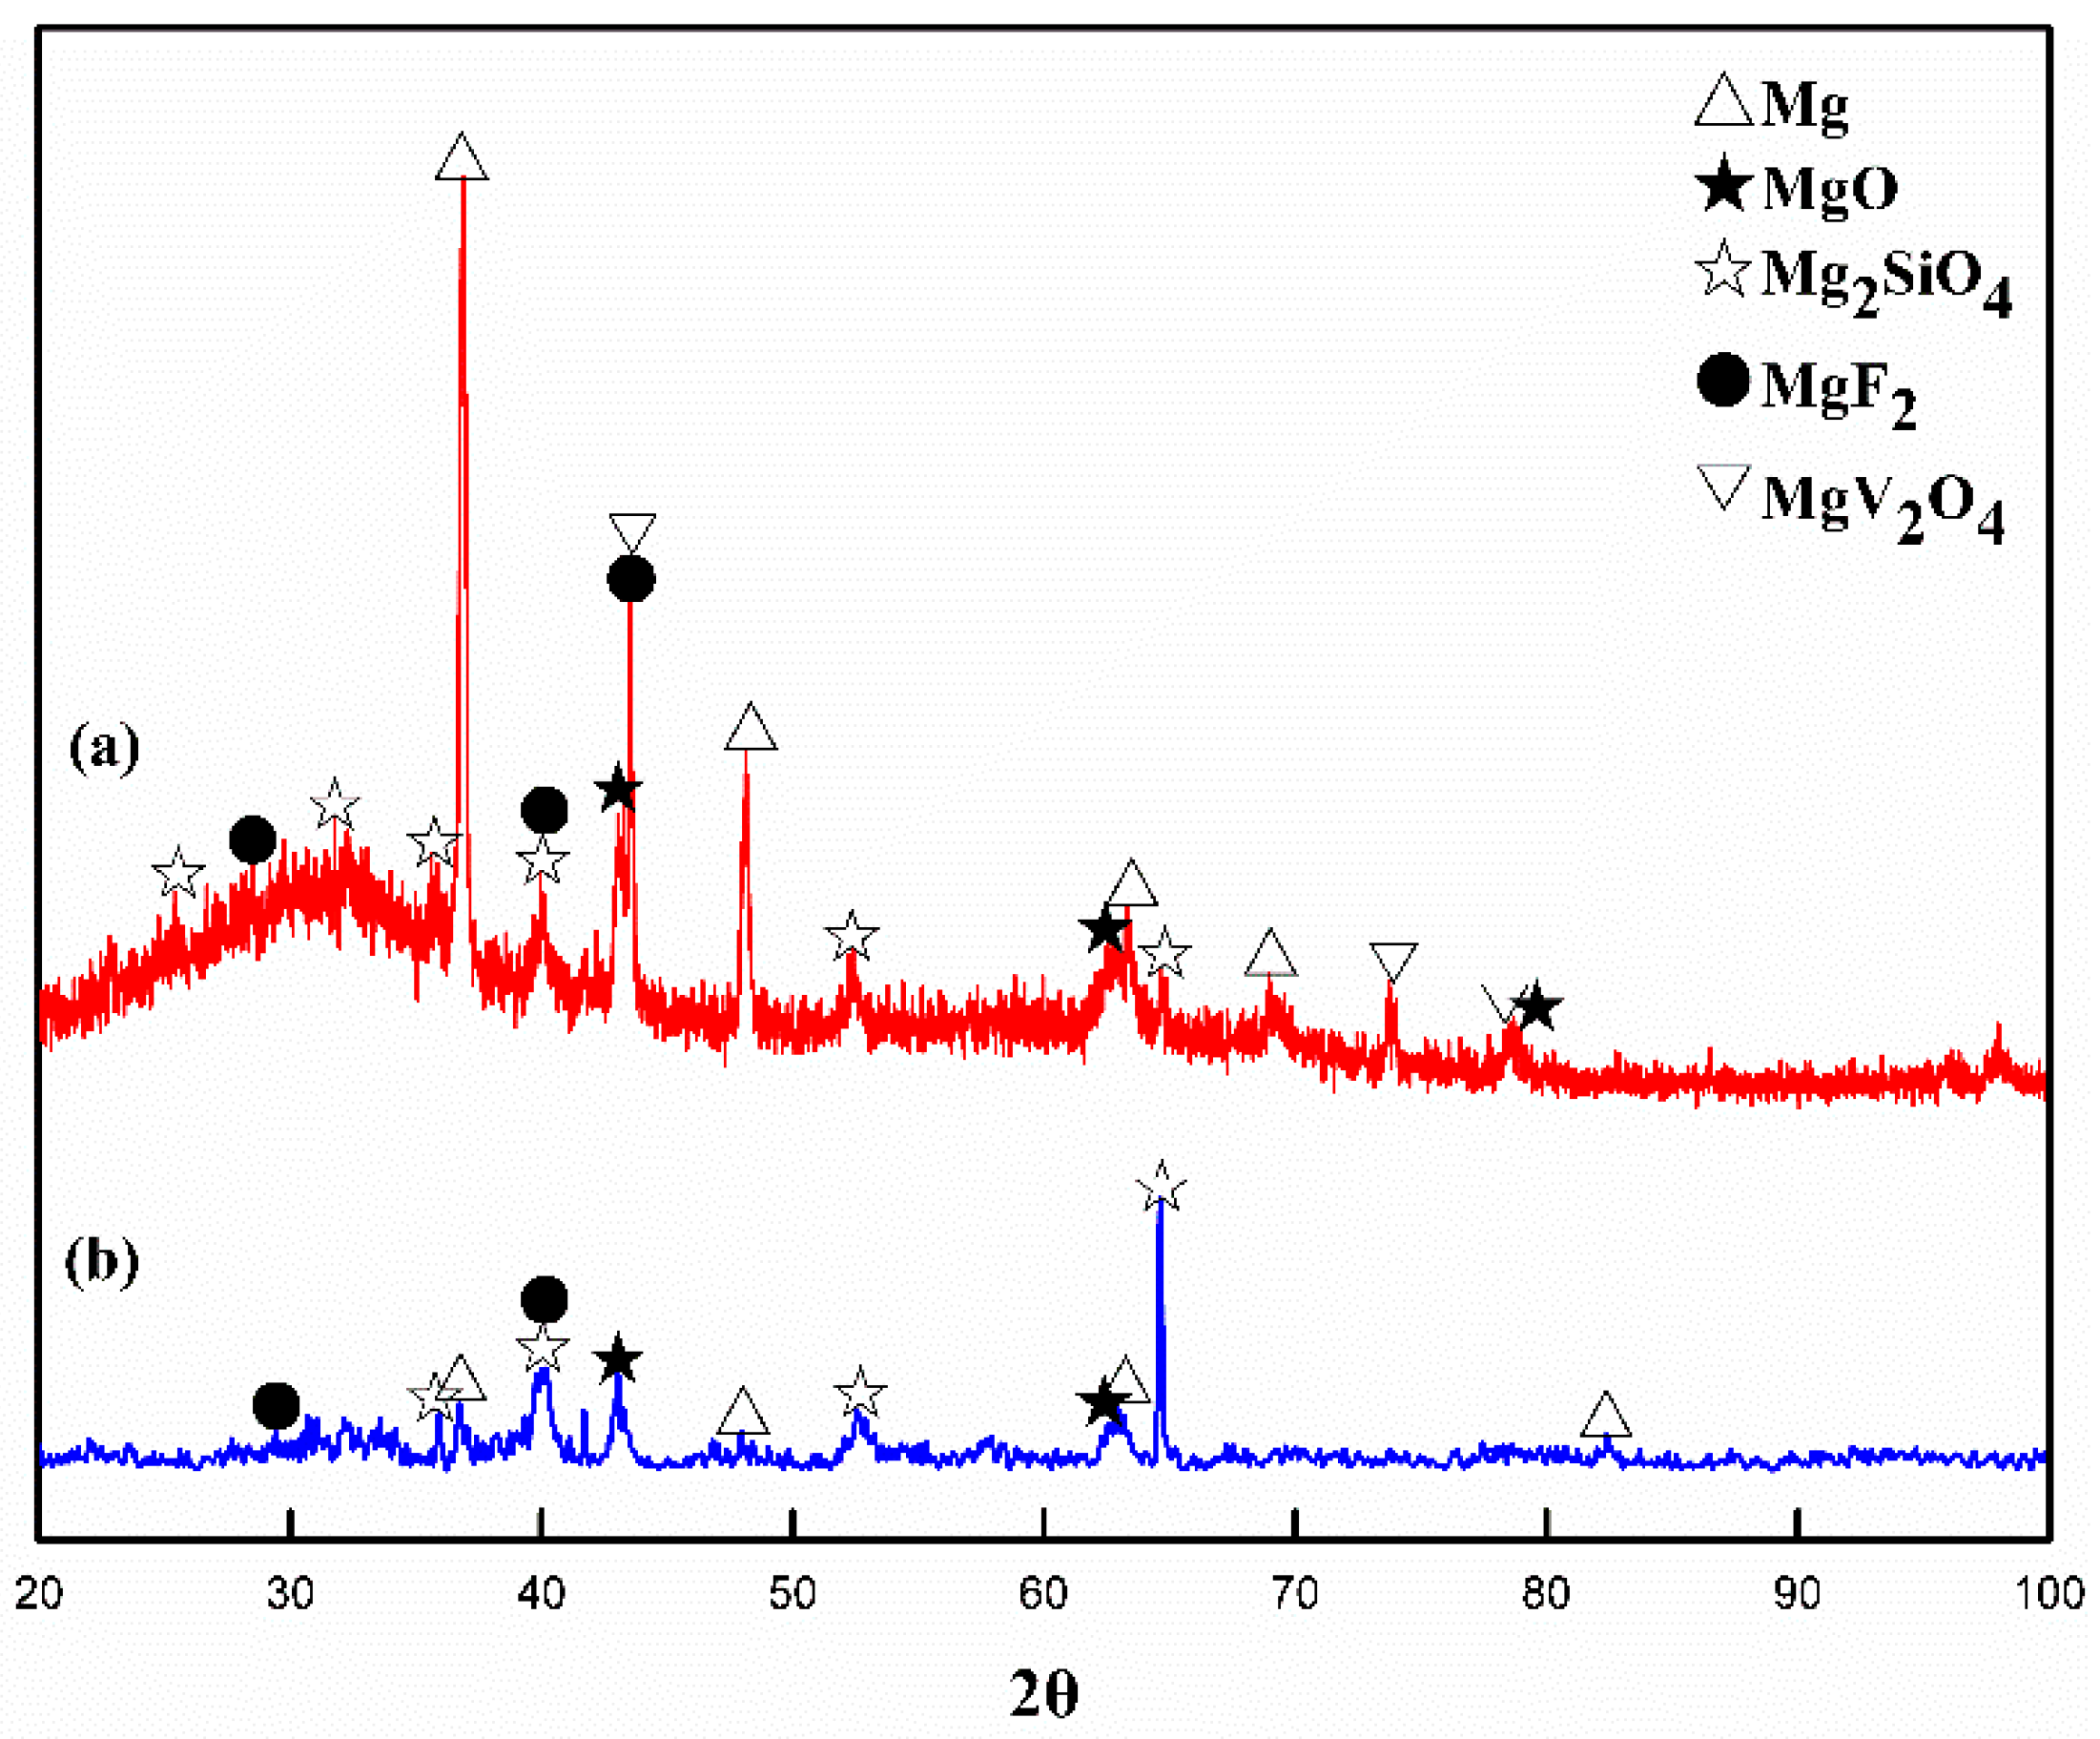
3.3. Chemical Composition of MAO Coating

The cross-section elemental analysis of one typical coating prepared with 0.8 g/L V2O5 under 480 V is shown in Figure 6.Theelement content of the coating is summarized in Table 2. Generally speaking, the type and the content of the elements are closely related to the substrate and electrolyte composition. As seen in Figure 6 and Table 2, the coating mainly consists of magnesium, aluminum, zinc, oxygen, silicon, fluorine, and a trace of vanadium. Magnesium, aluminum, and zinc are the major constituents of AZ91D Mg alloy substrate, while fluorine, silicon, and vanadium are attributed to the composition of the electrolyte, KF, Na2SiO3, and V2O5, respectively. Oxygen may be derived from the electrolyte or the air. The contents of V element distributed in the coating were low, which may result from the fact that the amount of V added to the solution was low, as shown in Figure 6h and Table 2. The contents of F element near to the coating-substrate interface were relatively high and present a tendency of diffusion towards the substrate. In addition, O and Si elements in the coating were uniformly spread across the transverse section. These results were also reported by other scientists [38,39].
Figure 7 demonstrates the XRD pattern of the coatings prepared under 480 V without V2O5 and with 0.8 g/L V2O5. It was observed that the coatings without V2O5 added into the electrolyte were mainly composed of MgO with a cubic structure, Mg2SiO4 spinel phase and MgF2. These phases were gray or white. After adding V2O5 into the electrolyte, a new phase of MgV2O4 was observed in the coating, as shown in Figure 7a, and this coincides with the result of map scanning in Figure 6. It can be concluded that MgV2O4 should be the substance which affects the coatings’ coloring. MgV2O4 is also a spinel structure and possesses plenty of advantages, such as high temperature resistance, corrosion and wear resistance, high strength, and high hardness [40,41], so V2O5 added into the electrolyte can improve the coating’s corrosion resistance.
During MAO process, because of the presence of a strong electric field, the ions (VO3, VO43−; Equations (5) and (6)) in the electrolyte migrated to the sample (anode), forming an enrichment region of VO3 and VO43−, and further forming a concentration gradient between the anode and cathode. The high chemical potential existing at the interface of the sample and the solution was beneficial to adsorption of VO3 and VO43− on the sample surface, and further generated the colorful MgV2O4 phase deposited into the coating by the complex oxidation-reduction reactions with activated magnesium atoms, oxygen atoms, etc. Hence, with the increase of the V2O5 contents in the electrolyte, the amount of MgV2O4 increasesand the coating’s color deepens gradually to finally be brown (Figure 2). Furthermore, the color of the coatings obtained under 480 V are darker than those under 380 V (Figure 2), since the driving force of VO3 and VO43− in the electrolyte under the high voltage is greater, which is beneficial for the ions entering into the discharging channels of the coatings and participating in the reactions. Therefore, the more MgV2O4 phase in the coatings, the darker the color of the coatings.

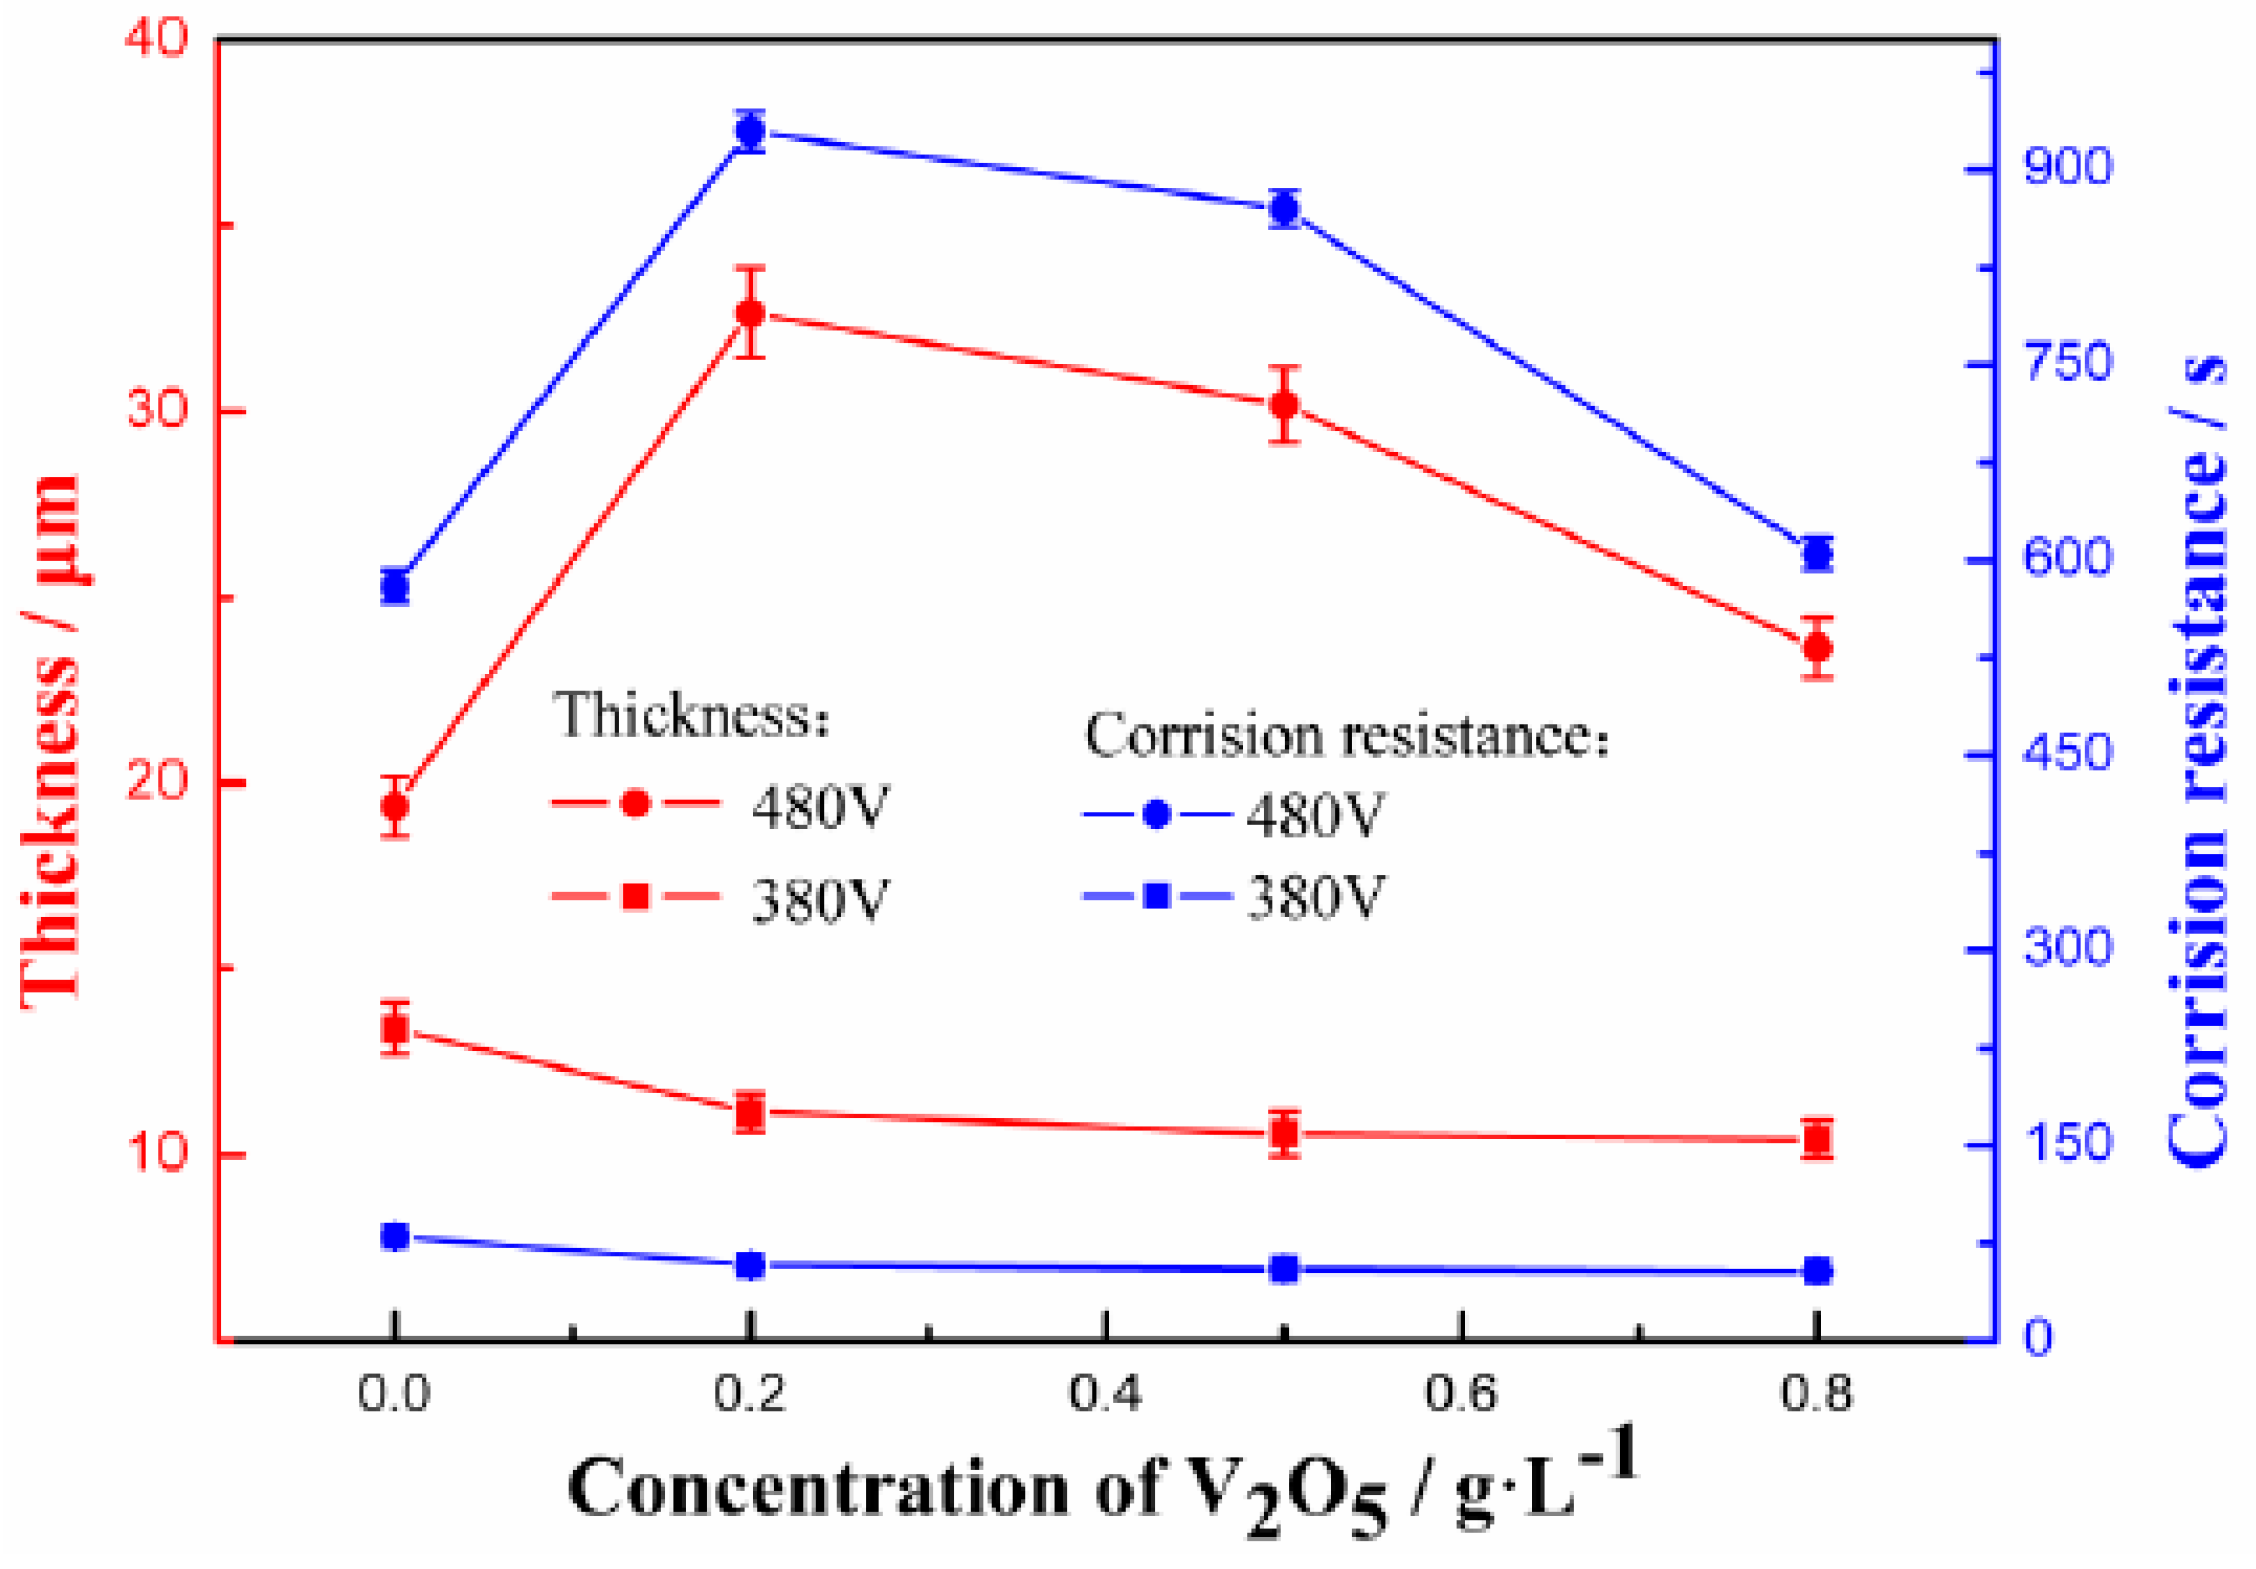
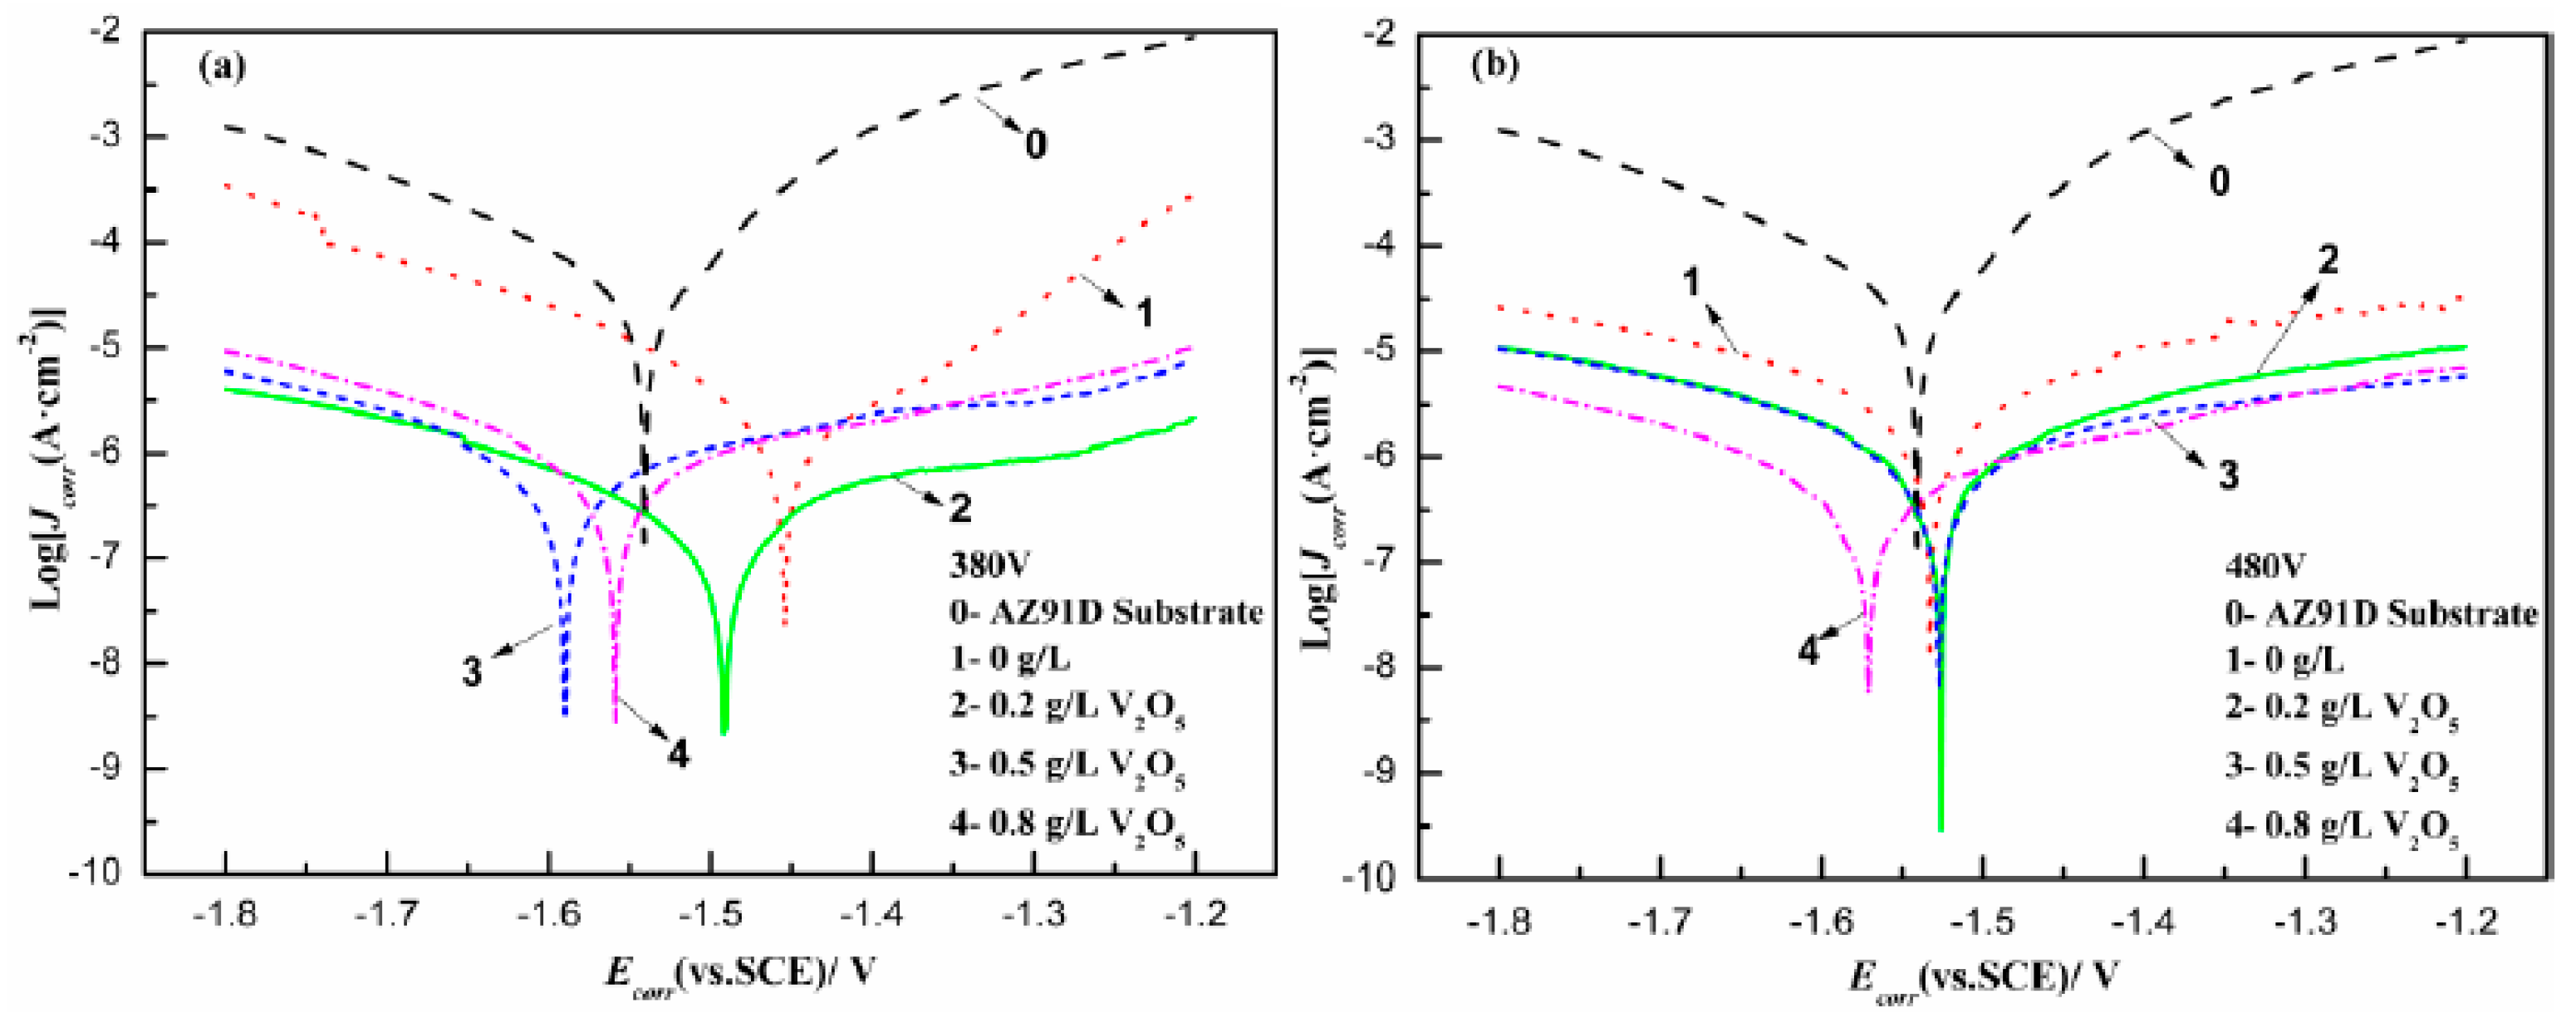
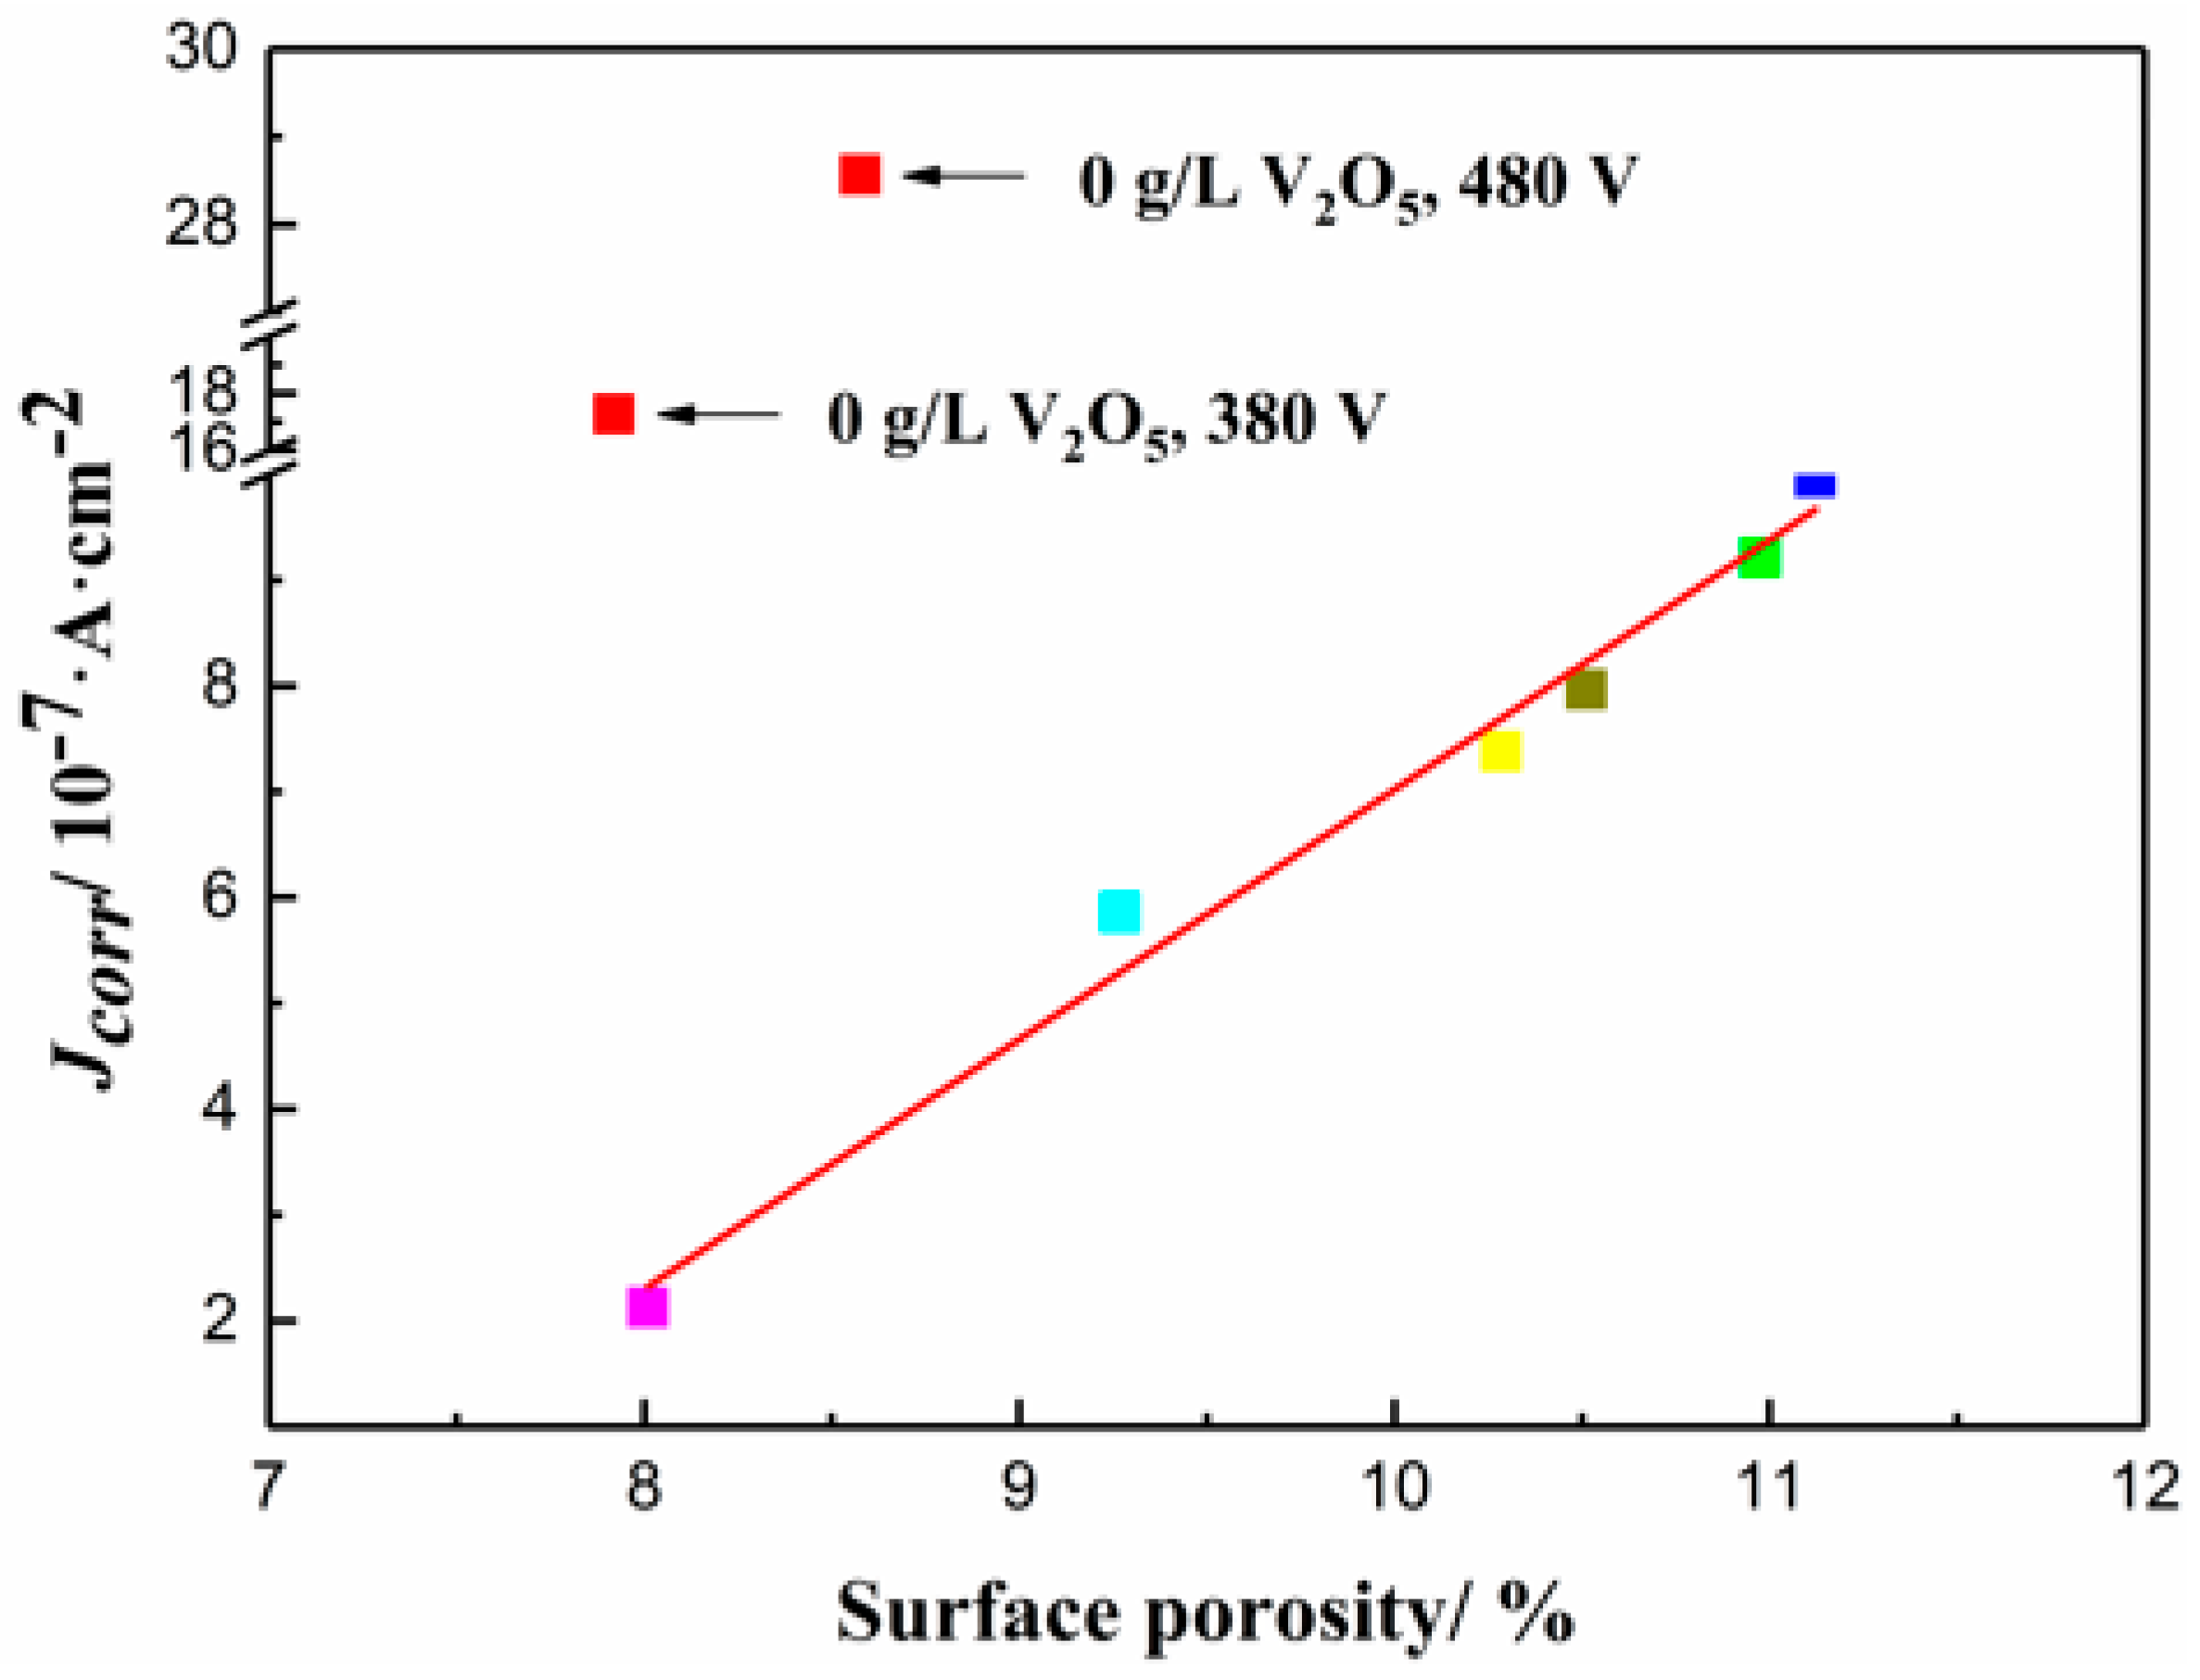
3.4. Corrosion Studies

Figure 8 illustrates the thickness and the corrosion resistance corresponding to the spotting test results of the coatings prepared under various conditions. The loading voltage is one of the primary parameters to determine the MAO coating’s thickness. Consequently, it can be seen from Figure 8 that the effect of voltages on the thickness is noticeable with the constant V2O5 concentration, and the thickness of the coatings prepared under 480 V are about 2–3 times higher than those under 380 V. Additionally, as the concentration of V2O5 increases, coating thickness obtained under 480 V first increases and then decreases, and an inflection point appears at the minimum concentration of V2O5. In the case of the low voltage, the thickness of the coatings decreased slightly with increase in the V2O5 dosage. This may be ascribed to the vanadic and metavanadic acid generated by V2O5 added into the electrolyte, which changed the nature of the solution and dissolved the coating, decreasing the coating’s growth rate. Nevertheless, the side effect of vanadic and metavanadic acid was weakened under the high voltage due to the faster growth rate.
Obviously, according to Figure 8, the corrosion resistance in the spotting test of the coatings formed under two kinds of voltages exhibits a similar variation trend with the coatings’ thicknesses when changing the mass concentration of V2O5. In the spotting corrosive solution, the coating thickness plays a leading role on the corrosion resistance (Equation (1)), and the coatings’ corrosion resistance under the high voltage was much better than that formed under the low voltage, which may be attributed to the thicker coating of the former. Besides the thickness, the formation of chemically stable Mg2SiO4 and MgF2 phase during the MAO process could also have contributed to the enhancement of the coating’s corrosion resistance and it requires long time to react with the HNO3 etchant. Meanwhile, the anti-corrosion property of the coating obtained under the high voltage in the electrolyte with the minimum amount of V2O5 (0.2 g/L) was the best. The coating’s corrosion resistance obtained under 380 V decreases somewhat with the increase of V2O5, owing to the slightly decreasing thickness.
The PDP plots of the coatings prepared with different V2O5 concentrations under different voltages are presented in Figure 9. The corrosion potential (Ecorr), corrosion current density (Jcorr), and linear polarization resistance (Rp) derived from the PDP curves are summarized in Table 3. The PDP curve of the untreated AZ91D sample is also included in Figure 9 as a background. It can be directly seen that the Jcorr values of specimens fabricated by MAO under two kinds of voltages both reduce by two orders of magnitude, compared to that of the uncoated, and it can be certified that MAO can remarkably enhance the corrosion resistance of magnesium alloys. The Jcorr values of the coatings after adding V2O5 into the electrolyte decrease by about one order of magnitude, compared to that without V2O5 additive, which indicates that the tiny concentration of V2O5 can significantly enhance the coating corrosion resistance, and the amplitude of improvement is large under the condition of low voltage.
Figure 10 shows a scatter plot of the surface porosity and Jcorr of the corresponding coating. It can be seen that except for the two coatings without V2O5 additive (indicated by the arrows in the Figure 10), the other data confirm a linear relationship between the surface porosity of the coating with V2O5 and Jcorr. In NaCl corrosive media, the corruption of corrosion resistance of the specimen resulted from the hydration of MgO, occurring preferentially inside the micropores of the oxide film, corroding the substrate by the following reaction [32,42]:
MgO + H2O → Mg(OH)2
Mg + 2H2O → Mg(OH)2 + H2 (↑)
The coating is easy to be damaged due to the presence of chloride ion. Firstly, Mg(OH)2 produced by the hydration of MgO is not dense and is quite porous and would not provide a protective barrier to the corrosion of AZ91D substrate [32]. On the other hand, compared with other anions, chlorine ions with high activity are more easily adsorbed, and the radius of a chloride ion is smaller, so it is able to more easily penetrate into the coating through defects [43,44]. Thus, the coating corrosion resistance in NaCl solution is not only related to the thickness and phase composition, but also the tightness of the coating [26]. A MAO coating with less micro-defects, lower porosity, and compact structure is better at suppressing the penetration of the corrosive liquid and provides better corrosion protection.
In the case of the low voltage, the micro pores are small and the coatings are dense (Figure 3 and Figure 5), so NaCl corrosive medium has difficulty permeating the coating to corrode the substrate, and the coatings exhibit the better corrosion resistance with respect to the ones obtained under the high voltage. With an increase in V2O5 concentration from 0.2 g/L to 0.8 g/L, Jcorr of the coatings under the high voltage initially increases slightly, then decreases; however, Jcorr under the low voltage increases gradually, and the coating with lower V2O5 concentration presents the minimum corrosion current density. This result corresponds strictly to the surface porosity of the coating. For the coatings without V2O5, the surface porosity is very low, but the corrosion resistance is still poor. This is mainly due to the MgV2O4 phase in the coatings with V2O5, which is beneficial to the improvement of the corrosion resistances of the coatings. When the added amount of V2O5 is 0.2 g/L, the coating’s corrosion resistance formed under the low voltage is more obviously better than that prepared under the high voltage, which is mainly because the larger-size micropores and microcracks in the latter provide channels for NaCl solution to infiltrate into the coating and further corrode the matrix, as shown in Figure 4b. As a result, the Jcorr of the coating with the minimum V2O5 added under the low voltage is the lowest, and the coating corrosion resistance is the best. At this point, the energy consumption is low, and to some extent the cost is also relatively low.
In conclusion, the coating’s corrosion resistance is influenced by many microstructure characteristic parameters, including the coating thickness, phase composition, compactness, the defects, and so on. The corrosion mechanisms of different corrosive media are diverse, and the influence of each parameter on the coating’s corrosion resistance will be dissimilar. In HNO3 medium, the coating’s corrosion resistance is greatly affected by the coating thickness and phase composition. In NaCl corrosive medium, the compactness and defects seem to be the primary reasons for the coating corrosion resistance. The voltage and a small amount of V2O5 additive can affect the coating’s corrosion resistance significantly by influencing the abovementioned parameters. Therefore, the targeted coating design should be performed for different cases of application: In the acidic environment, a thicker coating under the high voltage is needed to improve the anti-corrosive property; In the neutral service condition, a dense coating with the low voltage seems to be insusceptible to corrosion media. Moreover, in both cases, the best performance is obtained when the minimum V2O5 was added. Meanwhile, it could also be concluded that there is an interaction between the voltage and V2O5 additive.

4. Conclusions

A brown coating was obtained on the surface of AZ91D magnesium alloy due to V2O5 added into the electrolyte, and the higher the voltage was, the darker the color of the coating turned out to be. The substance affecting the coatings’ coloring was the MgV2O4 phase with spinel structure, newly generated in the coatings, which was beneficial to improving the coatings’ corrosion resistance.
In the spotting tests of the HNO3 medium, the corrosion resistance of the coating mainly depended on the thickness. The thick coating’s spotting corrosion resistance, which was fabricated under the high voltage, was about 6–9 times better than that under the low voltage. In the electrochemical tests of the NaCl corrosive medium, the corrosion resistance of the coating mainly depends on the microstructure. The best electrochemical corrosion resistance is achieved when the added amount of V2O5 is minimal under the low voltage, which means that the corrosion current density is the lowest and is about five times lower than that under the high voltage, one order of magnitude lower than that without V2O5, and two orders of magnitude lower than that of uncoated.
Although the coating’s corrosion resistance is different as a result of the different corrosion mechanisms in the different corrosive media, one thing in common is that the coating’s corrosion resistance is influenced interactively by many microcosmic characteristic parameters, including the thickness, phase composition, compactness, and defects of the coating. Hence, it is necessary to carry out targeted designing of the coating’s microstructure according to the different applications.

Author Contributions

The experimental plan was designed by Y.M. MAO experiments and analysis were carried out by Z.W. and Y.W. The paper was written by Z.W. and revised by Y.M. All authors have read and agreed to the published version of the manuscript.

Funding

The authors are grateful for financial support of the Creative Research Group Fund Grant from the Department of Science & Technology of Gansu Province (1111RJDA011).

Conflicts of Interest

The authors declare no conflict of interest.

References

  1. Baghni, I.M.; Yinshun, W.; Jiuqing, L.; Du, C.; Zhang, W. Mechanical properties and potential applications of magnesium alloys. Trans. Nonferrous Met. Soc. China 2003, 13, 1253–1259. [Google Scholar]
  2. Darband, G.B.; Aliofkhazraei, M.; Hamghalam, P.; Valizade, N. Plasma electrolytic oxidation of magnesium and its alloys: Mechanism, properties and applications. J. Magnes. Alloys 2017, 5, 74–132. [Google Scholar] [CrossRef]
  3. Bordbar-Khiabani, A.; Yarmand, B.; Mozafari, M. Enhanced corrosion resistance and in-vitro biodegradation of plasma electrolytic oxidation coatings prepared on AZ91 Mg alloy using ZnO nanoparticles-incorporated electrolyte. Surf. Coat. Technol. 2019, 360, 153–171. [Google Scholar] [CrossRef]
  4. Srinivasan, P.B.; Liang, J.; Balajeee, R.G.; Blawert, C.; Störmer, M.; Dietzel, W. Effect of pulse frequency on the microstructure, phase composition and corrosion performance of a phosphate-based plasma electrolytic oxidation coated AM50 magnesium alloy. Appl. Surf. Sci. 2010, 256, 3928–3935. [Google Scholar] [CrossRef] [Green Version]
  5. Moon, S.; Arrabal, R.; Matykina, E. 3-Dimensional structures of open-pores in PEO films on AZ31 Mg alloy. Mater. Lett. 2015, 161, 439–441. [Google Scholar] [CrossRef]
  6. Chen, Y.; Yang, Y.; Zhang, T.; Zhang, W.; Wang, F.; Lu, X.; Blawert, C.; Zheludkevich, M.L. Interaction effect between different constituents in silicate-containing electrolyte on PEO coatings on Mg alloy. Surf. Coat. Technol. 2016, 307, 825–836. [Google Scholar] [CrossRef]
  7. Peitao, G.; Mingyang, T.; Chaoyang, Z. Tribological and corrosion resistance properties of graphite composite coating on AZ31 Mg alloy surface produced by plasma electrolytic oxidation. Surf. Coat. Technol. 2019, 359, 197–205. [Google Scholar] [CrossRef]
  8. Rokosz, K.; Hryniewicz, T.; Kacalak, W.; Tandecka, K.; Raaen, S.; Gaiaschi, S.; Chapon, P.; Malorny, W.; Matysek, D.; Dudek, L.; et al. Characterization of Porous Phosphate Coatings Enriched with Calcium, Magnesium, Zinc and Copper Created on CP Titanium Grade 2 by Plasma Electrolytic Oxidation. Metals 2018, 8, 112. [Google Scholar] [CrossRef] [Green Version]
  9. RehmanZ, U.; Koo, B.H. Effect of Na2SiO3·5H2O concentration on the microstructure and corrosion properties of two-step PEO coatings formed on AZ91alloy. Surf. Coat. Technol. 2017, 317, 117–124. [Google Scholar] [CrossRef]
  10. Kazek-Kesik, A.; Dercz, G.; Kalemba, I.; Suchanek, K.; Kukharenko, A.I.; Korotin, D.M.; Michalska, J.; Krząkała, A.; Piotrowski, J.; Kurmaeve, E.Z.; et al. Surface characterisation of Ti–15Mo alloy modified by a PEO process in various suspensions. Mater. Sci. Eng. C 2014, 39, 259–272. [Google Scholar] [CrossRef]
  11. Weiyi, M.; Yong, H. Study on micro-arc oxidized coatings on magnesium in three different electrolytes. Rare Met. Mater. Eng. 2010, 39, 1129–1134. [Google Scholar] [CrossRef]
  12. Ko, Y.G.; Namgung, S.; Shin, D.H. Correlation between KOH concentration and surface properties of AZ91 magnesium alloy coated by plasma electrolytic oxidation. Surf. Coat. Technol. 2010, 205, 2525–2531. [Google Scholar] [CrossRef]
  13. Rehman, Z.U.; Shin, S.H.; Hussain, I. Structure and corrosion properties of the two-step PEO coatings formed on AZ91DMg alloy in K2ZrF6-based electrolyte solution. Surf. Coat. Technol. 2016, 307, 484–490. [Google Scholar] [CrossRef]
  14. Wang, L.; Chen, L.; Yan, Z.; Wang, H.; Peng, J. The influence of additives on the stability behavior of electrolyte, discharges and PEO films characteristics. J. Alloys Compd. 2010, 493, 445–452. [Google Scholar] [CrossRef]
  15. Li, K.; Li, W.; Zhang, G.; Guo, Z. Preparation of black PEO layers on Al-Si alloy and the colorizing analysis. Vacuum 2015, 111, 131–136. [Google Scholar] [CrossRef]
  16. Bahramian, A.; Raeissi, K.; Hakimizad, A. An investigation of the characteristics of Al2O3/TiO2 PEO nanocomposite coating. Appl. Surf. Sci. 2015, 351, 13–26. [Google Scholar] [CrossRef]
  17. Wang, Y.; Wei, D.; Yu, J.; Di, S. Effects of Al2O3Nano-additive on Performance of Micro-arc Oxidation Coatings Formed on AZ91D Mg Alloy. J. Mater. Sci. Technol. 2014, 30, 984–990. [Google Scholar] [CrossRef]
  18. Fatimah, S.; Kamil, M.P.; Kwon, J.H.; Kaseem, M.; Ko, Y.G.; Kwon, J.H. Dual incorporation of SiO2 and ZrO2 nanoparticles into the oxide layer on 6061 Al alloy via plasma electrolytic oxidation: Coating structure and corrosion properties. J. Alloys Compd. 2017, 707, 358–364. [Google Scholar] [CrossRef]
  19. Mengesha, G.A.; Chu, J.P.; Lou, B.S.; Lee, J.-W. Effects of Processing Parameters on the Corrosion Performance of Plasma Electrolytic Oxidation Grown Oxide on Commercially Pure Aluminum. Metals 2020, 10, 394. [Google Scholar] [CrossRef] [Green Version]
  20. Demirbaş, Ç.; Ayday, A. The influence of Nano-TiO2 and Nano-Al2O3 Particles in Silicate Based Electrolytes on Microstructure and Mechanical Properties of Micro Arc Coated Ti6Al4V Alloy. Mater. Res. 2018, 21, e20180092. [Google Scholar] [CrossRef]
  21. Fu, J.; Li, X.; Johansson, B.; Zhao, J. Improved Finnis-Sinclair potential for vanadium-rich V-Ti-Cr ternary alloys. J. Alloys Compd. 2017, 705, 369–375. [Google Scholar] [CrossRef]
  22. Schuth, S.; Horn, I.; Brüske, A.; Wolff, P.E.; Weyer, S. First vanadium isotope analyses of V-rich minerals by femtosecond laserablation and solution-nebulization MC-ICP-MS. Ore Geol. Rev. 2017, 81, 1271–1286. [Google Scholar] [CrossRef]
  23. Perfilyev, V.; Moshkovich, A.; Lapsker, I.; Laikhtman, A.; Rapoport, L. The effect of vanadium content and temperature on stick–slip phenomena under friction of CrV (x) N coatings. Wear 2013, 307, 44–51. [Google Scholar] [CrossRef]
  24. He, H.; Zan, L.; Zhang, Y. Effects of amorphous V2O5 coating on the electrochemical properties of Li[Li0.2Mn0.54Ni0.13Co0.13]O2 as cathode material for Li-ion batteries. J. Alloys Compd. 2016, 680, 95–104. [Google Scholar] [CrossRef] [Green Version]
  25. Vernardou, D.; Louloudakis, D.; Katsarakis, N.; Koudoumas, E.; Kazadojev, I.I.; O’Brien, S.; Pemble, M.E.; Povey, I.M. Electrochemical evaluation of vanadium pentoxide coatings grown by AACVD. Sol. Energy Mater. Sol. Cells 2015, 143, 601–605. [Google Scholar] [CrossRef]
  26. Lingyun, A.; Ying, M.; Yunpo, L.; Sun, L.; Wang, S.; Wang, Z. Effects of additives, voltage and their interactions on PEO coatings formed on magnesium alloys. Surf. Coat. Technol. 2018, 354, 226–235. [Google Scholar]
  27. Dou, J.; Zhao, Y.; Lu, L.; Gu, G.; Yu, H.; Chen, C. Effect of the second-step voltages on the structural and corrosion properties of silicon-calcium-phosphate (Si-CaP) coatings on Mg-Zn-Ca alloy. R. Soc. Open Sci. 2018, 5, 172410. [Google Scholar] [CrossRef] [Green Version]
  28. Song, G.L.; Atrens, A. Corrosion Mechanisms of Magnesium Alloys. Adv. Eng. Mater. 1999, 1, 11–33. [Google Scholar] [CrossRef]
  29. Song, G. Recent Progress in Corrosion and Protection of Magnesium Alloys. Adv. Eng. Mater. 2005, 7, 563–586. [Google Scholar] [CrossRef]
  30. Altun, H.; Sen, S. Studies on the influence of chloride ion concentration and pH on the corrosion and electrochemical behaviour of AZ63 magnesium alloy. Mater. Des. 2004, 25, 637–643. [Google Scholar] [CrossRef]
  31. Zhao, M.C.; Liu, M.; Song, G.L.; Atrens, A. Influence of pH and chloride ion concentration on the corrosion of Mg alloy ZE41. Corros. Sci. 2008, 50, 3168–3178. [Google Scholar] [CrossRef]
  32. Liang, J.; Srinivasan, P.B.; Blawert, C.; Dietzel, W. Influence of pH on the deterioration of plasma electrolytic oxidation coated AM50 magnesium alloy in NaCl solutions. Corros. Sci. 2010, 52, 540–547. [Google Scholar] [CrossRef] [Green Version]
  33. Ying, M.; Junyan, F.; Yuezhou, M.; Hua, Z.; Wei, G. Comparative study on characterization of corrosion resistance of micro-arc oxidation coatings on magnesium alloys. J. Chin. Soc. Corros. Prot. 2010, 30, 442–447. [Google Scholar]
  34. Sowa, M.; Simka, W. Electrochemical Impedance and Polarization Corrosion Studies of Tantalum Surface Modified by DC Plasma Electrolytic Oxidation. Materials 2018, 11, 545. [Google Scholar] [CrossRef] [Green Version]
  35. Etim, U.J.; Bai, P.; Ullah, R.; Subhan, F.; Yan, Z. Vanadium Contamination of FCC catalyst: Understanding the Destruction and Passivation Mechanisms. Appl. Catal. A Gen. 2018, 555, 108–117. [Google Scholar] [CrossRef]
  36. Akah, A. Application of rare earths in fluid catalytic cracking: A review. J. Rare Earths 2017, 35, 941–956. [Google Scholar] [CrossRef]
  37. Zhang, R.F. Film formation in the second step of micro-arc oxidation on magnesium alloys. Corros. Sci. 2010, 52, 1285–1290. [Google Scholar] [CrossRef]
  38. Kaseem, M.; Choi, K.; Ko, Y.G. A highly compact coating responsible for enhancing corrosion properties of Al-Mg-Si alloy. Mater. Lett. 2017, 196, 316–319. [Google Scholar] [CrossRef]
  39. Hairong, D.; Ying, M.; Sheng, W.; Xiaoxin, Z.; Huixia, G.; Yuan, H. Effect of Growth Rate on Microstructure and Corrosion Resistance of Micro-arc Oxidation Coatings on Magnesium Alloy. Rare Met. Mater. Eng. 2017, 46, 2399–2404. [Google Scholar] [CrossRef]
  40. Mamiya, H.; Onoda, M. Electronic states of vanadium spinels MgV2O4 and ZnV2O4. Solid State Commun. 1995, 95, 217–221. [Google Scholar] [CrossRef]
  41. Kaur, R.; Maitra, T.; Nautiyal, T. Effect of spin–orbit coupling on magnetic and orbital order in MgV2O4. J. Phys. Condens. Matter 2013, 25, 065503. [Google Scholar] [CrossRef] [PubMed] [Green Version]
  42. Xia, S.J.; Yue, R.; Rateick, R.G.; Birss, V.I. Electrochemical Studies of AC/DC Anodized Mg Alloy in NaCl Solution. J. Electrochem. Soc. 2004, 151, B179–B187. [Google Scholar] [CrossRef]
  43. Murphy, O.J.; Bockris, J.O.; Pou, T.E. Chloride ion penetration of passive films on iron. J. Electrochem. Soc. 1983, 130, 1792–1794. [Google Scholar] [CrossRef]
  44. Zhang, B.; Wang, J.; Wu, B.; Guo, X.W.; Wang, Y.J.; Chen, D.; Zhang, Y.C.; Du, K.; Oguzie, E.E.; Ma, X.L. Unmasking chloride attack on the passive filmof metals. Nat. Commun. 2018, 9, 2559. [Google Scholar] [CrossRef]
Figure 1. The device for spotting tests.
Metals 10 01146 g001
Figure 2. Macro images of micro-arc oxidation (MAO) samples with different V2O5 contents: 0 g/L (a,e), 0.2 g/L (b,f), 0.5 g/L (c,g), and 0.8 g/L (d,h); under different loading voltages: 380 V (ad) and 480 V (eh).
Metals 10 01146 g002
Figure 3. Surface morphologies and distribution of micro pores of MAO coatings under 380 V in different V2O5 contents: 0 g/L (a,a’),0.2 g/L (b,b’), 0.5 g/L (c,c’), and 0.8 g/L (d,d’).
Metals 10 01146 g003
Figure 4. Surface morphologies and distribution of micro pores of MAO coatings under 480 V in different V2O5 contents: 0 g/L(a,a’),0.2 g/L (b,b’), 0.5 g/L(c,c’),and 0.8 g/L(d,d’).
Metals 10 01146 g004
Figure 5. Statistical data of the surface porosity of MAO coatings with different V2O5 contents.
Metals 10 01146 g005
Figure 6. Map scanning analysis of cross-section of MAO coating processed with 0.8 g/L V2O5 under 480 V: (a) SE1; (b) Mg; (c) Al; (d) Zn; (e) O; (f) Si; (g) F; (h) V.
Metals 10 01146 g006
Figure 7. XRD patterns of MAO coatings prepared under 480 V with (a) 0.8 g/L and (b) 0 g/L V2O5.
Metals 10 01146 g007
Figure 8. Effect of V2O5 on thickness and spotting corrosion resistances of coatings.
Metals 10 01146 g008
Figure 9. Potentiodynamic polarization (PDP) curves measured on MAO coated samples fabricated under different loading voltages with different V2O5 contents: (a) 380 V, (b) 480 V.
Metals 10 01146 g009
Figure 10. Scatter plot with the best correlations for surface porosity and corrosion current density data.
Metals 10 01146 g010
Table 1. The pH values and conductivity of the electrolytes.
Electrolyte0 g/L V2O50.2 g/L V2O50.5 g/L V2O50.8 g/L V2O5
pH12.3412.2912.2012.09
Conductivity/mS·cm−125.024.223.322.6
Table 2. EDS results of MAO coating processed with 0.8 g/L V2O5under 480 V.
ElementMgAlZnOSiFV
Wt%68.849.582.0011.453.663.700.78
At%66.278.310.7216.753.054.560.36
Table 3. Derived results from polarization curves shown in Figure 9.
ParameterEcorr/mVJcorr/A·cm−2RP/kΩ·cm2
AZ91D Substrate−1541 ± 12(3.091 ± 1.53) × 10−5(7.093 ± 0.34) × 102
380 V0 g/L−1453 ± 23(1.728 ± 0.95) × 10−6(1.499 ± 0.21) × 104
0.2 g/L−1492 ± 6(2.129 ± 0.84) × 10−7(1.989 ± 1.18) × 105
0.5 g/L−1590 ± 14(7.386 ± 1.91) × 10−7(6.187 ± 1.49) × 104
0.8 g/L−1559 ± 15(7.967 ± 2.33) × 10−7(5.592 ± 1.52) × 104
480 V0 g/L−1532 ± 18(2.857 ± 0.27) × 10−6(1.421 ± 0.62) × 104
0.2 g/L−1526 ± 17(9.215 ± 2.65) × 10−7(4.313 ± 1.87) × 104
0.5 g/L−1527 ± 21(9.976 ± 1.76) × 10−7(4.416 ± 1.36) × 104
0.8 g/L−1571 ± 9(5.862 ± 0.79) × 10−7(7.252 ± 0.29) × 104

