Article

Numerical Analysis of Effect of Initial Bubble Size on Captured Bubble Distribution in Steel Continuous Casting Using Euler-Lagrange Approach Considering Bubble Coalescence and Breakup

1
School of Metallurgy, Northeastern University, Shenyang 110819, China
2
State Key Laboratory of Rolling and Automation, Northeastern University, Shenyang 110819, China
*
Authors to whom correspondence should be addressed.
Metals 2020, 10(9), 1160; https://doi.org/10.3390/met10091160
Submission received: 23 July 2020 / Revised: 24 August 2020 / Accepted: 25 August 2020 / Published: 27 August 2020

Abstract

:
A mathematic model considering the bubble coalescence and breakup using the Euler-Lagrange approach has been developed to study the effect of the initial bubble size on the distribution of bubbles captured by the solidification shell. A hard sphere model was applied for dealing with the bubble collision. Advanced bubble coalescence and breakup models suitable for the continuous casting system and an advanced bubble captured criteria have been identified established with the help of user-defined functions of FLUENT. The predictions of bubble behavior and captured bubble distribution agree with the water model and plant measurements well respectively. The results show that the number of small bubbles captured by solidification shell is much higher than that of large bubbles. What is more, the number of captured bubbles at the sidewalls decreases with the distance from the meniscus. For the case of large gas flow rate (gas flow fraction of 8.2%), the initial size of bubbles has little effect on bubble captured distribution under various casting speeds. When the gas flow rate is small (gas flow fraction of 4.1%), the number density of captured bubbles increases as the initial bubble size increases, and the effect of initial bubbles size on captured bubble number density is amplified when the casting speed decreases. The average captured bubble diameter is about 0.12–0.14 mm. Additionally, for all cases, the initial bubble size hardly affects the average size of captured bubbles.

1. Introduction

The bubbles captured by the solidifying steel shell during the continuous casting process are the main cause of defects of blisters and slivers in the slab. Argon gas is usually injected from the submerged entry nozzle (SEN) to withstand nozzle clogging [1,2]. The transport of argon bubbles has a great effect on the product quality. The bubbles escaping at the slag layer, while not casting the slag entrapment, are helpful for removing the inclusions by attaching them to the slag, which is good for the slab quality. However, the bubbles captured near the meniscus cause surface defects, and those captured deep in the mold result internal defects, which is harmful for the slab quality [3].
Argon gas is injected through the porous refractory at the upper part of the SEN wall. The initial size of argon bubble is affected by the refractory properties, gas flow rate and fluid velocity [4]. After entering the mold, both the evolution and redistribution of bubbles have great impact on the fluid flow and product quality. Due to the high temperature and invisibility, it is difficult to study the bubble motion in the actual continuous casting process. Many water model experiments have been conducted to investigate the bubble behaviors in the mold [5,6,7,8,9]. Mathematical simulation is another choice, which was extensively adopted [10,11,12,13,14]. However, there are still challenges in the numerical simulation due to the complexity and lack of reliable theory of the bubble behaviors. Early mathematical simulations of bubble motion in the mold ignored the bubble coalescence and breakup, which results in the difference between the simulation results and reality. With the development of population balance model (PBM), much research has considered the bubble interaction using the Euler-Euler method [7,15,16,17]. This method needs lower computational demand, but can not get the information of individual information [18]. There is still little research considering the bubble interaction in the mold with a Euler-Lagrange method [19,20,21]. Recent years, some papers simulate the bubble transport in the mold considering the bubble interaction in the mold using the Euler-Lagrange method [22,23]. However, the coalescence and breakup models have too many assumptions. Most research gets the well known conclusion that large bubbles tend to escape at the top surface, while small bubbles tend to arrive at the side wall and depth of the mold.
Next, the small bubbles approaching the solidification front may be captured or pushed back to the flow [24]. To simulate the bubble capture by the solidifying shell, a reasonable capture criterion is needed. Recently, an advanced captured criterion based on the local force balance between the bubble and the solidification front was proposed [25,26]. For analyzing the information of entrapped bubbles, such as size, location and number density, the Euler-Lagrange method is necessary. Many papers have studied the motion of particles or bubbles transport in the mold and the capture by a solidification shell [20,21,24,26,27,28]. However, in those research, the change of bubbles size due to the bubble collision and breakup in the molten steel flow was neglected, so it can be only analyzed qualitatively the removal rate of each size bubble with a fixed particle number. However, the number of each bubble size will change after coalescence and breakup and is affected with different operation conditions. For example, various casting speeds (usually ranging from 1 to 1.7 m/min) cause various dissipation rates in the system, which in turn affects the bubble breakup, and different gas flow rates (usually gas flow fraction of 3–10%) cause different bubble sizes and a bubble number affecting the bubble coalescence and breakup in the continuous casting process. So, for the quantitative analysis of bubble entrapment in the actual continuous casting process, the bubble coalescence and breakup must be considered.
What is more, the initial bubble size is an important parameter to determine the bubble secondary distribution in the mold and affects the bubble captured by the solidification shell. Lee et al. [4] studied the effect of operation conditions on initial bubble formation by the water model, and the results showed that the initial bubble size ranges from 1 to 2.5 mm. Some papers investigated the effect of initial bubble size on the bubble transport by mathematical simulation. However, the bubble coalescence and breakup were ignored in those papers, and it was only qualitative analyzed the particle motion and the remove fraction of each fixed size [26,27,28]. Few researchers have investigated the effect of initial bubble size on the bubble captured by the solidification shell considering bubble coalescence and breakup.
The purpose of the work is to establish a mathematic model considering bubble coalescence and breakup using the Euler-Lagrange approach to analyze the bubble motion in the mold and bubble captured by the solidification shell. The location, size and number density of entrapment bubbles were considered in the present paper. In addition, the effect of the initial bubble size under different operation conditions on captured bubble distribution was studied.

2. Computational Models

2.1. Governing Equations

A Euler-Lagrange model is necessary to get the information of bubbles captured by the solidification shell. The model of bubble motion and size history, written in C language, is treated in a Lagrangian way, according to the Newton’s Second Law. The effect of the discrete phase volume on the continuous phase is considered in the model, which is neglected in the DPM (Discrete Phase Model). The collision of bubbles is modeled by means of the hard sphere model. The liquid phase is solved with the commercial package FLUENT 18.1 (ANSYS Inc., Canonsburg, PA, USA, www.ansys.com). The coupling between two phases is realized by computing the liquid phase volume of each grid and adding interfacial forces as a source term, with the help of extensive user-defined functions of FLUENT. The governing equations of two-phase are summarized in Table 1.

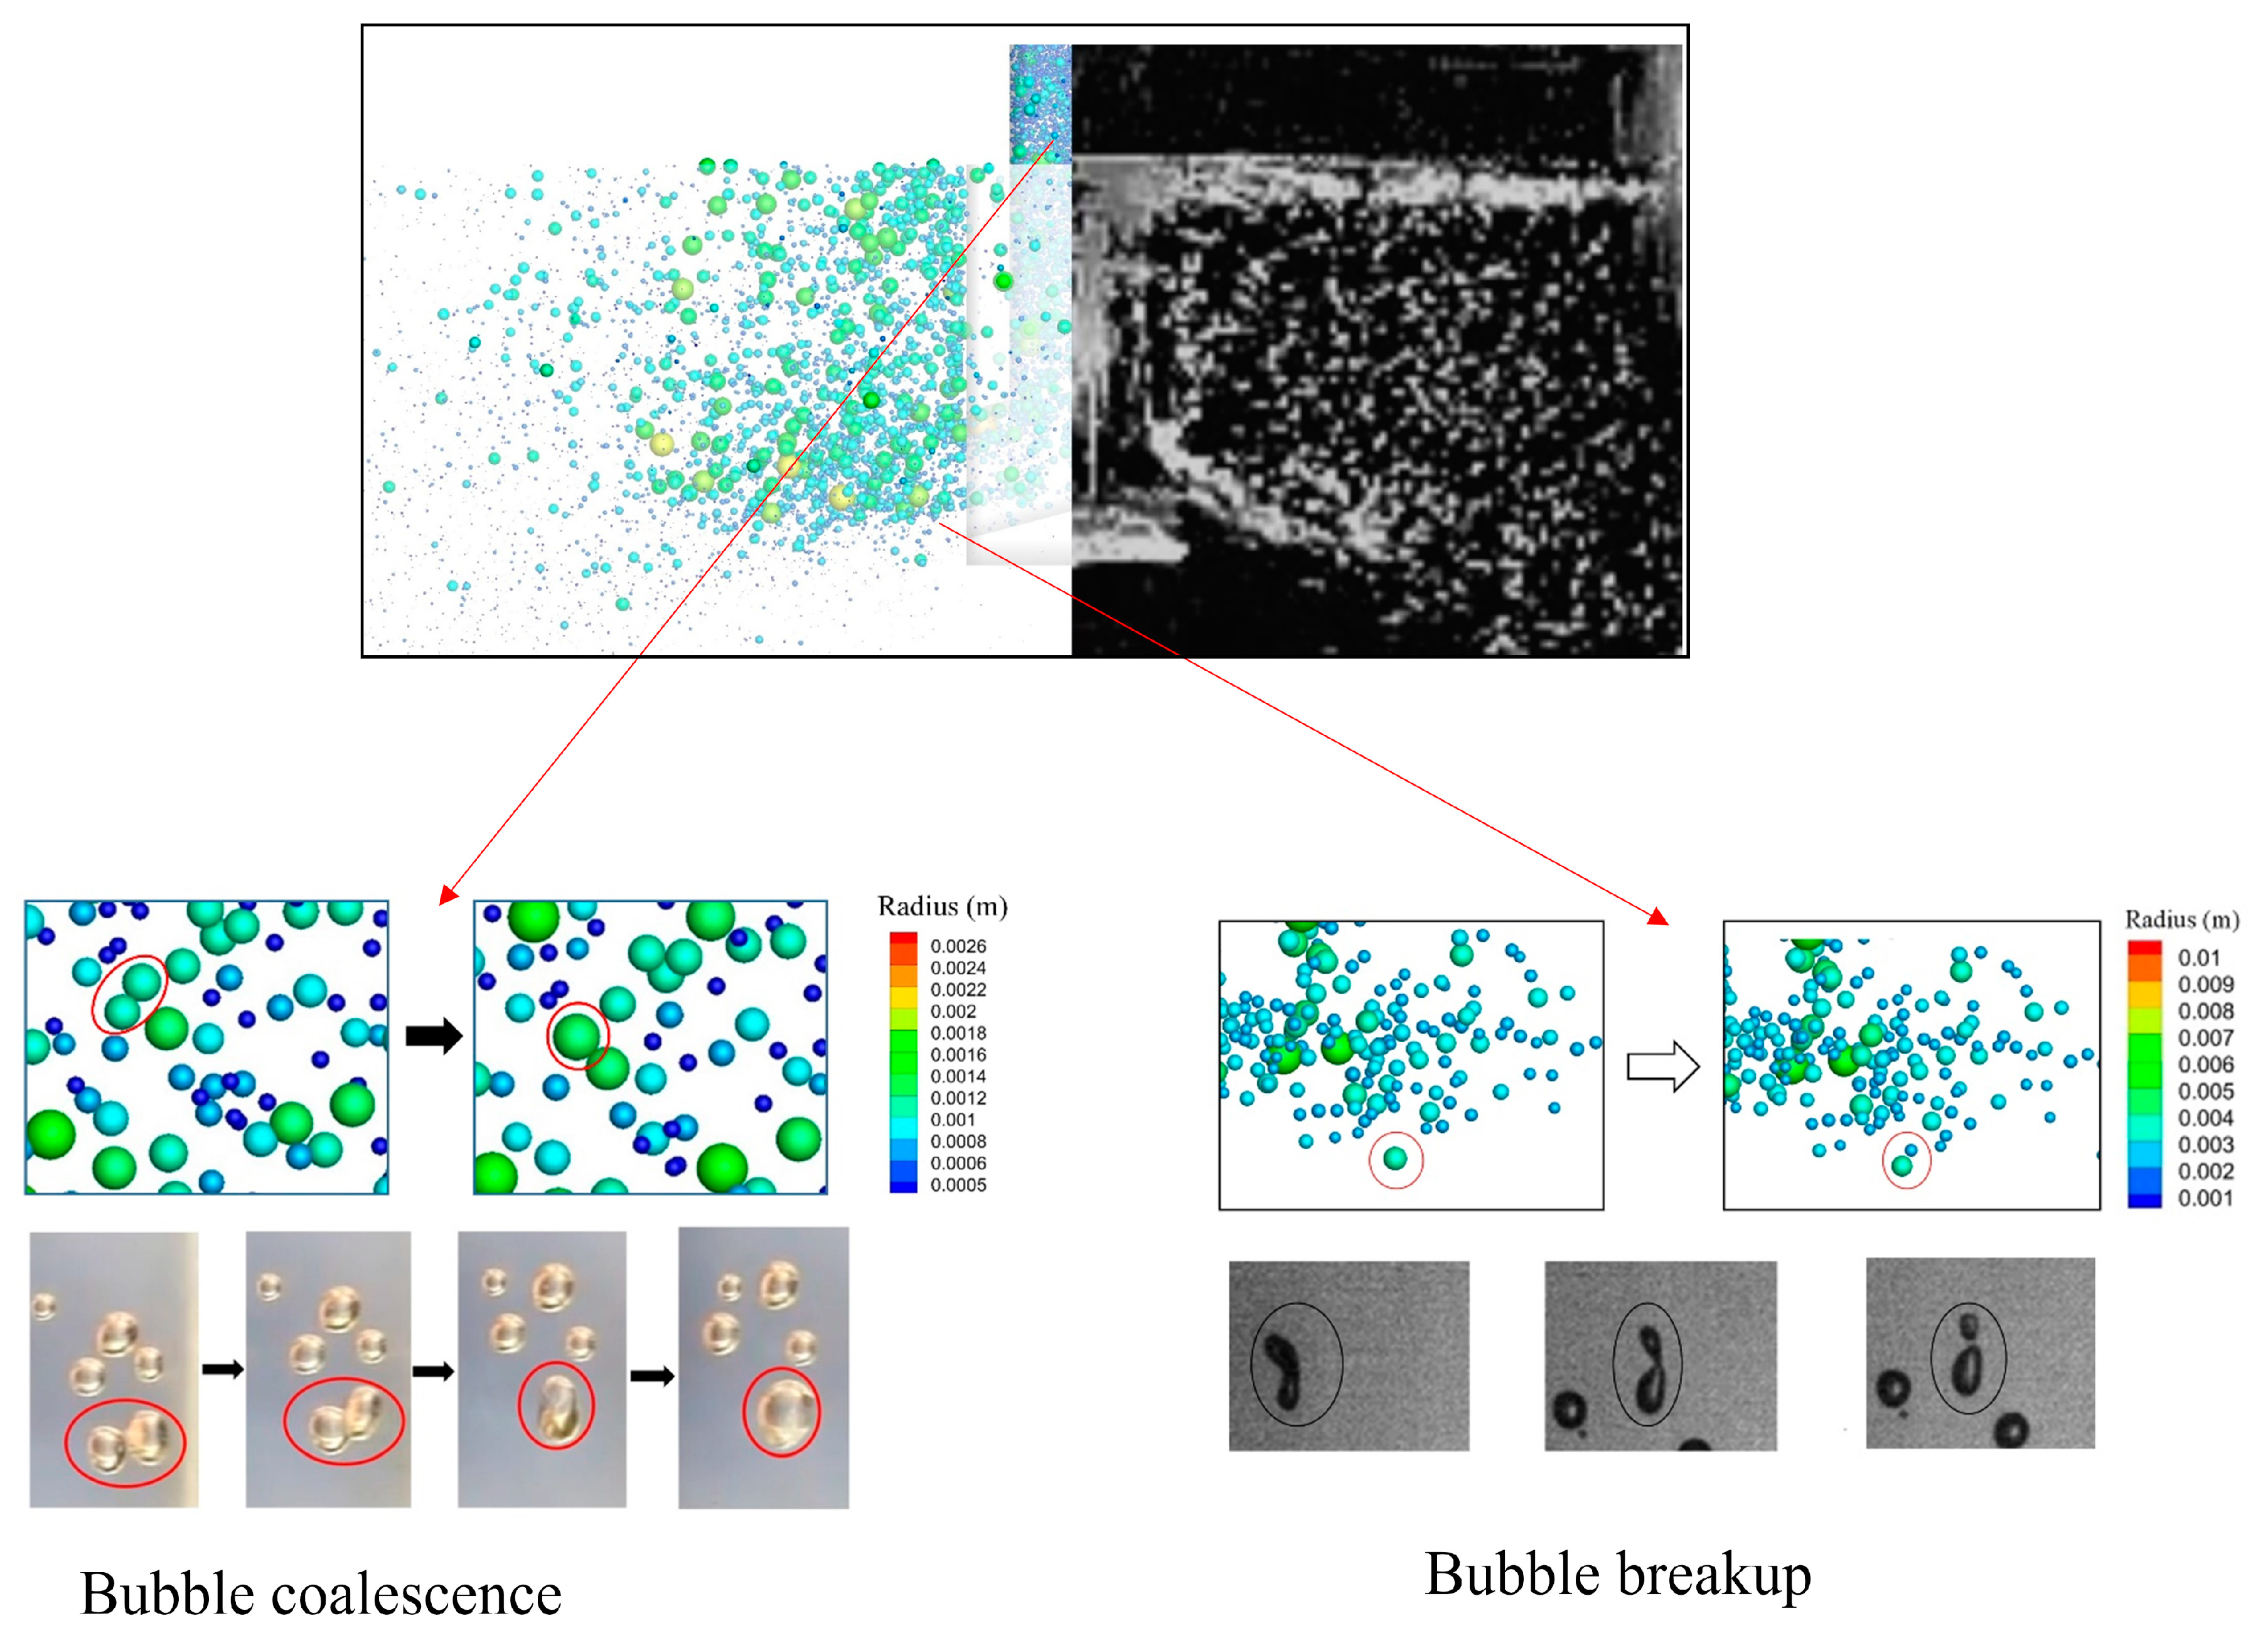
2.2. Bubble Coalescence Model

In the present work, the bubble collision was resolved by the hard sphere model. By integrating the works of Yang et al. [29,30], a bubble coalescence model considering the bubbles size and off-center degree was used in the present work to determine if the bubble collision will result in coalescence or not. With the equivalent diameter of two collision bubbles smaller than 2.3 mm, bubbles coalesce when W e ( 1 B 2 ) < 0.16 + B / 24
W e = r e v r 2 ρ l σ
where We is the relative Weber number; re = 2r1r2/(r1 + r2) is the equivalent radius of two interacting bubbles and vr is the relative velocity of bubbles.
B = b r 1 + r 2
where B is the dimensionless number characterizing the off-center degree. Where r1 and r2 are the radii of the two bubbles and b is the distance from the center of the one bubble to the relative velocity vector originating from the center of the other bubble at contact.
With the equivalent diameter of two collision bubbles larger than 2.3 mm, two collision bubbles result in coalescence if the relative approach velocity exceeds 0.11 m/s [31,32].

2.3. Bubble Breakup Model

The bubble breakup model used in the present work is the model proposed by Yang et al. [30]. In the turbulent two-phase flow, a bubble breaks up into two daughter bubbles if the uneven pressure acting on the bubble surface larger than the surface force [33]. The breakup of the bubble occurs if the bubbles exceed a maximum stable size, dmax.
d max = W e crit 3 / 5 σ 3 / 5 ρ l 3 / 5 ε 2 / 5
where W e crit is the critical Weber number for bubble break-up with a value of 0.53; ε is the turbulent kinetic energy dissipation rate and σ is the gas–liquid surface tension. Besides the bubble breakup criteria, the volume fraction of the daughter bubble is the other essential parameter. According to the work of Yang et al. [30], the volume fraction of daughter bubble suit for the tanh function, following the U-shape of daughter size distribution, in the steel continuous casting system.
f bv = 1 2 [ 1 + tan h ( 14.4 x 7.2 ) ]
where f bv is the volume fraction of daughter bubble and x is a random variable from 0 to 1.

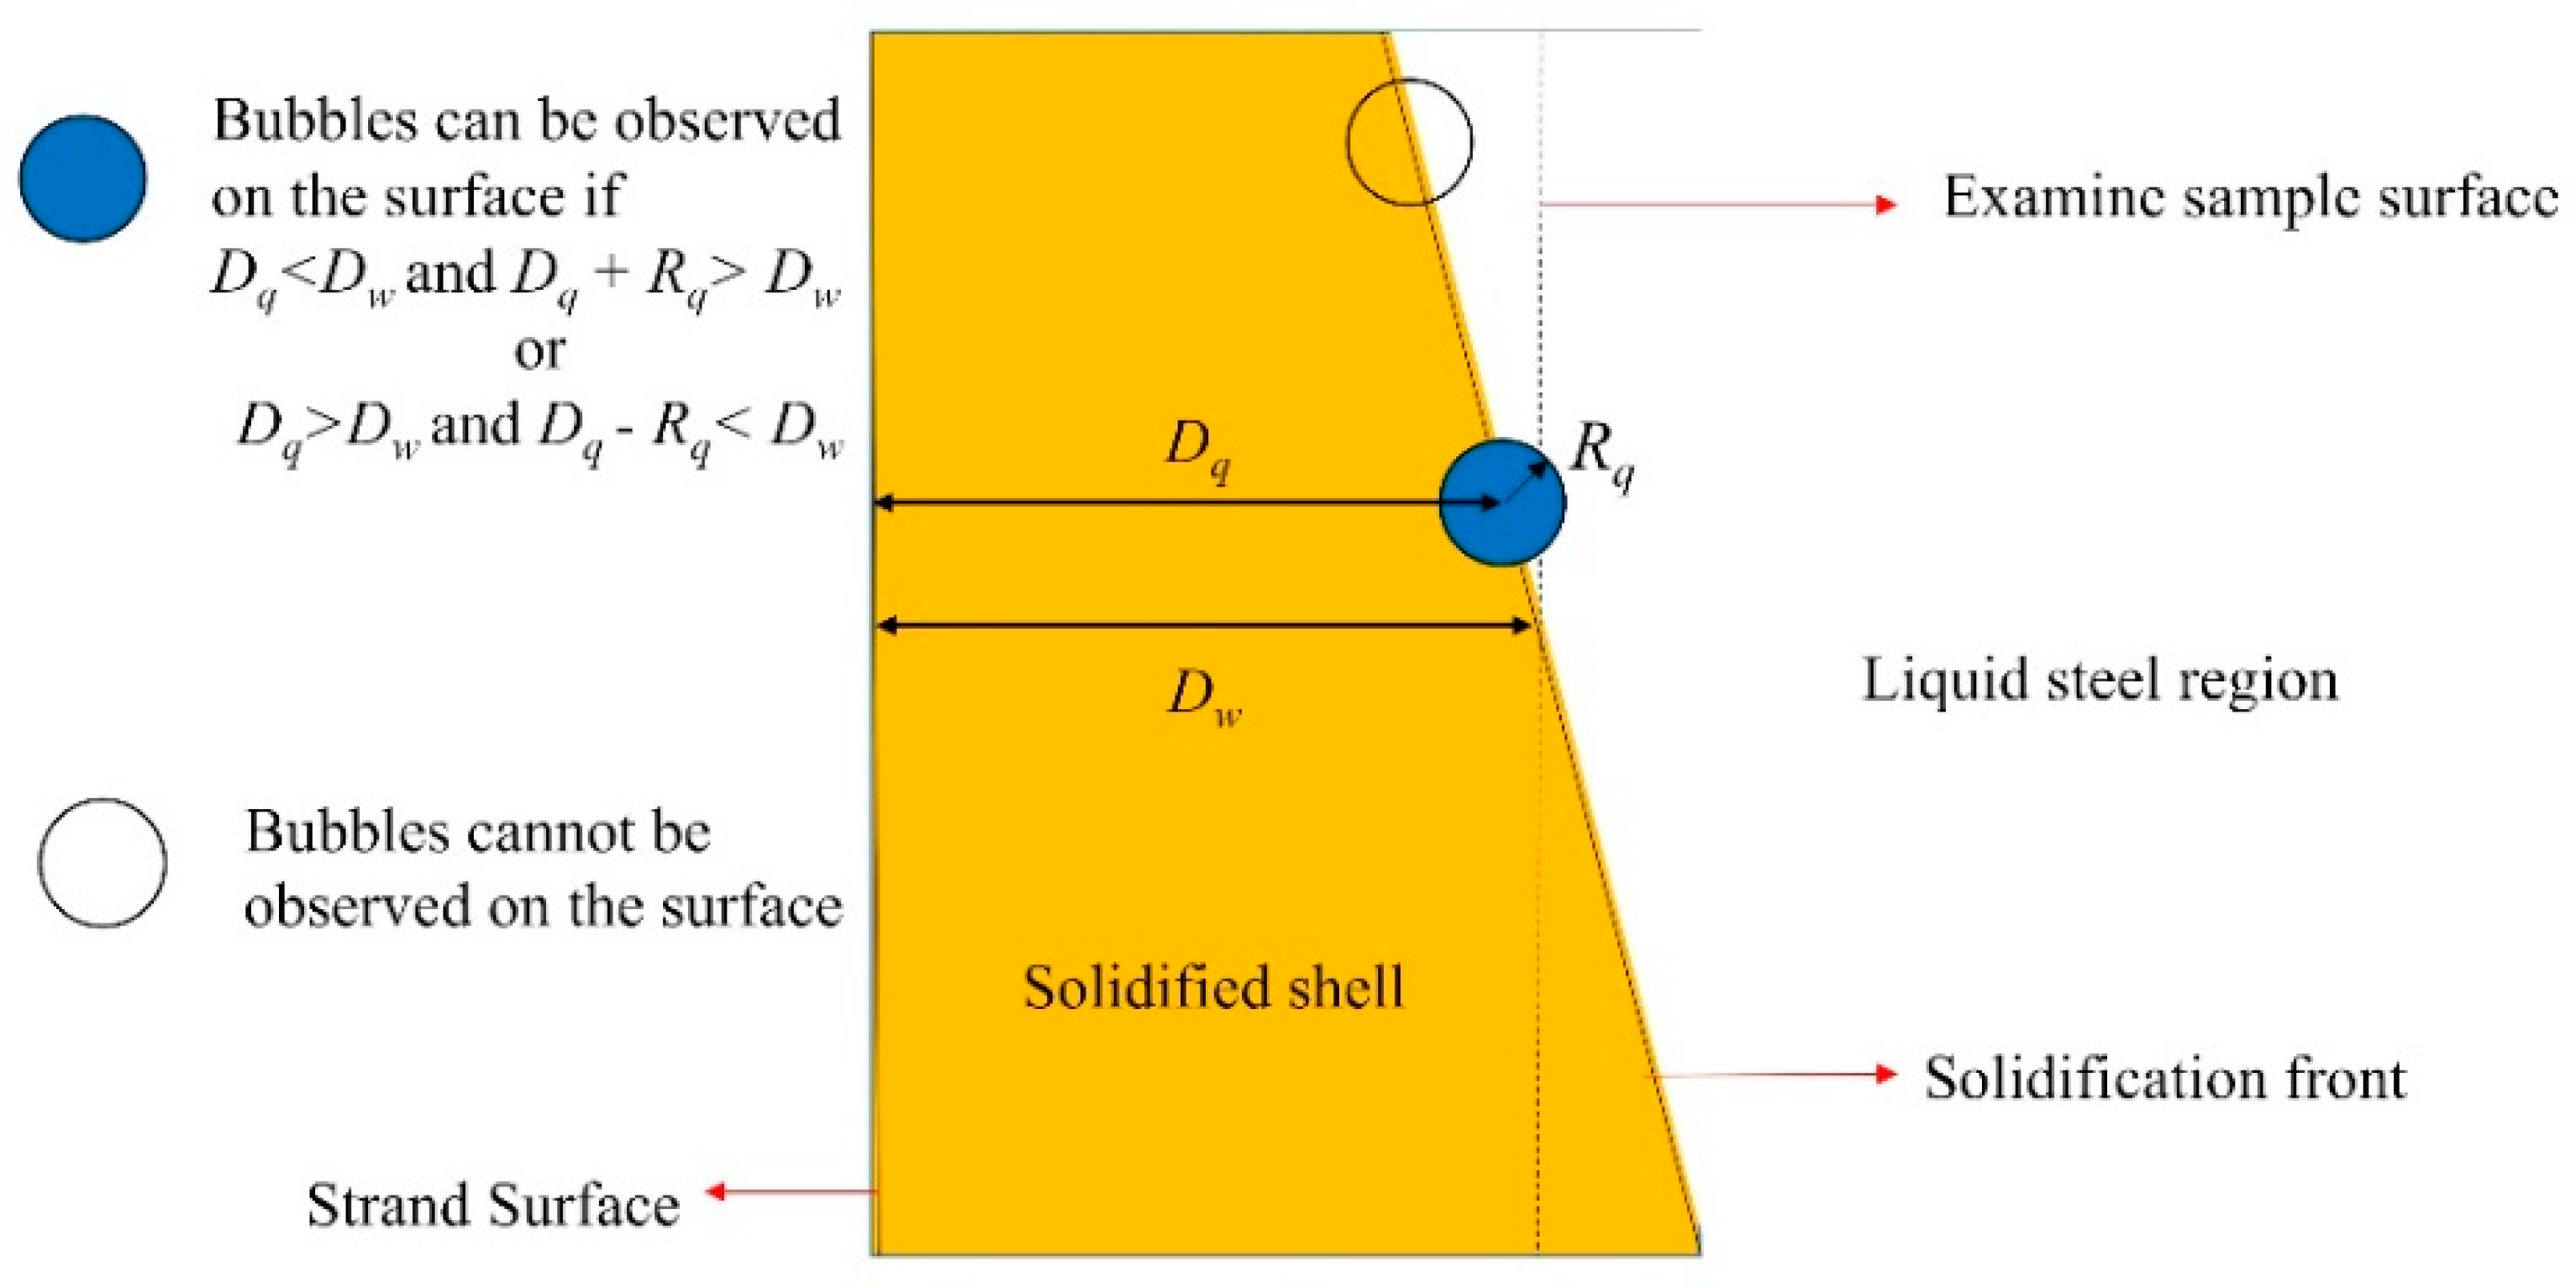
2.4. Bubble Capture Model and Predict Sample Observations

The bubble capture model as proposed by Yuan and Thomas [25,26,28] was used in the present work. This model considers the effect of PDAS (primary dendrite arm spacing), bubble size and local flow field. If the diameters of bubbles are smaller than the PDAS, the bubbles will be captured when touching the solidification shell. When the bubbles are larger than PDAS, the force balance is considered to determine if bubbles are captured by the solidification shell when the local flow velocity changes. Besides the forces introduced in the previous section, three additional forces, including the lubrication force F lub , surface tension gradient force F Grad and Van der Waals force F IV , were exerted on the captured result.
F lub = 6 π u sol R b 2 h t ( r d r d + R b ) 2
where R b is the bubble radius; u sol is the solidification front moving velocity and the details about it can be found elsewhere; h t is the thickness between the bubble and dendrite tip and r d is the radius of dendrite tip.
F Grad = m β π R b ξ 2 { ( ξ 2 R b 2 ) β ln [ ( ξ + R b ) [ α ( ξ R b ) + β ] ( ξ R b ) [ α ( ξ + R b ) + β ] ] + 2 R b α β α 2 ln [ α ( ξ + R b ) + β α ( ξ R b ) + β ] }
where α = 1 + n C 0 , β = ( C C 0 ) n r d , ξ = R b + + r d + h o and m, n, C 0 and C are the model parameters, which are given in the previous work.
F IV = 2 π ( σ sb σ sl σ bl ) r d R b r d + R b a o 2 h t 2
a o is the steel atomic diameter, σ sb , σ sl and σ bl represent surface tensions for solid–bubble, solid–liquid and bubble–liquid respectively.
For comparing with plant measurement, it is essential to determine which layer of product steel the bubbles appear on. Whether the captured bubble q with radius Rq at the distance Dq beneath the casting product surface can be found in the examined layer of the sample w at the distance Dw beneath the surface of test sample is shown in Figure 1. The solidification shell thickness is determined by s = 3 t [28]. The solidification time t is calculated as t = L / v c = 40 L , where L is the length beneath the meniscus and vc is the casting speed. So, D q = S | L q = 3 40 L q , where L q is the distance between the entrapped bubble q and the meniscus.

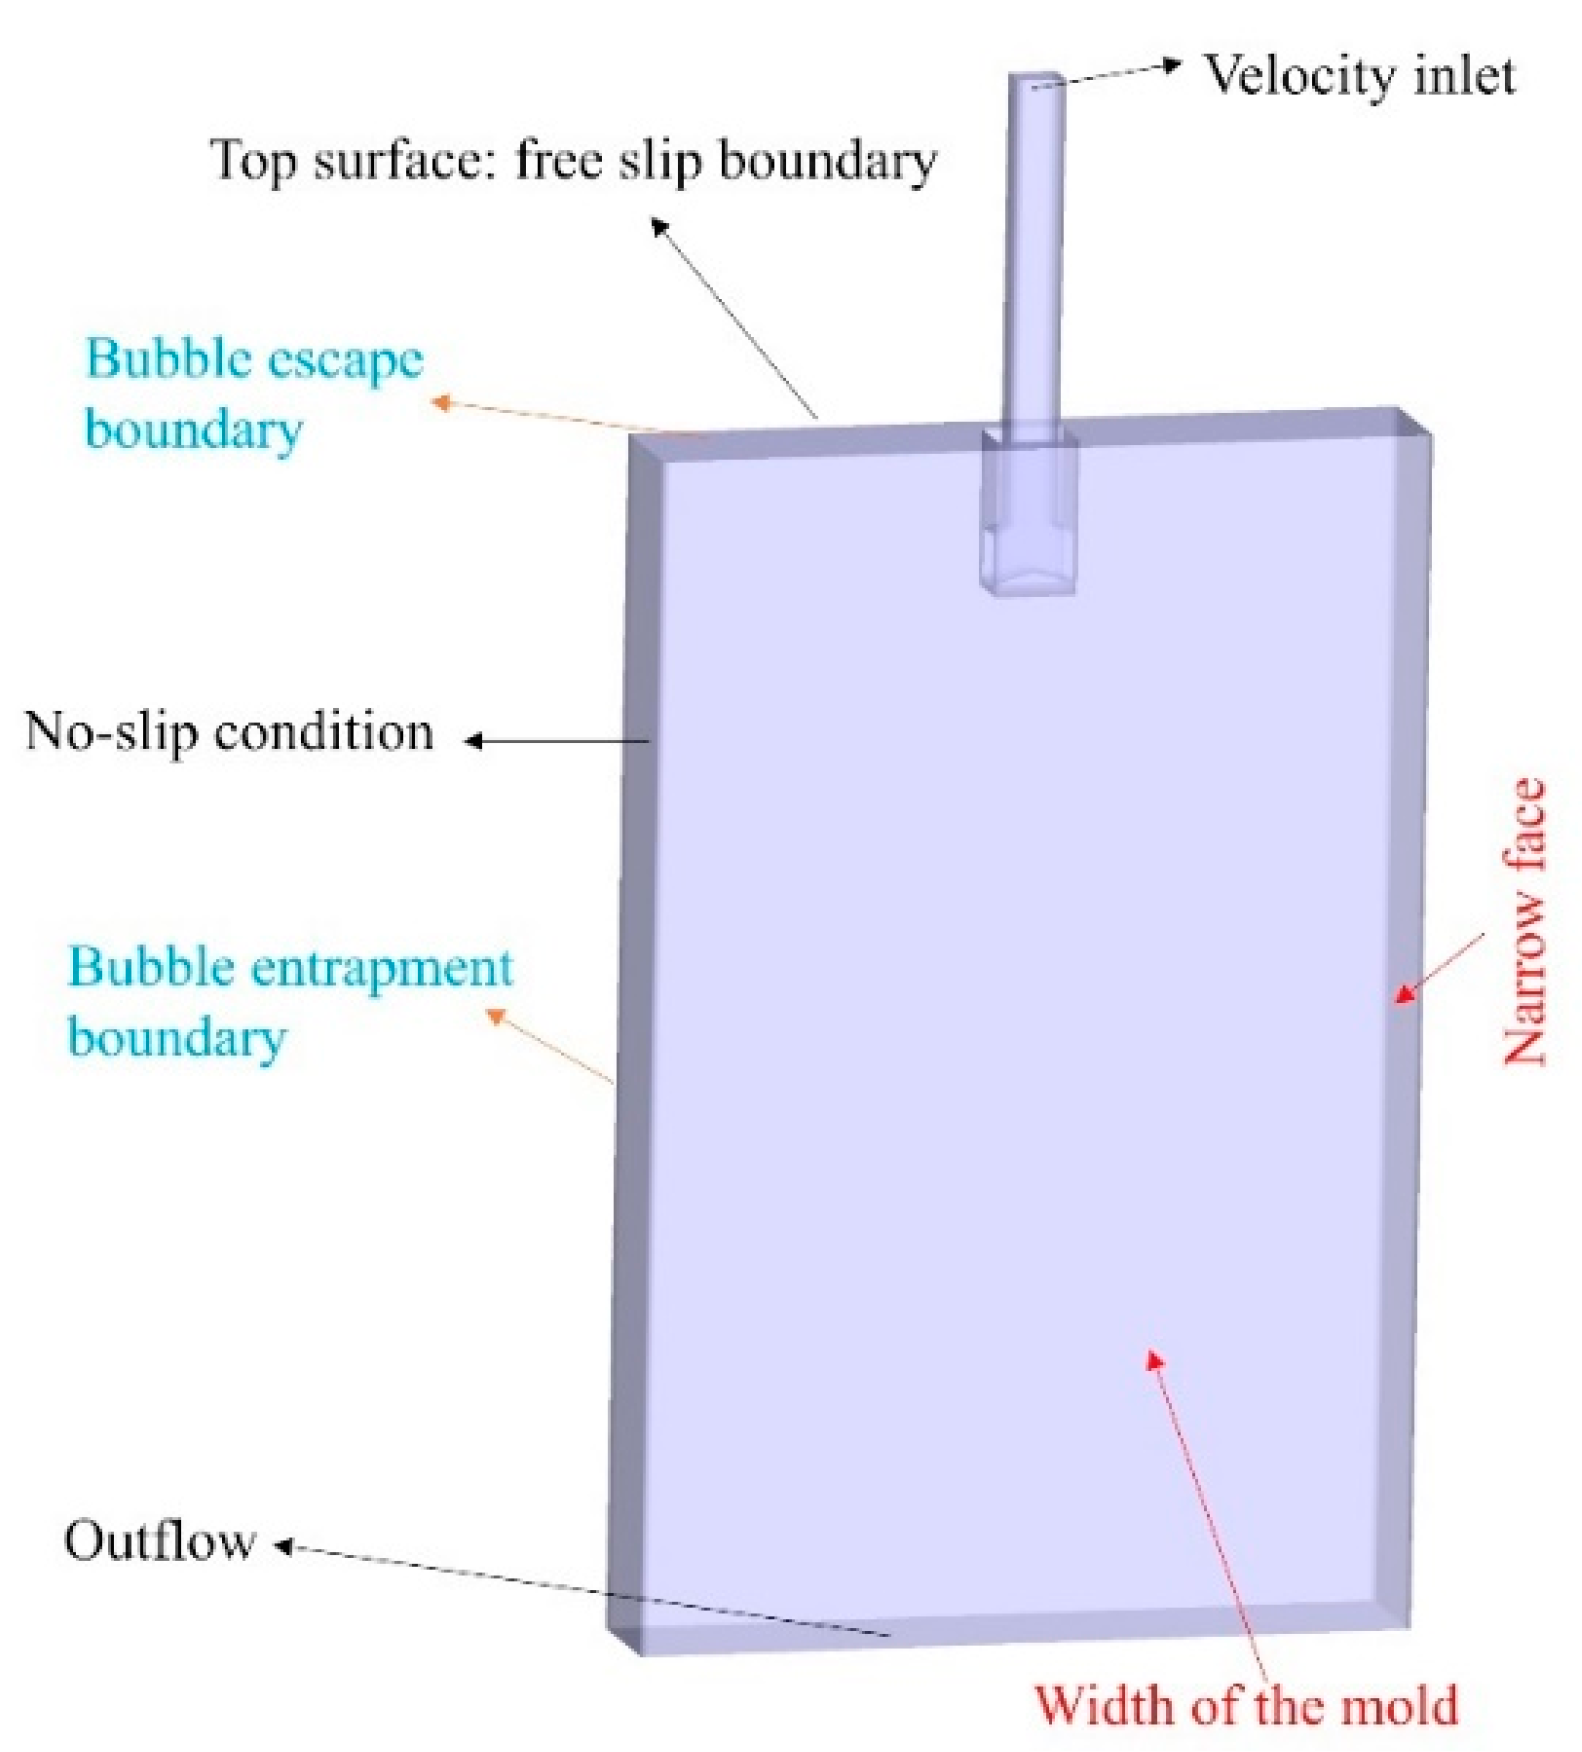
2.5. Numerical Implementation

To quantitatively validate the mathematic model, the benchmark case in the paper of Jin et al. [28] was built. The computational domain and boundary conditions are shown in Figure 2. Table 2 presents the geometry parameters and operation conditions. The liquid phase flow field was solved with the commercial package FLUENT. The model of bubble was written by C. The couple between two phases was realized by computing the liquid phase volume of each grid and adding interfacial forces as a source term, with the help of extensive user-defined functions of FLUENT. The time step was set as 0.001 s, and the total simulation time was 60 s. The bubbles were assumed as spheres with the initial diameter ranging from 1 to 2 mm at this operation condition, based on Lee et al. [4].

3. Model Validation

3.1. Bubble Distribution

The bubble distribution in the mold from the computation model was compared with a simple water model results in Figure 3. From Figure 3, it can be noticed that the entire bubble distribution from the computation model agreed qualitatively well with the water model. Most of the bubbles floated up near the SEN due to the buoyancy, while smaller bubbles got to the further location following with the liquid flow. Due to the introduction of bubble interaction, the bubble size distribution was controlled by the bubble coalescence and breakup. In the submerged entry nozzle, the bubble was small at the initial size and the number of bubble was large, so a lot of bubbles coalesced to larger ones, as shown in Figure 3. At the location near the SEN ports, due to the high turbulent stress, and the large bubble size causing by amounts of coalescence of bubbles in the SEN, a lot of bubbles broke up, as shown in Figure 3. It can be noticed that the bubble distribution and bubble interaction agreed well in the mold with the experiments results. However, there were more bubbles at the top surface in the water model than the simulation results. The bubbles that got to the gas–liquid interface would stay for a while in the water model resulting in the aggregation of bubbles, but the bubbles that get to the interface will be removed immediately by the program setting in the mathematic simulation.

3.2. Comparison of Bubbles Captured in Samples

For validating the computation result, the measurement of samples with six layers examined on each by Jin et al. [4], shown in Figure 4a, were compared with the computation results. For the plant measurements, the part above the examining layer was milled away, and then an optical microscope was used to record the bubble diameter and number of the examining layer [4]. Figure 4b,c shows comparison of bubble number density and mean diameter between the simulation and measurement at the wide face. It can be seen that the computation simulation predicted 0.1–0.2 bubble per cm2 on the first four layers at the wide face, which matched the measurements of the sample well. On the fifth and sixth layers, there were less than 0.05 bubble per cm2. The bubbles in these two layers were entrapped at the downward recirculation region, where only a few small bubbles could reach. Figure 4c shows the average bubble diameter at the wide face. The simulation result shows that the average bubble diameter slightly decreased and the distance beneath the surface was 0.1–0.15 mm, which also matched the measurement. Figure 4d,e shows the bubble number density and the bubble diameter of simulation and measurement at the narrow face. The size and number of bubbles captured at the narrow was similar with the wide face, and the simulation results matched the measurements.

4. Results and Discussion

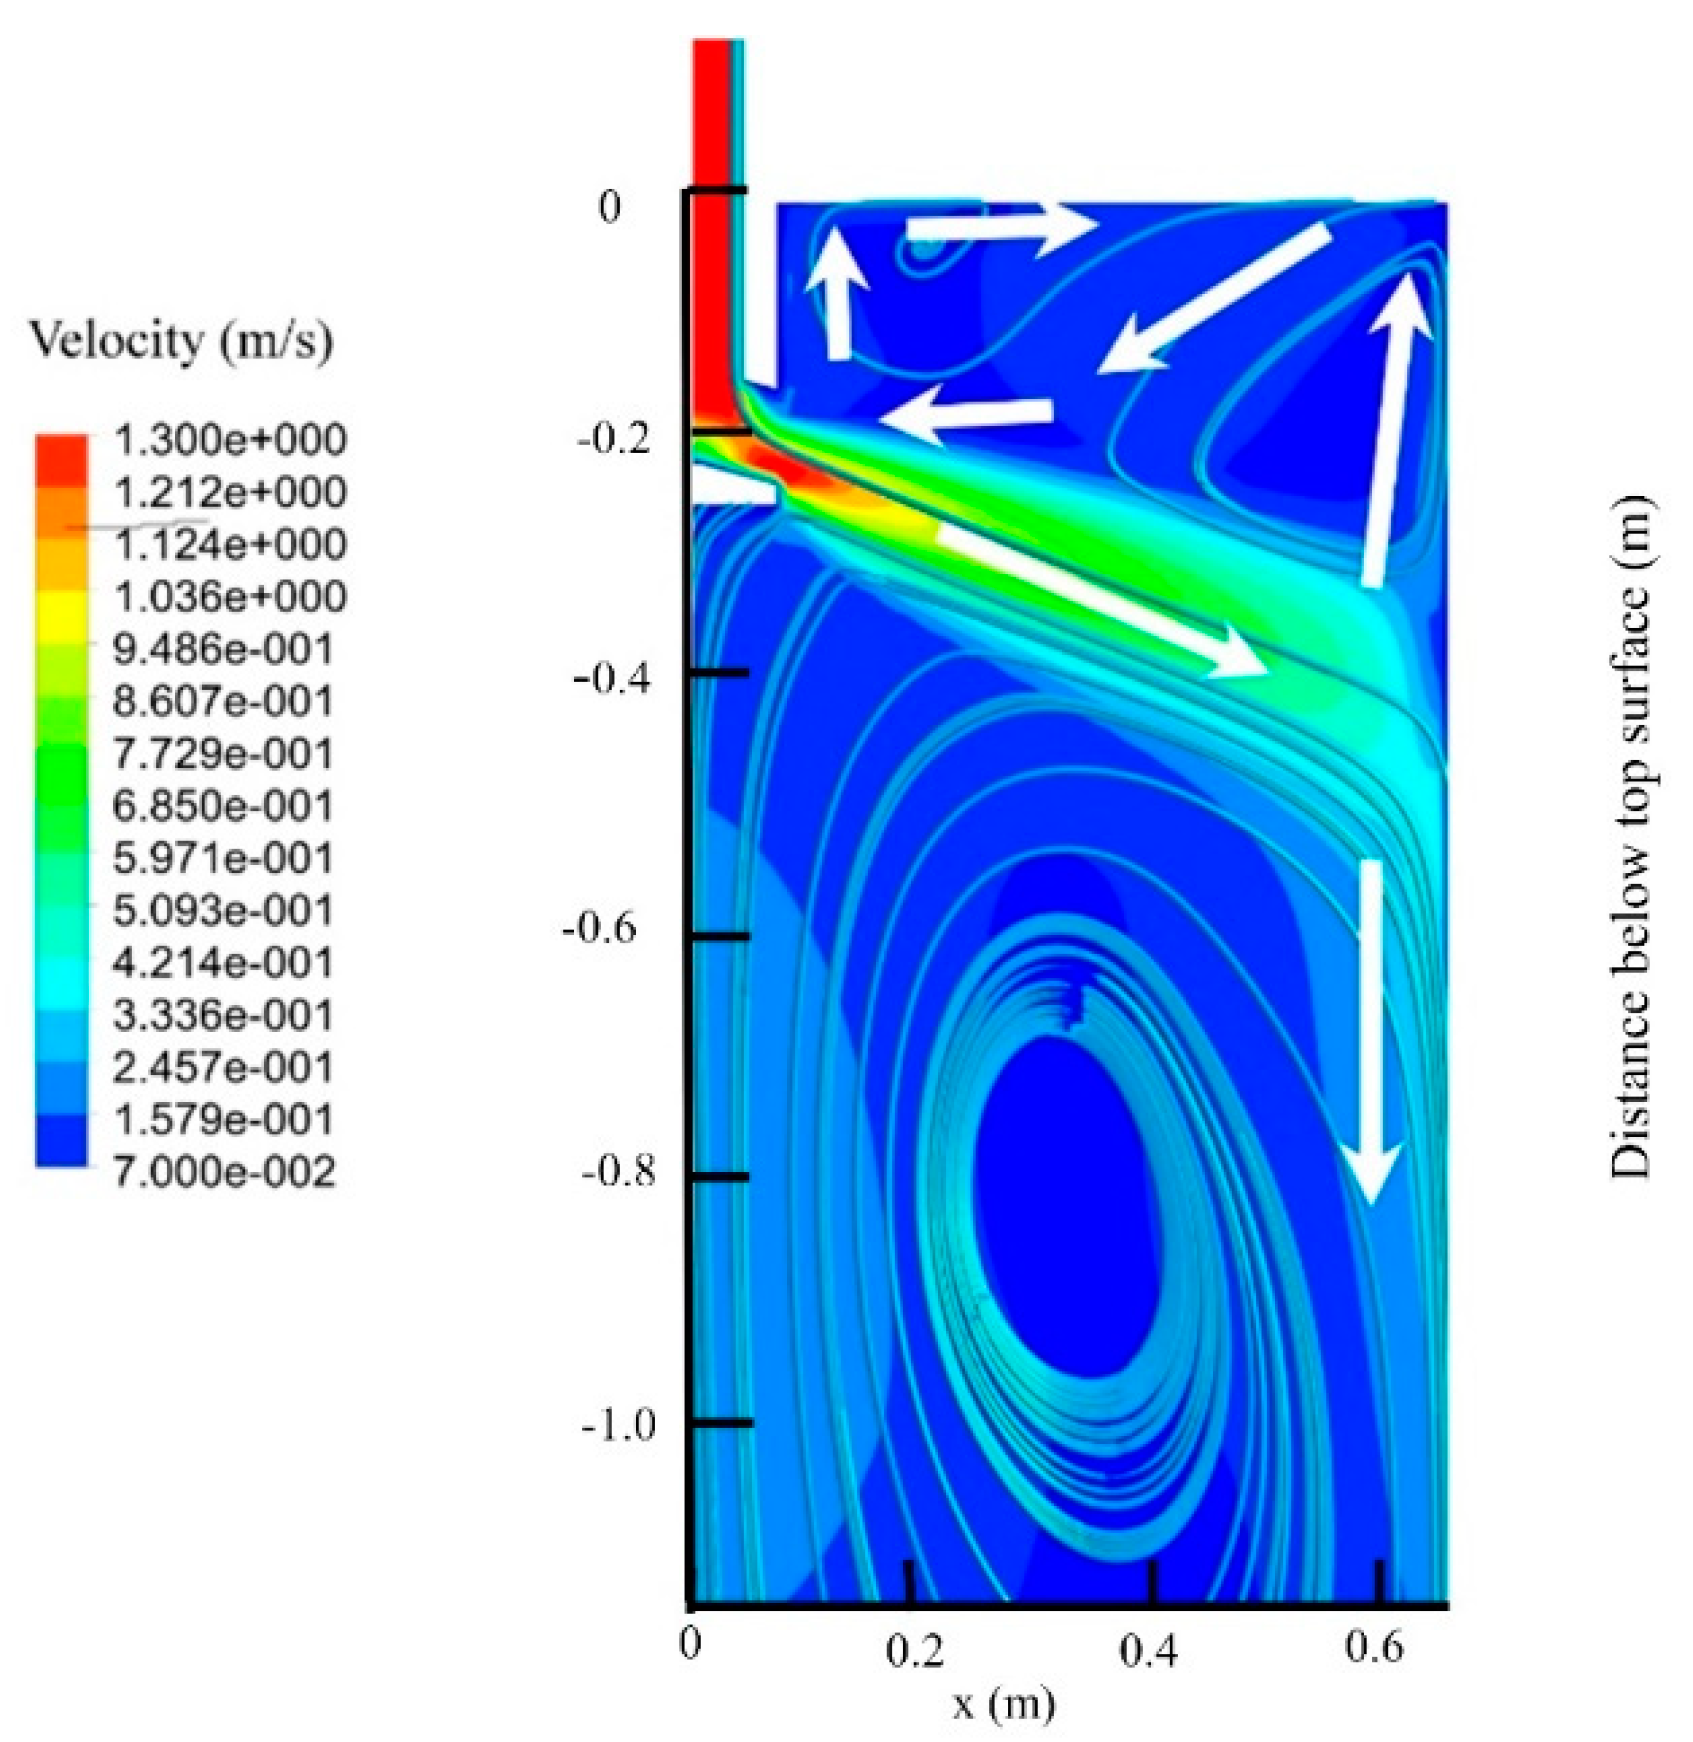
4.1. Two-Phase Flow in the Mold

Figure 5 shows the fluid velocity counter and vector in the mold at the center cross-sectional plane. It can be seen that two jet flows were in the upper recirculation region. One jet flow impacted into the narrow face, and then it branched into an upper and a down flows. The other jet flow got to the top surface after out of the port, which was driven by the bubble buoyancy.
Figure 6 shows the whole instantaneous bubble distribution in the continuous casting mold after 25 s. In Figure 6, the bubble size is presented with color for a better visualization of the small bubbles. It can be noticed that the large bubbles (green color) floated up to the top surface close to the SEN. Additionally, only the bubbles (blue color) smaller than 1 mm could get to the narrow face and the deep of the mold, with the reason that the effect of drag force on the small bubbles was greater than that of buoyancy. Most of the bubbles captured by the solidification shell were these small bubbles.

4.2. Distribution of Bubble Captured Location

The bubble captured locations at the narrow and wide faces are discussed in this section. Different from the previous papers with a constant bubble size, the number of small bubbles captured by the solidification shell was determined by the actual flow field and the bubble interaction. The distribution of the bubble entrapped location under 1.5 m/min casting speed and a bubble fraction of 8.2% is shown in Figure 7. For a better analysis of the bubble entrapped location, the bubble was divided into three levels: small bubble (diameter smaller than 0.2 mm), medium-size bubble (diameter ranges from 0.2 to 1 mm) and large bubble (diameter larger than 1 mm). From Figure 7, it can be seen that many small bubbles were captured by the solidifying shell, and the number of bubbles decreased with the distance from the top surface. In the narrow face, a number peak of captured bubbles appeared at the region about 0.5 mm below the top surface, where the mainstream impacts. In the deep part of the wide face, more bubbles were captured near the narrow face. From Figure 7, it can be noticed that the number of entrapment bubbles with medium-size bubbles and large size was far less than the small bubbles. There was a small amount of medium-size bubbles captured in the deep, but almost no large bubbles were captured in the deep of the mold. Additionally, the most of the large bubbles were entrapped close to the top surface.

4.3. Effect of the Initial Bubble Size on the Distribution of Captured Bubbles

The initial size of bubbles may affect the bubble secondary size distribution after the interaction of bubbles and the complex effect by the flow field, which in turn affects the capture of bubbles by the solidification shell. The effect of the initial size of bubbles on the distribution of captured bubbles may vary with different casting speeds and gas flow rates. For analyzing the distribution of captured bubbles, number density and average size of captured bubbles are discussed in this section. The number density of captured bubbles was calculated as the ratio of the number of captured bubbles to the area during the casting time. The area during the casting time was calculated as: Sk = vc × tc × Lk, where Sk is the area during the casting time, vc is the casting speed, k is the wide or narrow face, tc is the casting time and Lk is the length of wide face or narrow face. From the work of Lee et al. [4], few initial bubbles generated from the porous refractory are smaller than 1 mm. So, to investigate the effect of initial bubble size on the captured bubble distribution, three different initial bubble sizes of 1 mm, 1.5 mm and 2 mm were compared in this section.
Table 3 shows the distribution of captured bubbles at the wide and narrow faces with three different initial bubble sizes under the operation of the casting speed of 1.5 m/min and gas flow rate of 8.2% gas volume fraction. The number density of captured bubbles on the wide face and narrow face was about 3.6 and 5.2 per cm2, which clearly indicates that there were more bubbles per unit area on the narrow face. Since the main fluid stream rushed to the narrow face, more bubbles were carried to the narrow face. The average size of captured bubbles was about 0.130 and 0.126 mm respectively. Due to the greater fluid velocity towards the narrow face, a larger drag force acted on the bubbles facing the direction to the narrow face, resulting in larger bubbles brought to the narrow face. With the different initial bubble sizes, there were no obvious differences in the number density and size of captured bubbles. In the operation of casting speed of 1.5 m/min and gas flow rate of 8.2% gas volume fraction, the gas volume was large enough and the flow field was sufficiently turbulent, so the bubbles in the SEN with different initial bubble sizes could fully collide. The number and size of large bubbles, which could break up to the small bubbles that could be captured by the solidified shell, had little difference under different initial bubble sizes. So, there were no obvious differences at the number density and size of captured bubbles with different initial bubble sizes. The number density and size of captured bubbles with the casting speed of 1.7 m/min and 1.3 m/min and gas flow rate of 8.2% gas volume fraction are present in Table 4 and Table 5. It can be noticed that more bubbles were captured and the average bubble size decreased with increasing casting speed. It also can be found that when the gas flow rate was 8.2%, the initial bubble size had no obvious effect on the captured bubble distribution at the operation of the casting speed of 1.7 and 1.3 m/min. The reason was same as the casting speed of 1.5 m/min.
Table 6 shows the number density and average size of captured bubbles with different initial bubble sizes. For all cases, the gas flow rate was 4.1% argon volume fraction and the casting speed was 1.5 m/min. The results indicate that the bubble number density decreased comparing with the gas flow rate of 8.2% argon volume fraction. For different initial bubble sizes, it can be found that the captured bubble number density decreased with the decrease of initial bubble size. The captured bubble number density with the initial bubble size of 2 mm was about 1.21 times of that of 1 mm. For the small gas flow rate (argon volume fraction of 4.1%), the probability of collision between bubbles was lower than that of a large gas volume fraction. Therefore, in the SEN, the bubbles with a large initial size could coalesce into more large bubbles, which could break up into the small bubbles that were captured by the solidified shell, than small initial size bubbles. So, the captured bubble number density with the large initial bubble size was larger than that with a small initial bubble size. The effect of the initial bubbles size on captured bubble distribution under the condition of casting speed of 1.7 m/min and gas flow rate of 4.1% gas volume fraction is presented in Table 7. It can be found that the captured bubble number density with the initial bubble size of 2 mm was about 1.05 times of that of 1 mm. For the case of a gas flow rate of 4.1% argon volume fraction, the effect of the initial bubble size on the captured bubble number density decreased when the casting speed increased. By increasing the casting speed, the maximum velocity that bubbles can get will increase, and the bubble motion will be more chaotic. Therefore, the probability of collision between bubbles increases with increasing casting speed, and the difference in the number of large bubbles under different initial bubble sizes will be reduced. This is why the effect of the initial bubbles size on captured bubble distribution decreased with the increase of casting speed. From Table 8, for the case of casting speed of 1.3 m/min, it can be found that the captured bubble number density with the initial bubble size of 2 mm was about 1.55 times of that with an initial bubble size of 1 mm. Similar to the previous explanation, for the case of gas flow rate of 4.1% argon volume fraction and casting speed of 1.3 m/min, the gas volume fraction was small, and the bubbles motion was more stable with a lower casting speed. Therefore, the probability of collision between bubbles was lower with a lower casting speed. So, the effect of initial bubble size on the captured bubble number density was higher. From the simulation results, it can be noticed that the initial bubble size had no significant effect on the captured bubble size. The reason is that the average size of bubbles that can reach the advancing solidified shell was mainly determined by the casting speed.

5. Conclusions

The Euler-Lagrange model was used to simulate the bubble transport in the continuous casting mold and bubble captured by the solidification shell. The bubble coalescence and breakup were considered in the model, and an advanced bubble captured model was established. The location, number density and size of captured bubbles were analyzed in the present work. Besides, the effect of the initial bubble size on the captured bubble distribution under different operation conditions was discussed. The conclusions are the following:
1. Most of large bubbles floated up to the top surface close to the SEN, and only some small bubbles could get to the narrow face and the deep of the mold.
2. The number of small bubbles (diameter smaller than 0.2 mm) captured by the solidification shell was far more than medium-size (diameter ranges from 0.2 to 1 mm) and large bubble (diameter larger than 1 mm). The number of small and medium-size bubbles captured by the solidification shell decreased with the distance from the top surface. The large bubbles were captured only near the top surface.
3. For the case of a large gas flow rate, the initial bubble size had no obvious effect on the number density and average size of captured bubbles under different casting speeds. When the gas flow rate was small, the number density of captured bubbles by the solidification shell decreased with the decrease of the initial bubble size, and the effect of initial bubble size on captured bubble number density increased when the casting speed decreased. For all cases, the initial bubble size hardly affected the average size of captured bubbles.

Author Contributions

Z.Z., Z.L. and W.Y. conceived and designed the study; W.Y. and N.Z. did the numerical simulation; all the authors discussed the results; W.Y. wrote the paper; Z.Z. and Z.L. edited the manuscript. All authors have read and agreed to the published version of the manuscript.

Funding

No funding has supported this work.

Acknowledgments

The authors wish to express thanks to Yang You and Weiqiang Liu for the academic communication.

Conflicts of Interest

The authors declare no conflict of interest.

References

  1. Bai, H.; Thomas, B.G. Turbulent flow of liquid steel and argon bubbles in slide-gate tundish nozzles: Part I. model development and validation. Metall. Mater. Trans. B 2001, 32B, 253–267. [Google Scholar] [CrossRef]
  2. Thomas, B.G.; Huang, X.; Sussman, R.C. Simulation of argon gas flow effects in a continuous slab caster. Metall. Mater. Trans. B 1994, 25, 527–547. [Google Scholar] [CrossRef]
  3. Bai, H.; Thomas, B.G. Effects of clogging argon injection and continuous casting-conditions on flow and air aspiration in submerged-entry nozzles. Metall. Mater. Trans. B 2001, 32B, 707–722. [Google Scholar] [CrossRef]
  4. Lee, G.G.; Thomas, B.G.; Kim, S.H. Effect of refractory properties on initial bubble formation in continuous-casting nozzles. Met. Mater. Int. 2010, 16, 501–506. [Google Scholar] [CrossRef]
  5. Sing, V.; Dash, S.K.; Sunitha, J.S.; Ajmani, S.K.; Das, A.K. Experimental simulation and mathematical modeling of air bubble movement in slab caster mold. ISIJ Int. 2006, 46, 210–218. [Google Scholar] [CrossRef] [Green Version]
  6. Timmel, K.; Shevchenko, N.; Röder, M.; Anderhuber, M.; Gardin, P.; Eckert, S.; Gerbeth, G. Visualization of liquid metal two-phase flows in a physical model of the continuous casting process of steel. Metall. Mater. Trans. B 2014, 46, 700–710. [Google Scholar] [CrossRef]
  7. Liu, Z.; Li, L.; Qi, F.; Li, B.; Jiang, M.; Tsukihashi, F. Population balance modeling of polydispersed bubbly Flow in continuous-casting using multiple-size-group approach. Metall. Mater. Trans. B 2014, 46, 406–420. [Google Scholar] [CrossRef]
  8. Zhang, L.; Yang, S.; Cai, K.; Li, J.; Wan, X.; Thomas, B.G. Investigation of fluid flow and steel cleanliness in the continuous casting strand. Metall. Mater. Trans. B 2007, 38, 63–83. [Google Scholar] [CrossRef]
  9. Iguchi, M.; Kasai, N. Water model study of horizontal molten steel-air two-phase jet in a continuous casting mold. Metall. Mater. Trans. B 2000, 31, 453–460. [Google Scholar] [CrossRef]
  10. Zhang, W.; Luo, S.; Chen, Y.; Wang, W.; Zhu, M. Numerical simulation of fluid flow, heat transfer, species transfer, and solidification in billet continuous casting mold with M-EMS. Metals 2019, 9, 66. [Google Scholar] [CrossRef] [Green Version]
  11. Ni, P.; Ersson, M.; Jonsson, L.; Zhang, T.A.; Jönsson, P. Effect of immersion depth of a swirling flow tundish SEN on multiphase flow and heat transfer in mold. Metals 2018, 8, 910. [Google Scholar] [CrossRef] [Green Version]
  12. Yang, H.; Vanka, S.P.; Thomas, B.G. Modeling argon gas behavior in continuous casting of steel. JOM 2018, 70, 2148–2156. [Google Scholar] [CrossRef]
  13. Lai, Q.; Luo, Z.; Hou, Q.; Zhang, T.; Wang, X.; Zou, Z. Numerical study of inclusion removal in steel continuous casting mold considering interactions between bubbles and inclusions. ISIJ Int. 2018, 58, 2062–2070. [Google Scholar] [CrossRef] [Green Version]
  14. Kubo, N.; Ishii, T.; Kubota, J.; Aramaki, N. Two-phase flow numerical simulation of molten steel and argon gas in a continuous casting cold. ISIJ Int. 2002, 42, 1251–1258. [Google Scholar] [CrossRef] [Green Version]
  15. Liu, Z.Q.; Qi, F.S.; Li, B.K.; Cheung, S.C.P. Modeling of bubble behaviors and size distribution in a slab continuous casting mold. Int. J. Multiph. Flow 2016, 79, 190–201. [Google Scholar] [CrossRef]
  16. Liu, Z.; Qi, F.; Li, B.; Jiang, M. Multiple size group modeling of polydispersed bubbly flow in the mold: An analysis of turbulence and interfacial force models. Metall. Mater. Trans. B 2014, 46, 933–952. [Google Scholar] [CrossRef]
  17. Liu, Z.; Li, B. Large-eddy simulation of transient horizontal gas-liquid flow in continuous casting using dynamic subgrid-scale model. Metall. Mater. Trans. B 2017, 48, 1833–1849. [Google Scholar] [CrossRef]
  18. Deen, N.G.; Solberg, T.; Hjertager, B.H. Large eddy simulation of the gas-liquid flow in a square cross-sectioned bubble column. Chem. Eng. Sci. 2001, 56, 6341–6349. [Google Scholar] [CrossRef]
  19. Liu, C.; Luo, Z.; Wang, N.; Zhang, T.; Zou, Z. Mathematical modeling of multi-sized argon gas bubbles motion and its impact on melt flow in continuous casting mold of steel. J. Iron Steel Res. Int. 2014, 21, 403–407. [Google Scholar] [CrossRef]
  20. Liu, Z.; Li, B.; Jiang, M. Transient asymmetric flow and bubble transport inside a slab continuous-casting mold. Metall. Mater. Trans. B 2013, 45, 675–697. [Google Scholar] [CrossRef]
  21. Liu, Z.Q.; Li, B.K.; Jiang, M.F.; Tsukihashi, F. Euler-Euler-Lagrangian modeling for two-phase flow and particle transport in continuous casting mold. ISIJ Int. 2014, 54, 1314–1323. [Google Scholar] [CrossRef] [Green Version]
  22. Zhang, T.; Luo, Z.G.; Liu, C.L.; Zhou, H.; Zou, Z.S. A mathematical model considering the interaction of bubbles in continuous casting mold of steel. Powder Technol. 2015, 273, 154–164. [Google Scholar] [CrossRef]
  23. Zhang, T.; Luo, Z.; Zhou, H.; Ni, B.; Zou, Z. Analysis of two-phase flow and bubbles behavior in a continuous casting mold using a mathematical model considering the interaction of bubbles. ISIJ Int. 2016, 56, 116–125. [Google Scholar] [CrossRef] [Green Version]
  24. Zhang, L.; Wang, Y. Modeling the entrapment of nonmetallic inclusions in steel continuous-casting billets. JOM 2012, 64, 1063–1074. [Google Scholar] [CrossRef]
  25. Yuan, Q. Transient Study of Turbulent Flow and Particle Transport During Continuous Casting of Steel Slabs. Ph.D. Thesis, University of Illinois at Urbana-Champaign, Urbana-Champaign, IL, USA, 2004. [Google Scholar]
  26. Thomas, B.G.; Yuan, Q.; Mahmood, S.; Liu, R.; Chaudhary, R. Transport and entrapment of particles in steel continuous casting. Metall. Mater. Trans. B 2013, 45, 22–35. [Google Scholar] [CrossRef]
  27. Liu, Z.; Li, B. Transient motion of inclusion cluster in vertical-bending continuous casting caster considering heat transfer and solidification. Powder Technol. 2016, 287, 315–329. [Google Scholar] [CrossRef]
  28. Jin, K.; Thomas, B.G.; Ruan, X. Modeling and measurements of multiphase flow and bubble entrapment in steel continuous casting. Metall. Mater. Trans. B 2015, 47, 548–565. [Google Scholar] [CrossRef]
  29. Yang, W.; Luo, Z.; Lai, Q.; Zou, Z. Study on bubble coalescence and bouncing behaviors upon off-center collision in quiescent water. Exp. Therm. Fluid Sci. 2019, 104, 199–208. [Google Scholar] [CrossRef]
  30. Yang, W.; Luo, Z.; Gu, Y.; Liu, Z.; Zou, Z. Simulation of bubbles behavior in steel continuous casting mold using an Euler-Lagrange framework with modified bubble coalescence and breakup models. Powder Technol. 2020, 361, 769–781. [Google Scholar] [CrossRef]
  31. Ribeiro, C.P.; Mewes, D. The effect of electrolytes on the critical velocity for bubble coalescence. Chem. Eng. J. 2007, 126, 23–33. [Google Scholar] [CrossRef]
  32. Ribeiro, C.P.; Mewes, D. On the effect of liquid temperature upon bubble coalescence. Chem. Eng. Sci. 2006, 61, 5704–5716. [Google Scholar] [CrossRef]
  33. Sevik, M.; Park, S.H. The Splitting of drops and bubbles by turbulent fluid flow. J. Fluid Eng. 1973, 95, 53–60. [Google Scholar] [CrossRef]
Figure 1. Schematic of the model features for the bubble capture description.
Metals 10 01160 g001
Figure 2. Schematic diagram of the mold with boundary conditions.
Metals 10 01160 g002
Figure 3. Comparison of bubble behavior between the simulation and water model.
Metals 10 01160 g003
Figure 4. (a) Locations of samples and examined layers. Comparison between simulation and plant examination: (b) bubble number density on a wide face; (c) average bubble diameter on a wide face; (d) bubble number density on a narrow face and (e) average bubble diameter on a narrow face.
Metals 10 01160 g004
Figure 5. Fluid velocity and streamlines in the mold.
Metals 10 01160 g005
Figure 6. The whole bubble distribution at the time of 20 s in the mold.
Metals 10 01160 g006
Figure 7. Locations of bubbles captured by the solidification shell. (a) Small bubble; (b) medium-size bubble and (c) large bubble.
Metals 10 01160 g007
Table 1. Governing equations for the model.
Governing EquationsList of Symbols
Governing equations for continuous phase
Continuity: t ( α l ρ l ) + ( α l ρ l u l ) = 0
Momentum: t ( α l ρ l u l ) + u l ( α l ρ l u l ) = p + [ α l ( μ l + μ t ) ] u l + F I
α l —volume fraction of liquid phase
ρ l , u l , μ l —density, average velocity, viscosity of liquid phase
μ t —turbulent viscosity
F I —interfacial forces between two phases
Governing equations for bubble
m b d u b d t = F Dra + F Pre + F Buo + F Vir + F Gra + F Lif
Drag force F Dra = C Dra ρ l | u u b | ( u u b ) 2 π d b 2 4
Pressure gradient force F Pre = 1 6 π d b 3 ρ l d u d t
Buoyancy force F buo = 1 6 π d b 3 ρ l g
Virtual mass force F vir = 1 6 π d b 3 C Vir ρ l d d t ( u u b )
Gravity force F G r a = 1 6 π d b 3 ρ b g
Lift force F Lif = 1 6 π d b 3 C Lif ρ l ( u b u ) ( × u )
u b , m b , ρ b —velocity, mass, density of bubble
C Dra —drag coefficient
C Vir —virtual mass coefficient (0.5)
Pa
Governing equations for turbulence model (standard k-ε model)
α l ρ l ( k t + u · k ) = ( α l μ t σ k k ) + α l G k α l ρ l ε
α l ρ l ( ε t + u · ε ) = ( α l μ t σ ε ε ) + α l C 1 ε k G k α l C 2 ρ l ε 2 k
G k = μ t ( u i , j x j + u i , j x i ) u i , j x j
C μ (0.99), σ k (1.0),
C 1 (1.44), C 2 (1.92)—standard model constants
Table 2. Geometry parameters and operation conditions.
ParameterValue
SEN port width × height65 × 83 mm2
Nozzle port angle15° down
Submergence depth of SEN160 mm
Slab width × thickness 1300 × 230 mm2
Slab length2000 mm
Casting speed1.5 m/min
Argon volume fraction8.2 vol pct
Density of liquid7000 kg/mm3
Viscosity of liquid0.0063 kg/(m·s)
Density of gas0.5 kg/mm3
Viscosity of gas0.0000212 kg/(m·s)
Initial bubble diameter1 (30%), 1.5 (45%), 2 (25%)
Table 3. Captured bubble distribution with different initial bubble sizes at the operation casting speed of 1.5 m/min and gas flow rate of 8.2% gas volume fraction.
Diameter of Initial Bubble (mm)Number Density of Captured Bubble on the Wide Face (per cm2)Average Size of Captured Bubble on the Wide Face (mm)Number Density of Captured Bubble on the Narrow Face (per cm2)Average Size of Captured Bubble on the Narrow Face (mm)
1 3.6810.12715.2810.1314
1.5 3.5220.12565.1130.1288
2 3.5810.12615.3340.1305
Table 4. Captured bubble distribution with different initial bubble sizes at the operation casting speed of 1.3 m/min and gas flow rate of 8.2% gas volume fraction.
Diameter of Initial Bubble (mm)Number Density of Captured Bubble on the Wide Face (per cm2)Average Size of Captured Bubble on the Wide Face (mm)Number Density of Captured Bubble on the Narrow Face (per cm2)Average Size of Captured Bubble on the Narrow Face (mm)
1 2.1770.13573.1130.1379
1.5 2.1850.13363.2210.1388
2 2.2940.13223.4120.1370
Table 5. Captured bubble distribution with different initial bubble sizes at the operation casting speed of 1.7 m/min and gas flow rate of 8.2% gas volume fraction.
Diameter of Initial Bubble (mm)Number Density of Captured Bubble on the Wide Face (per cm2)Average Size of Captured Bubble on the Wide Face (mm)Number Density of Captured Bubble on the Narrow Face (per cm2)Average Size of Captured Bubble on the Narrow Face (mm)
1 6.2720.11818.9760.1221
1.5 6.2770.11798.9680.1229
2 6.2650.11758.9710.1226
Table 6. Captured bubble distribution with different initial bubble sizes at the operation casting speed of 1.5 m/min and a gas flow rate of 4.1% gas volume fraction.
Diameter of Initial Bubble (mm)Number Density of Captured Bubble on the Wide Face (per cm2)Average Size of Captured Bubble on the Wide Face (mm)Number Density of Captured Bubble on the Narrow Face (per cm2)Average Size of Captured Bubble on the Narrow Face (mm)
1 1.5830.12672.3130.1313
1.5 1.6340.12622.4330.1305
2 1.8820.12682.8030.1311
Table 7. Captured bubble distribution with different initial bubble sizes at the operation casting speed of 1.7 m/min and a gas flow rate of 4.1% gas volume fraction.
Diameter of Initial Bubble (mm)Number Density of Captured Bubble on the Wide Face (per cm2)Average Size of Captured Bubble on the Wide Face (mm)Number Density of Captured Bubble on the Narrow Face (per cm2)Average Size of Captured Bubble on the Narrow Face (mm)
1 0.7120.13361.0840.1388
1.5 0.8830.13241.3430.1365
2 1.1120.13291.6530.1343
Table 8. Captured bubble distribution with different initial bubble sizes at the operation casting speed of 1.3 m/min and a gas flow rate of 4.1% gas volume fraction.
Diameter of Initial Bubble (mm)Number Density of Captured Bubble on the Wide Face (per cm2)Average Size of Captured Bubble on the Wide Face (mm)Number Density of Captured Bubble on the Narrow Face (per cm2)Average Size of Captured Bubble on the Narrow Face (mm)
1 2.6630.11774.2650.1225
1.5 2.7560.11734.3360.1233
2 2.8310.11764.4530.1218

