Article

Selective Recovery of Tellurium from the Tellurium-Bearing Sodium Carbonate Slag by Sodium Sulfide Leaching Followed by Cyclone Electrowinning

1
School of Metallurgy and Environment, Central South University, Changsha 410083, China
2
National & Regional Joint Engineering Research Center of Nonferrous Metal Resource Recycling, Changsha 410083, China
3
First Materials Co., Ltd., Qingyuan 511517, China
*
Authors to whom correspondence should be addressed.
Metals 2020, 10(9), 1176; https://doi.org/10.3390/met10091176
Submission received: 27 July 2020 / Revised: 19 August 2020 / Accepted: 19 August 2020 / Published: 1 September 2020

Abstract

:
The rigorous environmental requirements promote the development of new processes with short and clean technical routes for recycling tellurium from tellurium-bearing sodium carbonate slag. In this paper, a novel process for selective recovery of tellurium from the sodium carbonate slag by sodium sulfide leaching, followed by cyclone electrowinning, was proposed. 88% of tellurium was selectively extracted in 40 g/L Na2S solution at 50 °C for 60 min with a liquid to solid ratio of 8:1 mL/g, while antimony, lead and bismuth were enriched in the leaching residue. Tellurium in the leach liquor was efficiently electrodeposited by cyclone electrowinning without purification. The effects of current density, temperature and flow rate of the electrolyte on current efficiency, tellurium recovery, cell voltage, energy consumption, surface morphology, and crystallographic orientations were systematically investigated. 91.81% of current efficiency and 95.47% of tellurium recovery were achieved at current density of 80 A/m2, electrolyte temperature of 45 °C and electrolyte flow rate of 400 L/h. The energy consumption was as low as 1.81 kWh/kg. A total of 99.38% purity of compact tellurium deposits were obtained. Therefore, the proposed process may serve as a promising alternative for recovering tellurium from tellurium-bearing sodium carbonate slag.

1. Introduction

Tellurium is a particularly important, but scarce, metalloid [1]. Because of its unique optical and electronic properties, tellurium is used extensively in metallurgy, semiconductor, photovoltaics modules and thermoelectric devices [2,3,4,5]. In the last decade, the growth of large-scale renewable energy generation, particularly the use of cadmium telluride thin-film solar cells, has resulted in a rapidly increased demand for tellurium [6,7]. In the 2011 United States Department of Energy’s (DOE) strategy report, the DOE classified tellurium as a ‘near-critical’ element for the foreseeable future in terms of scarcity and importance to future energy technology [8], outlining the importance of improvements in tellurium’s efficient concentration, recovery and recycling.
Because tellurium is mainly present along with copper ore, more than 90% of tellurium is produced as a by-product of copper anode slimes [9,10]. Currently, copper anode slime treatment processes primarily include Kaldo furnace process, sulfation roasting-leaching, and chlorination leaching on an industrial scale [11,12]. In the Kaldo furnace process, almost all the tellurium is distributed in the sodium carbonate slag, which is considered to be an important resource for tellurium recovery [13].
Tellurium separation and purification from tellurium-bearing sodium carbonate slag (TSCS) is a complex process involving many tellurium intermediates, and the exact details vary from one refinery to another [14]. As a rule, ball mill alkali leaching followed by purification, sulfuric acid neutralization, sodium hydroxide leaching, and electrowinning, has been used widely for the recovery of tellurium from TSCS on an industrial scale [15,16]. However, because of the complicated processes, large consumption of acid and alkaline and long production cycle, tellurium has a relatively low recovery rate and a high production cost [17]. Nevertheless, a reduction in tellurium dioxide to metallic tellurium by sulfur dioxide is another important method for tellurium recovery [18]. However, using sulfur dioxide as a reducing agent has a certain environmental risk. Therefore, it is of great interest to develop an efficient and clean treatment or separation of tellurium from TSCS.
Sodium sulfide leaching is a high-effective hydrometallurgical method, which is commonly used for the separation of antimony and arsenic from antimony-bearing gold ore, antimony-containing brittle sulfur lead concentrate and arsenic-bearing dust [9,19,20]. However, sodium sulfide leaching applied to tellurium separation has not been extensively investigated, but it has the potential to confer substantial advantages relative to present methods.
Cyclone electrowinning, proposed by Barr et al. [21], is an efficient electrowinning technology to recover metal ions from the aqueous solution. Cyclone electrowinning functions through high-speed liquid introduction, which enhances mass transfer near the electrode surface and increases current density to achieve high-efficiency electrowinning [22,23]. A total of 99.98% purity of cathode copper was electrowon by cyclone electrowinning from the sulfuric acid leach liquor of waste printed circuit boards with a current efficiency of 94.96% [24]. Wang et al. [25] employed cyclone electrowinning to efficiently recover selenium from the dilute acidic solution (0.3 g/L Se(IV)) with selenium purity of 97.6%. Meanwhile, to the best of our knowledge, only two papers have reported recovering tellurium from the aqueous solution by cyclone electrowinning. One was reported by Jin et al. [26], in which fine tellurium powder was successfully obtained from a hydrochloric acid system. However, the cathode current efficiency was only 84.3%. Another was reported by Xu et al. [27], who employed cyclone electrowinning to efficiently electrodeposit 99.94% purity tellurium from the sodium tellurite alkaline solution with a current efficiency of 95.25%. However, tellurium concentration in this sodium tellurite alkaline solution was as high as 100 g·L−1, and there were almost no impurities in this alkaline solution.
Based on the above facts, we proposed a new possible method in this work to selectively and efficiently recover tellurium from TSCS by sodium sulfide leaching: cyclone electrowinning. The effects of various parameters on sodium sulfide leaching of TSCS were optimized. Moreover, the effects of current density, temperature and flow rate of the electrolyte on current efficiency, tellurium recovery, cell voltage, energy consumption, surface morphology, and crystallographic orientations were systematically investigated. The tellurium deposits were characterized by X-ray diffraction (XRD) and field emission scanning electron microscope (FESEM) techniques.

2. Experiments

2.1. Reagents and Materials

Tellurium-bearing sodium carbonate slag (TSCS) used in the experiments was provided by a nonferrous metal refinery in Hunan province, China. The TSCS was ground to the size of less than 75 μm after drying at 110 °C for 24 h. The chemical composition of TSCS is listed in Table 1. The XRD patterns of TSCS (Figure 1a) showed that antimony was predominantly present as NaSb(OH)6. The other mineral phases present were Pb5Bi8O17, Bi, BiFeO3, SiO2 and Zn8Al16O32. However, XRD analysis did not show the mineral composition of tellurium, which may be attributed to its poor crystallinity [28,29]. To further clarify the phase composition of tellurium in TSCS, X-ray photoelectron spectroscopy (XPS) measurement was employed. Figure 1b presents the decomposition curves of the Te 3d spectra from TSCS. The peak at 576.50 eV corresponded to the formation of surface Na2TeO3 species [30], while the peak at 576.80 eV was from Na2TeO4 [31]. These results indicate that tellurium in the TSCS was predominantly present as Na2TeO3 and Na2TeO4.
All other chemical reagents used in the experiments were of analytical grade, which was supplied by Sinopharm Chemical Reagent Co., Ltd., (Shanghai, China). The water used in all experimental work was ultrapure (conductivity 0.2 μS/cm) unless otherwise specified.

2.2. Experimental Equipment and Procedure

2.2.1. Sodium Sulfide Leaching

The sodium sulfide leaching experiments were performed in a 500 mL, round-bottom flask with a condenser to prevent evaporation losses. The sodium sulfide solution was prepared by adding the required amount of Na2S·9H2O in the ultrapure water. A total of 200 mL of the prepared sodium sulfide solution was used with desired amounts of TSCS. The slurry was mechanically stirred by paddle stirrer at a rate of 300 rpm and the reactor was located in a temperature-controlled water bath to adjust the slurry temperature. After leaching for desired duration, the slurry was filtered and collected. The leach liquors were prepared for Inductively Coupled Plasma Atomic Emission Spectrometry (ICP-AES) analysis to determine the tellurium and antimony balance. The leaching residue was washed with ultrapure water and dried for chemical and XRD analysis.

2.2.2. Cyclone Electrowinning

The tellurium electrowinning experiments for the leach liquor were conducted in a cyclone reactor. The schematic diagram of the cyclone reactor is presented in Figure 2. An IrO2-Ta2O5 coated titanium rod in the center was used as an anode, while a high-purity titanium sheet (99.99%) surrounded the anode as the cathode. The geometrical areas of the anode and cathode were 95 and 301 cm2, respectively. The titanium sheet was manually polished with 400, 600 and 1200 mesh emery papers before each electrowinning experiment.
A total of 2 L sodium sulfide leach liquor was first added to a 2-L, round-bottomed glass flask, which was located in the heating mantle to maintain the electrolyte temperature constant. The leach liquor was circulated from the bottom of the cyclone reactor to the top using a pump monitor to maintain a constant flow rate. All the electrowinning experiments were conducted for seven hours by applying constant current from a high-precision DC power supplier (TPR-1530D, Longwei, Hong Kong, China). A digital universal meter (VC890C+, Shenzhen Victor Hi-Tech. Ltd., Shenzhen, China) was used to record the cell voltage every hour. After electrolysis, the cathode was carefully removed and the deposits were washed with oxalic acid and ultrapure water, then dried and weighed for chemical composition, XRD and FESEM analysis.

2.3. Calculation Method

The leaching efficiency of metal i was calculated from Equation (1)
η i = C i V m ω i × 100 %
where Ci is the concentration of metal i in the leach liquor, V is the volume of the leach liquor, m is the mass of TSCS, ωi is the mass ratio of metal i in TSCS.
The current efficiency for tellurium was calculated by weight using Faraday’s law. The equation was expressed as Equation (2)
C E = m e · F · n I · t · M × 100 %
where me is the weight of the tellurium deposit (g), F is Faraday’s constant, n is the number of electrons, I is the applied current (A), t is the electrolysis time (h) and M is the atomic mass of tellurium.
The energy consumption (W, kWh/kg) was calculated as follows
W = E I t m e
where E is the average cell voltage (V).
The recovery of tellurium was defined according to Equation (4)
R = C 0 V 0 C e V e C 0 V 0 × 100 %
where C0 and Ce is the tellurium concentration before and after electrolysis (g/L), respectively. V0 and Ve are the electrolyte volumes before and after electrolysis (L), respectively.

2.4. Characterization and Analyses

The chemical composition of TSCS, leaching residue, tellurium deposits, the leach liquor before and after electrolysis was determined by ICP-AES (PS-6, Baird Corp, Boston, MA, USA). XPS analysis was used for elemental analysis of TSCS (ESCALAB 250Xi, Thermo Fisher, Waltham, Massachusetts, USA). A potential pH meter (PHS-3C, INESA, Shanghai, China) was employed to determine the NaOH concentration in the sodium sulfide leach solution. XRD patterns of the leaching residue and tellurium deposits were collected using a Bruker D8-Discover diffractometer in the range of 10–80° 2θ at a scanning rate of 1° per min with Cu Kα radiation. XRD analysis of TSCS was conducted in the range of 5–90° 2θ at a scanning rate of 0.5° per min with Cu Kα radiation. The preferred crystal orientations of tellurium deposits were also examined by XRD analysis. The surface morphology of tellurium deposits was examined by FESEM using a MIRA3 LMH (TESCAN, Brno, Czech Republic).

3. Results and Discussion

3.1. Sodium Sulfide Leaching

3.1.1. Thermodynamic Analyses

When TSCS dissolves in Na2S solution, Na2TeO3, Na2TeO4, and NaSb(OH)6 could be transformed to soluble thiotellurite ( TeS 3 2 ), thiotellurate ( TeS 4 2 ) and thioantimonate ( SbS 4 3 ), respectively [32,33], while lead and bismuth in TSCS could combine with S2- to form insoluble lead sulfide and bismuth sulfide, respectively. The main reactions occurring during the sodium sulfide leaching of TSCS are presented in Equations (5)–(8). To determine the thermodynamic trend of tellurium and antimony dissolving in the Na2S solution, changes in Gibbs free energy of Equations (5)–(7) were calculated. The standard molar Gibbs free energy of formation of related compounds and ions at 25 °C is shown in Table 2. The changes in standard Gibbs free energy of Equations (5)–(7) at 25 °C were determined to be −207.40, −241.42 and −97.12 kJ/mol, respectively. The negative sign of the standard Gibbs free energy changes indicates the spontaneous nature of tellurium and antimony dissolving in Na2S solution. The changes in Gibbs free energy of Equations (5) and (6) are more negative than that of Equation (7), which suggests a greater thermodynamic trend of tellurium dissolving in Na2S solution. Therefore, this may be possible for the selective separation of tellurium from TSCS.
T e O 3 2 + 3 S 2 + 3 H 2 O = T e S 3 2 + 6 O H Δ r G m Θ =   207.40   kJ / mol
N a 2 T e O 4 + 4 S 2 + 4 H 2 O = 2 N a + + T e S 4 2 + 8 O H Δ r G m Θ =   241.42   kJ / mol
N a S b ( O H ) 6 + 4 S 2 = N a + + S b S 4 3 + 6 O H Δ r G m Θ =   97.12   kJ / mol
P b 5 B i 8 O 17 + 17 S 2 + 17 H 2 O = 5 P b S + 4 B i 2 S 3 + 34 O H

3.1.2. Different Effects on Sodium Sulfide Leaching of TSCS

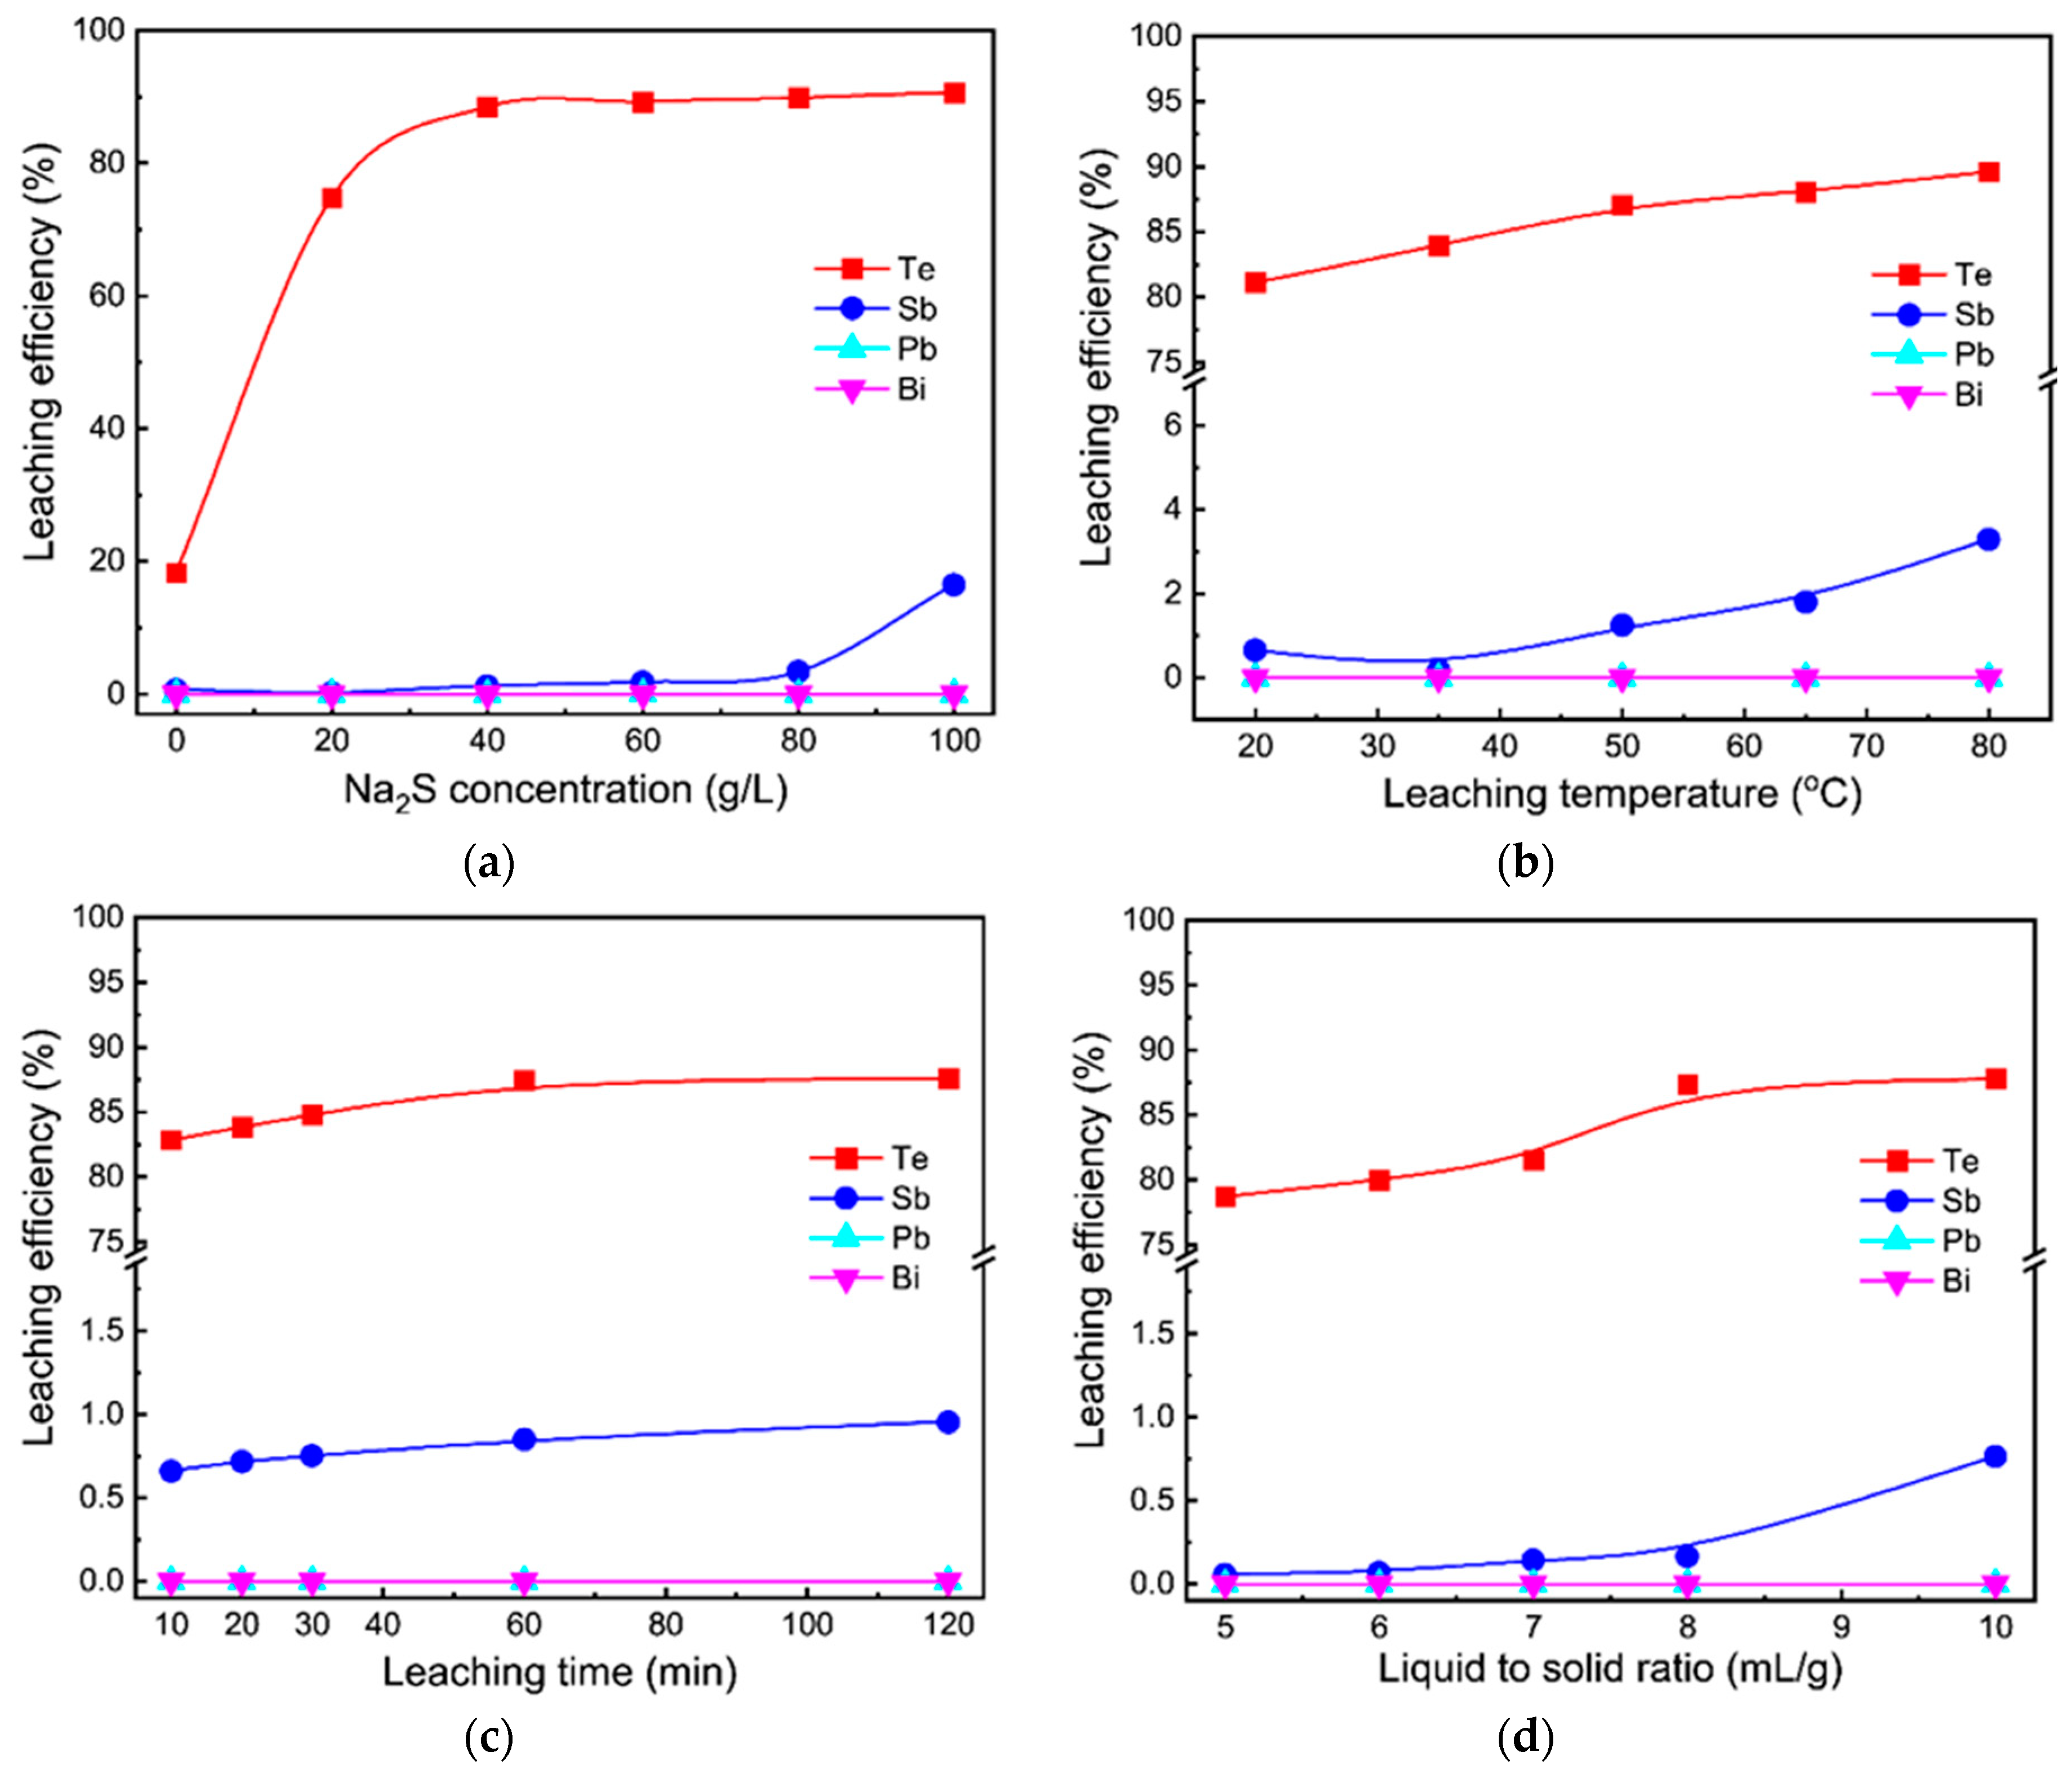
The influence of Na2S concentration on sodium sulfide leaching of TSCS was investigated at 50 °C for 1 h with 10:1 mL/g of liquid to solid ratio (Figure 3a). It can be seen that the leaching efficiency of tellurium increased rapidly from 18% to 88% with an increase in Na2S concentration from 0 to 40 g/L. Any further increase in Na2S concentration resulted in a marginal increase in tellurium leaching efficiency. A total of 18% of tellurium leaching efficiency was obtained in the water without addition of Na2S, which is due to the water-soluble Na2TeO3 in TSCS. The leaching efficiency of antimony remained a value of less than 1.5% when increasing the Na2S concentration from 0 to 40 g/L. The antimony leaching efficiency increased slowly to 16% by increasing the Na2S concentration to 100 g/L. This indicates that tellurium is preferentially leached in Na2S solution over antimony. These results are in line with the results published by Guo et al. [9], who leached high-tellurium material in the Na2S solution. Additionally, no lead and bismuth in TSCS were leached in the Na2S solution.
Figure 3b–d presents the effect of leaching temperature, time, and liquid to solid ratio on the sodium sulfide leaching of TSCS. It was observed that the tellurium leaching efficiency increased gradually from 81% at 20 °C to 90% at 80 °C (Figure 3b). The antimony leaching efficiency increased slowly to 3% with the increase in leaching temperature. As shown in Figure 3c, it can be observed that the leaching of tellurium was efficient and fast. A total of 83% of tellurium was leached within 10 min. In comparison, leaching time almost showed no remarkable effect on antimony leaching efficiency. By increasing the liquid to solid ratio from 5:1 to 8:1 mL/g, tellurium leaching efficiency increased gradually from 79% to 87%, and antimony leaching efficiency showed a value of less than 1%.
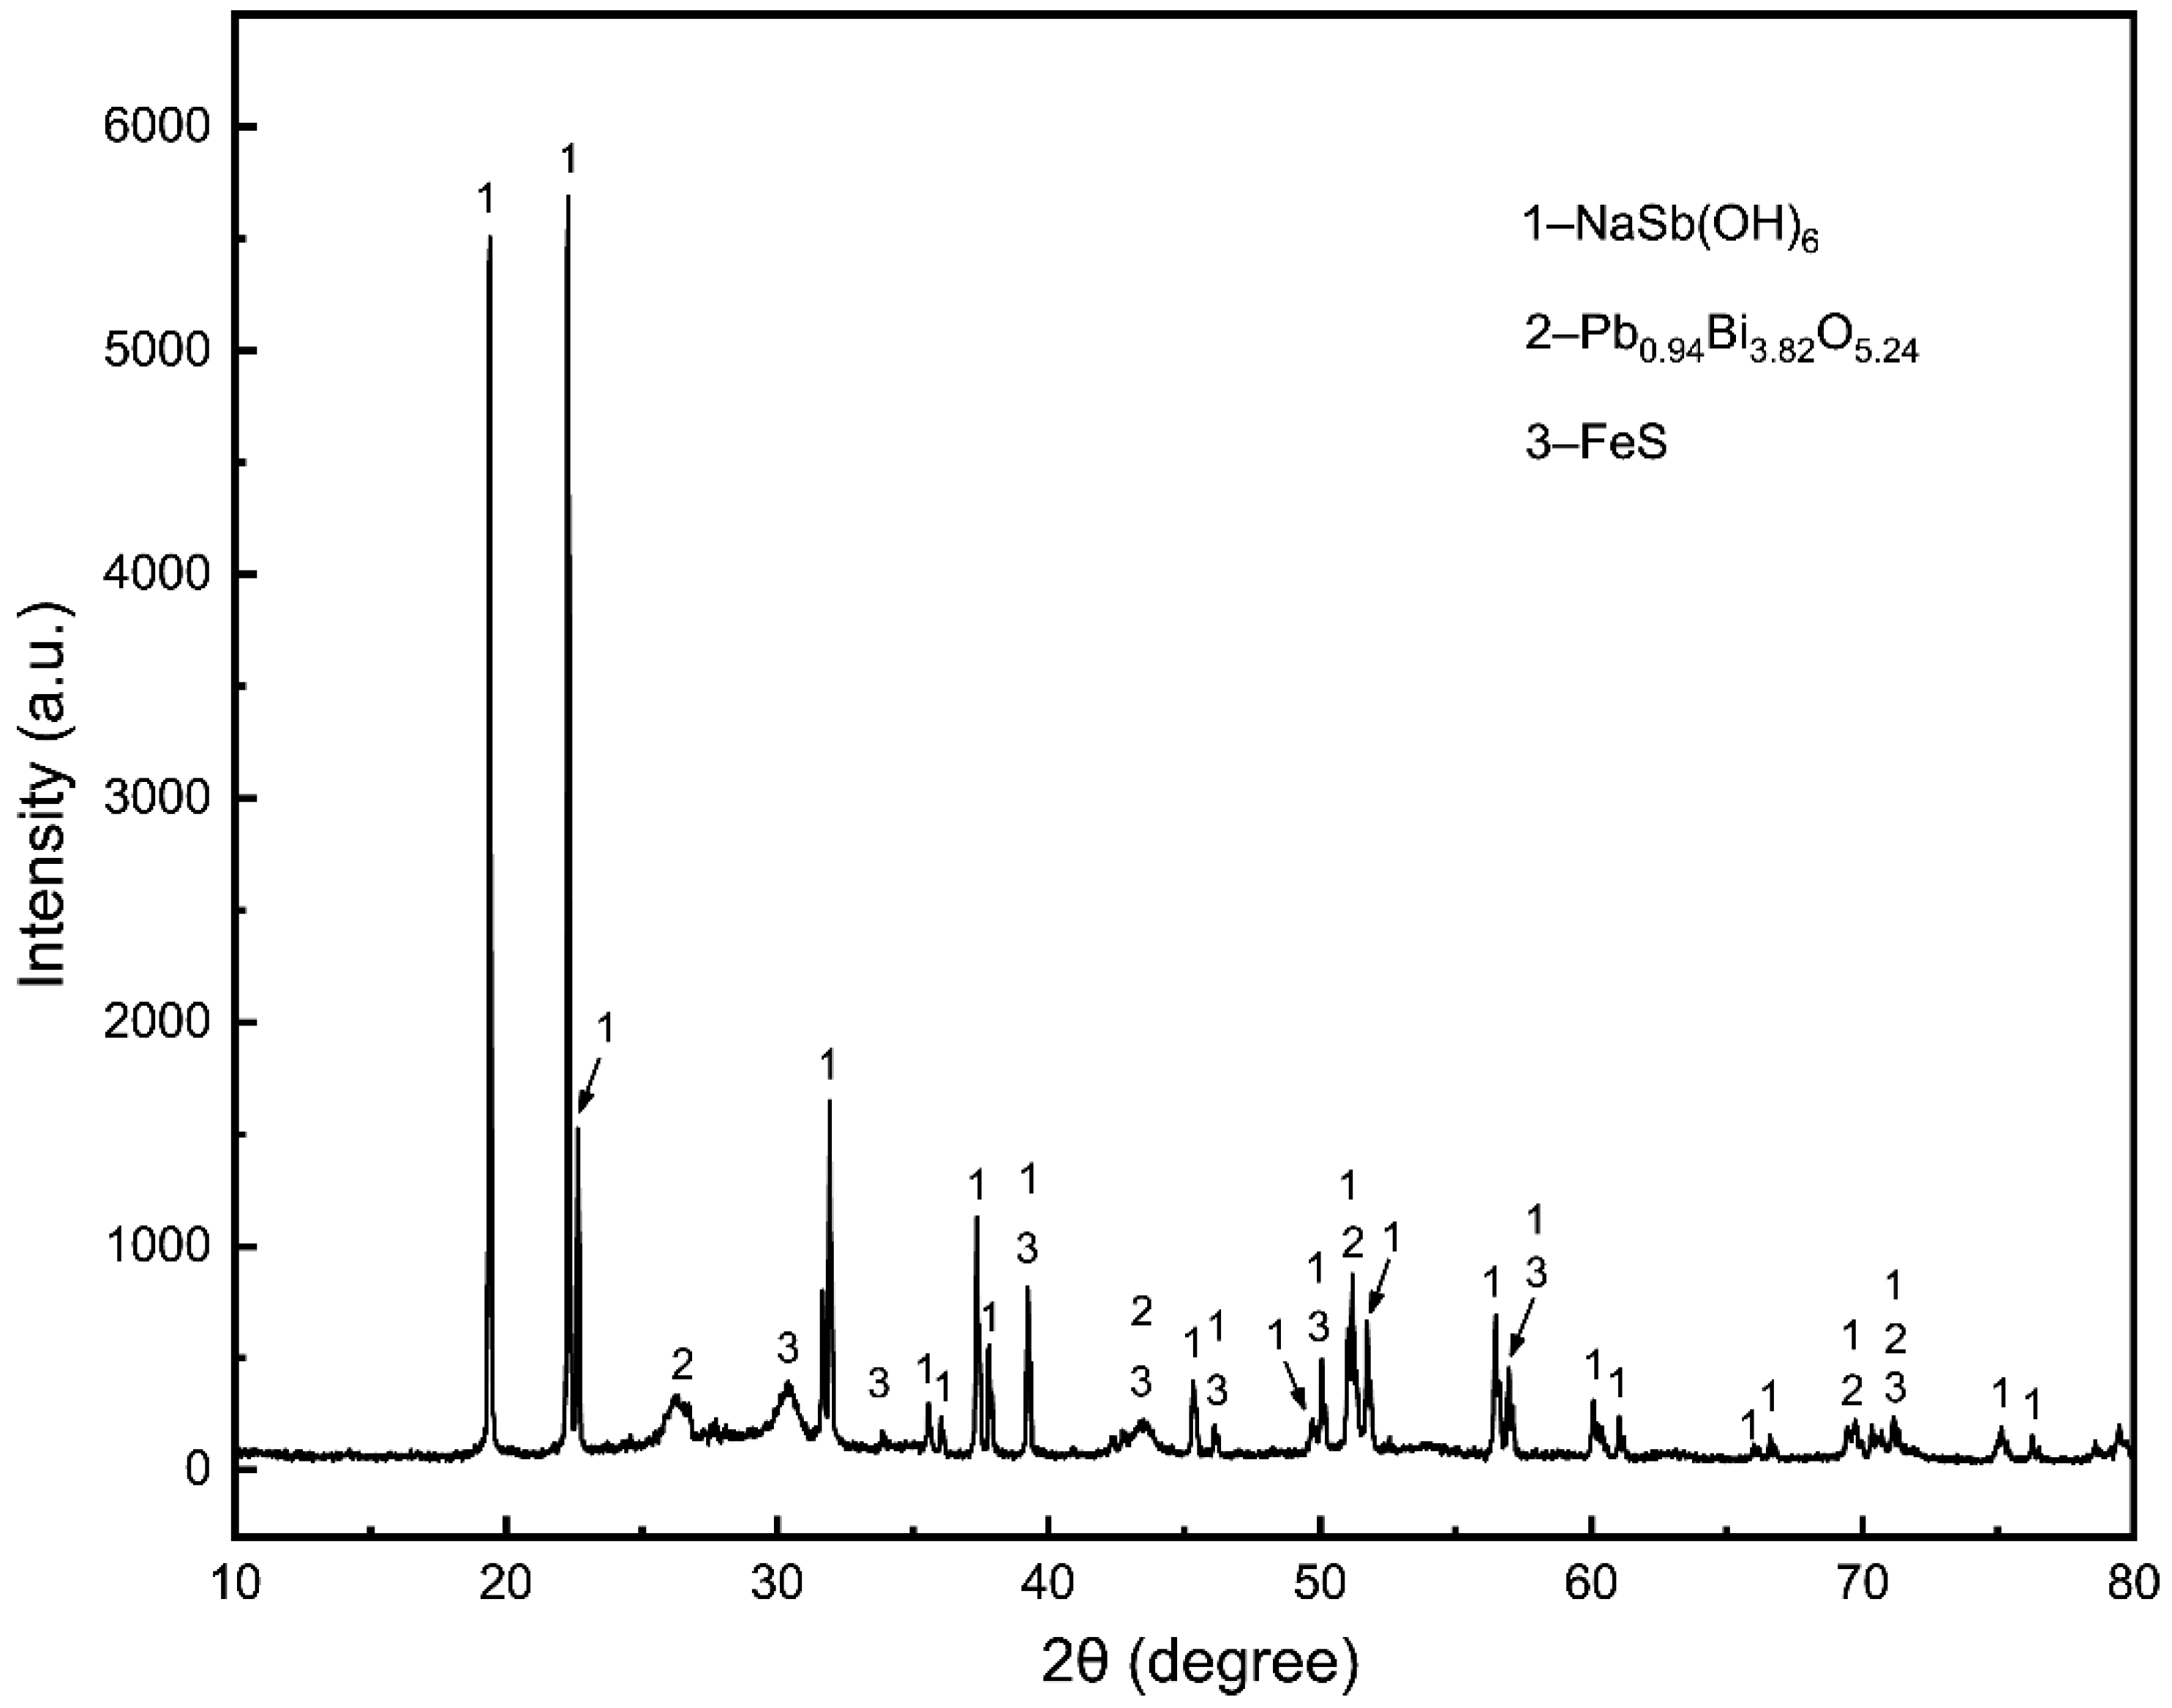
According to the above results, the optimized experimental conditions for the sodium sulfide leaching of TSCS were found to be an Na2S concentration 40 g/L, leaching temperature 50 °C, leaching time 60 min, and liquid to solid ratio 8:1 mL/g. Under these conditions, comprehensive experiments were carried out. A total of 88% of tellurium and 0.2% of antimony was leached into the leach liquor, while lead and bismuth were enriched in the leaching residue. Table 3 and Figure 4 illustrate the chemical composition and XRD patterns of Na2S leaching residue, respectively. According to Table 3, it was observed the tellurium content in TSCS was reduced from 11.6% to 2.8%, while antimony, lead and bismuth was further enriched in the residue. The leaching residue can be treated in higher concentration Na2S solution at higher temperature followed by reduction smelting or chemical reduction to recover valuable metals [9]. As shown in Figure 4, the diffraction peaks were in accordance with NaSb(OH)6, Pb0.94Bi3.82S5.24, and FeS.

3.2. Tellurium Cyclone Electrowinning

The chemical composition of the sodium sulfide leach liquor of TSCS is listed in Table 4. From Table 4, it indicated that, besides Te 12.82 g/L, the following elements were found: Se 0.47 g/L, Cu 22.02 mg/L, As 23.34 mg/L, Sb 12.71 mg/L, Fe 1.56 mg/L, Pb 0.16 mg/L, and Ni 0.13 mg/L. The Na2S concentration of the leach liquor is 9.30 g/L. The pH value is 13.56. Tellurium in the leach liquor was mainly present as TeS 3 2 and TeS 4 2 ion, which can be reduced to metallic tellurium by Na2SO3 [9]. Nevertheless, this method consumes an excess of Na2SO3, resulting in high operating costs. Cyclone electrowinning is an efficient, selective, and readily adaptable method to recover metal/metalloid ions in the most valuable state [34,35]. In the present study, tellurium in the leach liquor was electrowon by cyclone electrowinning without purification. The primary reactions are expressed as Equations (9)–(12).
Cathode:
TeS 4 2 ( aq ) + 2 e TeS 3 2 ( aq ) + S 2 ( aq )   E Θ =   0.11   V   vs .   NHE
TeS 3 2 ( aq ) + 4 e Te ( s ) + 3 S 2 ( aq )   E Θ = 0.96   V   vs .   NHE
Anode:
S 2 ( aq ) S ( s ) + 2 e E Θ =   0.45   V   vs .   NHE
4 OH ( aq ) 2 H 2 O ( l ) + O 2 ( g ) + 4 e

3.2.1. Effect of Current Density

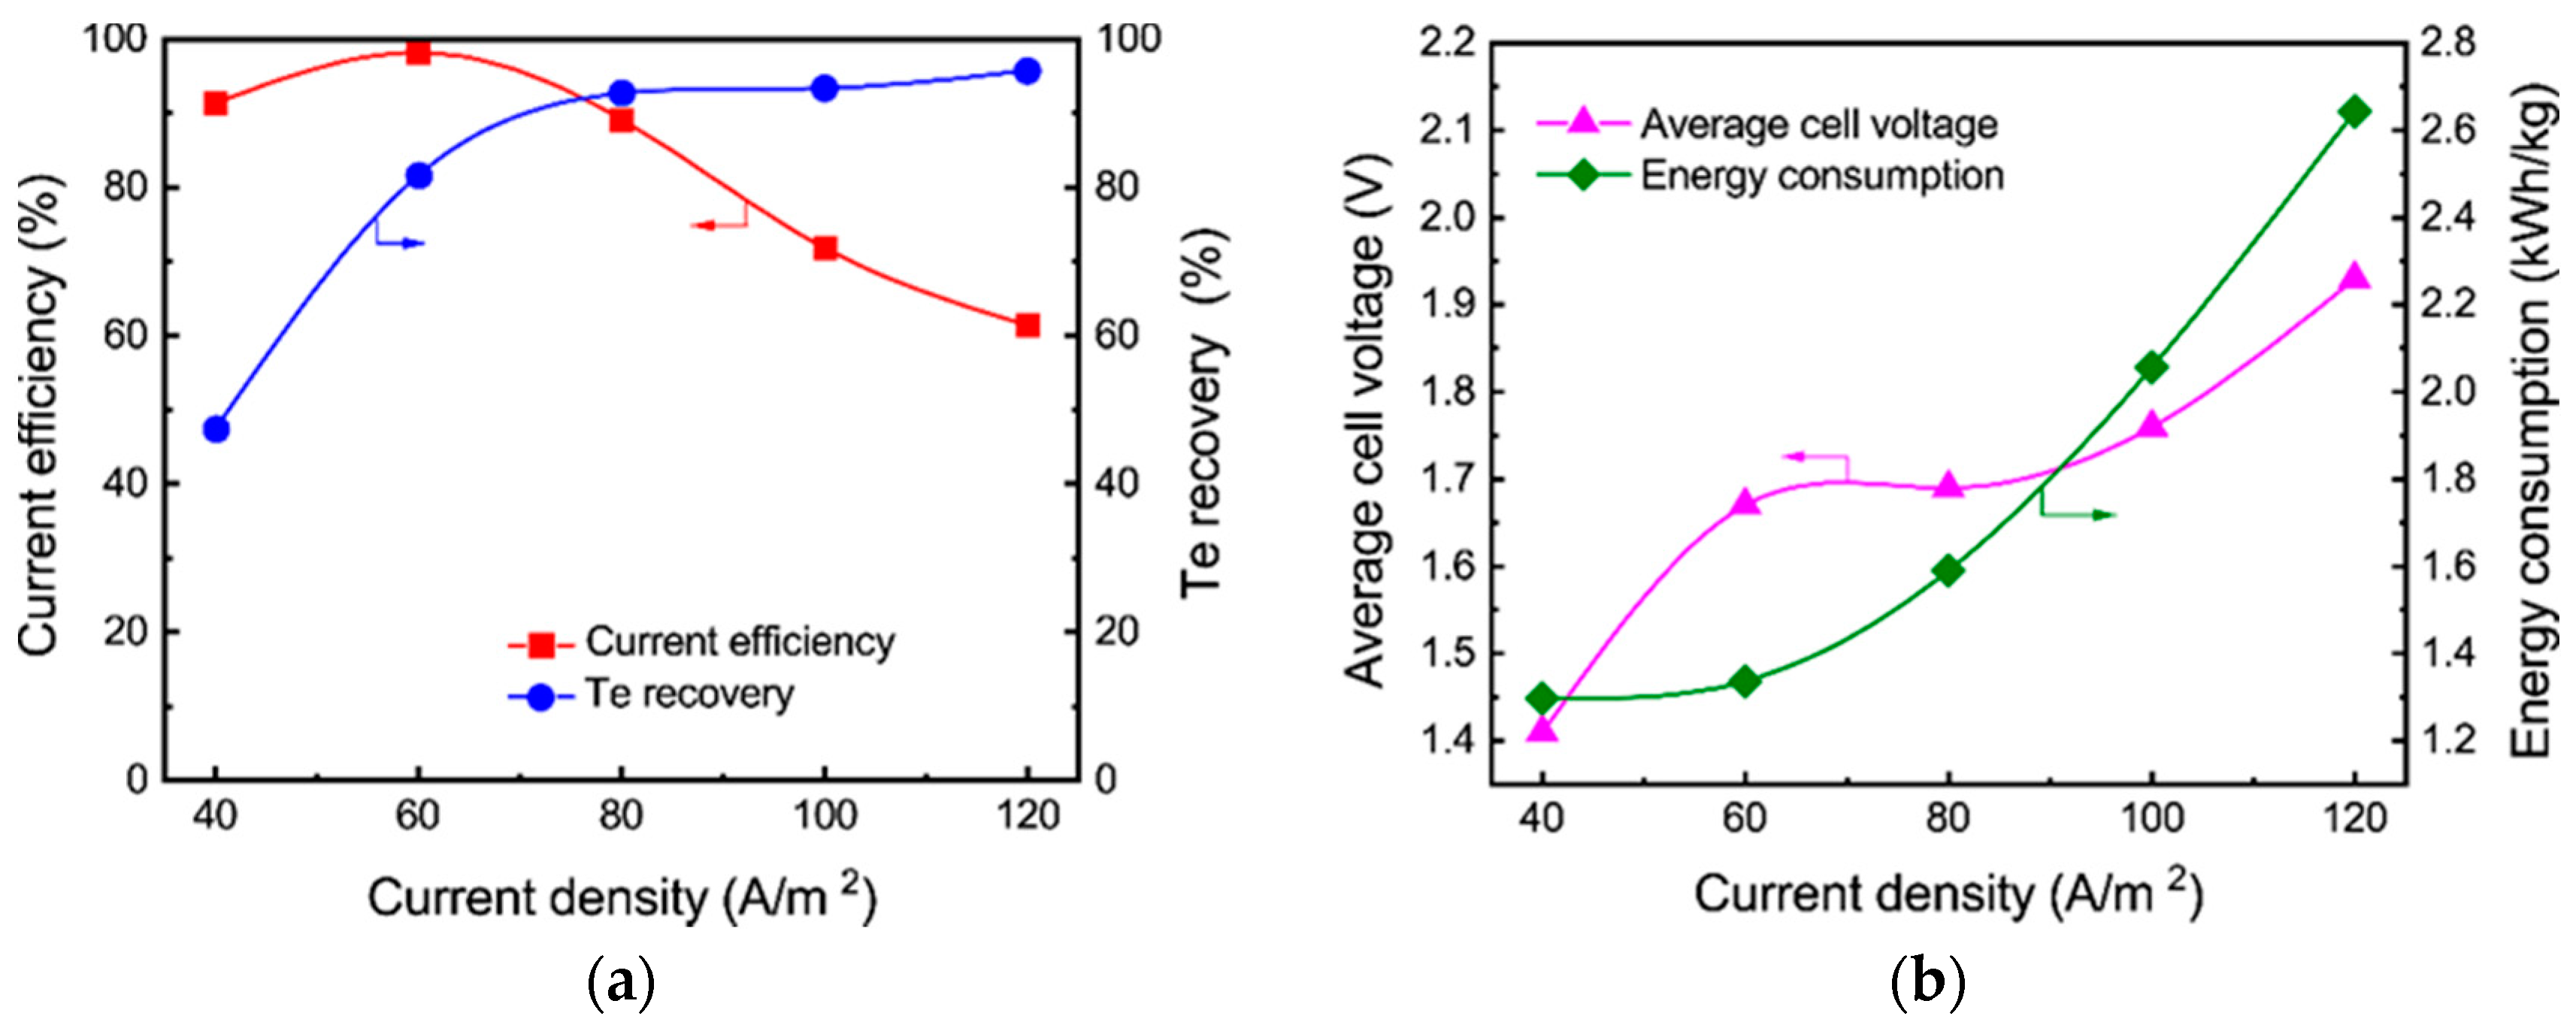
The influence of current density on tellurium cyclone electrowinning was determined by varying the current density from 40 to 120 A/m2 while fixing the flow rate of electrolyte and temperature at 400 L/h and 45 °C, respectively. As shown in Figure 5a, the current efficiency increased from 91% to 98% within the range of 40 to 60 A/m2. However, increasing the current density over 60 A/m2 decreased the current efficiency significantly, which was only 61%, as the current density further increased to 120 A/m2. The reason for the decrease in current efficiency may be attributed to the further reduction in the electrodeposited metallic tellurium to telluride ion ( Te 2 ) at higher current density (Equation (13)) [36]. It should be noted that once the Te 2 is formed, it will react with TeO 3 2 , resulting in the chemical formation of metallic tellurium powder through a disproportionation reaction in solution (Equation (14)). Moreover, the recovery of tellurium increased from 47% to 93% with an increase in current density from 40 to 80 A/m2. Any further increase in current density results in a marginal increase in tellurium recovery.
Te ( s ) + 2 e Te 2 ( aq )   E Θ = 1.14   V   vs .   NHE
2 Te 2 ( aq ) + 3 H 2 O ( l ) + TeO 3 2 ( aq ) 3 Te chem   ( s ) + 6 OH ( aq )
As plotted in Figure 5b, the increase in current density led to a progressive increase in cell voltage as well as energy consumption. It has been identified that higher current density resulted in larger cell capacity and labor productivity, but this will concomitantly increase the cell voltage and power consumption [37]. These results are in line with the results published by Awe and Sandström [38], who electrowon the antimony from the model sulfide alkaline solutions. Moreover, the energy consumption was 1.69 kWh per kilogram of tellurium deposited at the current density of 80 A/m2, which is much lower than that in the tellurium conventional parallel plate electrowinning process (3.40 kWh) [39]. This suggests that the recovery of tellurium from the leach liquor by cyclone electrowinning is energy-saving.
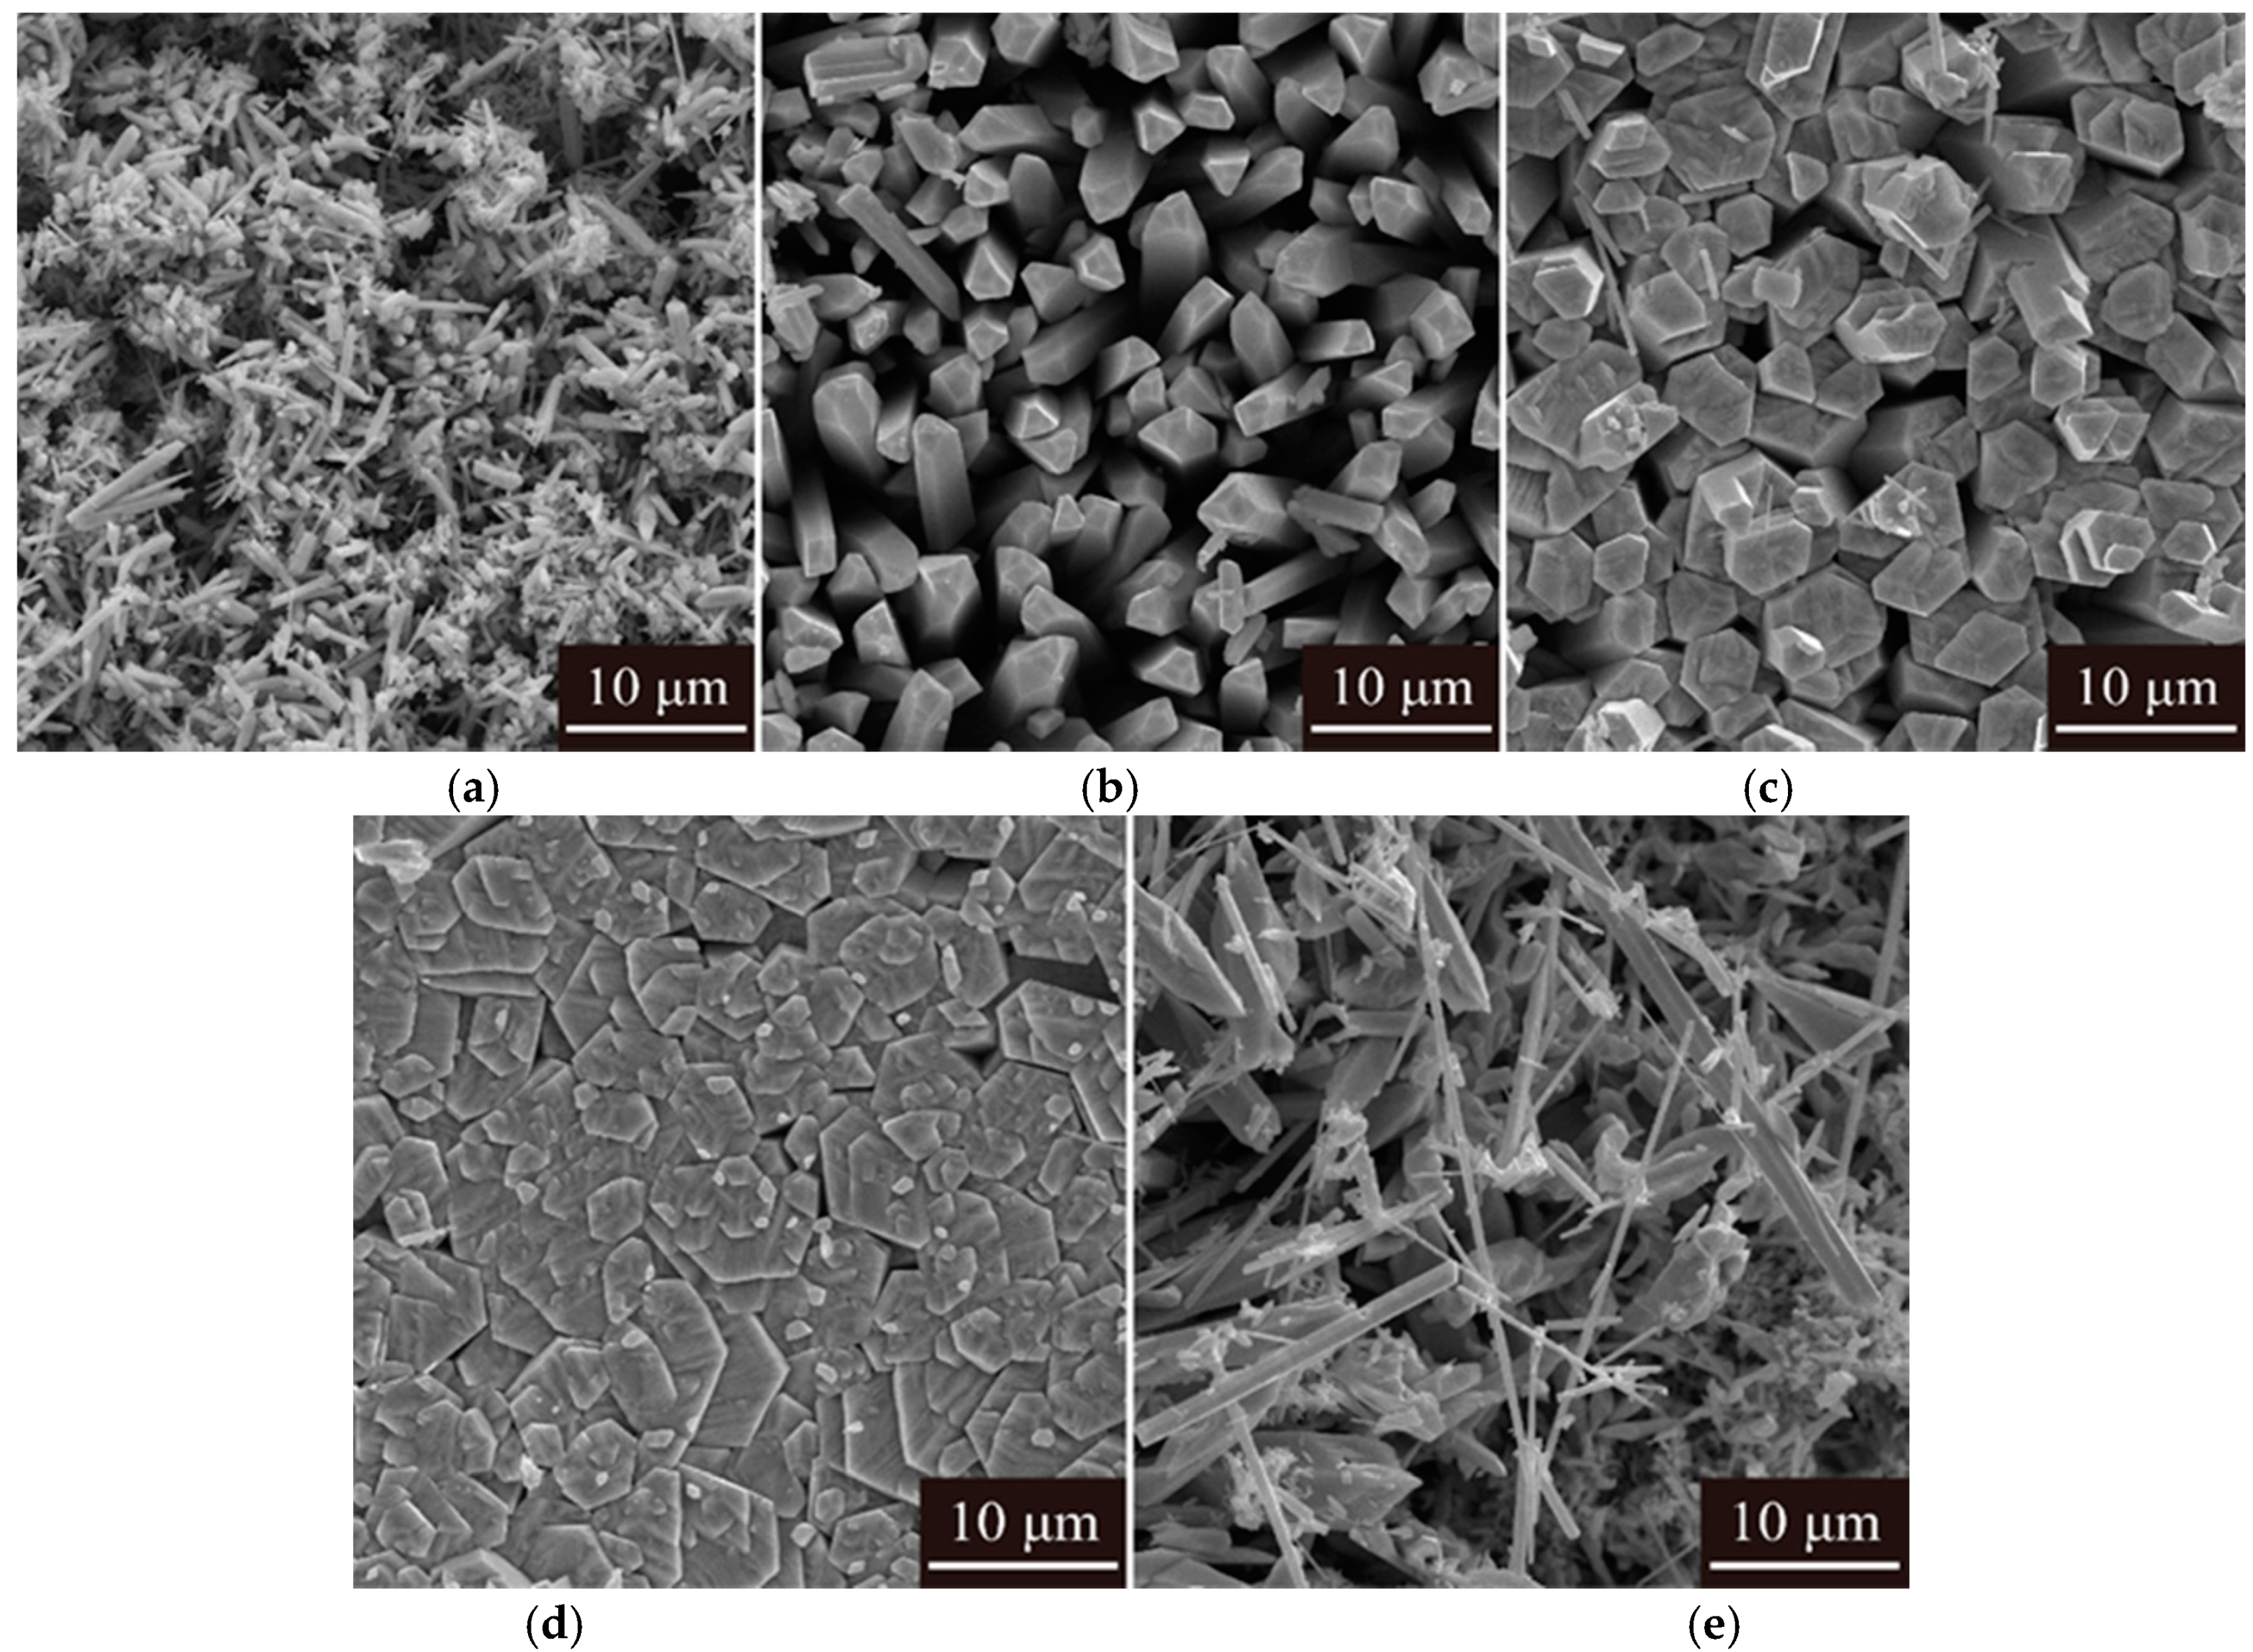
The orientation of the tellurium deposits was examined using XRD (Figure 6). The FESEM micrographs for the tellurium deposits obtained at different current densities are shown in Figure 7. The tellurium deposit obtained at 40 A/m2 consists of rod-like crystallite of varying size (1‒8 μm) (Figure 7a) with (011) (110) (012) (100) as the order of preferred crystal orientation (Figure 6). Increasing the current density did not have any effect on the shape of the crystals but increased the diameter size of the electrodeposited tellurium significantly (Figure 7b‒d). At 100 A/m2, the tellurium deposit with crystals perpendicular to the substrate was obtained, the diameter size of which ranged from 3 to 8 μm. This is because increasing the current density elevates the cathodic discharge rate, provides more discrete electrons, and accelerates the nucleation and deposition of tellurium crystals [40]. A further increase in current density up to 120 A/m2 resulted in dendritic crystallites being distributed randomly throughout the deposit surface. This may be due to the further reduction in the electrodeposited metallic tellurium to telluride ion. Moreover, the order of preferred crystal orientations obtained at 40‒120 A/m2 changed to (011) (012) (110) (100). As expected, the tellurium structure is, as usual, Hexagonal, as reported by others [41].

3.2.2. Effect of Electrolyte Temperature

The effect of electrolyte temperature on the current efficiency and recovery of tellurium is depicted in Figure 8a. In general, the rate constant of both cathodic reactions could be enhanced by the rising temperature [42]. As shown in Figure 8a, the results indicated that the current efficiency remained constant at ~90%, but sharply decreased when the temperature increased to 70 °C. The sharp decrease in the current efficiency at 70 °C may correspond to the hydrogen evolution reaction [43]. Moreover, the recovery of tellurium followed similar trends to those for current efficiency.
The effect of electrolyte temperature on the average cell voltage and energy consumption is presented in Figure 8b. It was found that the rising temperature greatly decreased the average cell voltage. This is due to the viscosity of the electrolyte decreases with the rising temperature, resulting in a decline in the solution resistance and consequently lowering the cell voltage [44]. The energy consumption decreased substantially from 1.92 to 1.42 kWh within the range of 20 to 45 °C and then increased slightly to 1.62 kWh as the temperature further increased.
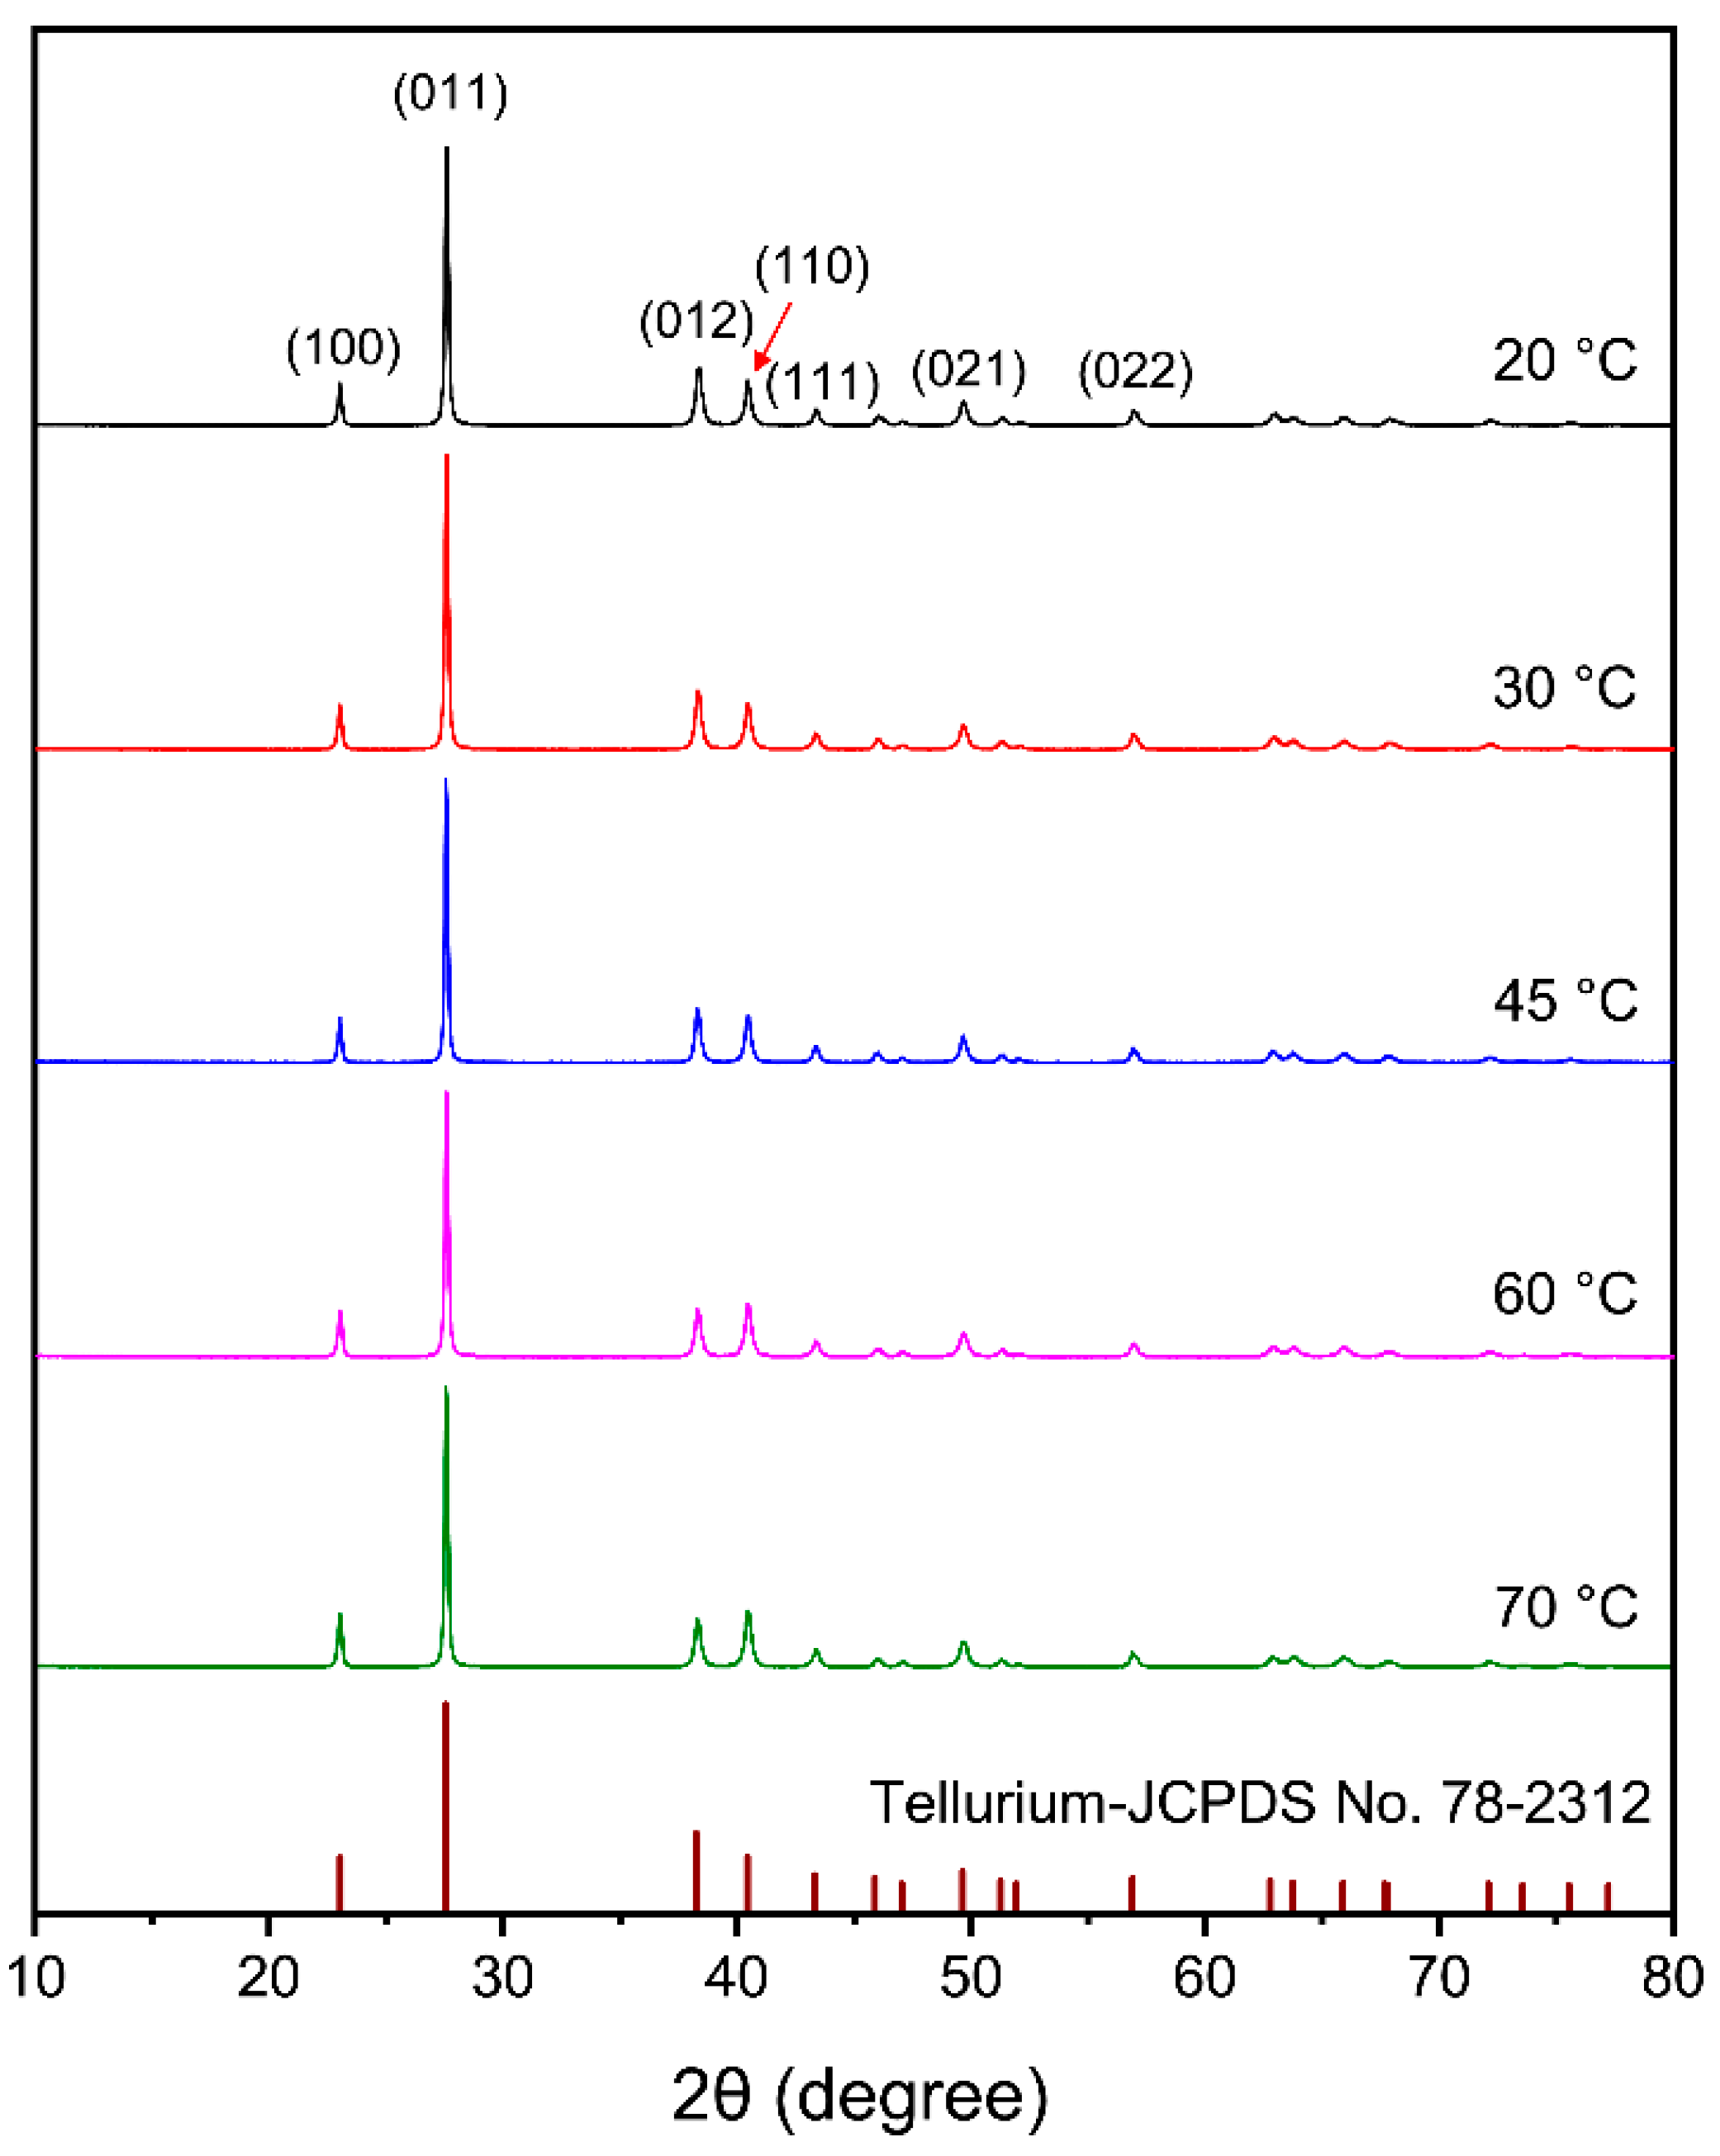
The tellurium deposits obtained at different electrolyte temperatures were smooth and uniform. The deposit obtained at 20 °C consisted of rod-like crystals with diameter size ranging from 1 to 2 μm randomly distributed throughout the deposit with (011) (012) (110) (100) as the order of preferred crystallographic orientation (Figure 9 and Figure 10a). Increasing the temperature to 30 and 45 °C did not change the order of the preferred crystal orientation but significantly increased the crystals’ size (Figure 9 and Figure 10a‒c). This could be due to the faster nucleation with a change in the deposition kinetics in the higher temperature [45]. It should be noted that a further increase in the temperature up to 60 and 70 °C changed the order of the preferred orientation to (011) (110) (012) (100). Thus, the growth of (110) crystal planes is promoted by the increasing electrolyte temperature. Additionally, at 70 °C, compact deposit morphology is obtained where well-developed hexagonal crystallites are formed throughout the cathode surface (Figure 10e).

3.2.3. Effect of Flow Rate of the Electrolyte

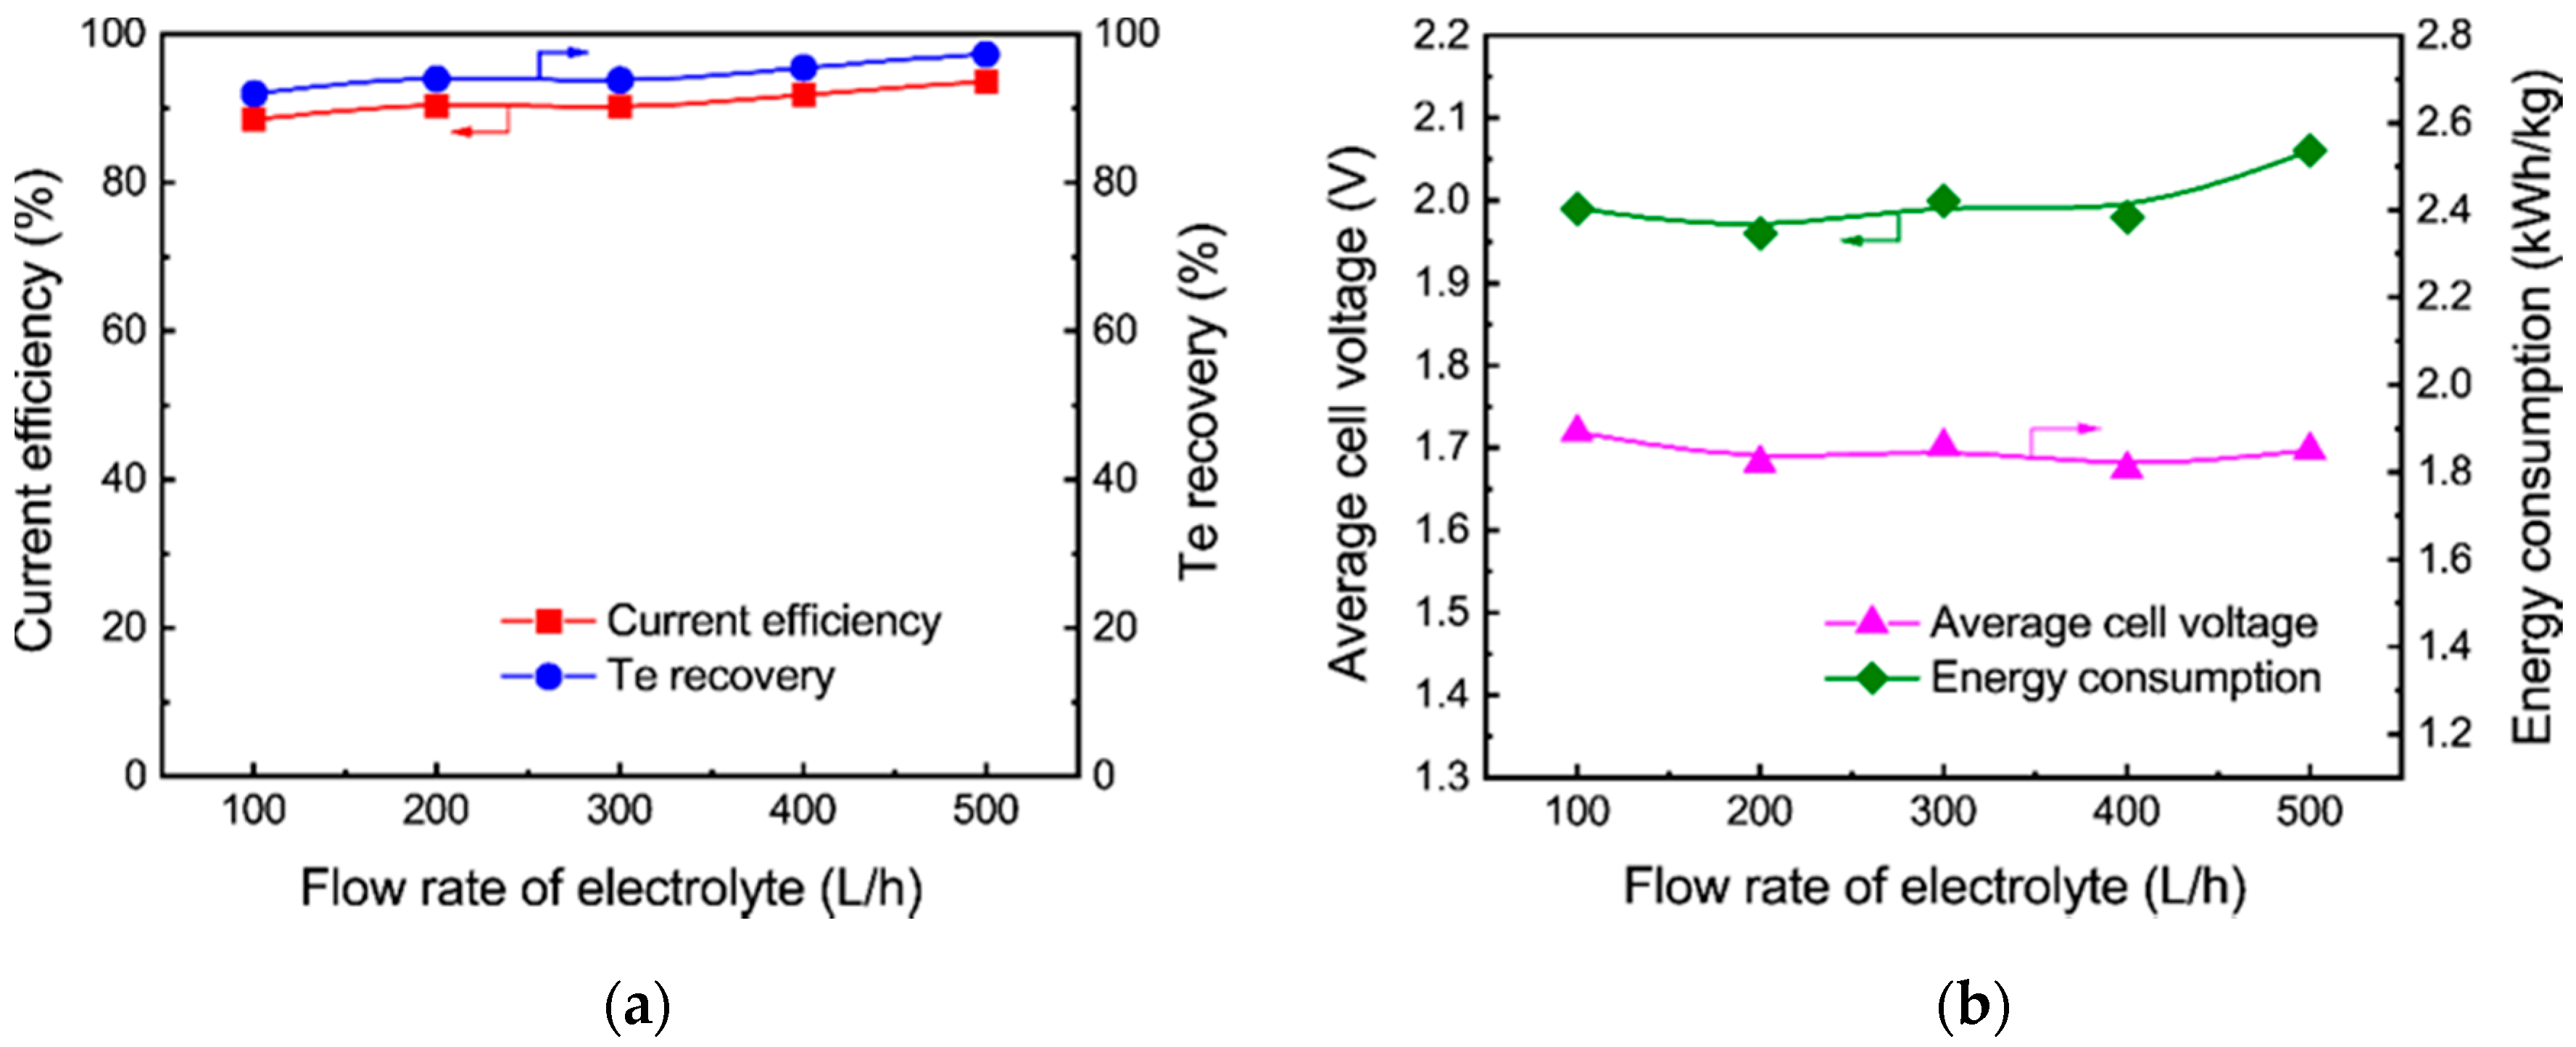
Figure 11a presents the change in the current efficiency and recovery of tellurium as a function of flow rate of electrolyte. As presented in Figure 11a, the current efficiency increased slightly from 88% to 94% as the electrolyte flow rate increased from 100 to 500 L/h. Moreover, the tellurium recovery followed a similar trend as that for current efficiency. These could be attributed to the fact that with the increase in electrolyte flow rate, the mass transfer is effectively enhanced, leading to a decrease in the diffusion layer thickness and concentration polarization [46].
Figure 11b illustrates the effect of electrolyte flow rate on the average cell voltage and energy consumption. It was observed that the flow rate of electrolyte had little effect on the cell voltage, which remained constant at ~1.85V. Meanwhile, the energy consumption remained constant at ~2.00 kW/kg. Any further increase in the electrolyte flow rate resulted in a marginal increase in energy consumption. This can be explained by the enhanced mass transfer at a higher flow rate of electrolyte, which results in a decrease in the cell voltage and energy consumption [47]. However, due to the brittleness of elemental tellurium [48], some electrodeposited tellurium powder was washed out into the electrolyte due to the high flow rate of electrolyte, leading to a decrease in the conductivity of the electrolyte.
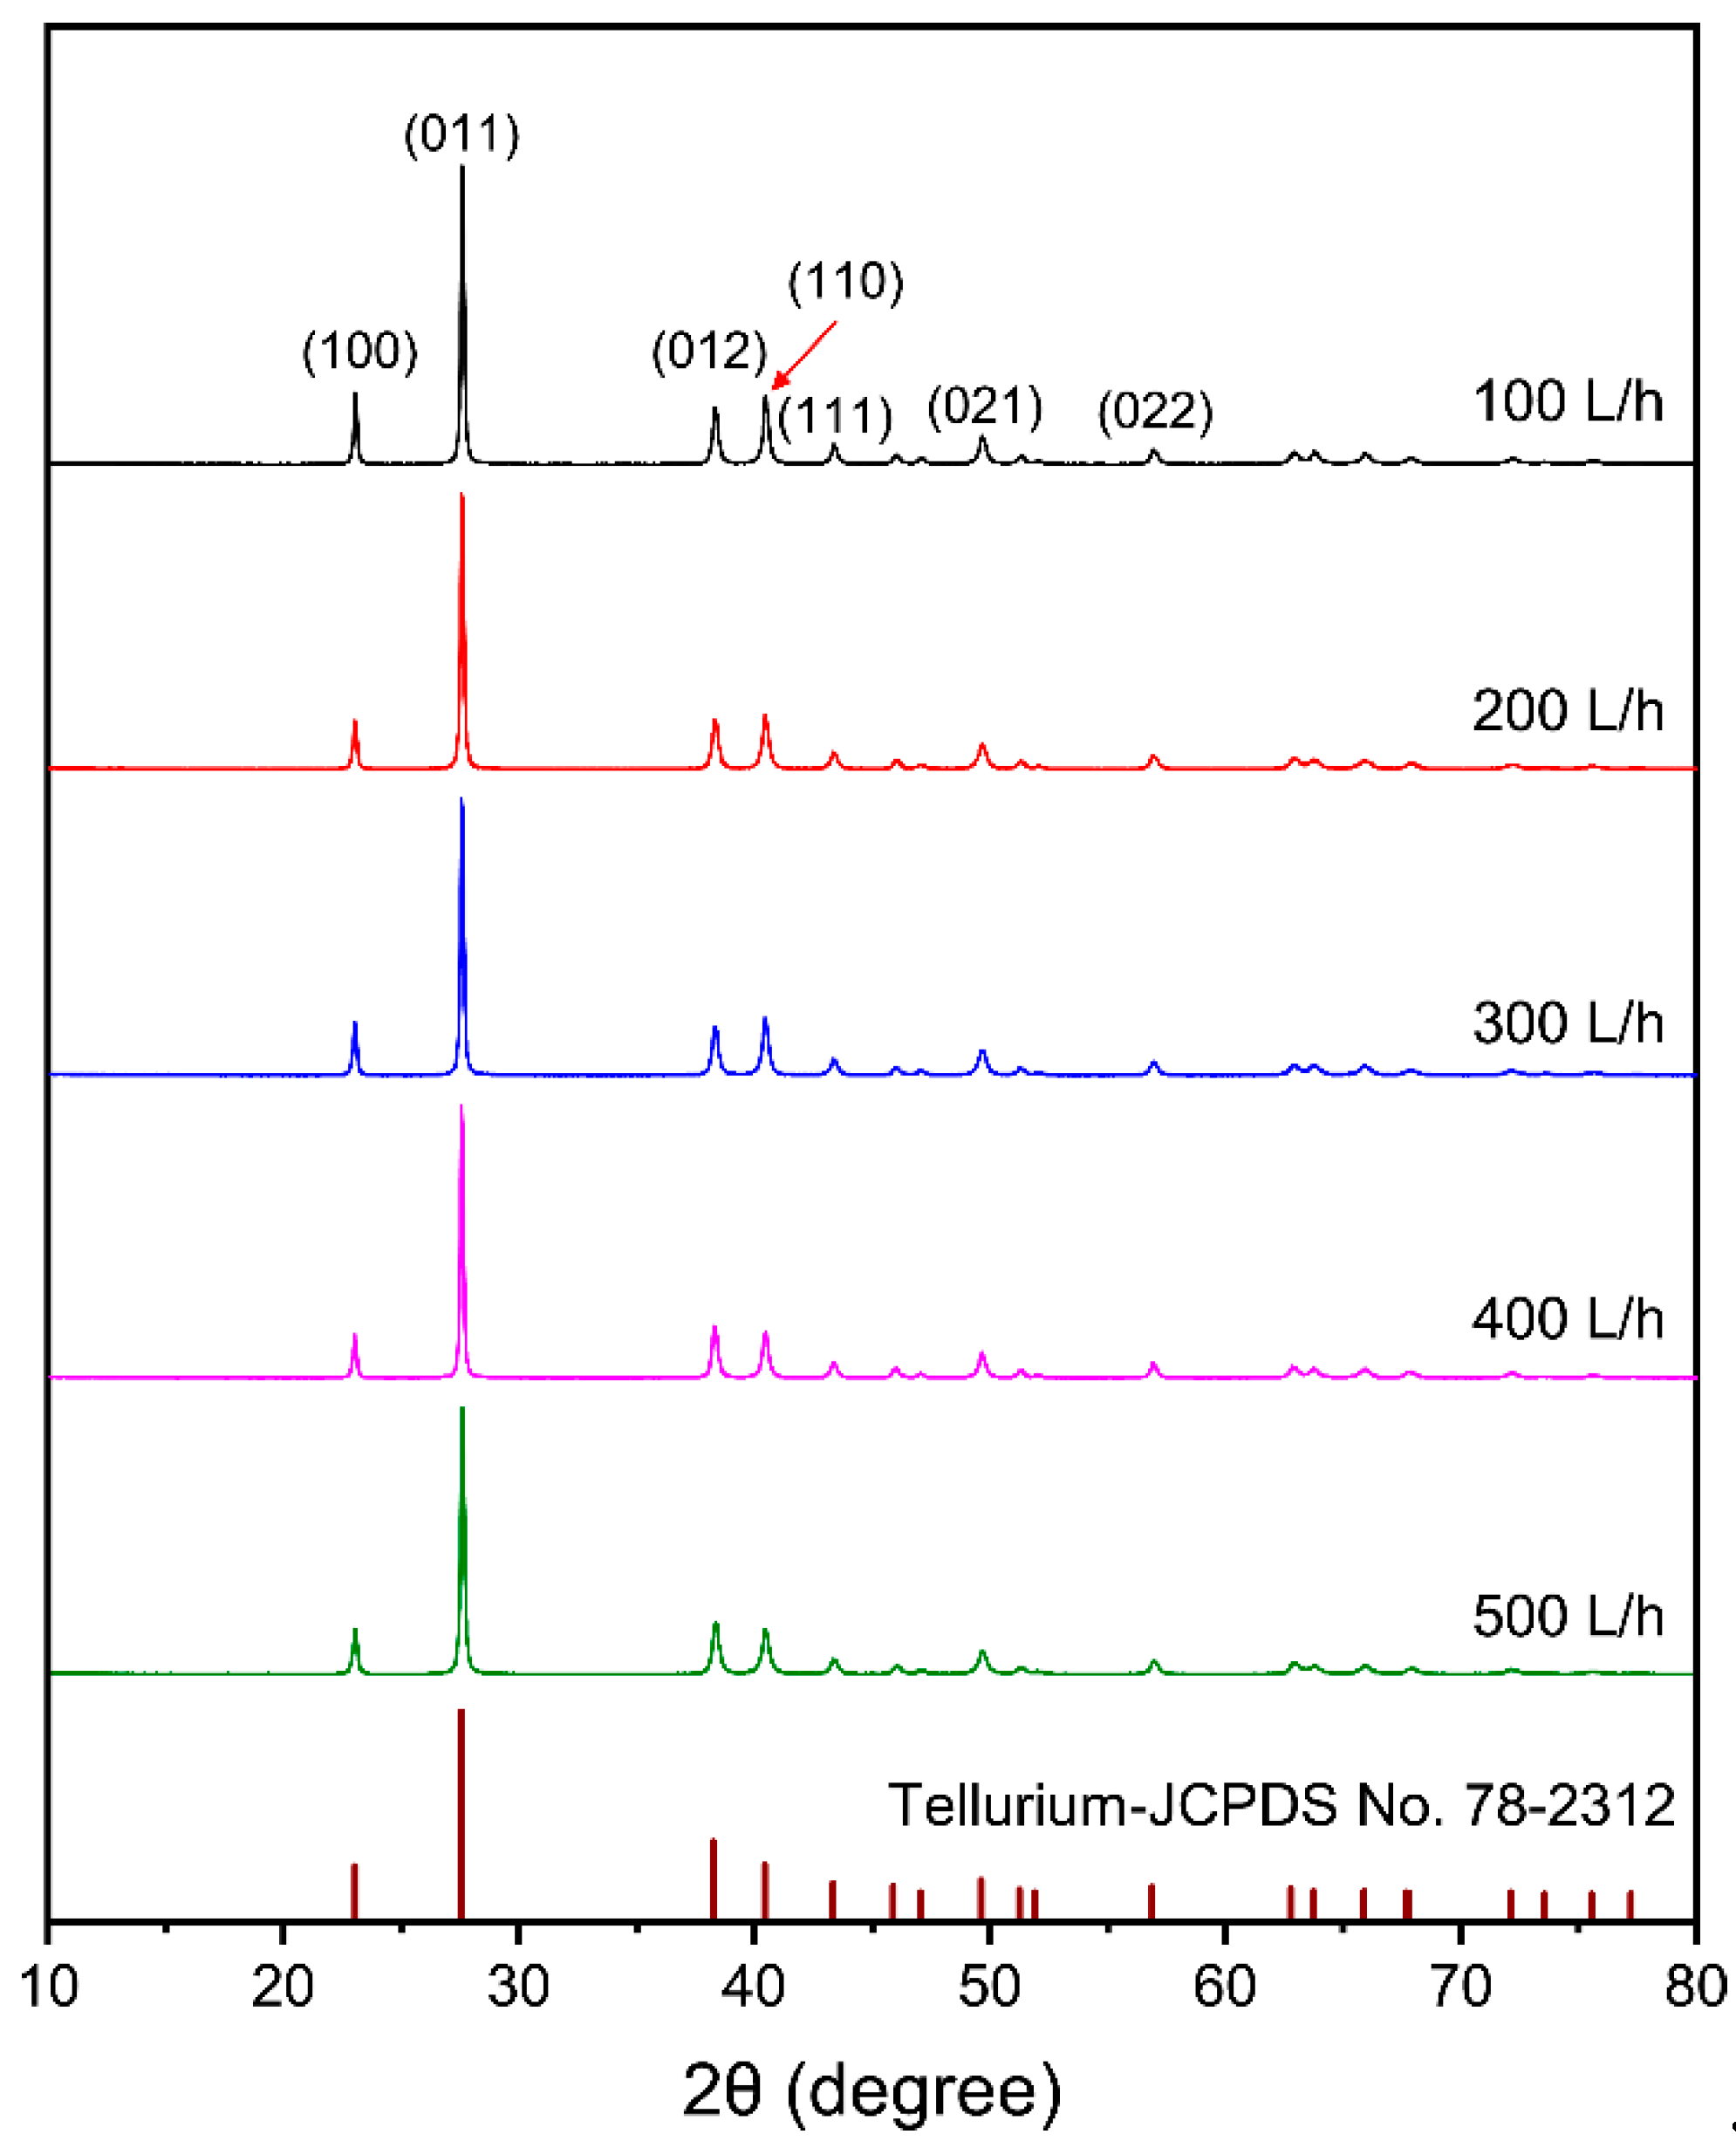
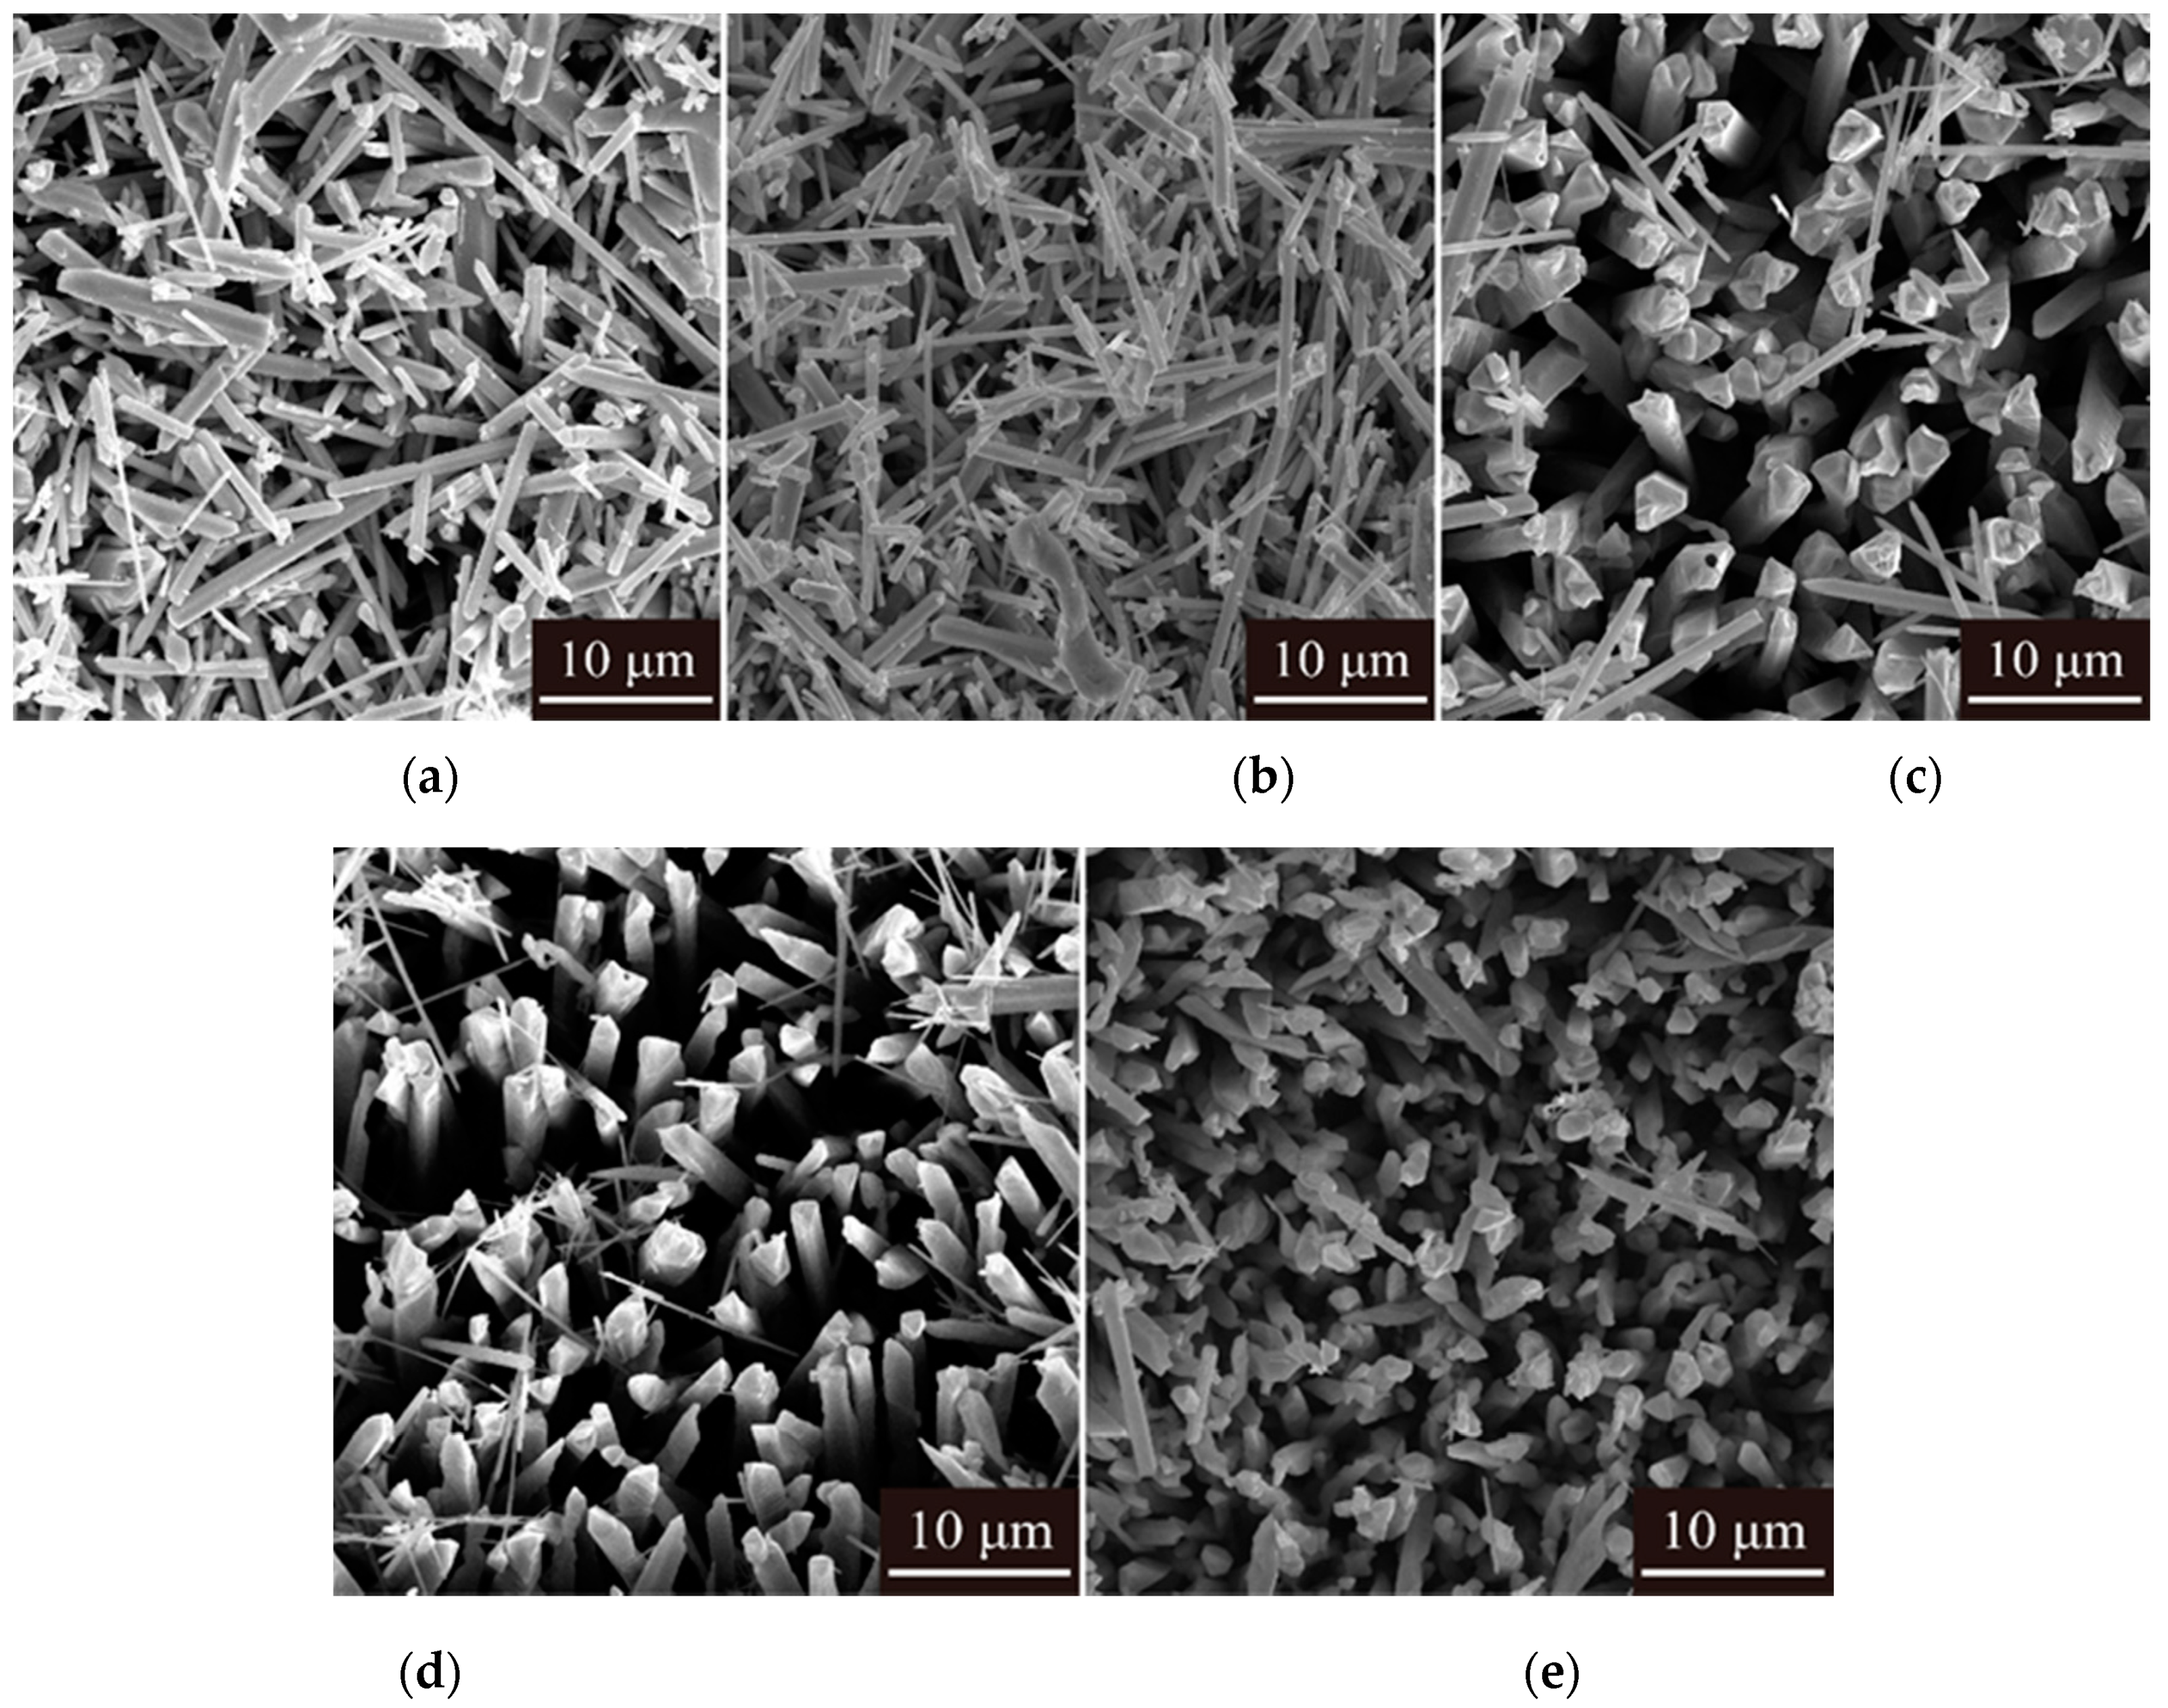
As exhibited in Figure 12, the change in flow rate did affect the crystal orientations as a result of varying mass transport characteristics. The order of preferred crystal orientation at a flow rate of 100 L/h was (011) (110) (012) (100). With an increase in electrolyte flow rate, the growth of (110) crystal plane was suppressed. At 400 L/h of flow rate, the order of preferred crystal orientation changed to (011) (012) (110) (100). The tellurium deposit morphology was affected significantly by the electrolyte flow rate. At 100–200 L/h, the surface morphology consisted of rod-like crystals of diameter sizes of 0.2–1 μm, randomly distributed throughout the deposit (Figure 13a,b). Increasing the flow rate to 300–500 L/h, a noticeable change in morphology was observed, resulting in an increase in crystal size and smooth grains. This can be ascribed to the enhanced mass transport at higher electrolyte flow rate [49].
According to the above results, the optimized conditions for tellurium cyclone electrowinning were determined to be current density of 80 A/m2, electrolyte temperature of 45 °C and electrolyte flow rate of 400 L/h. Under these conditions, the tellurium concentration in the leach liquor was reduced from 12.82 g/L to less than 0.62 g/L. 91.81% of current efficiency and 95.47% of tellurium recovery was achieved. The chemical composition of the tellurium deposits obtained is listed in Table 5. The results showed that the purity of the tellurium deposits was 99.38% and its main impurities were Se, Cu, S and Na. The tellurium deposits can be purified to 4N by vacuum distillation. The spent electrolyte could be recirculated to the leaching of the TSCS with addition of moderate sodium sulfide.

4. Conclusions

(1)
In this study, an efficient and selective process was proposed to recover tellurium from TSCS by sodium sulfide leaching followed by cyclone electrowinning;
(2)
A total of 88% of tellurium was selectively extracted in 40 g/L Na2S solution at 50 °C for 60 min with liquid to solid ratio of 8:1 mL/g, while antimony, lead and bismuth were enriched in the leaching residue;
(3)
Tellurium in the sodium sulfide leach liquor of the TSCS was directly electrowon by cyclone electrowinning. The optimized experimental conditions were found to be 80 A/m2 of current density, 45 °C of electrolyte temperature and 400 L/h of electrolyte flow rate. Under these conditions, the tellurium concentration in the leach liquor decreased from 12.81 to 0.62 g/L. A total of 91.81% of current efficiency and 95.47% of tellurium recovery were achieved. The average cell voltage and energy consumption were 1.98 V and 1.81 kWh/kg, respectively;
(4)
The purity of tellurium deposits reached 99.38%. Smooth and uniform tellurium deposits with rod-like crystal were obtained. The tellurium deposits showed a strong preferred orientation of (010). By increasing the current density and electrolyte flow rate and decreasing the temperature, the growth of (110) crystal planes was suppressed.

Author Contributions

Conceptualization, X.G.; methodology, D.L. and Z.X.; validation, Z.X. and Z.L.; investigation, Z.X., Z.L. and J.L.; data Curation, Z.X.; writing—original draft preparation, Z.X.; writing—review and editing, Z.X.; supervision, X.G. and Q.T.; funding acquisition, X.G.; Q.T. and Y.Y. All authors have read and agreed to the published version of the manuscript.

Funding

This research was funded by National Natural Science Foundation of China (Grant No. 51922108), Natural Science Foundation of Hunan Province (Grant No. 2019JJ20031), Hunan key research and development program (Grant No. 2019SK2061) and Qingyuan Innovation and Entrepreneurship Research Team Project (No.2018001) (Typical high purity rare metal preparation and industrialization team).

Conflicts of Interest

The authors declare no conflict of interest.

References

  1. Chivers, T.; Laitinen, R.S. Tellurium: A maverick among the chalcogens. Chem. Soc. Rev. 2015, 44, 1725–1739. [Google Scholar] [CrossRef] [PubMed]
  2. Shen, P.; Yang, Q.; Zhang, D.; Yang, S.; Fu, J. The effect of tellurium on the formation of MnTe-MnS composite inclusions in non-quenched and tempered steel. Metals 2018, 8, 639. [Google Scholar] [CrossRef] [Green Version]
  3. Huang, R.; Jiao, L.; Li, M.; Zhu, D. Effect of dilute tellurium and selenium additions on the high-temperature oxidation resistance of copper alloys. Oxid. Met. 2018, 89, 141–149. [Google Scholar] [CrossRef]
  4. Elshkaki, A.; Graedel, T.E. Dynamic analysis of the global metals flows and stocks in electricity generation technologies. J. Clean Prod. 2013, 59, 260–273. [Google Scholar] [CrossRef]
  5. Salim, H.K.; Stewart, R.A.; Sahin, O.; Dudley, M. Drivers, barriers and enablers to end-of-life management of solar photovoltaic and battery energy storage systems: A systematic literature review. J. Clean Prod. 2019, 211, 537–554. [Google Scholar] [CrossRef]
  6. Kavlak, G.; Graedel, T.E. Global anthropogenic tellurium cycles for 1940–2010. Resour. Conserv. Recycl. 2013, 76, 21–26. [Google Scholar] [CrossRef]
  7. Ahmad, K.; Afzaal, M.; Ritch, J.S.; Chivers, T.; O’Brien, P. Epitaxial CdTe rods on Au/Si Islands from a molecular compound. J. Am. Chem. Soc. 2010, 132, 5964–5965. [Google Scholar] [CrossRef]
  8. Bauer, D.; Diamond, D.; Li, J.; McKittrick, M.; Sandalow, D.; Telleen, P.U.S. Department of Energy Critical Materials Strategy; Department of Energy: Washington, DC, USA, 2011.
  9. Guo, X.Y.; Xu, Z.P.; Li, D.; Tian, Q.H.; Xu, R.Z.; Zhang, Z. Recovery of tellurium from high tellurium-bearing materials by alkaline sulfide leaching followed by sodium sulfite precipitation. Hydrometallurgy 2017, 171, 355–361. [Google Scholar] [CrossRef]
  10. Shao, L.; Diao, J.; Ji, C.; Li, G. A novel and clean process for extracting tellurium and bismuth from Dashuigou tellurium ore by oxidizing leaching. Hydrometallurgy 2020, 191, 105205. [Google Scholar] [CrossRef]
  11. Lee, J.C.; Kurniawan, K.; Chung, K.W.; Kim, S. Metallurgical process for total recovery of all constituent metals from copper anode slimes: A review of established technologies and current progress. Met. Mater. Int. 2020. [Google Scholar] [CrossRef]
  12. Ludvigsson, B.M.; Larsson, S.R. Anode slimes treatment: The Boliden experience. JOM 2003, 55, 41–44. [Google Scholar] [CrossRef]
  13. Halli, P.; Wilson, B.P.; Hailemariam, T.; Latostenmaa, P.; Yliniemi, K.; Lundstroem, M. Electrochemical recovery of tellurium from metallurgical industrial waste. J. Appl. Electrochem. 2020, 50, 1–14. [Google Scholar] [CrossRef] [Green Version]
  14. Bonificio, W.D.; Clarke, D.R. Bacterial recovery and recycling of tellurium from tellurium-containing compounds by Pseudoalteromonas sp EPR3. J. Appl. Microbiol. 2014, 117, 1293–1304. [Google Scholar] [CrossRef] [PubMed]
  15. Ha, Y.C.; Sohn, H.J.; Jeong, G.J.; Lee, C.K.; Rhee, K.I. Electrowinning of tellurium from alkaline leach liquor of cemented Te. J. Appl. Electrochem. 2000, 30, 315–322. [Google Scholar] [CrossRef]
  16. Rhee, K.I.; Lee, C.K.; Ha, Y.C.; Jeong, G.J.; Kim, H.S.; Sohn, H.J. Tellurium recovery from cemented tellurium with minimum waste disposal. Hydrometallurgy 1999, 53, 189–201. [Google Scholar] [CrossRef]
  17. Shuva, M.A.H.; Rhamdhani, M.A.; Brooks, G.A.; Masood, S.; Reuter, M.A. Thermodynamics data of valuable elements relevant to e-waste processing through primary and secondary copper production: A review. J. Clean Prod. 2016, 131, 795–809. [Google Scholar] [CrossRef]
  18. Sun, Z.M.; Zheng, Y.J. Preparation of high pure tellurium from raw tellurium containing Cu and Se by chemical method. Trans. Nonferrous Met. Soc. China 2011, 21, 665–672. [Google Scholar] [CrossRef]
  19. Awe, S.A.; Sundkvist, J.E.; Bolin, N.J.; Sandstrom, A. Process flowsheet development for recovering antimony from Sb-bearing copper concentrates. Miner. Eng. 2013, 49, 45–53. [Google Scholar] [CrossRef]
  20. Celep, O.; Alp, İ.; Deveci, H. Improved gold and silver extraction from a refractory antimony ore by pretreatment with alkaline sulphide leach. Hydrometallurgy 2011, 105, 234–239. [Google Scholar] [CrossRef]
  21. Barr, N.; De Denus, R.N.; Treasure, P.A. Mineral recovery apparatus. U.S. Patent 5,529,672, 25 June 1996. [Google Scholar]
  22. Jin, W.; Hu, M.Q.; Hu, J.G. Selective and efficient electrochemical recovery of dilute copper and tellurium from acidic chloride solutions. ACS Sustain. Chem. Eng. 2018, 6, 13378–13384. [Google Scholar] [CrossRef]
  23. Hong, J.B.; Xu, Z.P.; Li, D.; Guo, X.Y.; Yu, D.W.; Tian, Q.H. A pilot study: Efficient electrowinning of tellurium from alkaline solution by cyclone electrowinning technology. Hydrometallurgy 2020, 196, 105429. [Google Scholar] [CrossRef]
  24. Guo, X.Y.; Qin, H.; Tian, Q.H.; Li, D. Recovery of metals from waste printed circuit boards by selective leaching combined with cyclone electrowinning process. J. Hazard. Mater. 2020, 384, 121355. [Google Scholar] [CrossRef] [PubMed]
  25. Wang, Y.T.; Xue, Y.D.; Su, J.L.; Zheng, S.L.; Lei, H.; Cai, W.Q.; Jin, W. Efficient electrochemical recovery of dilute selenium by cyclone electrowinning. Hydrometallurgy 2018, 179, 232–237. [Google Scholar] [CrossRef]
  26. Jin, W.; Su, J.L.; Chen, S.F.; Li, P.; Moats, M.S.; Maduraiveeran, G.; Lei, H. Efficient electrochemical recovery of fine tellurium powder from hydrochloric acid media via mass transfer enhancement. Sep. Purif. Technol. 2018, 203, 117–123. [Google Scholar] [CrossRef]
  27. Xu, Z.P.; Guo, X.Y.; Tian, Q.H.; Li, D.; Zhang, Z.; Zhu, L. Electrodeposition of tellurium from alkaline solution by cyclone electrowinning. Hydrometallurgy 2020, 193, 105316. [Google Scholar] [CrossRef]
  28. Benmadani, Y.; Kermaoui, A.; Chalal, M.; Khemici, W.; Kellou, A.; Pellé, F. Erbium doped tellurite glasses with improved thermal properties as promising candidates for laser action and amplification. Opt. Mater. 2013, 35, 2234–2240. [Google Scholar] [CrossRef]
  29. Zhang, Y.; Lu, C.; Feng, Y.; Sun, L.; Ni, Y.; Xu, Z. Effects of GeO2 on the thermal stability and optical properties of Er3+/Yb3+-codoped oxyfluoride tellurite glasses. Mater. Chem. Phys. 2011, 126, 786–790. [Google Scholar] [CrossRef]
  30. Christie, A.B.; Sutherland, I.; Walls, J.M. Studies of the composition, ion-induced reduction and preferential sputtering of anodic oxide films on Hg0.8Cd0.2Te by XPS. Surf. Sci. 1983, 135, 225–242. [Google Scholar] [CrossRef]
  31. Wagner, C.D. Chemical shifts of auger lines, and the auger parameter. Faraday Discuss. Chem. Soc. 1975, 60, 291–300. [Google Scholar] [CrossRef]
  32. Anderson, C.G. The metallurgy of antimony. Chem. Erde Geochem. 2012, 72, 3–8. [Google Scholar] [CrossRef]
  33. Feigl, F. Chemistry of Specific, Selective and Sensitive Reactions; Academic Press: New York, NY, USA, 1949. [Google Scholar]
  34. Li, B.; Wang, X.; Wei, Y.; Wang, H.; Barati, M. Extraction of copper from copper and cadmium residues of zinc hydrometallurgy by oxidation acid leaching and cyclone electrowinning. Miner. Eng. 2018, 128, 247–253. [Google Scholar] [CrossRef]
  35. Rudnik, E. Investigation of industrial waste materials for hydrometallurgical recovery of zinc. Miner. Eng. 2019, 139, 105871. [Google Scholar] [CrossRef]
  36. Handle, B.; Broderick, G.; Paschen, P. A statistical response surface study of the tellurium electrowinning process. Hydrometallurgy 1997, 46, 105–120. [Google Scholar] [CrossRef]
  37. Zhao, T.C. The Metallurgy of Antimony; Central South University of Technology Press: Changsha, China, 1988. [Google Scholar]
  38. Awe, S.A.; Sandström, Å. Electrowinning of antimony from model sulphide alkaline solutions. Hydrometallurgy 2013, 137, 60–67. [Google Scholar] [CrossRef]
  39. Cooper, W.C. Tellurium; Van Nostrand Reinhold: New York, NY, USA, 1971. [Google Scholar]
  40. Zhang, R.L.; Huang, A.D.; Guo, H.; Lu, Q.Y.; Ju, D.C.; Yang, Z.B. Preparation of zinc powders by acid electrowinning. Russ. J. Nonferrous Metals 2019, 60, 173–178. [Google Scholar] [CrossRef]
  41. Youbi, B.; Lghazi, Y.; Ait Himi, M.; Bimaghra, I. Nucleation and growth mechanism of tellurium electrodeposited on tin-doped indium oxide substrate. J. Appl. Electrochem. 2020, 50, 159–168. [Google Scholar] [CrossRef]
  42. Dobrosz-Gomez, I.; Ramos Garcia, B.D.; GilPavas, E.; Gomez Garcia, M.A. Kinetic study on HCN volatilization in gold leaching tailing ponds. Miner. Eng. 2017, 110, 185–194. [Google Scholar] [CrossRef]
  43. Wu, T.J.; Zhang, M.L.; Lee, K.H.; Lee, C.M.; Lee, H.K.; Choa, Y.; Myung, N.V. Electrodeposition of compact tellurium thick films from alkaline baths. J. Electrochem. Soc. 2017, 164, D82–D87. [Google Scholar] [CrossRef]
  44. Peng, X.; Fall, M.; Haruna, S. Sulphate induced changes of rheological properties of cemented paste backfill. Miner. Eng. 2019, 141, 105849. [Google Scholar]
  45. Li, R.; Huang, H.; Wang, J.J.; Liang, W.; Gao, P.; Zhang, Z.; Xiao, R.; Zhou, B.; Zhang, X. Conversion of Cu(II)-polluted biomass into an environmentally benign Cu nanoparticles-embedded biochar composite and its potential use on cyanobacteria inhibition. J. Clean Prod. 2019, 216, 25–32. [Google Scholar] [CrossRef]
  46. Kalliomaki, T.; Wilson, B.P.; Aromaa, J.; Lundstrom, M. Diffusion coefficient of cupric ion in a copper electrorefining electrolyte containing nickel and arsenic. Miner. Eng. 2019, 134, 381–389. [Google Scholar] [CrossRef]
  47. Carissimi, E.; Rubio, J. Polymer-bridging flocculation performance using turbulent pipe flow. Miner. Eng. 2015, 70, 20–25. [Google Scholar] [CrossRef]
  48. Carotenuto, G.; Palomba, M.; De Nicola, S.; Ambrosone, G.; Coscia, U. Structural and Photoconductivity Properties of Tellurium/PMMA Films. Nanoscale Res. Lett. 2015, 10, 313. [Google Scholar] [CrossRef] [PubMed] [Green Version]
  49. Fernando Perez, J.; Llanos, J.; Saez, C.; Lopez, C.; Canzares, P.; Andres Rodrigo, M. Towards the scale up of a pressurized-jet microfluidic flow-through reactor for cost-effective electro-generation of H2O2. J. Clean Prod. 2019, 211, 1259–1267. [Google Scholar] [CrossRef]
Figure 1. XRD patterns (a) and XPS spectra of Te 3d (b) of TSCS.
Metals 10 01176 g001
Figure 2. Schematic diagram of the tellurium cyclone electrowinning reactor.
Metals 10 01176 g002
Figure 3. Effect of Na2S concentration (a), leaching temperature (b), leaching time (c), and liquid to solid ratio (d) on sodium sulfide leaching of TSCS (conditions: (a) leached at 50 °C for 60 min with L/S ratio of 10:1 mL/g); (b) leached in 40 g/L Na2S solution for 60 min with L/S ratio of 10:1 mL/g; (c) leached in 40 g/L Na2S solution at 50 °C with L/S ratio of 10:1 mL/g; (d) leached in 40 g/L Na2S solution at 50 °C for 60 min).
Metals 10 01176 g003
Figure 4. XRD patterns of the sodium sulfide leaching residue of TSCS.
Metals 10 01176 g004
Figure 5. Effect of current density on tellurium cyclone electrowinning at 45 °C and 400 L/h flow rate of electrolyte (a) current efficiency and tellurium recovery, (b) average cell voltage and energy consumption.
Metals 10 01176 g005
Figure 6. XRD patterns of tellurium deposits obtained at different current densities.
Metals 10 01176 g006
Figure 7. FESEM micrographs of tellurium deposits obtained at different current density (a) 40 A/m2, (b) 60 A/m2, (c) 80 A/m2, (d) 100 A/m2, (e) 120 A/m2.
Metals 10 01176 g007
Figure 8. Effect of temperature on tellurium cyclone electrowinning at 80 A/m2 and 400 L/h flow rate of electrolyte (a) current efficiency and tellurium recovery, (b) average cell voltage and energy consumption.
Metals 10 01176 g008
Figure 9. XRD patterns of tellurium deposits obtained at different electrolyte temperatures.
Metals 10 01176 g009
Figure 10. FESEM micrographs of tellurium deposits obtained at different electrolyte temperatures (a) 20 °C, (b) 30 °C, (c) 45 °C, (d) 60 °C, (e) 70 °C.
Metals 10 01176 g010
Figure 11. Effect of flow rate of electrolyte on tellurium cyclone electrowinning at 80 A/m2 and 45 °C (a) current efficiency and tellurium recovery, (b) average cell voltage and energy consumption.
Metals 10 01176 g011
Figure 12. XRD patterns of tellurium deposits obtained at different flow rate of electrolyte.
Metals 10 01176 g012
Figure 13. FESEM micrographs of tellurium deposits obtained at different flow rate of electrolyte (a) 100 L/h, (b) 200 L/h, (c) 300 L/h, (d) 400 L/h, (e) 500 L/h.
Metals 10 01176 g013
Table 1. Assay of the tellurium-bearing sodium carbonate slag (TSCS) (representative sample).
ElementSbTePbNaBiZnSiFeAlSeCu
Wt.%23.6011.6011.509.745.211.712.292.161.490.970.95
Table 2. The standard molar Gibbs free energy of formation of related compounds and ions at 25 °C in the sodium sulfide leaching process.
Species T e O 3 2 Na2TeO4NaSb(OH)6 S 2 O H
Δ f G m θ (kJ/mol) −392.98−980.85−1487.5185.66−157.32
Species T e S 3 2 T e S 4 2 S b S 4 3 H2O N a +
Δ f G m θ (kJ/mol)−110.91−45.87−36.19−237.14−261.88
Table 3. Chemical composition of the sodium sulfide leaching residue of TSCS.
ElementSb PbNaBiSFeTeSiZnAlCuSe
Wt.%25.5212.648.066.044.403.342.802.121.911.511.030.56
Table 4. Chemical composition of the sodium sulfide leach liquor of TSCS.
ElementTeSeCu 1As 1Sb 1Fe 1Pb 1Ni 1
Concentration (g/L)12.820.4722.0223.3412.711.560.160.13
1 mg/L.
Table 5. Chemical composition of the tellurium deposits.
ElementTeSeCuSNa 2Zn 2Sb 2Pb 2Ni 2
wt (%)99.380.510.0330.06048.0836.907.045.6511.80
2 mg/kg.