Article

Optimization of PWHT of Simulated HAZ Subzones in P91 Steel with Respect to Hardness and Impact Toughness

Faculty of mechanical engineering, University of Maribor, Smetanova ulica 17, 2000 Maribor, Slovenia
*
Author to whom correspondence should be addressed.
Metals 2020, 10(9), 1215; https://doi.org/10.3390/met10091215
Submission received: 30 July 2020 / Revised: 28 August 2020 / Accepted: 4 September 2020 / Published: 9 September 2020

Abstract

:
Appropriate post weld heat treatment (PWHT) is usually obligatory when creep resistant steels are welded for thermal power plant components that operate at elevated temperatures for 30-40 years. The influence of different PWHTs on the microstructure, hardness, and impact toughness of simulated heat affected zone (HAZ) subzones was studied. Thereby, coarse grained HAZ, two different fine grained HAZ areas, and intercritical HAZ were subjected to 20 different PWHTs at temperatures 740–800 °C and durations 0.5–8 h. It was found that the most commonly recommended PWHT, of 3 h or less at 760 °C, is insufficient with respect to the hardness and impact toughness of coarse grained HAZ. To obtain a Vickers hardness ≤ 265 HV and impact toughness at least equal to the impact toughness of the base metal (192 J) in the coarse grained HAZ, it took 8 h at 740 °C, 4 h at 760 °C, more than 1 h at 780 °C, and 0.5 h and 800 °C. Even after 8 h at 800 °C, mechanical properties were still within the target range. The most recommendable post weld heat treatments at 780 °C for 1.2–2 h or at 760 °C for 3–4 h were identified. All specimens subjected to these treatments exhibited appropriate hardness, impact toughness, and microstructure.

1. Introduction

Numerous important thermal power plant components, e.g., steam pipelines, boilers, and heat exchangers etc., operate at elevated temperatures and high pressures. Therefore, these components need to be creep and corrosion resistant through their lifetime of 30–40 years. Occasionally, the power plants are stopped for maintenance. Thus, the materials need to assure not only safe operation at elevated temperatures, but also safe stop (cooling down) and restart of the thermal power plant (heating up). Although the creep strength is the prime consideration for elevated temperature applications, notch toughness is also important, especially for welded components, as it is essential to meet the pressure test and other requirements at room temperature [1]. From weld joints, similar properties are expected as from the base materials. To assure adequate properties of weld joints in high temperature creep resistant steels, the selection of an appropriate welding technology demands a lot of attention [2,3,4,5,6]. Preheating before welding is needed to avoid cold hydrogen cracking [6]. Heat input during welding must not to be too high in order to enable multipass welding with a pass in a diameter of 2–3 mm and appropriate cooling rates of the welds. During welding, the interpass temperatures must be controlled and held above the preheating temperature. After welding, the welded components must cool down slowly at controlled cooling rates.
The critical areas of weld joints are heat-affected zones (HAZs). Upon heating and subsequent rapid cooling, unfavorable changes occur in the microstructure, which can result in unacceptable mechanical properties of the material. Therefore, most of the weld joints need to be post weld heat treated (PWHT) with controlled heating and cooling.
One of the widely used creep resistant steels in the power generation industry is P91 according to ASTM A335/A335M [7,8,9]. P91 is a steel of the newer generation, developed for manufacturing pipes and vessels for a fast breeder reactor [10]. It is tough, readily weldable, and exhibits a high creep strength up to 600 °C [11], and according to some authors [12], even up to 660 °C. In addition, P91 also exhibits good resistance to thermal fatigue and corrosion cracking [13].
Welding, microstructures, mechanical properties, and PWHT of P91 steel have attracted a lot of attention in recent years. Up to now, welds made with different welding processes, including laser and electron beam welding, different welding parameters [9,14,15,16,17,18], welding process efficiency [19], effects of preheat temperatures and interpass temperatures [20], defects in welds [21,22], tribological properties [23], fatigue behavior [24], and effects of creep [25,26,27] were studied thoroughly. A critical issue that limits the creep strength of P91 weldments under service conditions is type IV cracking [28,29]. Studies of cracks in weld joints revealed that they occur mostly in HAZ [2,30,31,32,33]. Fine grained HAZ (FGHAZ) adjacent to intercritical HAZ (ICHAZ) [31] and ICHAZ [34,35] were identified as the most susceptible areas.
After welding [36,37] or after the interruption of welding [38], PWHT is unavoidable for tempering the martensite formed during welding. Therefore, numerous researchers focused on PWHT. It was found that the temperature of PWHT must be below A1, otherwise alpha ferrite and fresh martensite can form, which are detrimental to the weld metal and HAZ’s creep strength and toughness [39,40]. There are indications that alpha ferrite and fresh martensite can occur even below A1–therefore, the recommended temperature for safe PWHT should be about 30 °C below A1 [41]. It must be taken into account that the transformation temperatures depend on the material’s actual chemical composition, predominantly on Mn and Ni content [42], and therefore the maximum PWHT temperature can vary with respect to the chemical composition. Higher Mn + Ni contents decrease A1 [43]. The A1 temperature of P91 steel can lie between 788 °C and 813 °C [39]. Some authors [12,39,41] reported that ASME Boiler and Pressure Vessel Code, Section II, Part A limits the maximum PWHT temperature with respect to the chemical composition of P91: 800 °C if Mn + Ni is below 1 wt.% and 790 °C if Mn + Ni is between 1.0 wt.% and 1.5 wt.%. However, in the 2013 edition of the code [44], this differentiation no longer exists. Moreover, if the chemical composition is within the limits specified in ASTM A 335/A 335M, the content of Mn + Ni cannot exceed 1.0 wt.%. Therefore, the code in the 2013 edition recommends consumables with max. Mn + Ni content 1 wt.% for repair welding [44] p. 725, and PWHT/subcritical annealing temperatures 730–800 °C without additional limitations with respect to Mn + Ni contents ([44] p. 567). Nevertheless, most authors recommend PWHT temperatures up to 780 °C: 760–780 °C [41], 730–770 °C [45], up to 770 °C [35], 750–770 °C [46], and 760 °C [47]. The majority of researchers who did not focus on the optimization of PWHT temperature applied 760 °C, e.g., [26,36,43,48,49,50], in most cases for a duration of 2–3 h.
Not many researchers tested different PWHT temperatures on different HAZ areas. Ohlsson [51] studied the influence of PWHT temperature on weld metal and HAZ in real welds, where the duration of PWHT was always 1 h, and different areas of HAZ were not distinguished. Abd El-Rahman et al. [36,52] investigated the microstructures and hardness of different HAZ areas, where PWHT was always at 760 °C for 3.5 h.
A HAZ in a real weld is a narrow and inhomogeneous transition zone, in which the microstructure (and with it also mechanical properties) continuously changes from the weld metal to the unaffected base metal across a very short distance. With respect to mechanical testing, the most inconvenient fact is that the width of individual HAZ subzones is very small. The total width of HAZ can be only a few tenths of a millimeter [53] if the welding was done with low heat input. Therefore, any tests (except microscopy and micro hardness measurements) on real weld HAZs are problematic or even impossible [2,53,54]. For instance, if in a Charpy test piece the area in which the rupture occurs exhibits an inhomogeneous microstructure (like a real weld HAZ does), the energies for the initiation and propagation of the crack and the path of the crack are influenced by all the different microstructures through which the crack propagates. Therefore, the results depend on the microstructure at the bottom of the notch, and on the number and fractions of different types through which the crack propagates. Furthermore, even microstructures in the vicinity of the fracture surface exhibit an influence. It is practically impossible to assure that two test pieces cut from a real weld HAZ would have identical microstructures in the area of rupture. Consequently, the scattering of results is enormous, and the results cannot be linked to only one certain type of microstructure. In order to obtain reliable data on mechanical properties in relation to microstructure, a larger volume of homogeneous microstructure is inevitable. The most suitable way to produce sufficiently large volumes of material exhibiting a homogeneous microstructure of a certain type is the simulation of microstructures [2,53,54,55]. Several research groups confirmed suitability of simulated material for mechanical tests [2,53,56]. They compared microstructures and hardness of real weld HAZs with simulated HAZ microstructures. A good agreement of microstructures and hardness of the simulated HAZ subzones with real HAZ subzones was established if the real workpiece and the simulated material experienced equal thermal cycles.
Considering all this, simulated microstructures are more suitable for studying the influences of different PWHTs on the mechanical properties of individual HAZ subzones, and the results of Charpy impact tests on simulated test pieces can be regarded as more reliable than those obtained with test pieces cut from real weld HAZs. Nevertheless, simulated material for the study of HAZ subzones was used less frequently than expected.
Simulated HAZ subzones were used by Sulaiman [57] and Vuherer at al. [2,58], but they applied only one PWHT, at 760 °C for 135 min and 2 h, respectively. Variations of PWHT temperature from 600 to 840 °C were reported by Silwal [40] whereby the duration was always 2 h and the peak temperatures in simulated HAZ areas were not reported. Further, 760 °C was found as the optimum. Vimalan et al. [41] studied the influence of PWHT temperature on transformation temperatures during PWHT. Only one peak temperature (1050 °C) was simulated and heat treatments were done at temperatures in the range from 770 °C to 850 °C, but always for 0.5 h, and no impact toughness tests were done. Milović et al. [59] investigated microstructures of simulated HAZ thoroughly. They applied 12 different peak temperatures from 850 °C to 1385 °C, while PWHT was always at 730 °C for 1 h.
In addition, research of P91 steel conducted after years of service at high temperatures is rare. If at all, it was used predominantly to investigate the influences of aging and creep on microstructures and mechanical properties [27,60]. In relation to PWHT, old material was used by Huysmans and Vekeman [20] who tested different preheat/interpass temperatures and welding parameters on a P91 tube after 56,000 h of service, in order to develop a weld repair procedure without PWHT.
In the power plant at Šoštanj, the welds on P91 tubes were welded and post weld heat-treated according to the certified welding procedure. In the process of welding procedure certification, mechanical tests of the welds were carried out according to the standard DIN EN 288-3, i.e., on real weld HAZ specimens. The hardness and the impact toughness of HAZ were found adequate and consequently, the authorized safety monitoring agency (TÜV) approved the welding procedure. In spite of that, in some welds welded in the PF position, type IV cracks occurred in HAZ during operation. This was an indication that the mechanical properties in one of the HAZ subzones were most likely inadequate due to an insufficient PWHT. Therefore, the power plant desired additional verification/optimization of the PWHT before they would repair the damaged components.
Meanwhile, DIN EN 288-3 was replaced by EN ISO 15614-1. However, the new standard also requires tests of specimens cut from real welds. As the HAZ in real welds is a narrow and inhomogeneous transition zone, the results of Charpy impact tests must be regarded as an average of all the influences exhibited by different microstructures through which a crack propagated. It is possible that one area on the crack’s path is too brittle while the others are sufficiently tough to raise the total impact energy far above the required minimum value. A similar case applies for the hardness as the hardness has to be measured in lines across the weld joint (the number of lines depends on the thickness of the material and the weld type). Only three indentations are required on each line in the HAZ on each side of the weld. Consequently, it is likely that at least some of the areas exhibiting excessive hardness will not be detected. Nevertheless, even the presence of very small areas with inadequate toughness and hardness may cause the occurrence of cracks during operation. Unfortunately, the presence of such small areas cannot be reliably detected by the tests of real weld specimens. To confirm their presence after PWHT, mechanical tests of individual HAZ subzones are necessary. However, no publications reporting the influences of different PWHT time–temperature combinations on impact toughness of different HAZ subzones could be found in the open literature. Therefore, this work focuses on the hardness and impact toughness of simulated HAZ subzones after PWHT at several different temperatures and durations. In addition, the results of PWHTs comparable to the one certificated for the defective welds were compared with the results of mechanical tests of real weld HAZs obtained in the process of the welding procedure certification.

2. Materials and Methods

2.1. Material

Creep resistant steel for elevated temperatures, namely P91 according to ASTM A335/A355M, which had already been in service for three years in the thermal power plant at Šoštanj, Slovenia, was used in this investigation. The operating temperature of the pipeline was up to 580–600 °C. The chemical composition according to the material’s certificate and mechanical properties are presented in Table 1 and Table 2. According to the ASTM specification, the hardness of this steel must not exceed 265 HV (=250 HB Brinell hardness).
Specimens measuring 11 mm × 11 mm × 56 mm were cut out from a pipe with a wall thickness of 22 mm. After HAZ-simulation and PWHT, they were machined to ISO-V specimens according to EN ISO 148-1.

2.2. Simulation of HAZs

Four different HAZ sub zones were simulated. The hardest and the most brittle CGHAZ (Tpeak >>> AC3) and FGHAZ-1 (Tpeak >> AC3), and the most susceptible zones for type IV cracking [31,34,35], FGHAZ-2 (Tpeak > AC3) and ICHAZ were simulated. A weld thermal cycle simulator Smitweld 1405 (Smitweld b.v. (now Lincoln Smitweld b.v.), Nijmegen, The Netherlands) was used for simulations. Areas of interest are shown schematically in Figure 1a, and a specimen during simulation in Figure 1b.
First of all, heating rates and cooling times from 800 °C to 500 °C (Δt8–5) in different regions of HAZs were measured during real repair-welding in the power plant. A series of thermocouples was placed at different distances from the weld-groove. Heating rates about 150 °C s−1 and Δt8–5 around 10 s were measured, with little differences between the different HAZ subzones. Therefore, Δt8–5 = 10 s was selected for further experimental work. In real welding, the Δt8–5 is mostly a little longer. However, Lomozik and Zielinska-Lipiec [61], who studied the influence of Δt8–5 on the hardness of simulated HAZ subzones, found out that an increase of Δt8–5 from 6 s to 24 s resulted in a decrease of hardness of only a few Vickers units. Moreover, even at welding with high heat inputs and high interpass temperatures, the transformation of austenite to untampered martensite cannot be prevented. Namely, in the CCT diagram of P91 [5], the ferrite transformation nose is far on the right side. At the critical cooling rate, the Δt8–5 is over 2.5 h and the hardness is still above 430 HV.
As the conditions during a weld thermal cycle are far from thermodynamic equilibrium, transformation temperatures AC1, AC3, Ms, and Mf were determined from the TL curves, recorded on a weld thermal cycle simulator Smitweld 1405 during preliminary tests. Characteristic T-t and TL curves are presented in Figure 2.
The peak temperatures and other parameters for the simulation of different HAZ subzones are summarized in Table 3. The peak temperatures for the simulation of ICHAZ were selected on the basis of the determined AC1 and AC3. In several tests, AC1 reached up to 870 °C, and AC3 was from 920 °C to 925 °C. For simulation of soft FGHAZ-2 in the immediate vicinity of ICHAZ, the temperature was selected slightly above AC3, also taking into account the results of Milović et al. [59], who found that the hardness of FGHAZ was the lowest in the area where the peak temperature was up to 950 °C. The highest temperature that the simulator can reach was applied for CGHAZ. Dilatation curves recorded during simulations confirmed that the transformation temperatures did not exceed the limits established in test trials.
Consistent with recommendations for real welding [20,37,38], each specimen was preheated to 200 °C before the start of the simulation.

2.3. Post Weld Heat Treatments

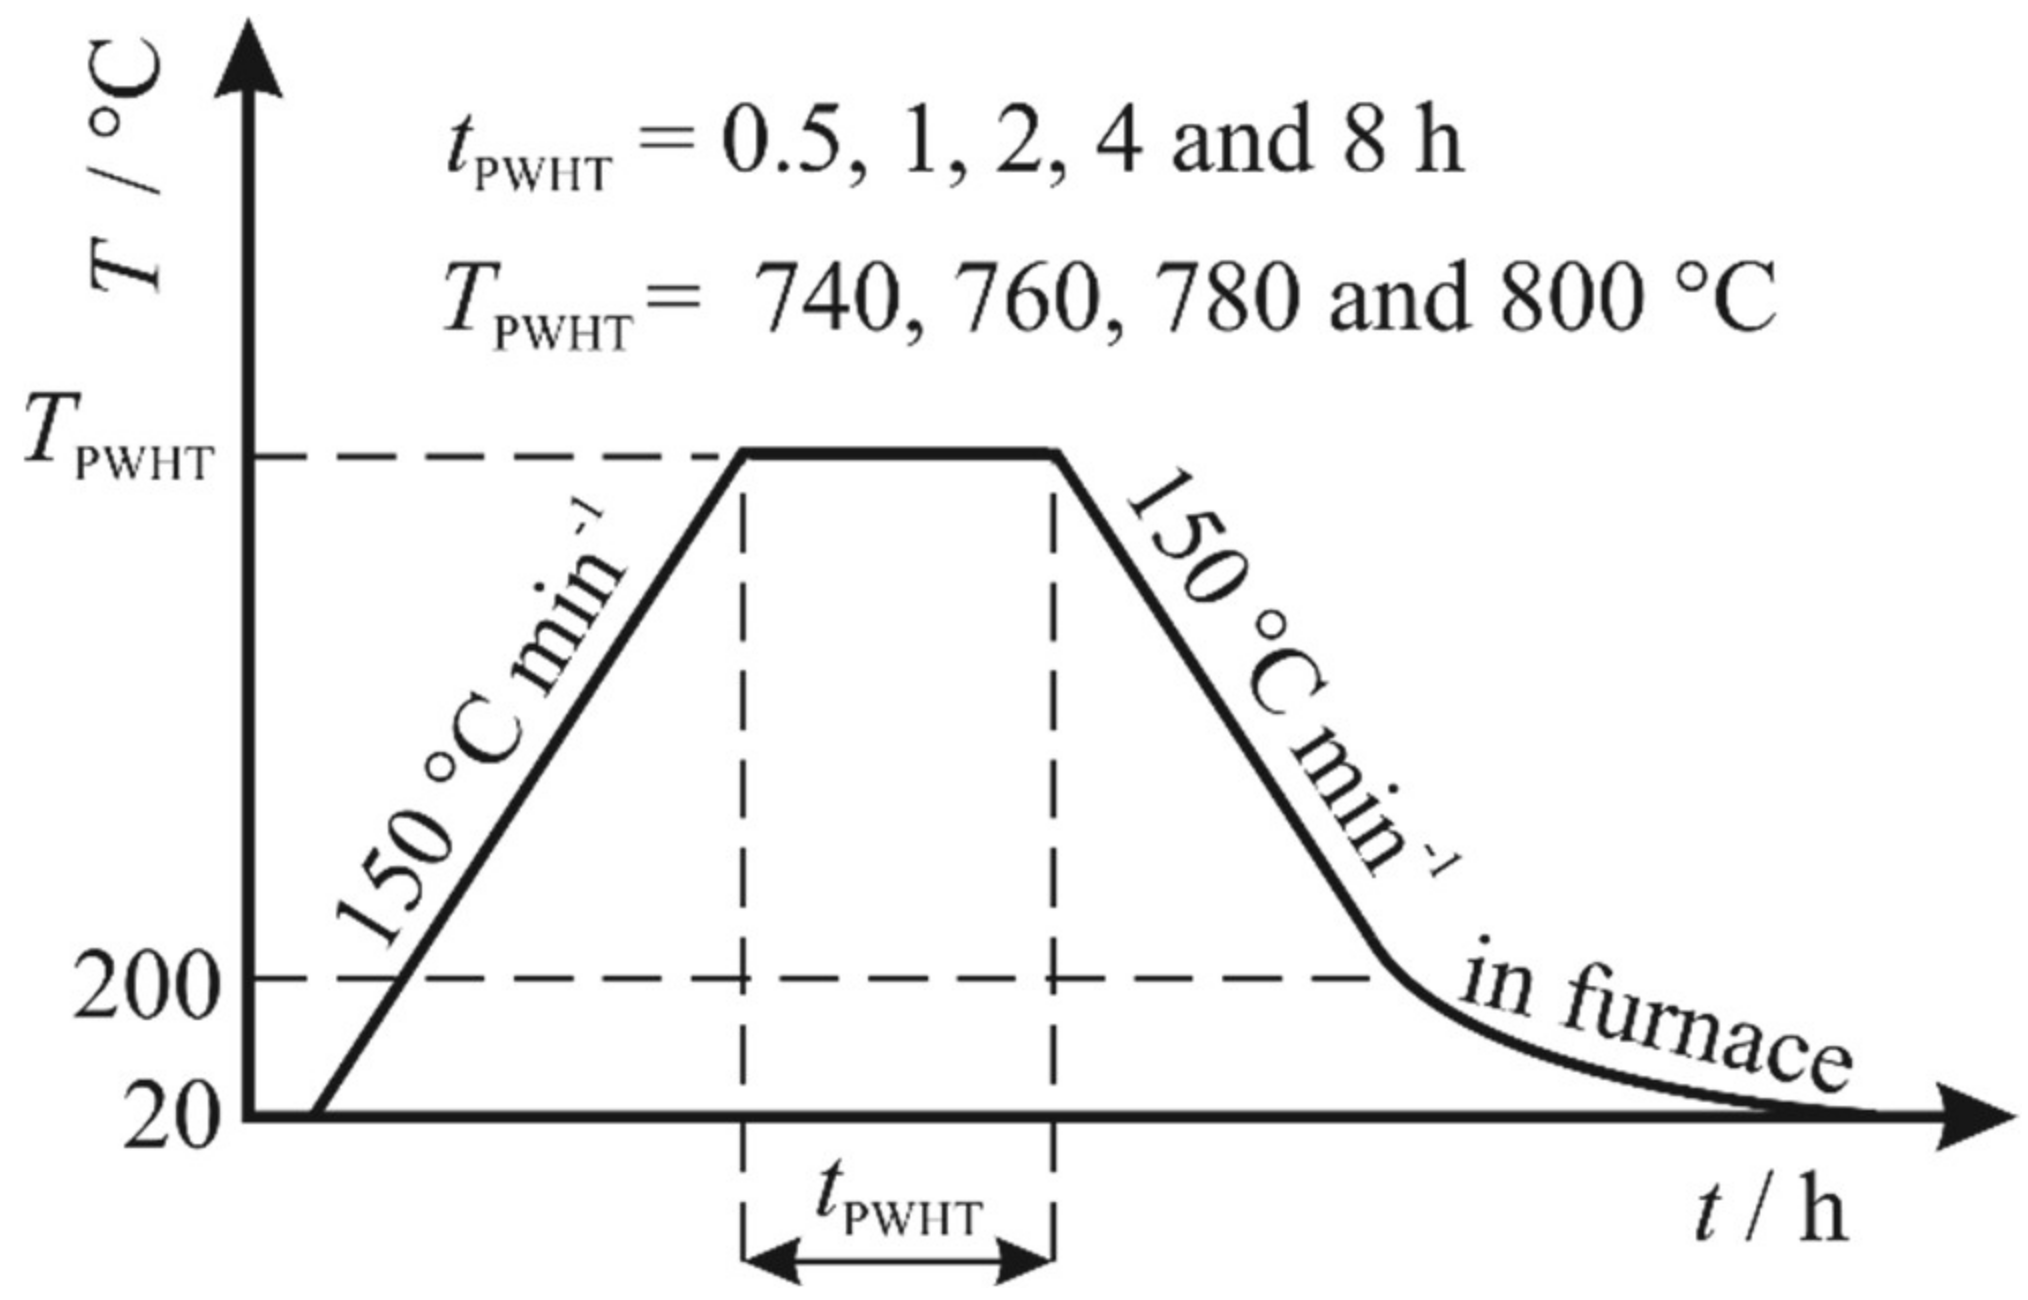
All PWHTs were performed in the laboratory chamber furnace Bosio EUP-K (Bosio d.o.o., Bukovžlak, Slovenia) 20/1200. On each simulated HAZ subzone, 20 different heat treatments were tested: PWHT temperatures were 740, 760, 780, and 800 °C, and soaking times at each temperature were 0.5, 1, 2, 4, and 8 h. The heating and cooling rates were 150 °C h−1, which was consistent with recommendations found in the literature [2,12,38]. Below 200 °C, the cooling rate was not controlled, and corresponded to the “natural” cooling rate of the furnace. The regimes of heat treatments are shown in Figure 3. One set of simulated specimens was left without heat treatment.

2.4. Examinations

After HAZ simulation and PWHT, the test pieces were machined to ISO-V specimens according to EN ISO 148-1.
Hardness HV 10 was measured before the impact tests. Measurements were performed with a hardness tester Shimadzu HMV-2000 (Shimadzu Corporation, Kyoto, Japan).
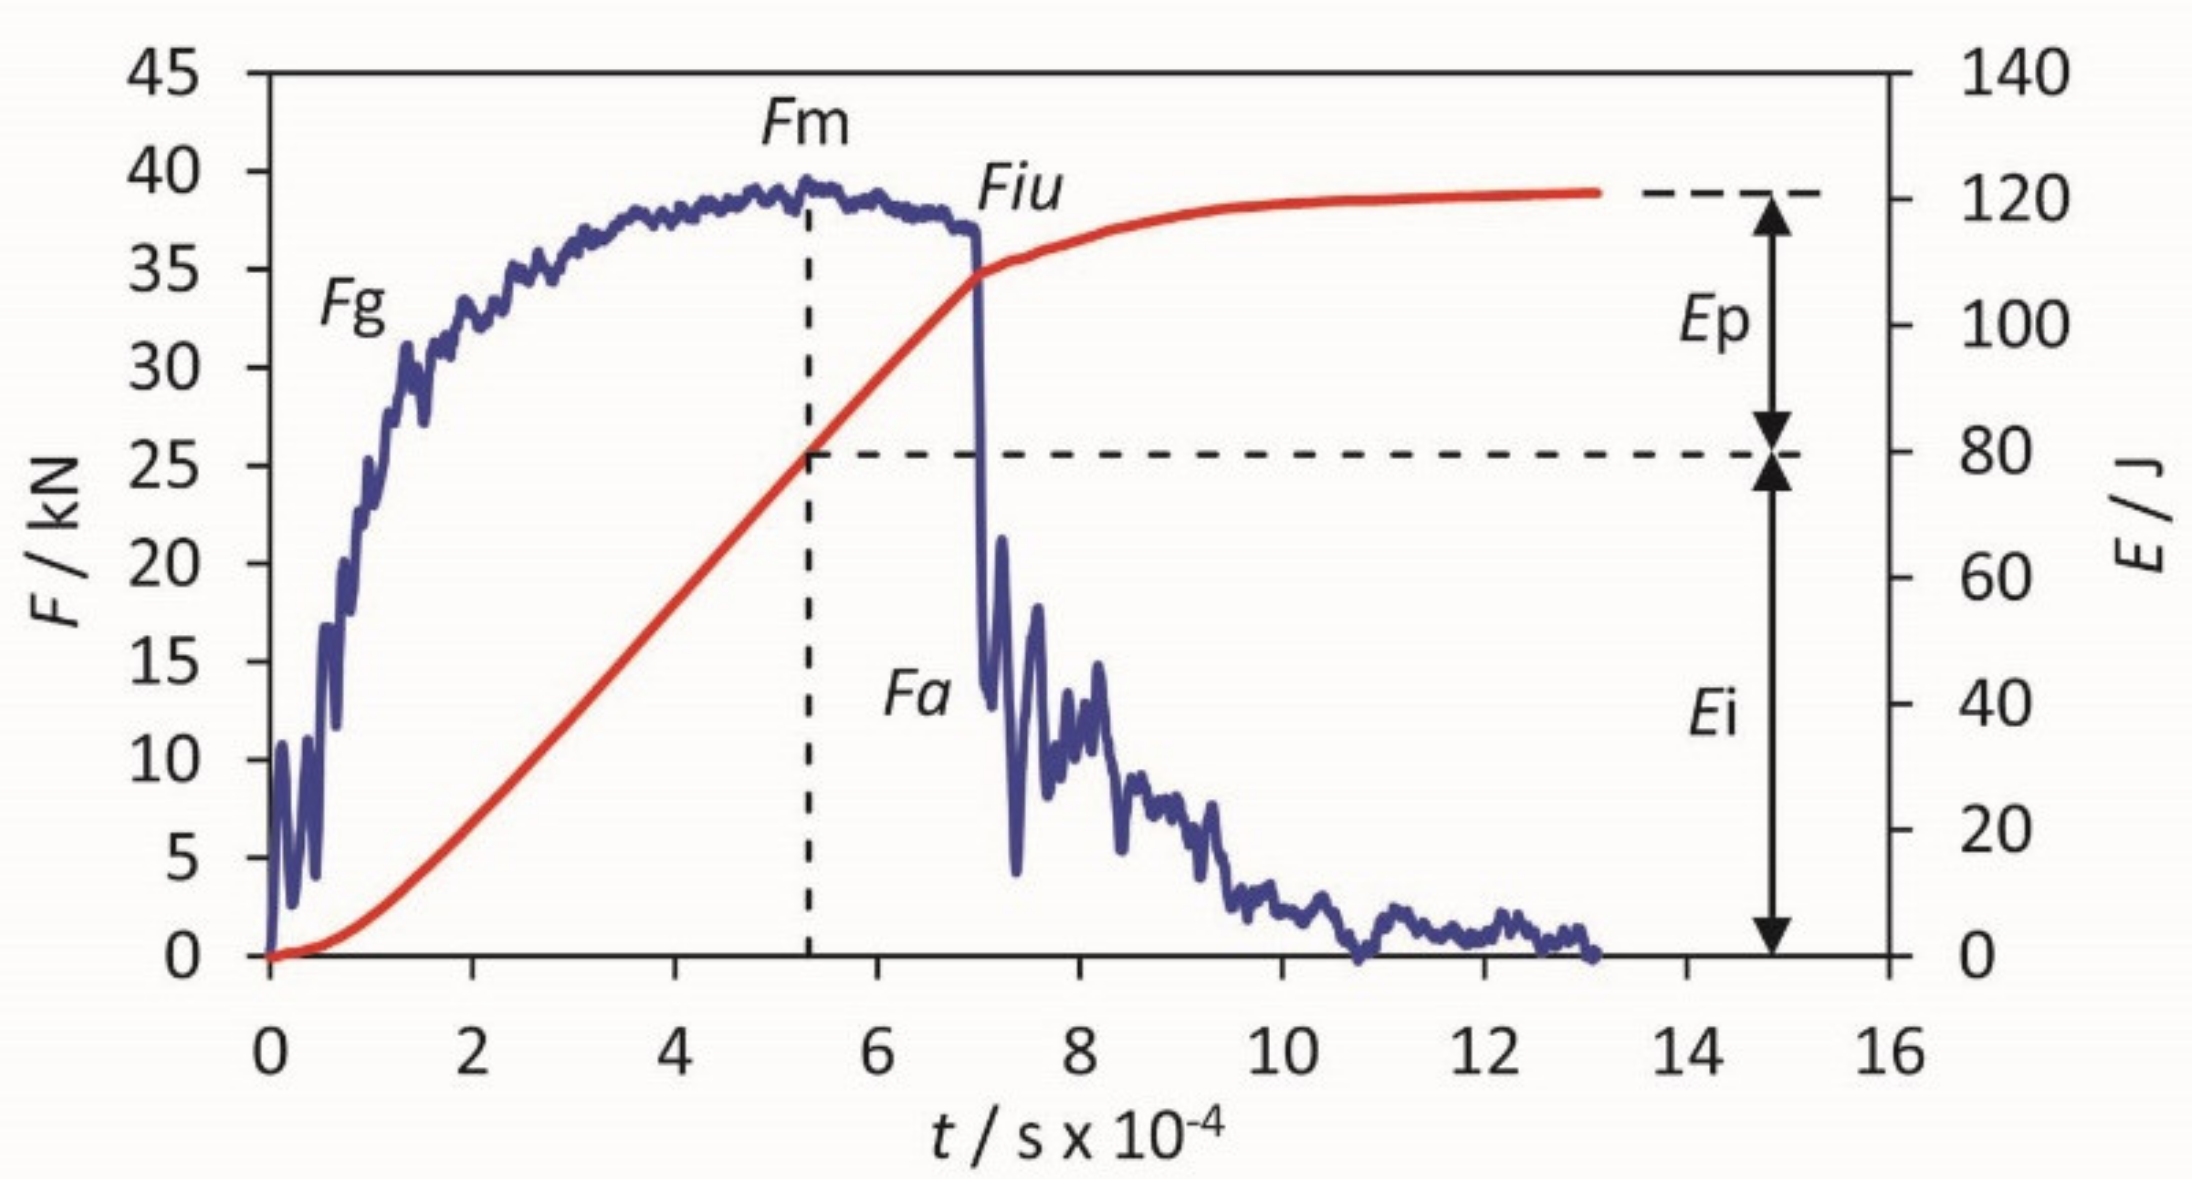
An instrumented Charpy pendulum Amsler RPK300 (Amsler Prüfmaschinen A.G., Merishausen, Swiss - now Amsler Prüfsysteme, Neftenbach, Switzerland) with a data acquisition rate of 4,000,000 readings per second was used for the impact toughness tests. Total impact energy was measured in two different ways, through an encoder on the Charpy pendulum, and by the integration of the force vs. time signal recorded during the test. The measurement of total impact energy KV by the encoder is more accurate than by integration of the recorded force vs. time (F–t) curve. Therefore, the KV values presented in this work are values obtained by the encoder. However, the determination of the portion of ductile fracture and division of the total impact energy KV into energy for crack initiation Ei and crack propagation Ep is only possible by analysis of the F–t curve. Therefore, the F–t curve is also recorded. The KV obtained by the encoder is used for calibration of the recorded F–t curve. By calibration, the error caused by oscillation of the pendulum during impact is eliminated. After that, the calibrated F–t curve is analyzed in order to determine the portion of ductile fracture and to divide the total impact energy KV into Ei and Ep. The first one is necessary for crack initiation at the notch of the Charpy specimen. The second one is necessary for propagation after the crack was initiated. The energy for propagation reflects the material’s resistance toward crack propagation. Figure 4 shows the principle of dividing the energies.
For the examination of microstructures, classic metallographic preparation was applied on broken Charpy specimens. An optical microscope, Nikon Epiphot 300 optical microscope (Nikon Corporation, Tokio, Japan) was used, equipped with an Olympus DP-12 digital camera (Olympus Corporation, Boston, MA, USA). Scanning electron microscopy was done with a FEI Sirion 400 NC microscope (FEI Company, Hillsboro, OR, USA- now part of Thermo Fischer Scientific Inc.) equipped with an Oxford Inca EDS analyzing system (Oxford Instruments plc., Abingdon, UK).

3. Results and Discussion

3.1. Mechanical Properties

With exception of Table 4, all specified values of impact energies represent the average of three specimens. The hardness values represent the average of six indentations. In Table 4, values in the columns HV 10 and KV are the result of individual measurements.
The hardness and impact energies of simulated HAZ zones before PWHT are summarized in Table 4.
According to EN ISO 15614-1 Specification and qualification of welding procedures for metallic materials—Welding procedure test, Part 1, hardness up to 350 HV is acceptable for heat treated weld joints of materials belonging to group 6. However, ASTM materials’ specification only allows hardness up to 265 HV for the steel P91. Furthermore, the cracks on the components in the power plant indicated that PWHT can be insufficient even if the mechanical properties meet the requirements of EN ISO 15614-1. On the other hand, Li et al. [62], who studied relations between mechanical properties and the safety of operation, established 189 HV as the minimum value for safe operation. Therefore, the goal of PWHT in the present work was a hardness between 190 and 250 HV.
As for the impact toughness, the target of PWHT was to reach 100% ductile fracture and reach or surpass the impact toughness of the base metal (192 J).

3.1.1. Hardness

Hardness after PWHT at different temperatures is shown in Figure 5.
In the ICHAZ and FGHAZ-2, hardness less than 260 HV 10 was reached in 0.5 h, even at the lowest PWHT temperature, 740 °C (Figure 5a). On the other hand, even after 8 h at 800 °C, the hardness was still over 200 HV 10 (Figure 5d). This shows that the hardness in these two zones does not drop excessively, not even after long PWHT at high temperatures.
In the FGHAZ-1, the hardness was below 265 HV after 2 h at 740 °C (Figure 5a), after 1 h at 760 °C (Figure 5b), and after 0.5 h at 780 °C or 800 °C (Figure 5c,d).
In the hardest subzone CGHAZ, less than 2 h at 780 °C and 0.5 h at 800 °C were sufficient to obtain a hardness below 265 HV 10. At temperatures of 760 °C and 740 °C, 4 h was not enough. These results show that, in contrast to the reports found in the literature, at temperatures below 780 °C, adequate hardness cannot be obtained in all HAZ subzones in 3 h.
Taking into account that time is valuable, higher PWHT temperatures can be beneficial. As can be seen in Figure 5c,d, optimum combinations of time and temperature in regard to necessary soaking time would be 0.5 h at 800 °C, or less than 2 h at 780 °C. The exact minimum time at 780 °C cannot be read from the diagrams because no experiments were performed with durations between 1 and 2 h. However, it can be estimated by calculation of the Larson–Miller parameter (LMP).
According to Paddea et al. [63] and Pandey et al. [64], the LMP should be ≥ 21 in order to obtain sufficient high temperature properties and impact toughness. LMP is calculated by Equation (1) [63,64], where T is the soak temperature in Kelvin, t is the holding time in hours, and C = 21 is an appropriate material specific constant for the steel P91.
LMP = T × (log t + C) × 10−3
Equation (1) gives LMP = 22.2 for 0.5 h at 800 °C. The same value of LMP is obtained with 780 °C and 1.2 h, or with 760 °C and 3.15 h. At the applied heating/cooling rate of 150 °C h−1, an increase of soaking temperature by 20 °C prolongs the total duration of PWHT by 8 min for heating up, and 8 min for cooling down, while the necessary soaking time decreases much more. Hence, compared to PWHT for 3.15 h at 760 °C, a soaking temperature of 780 °C results in a time saving of 100 min, and a soaking temperature 800 °C saves an extra 26 min.

3.1.2. Instrumented Charpy Impact Test

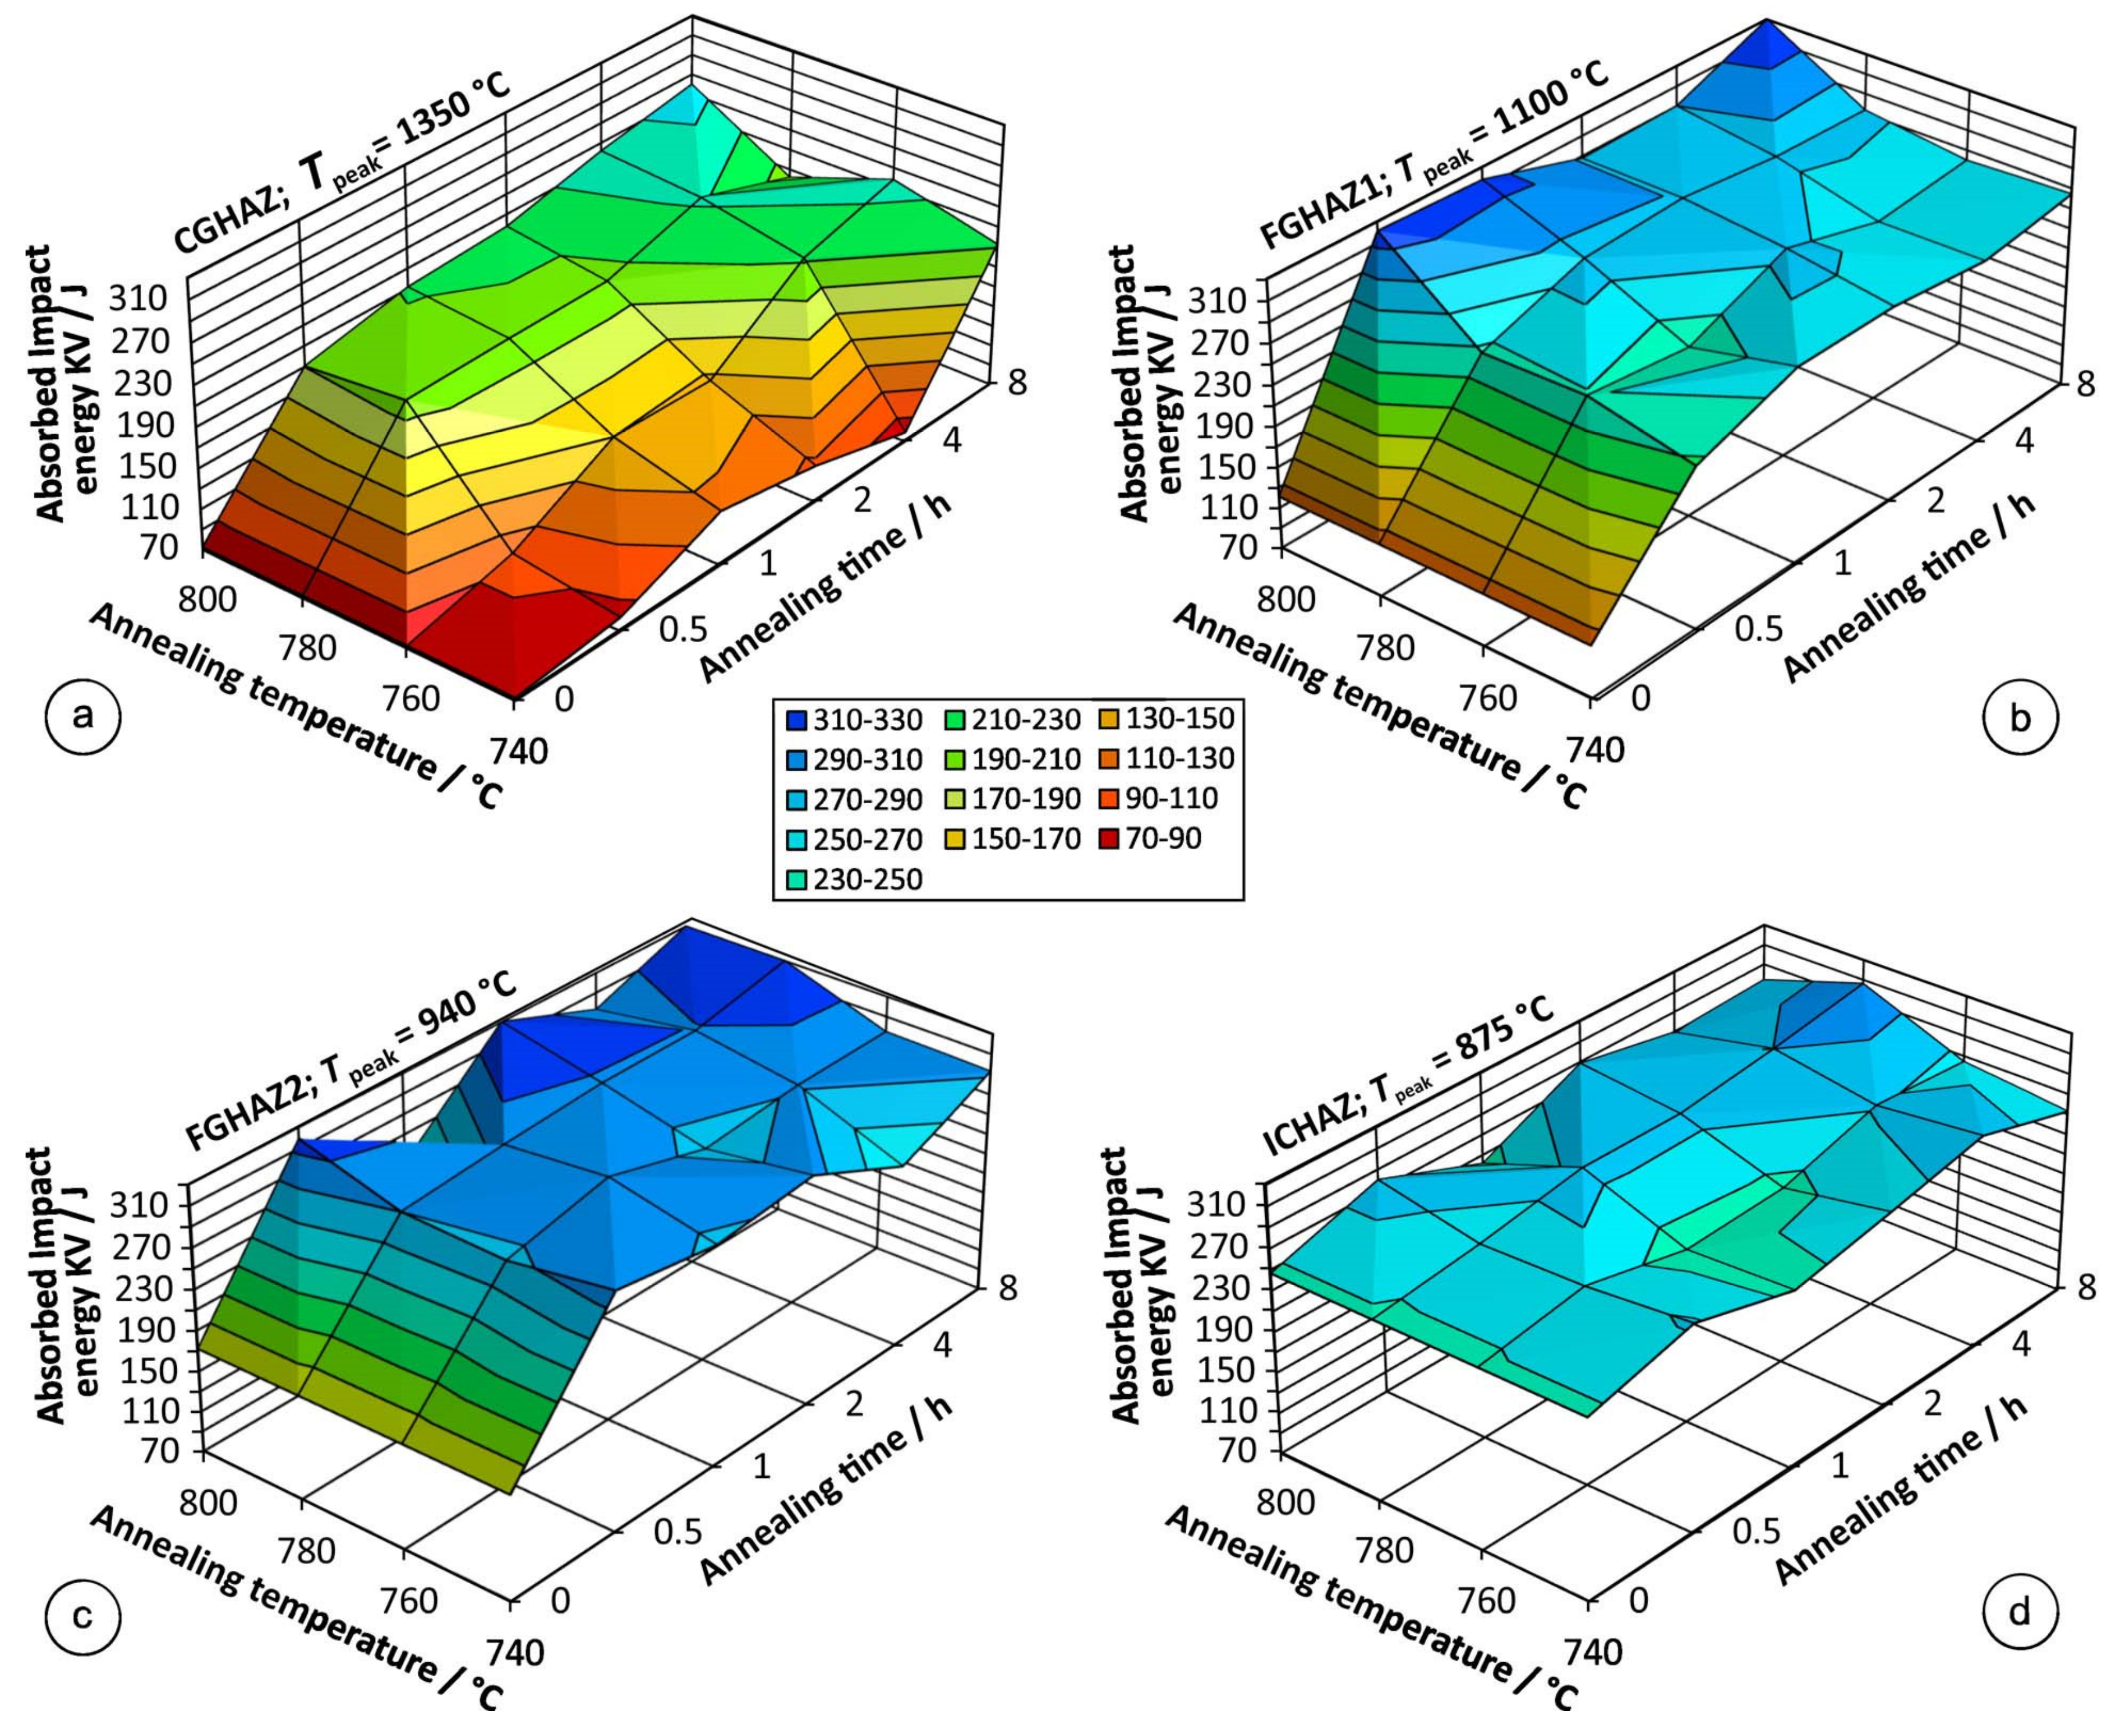
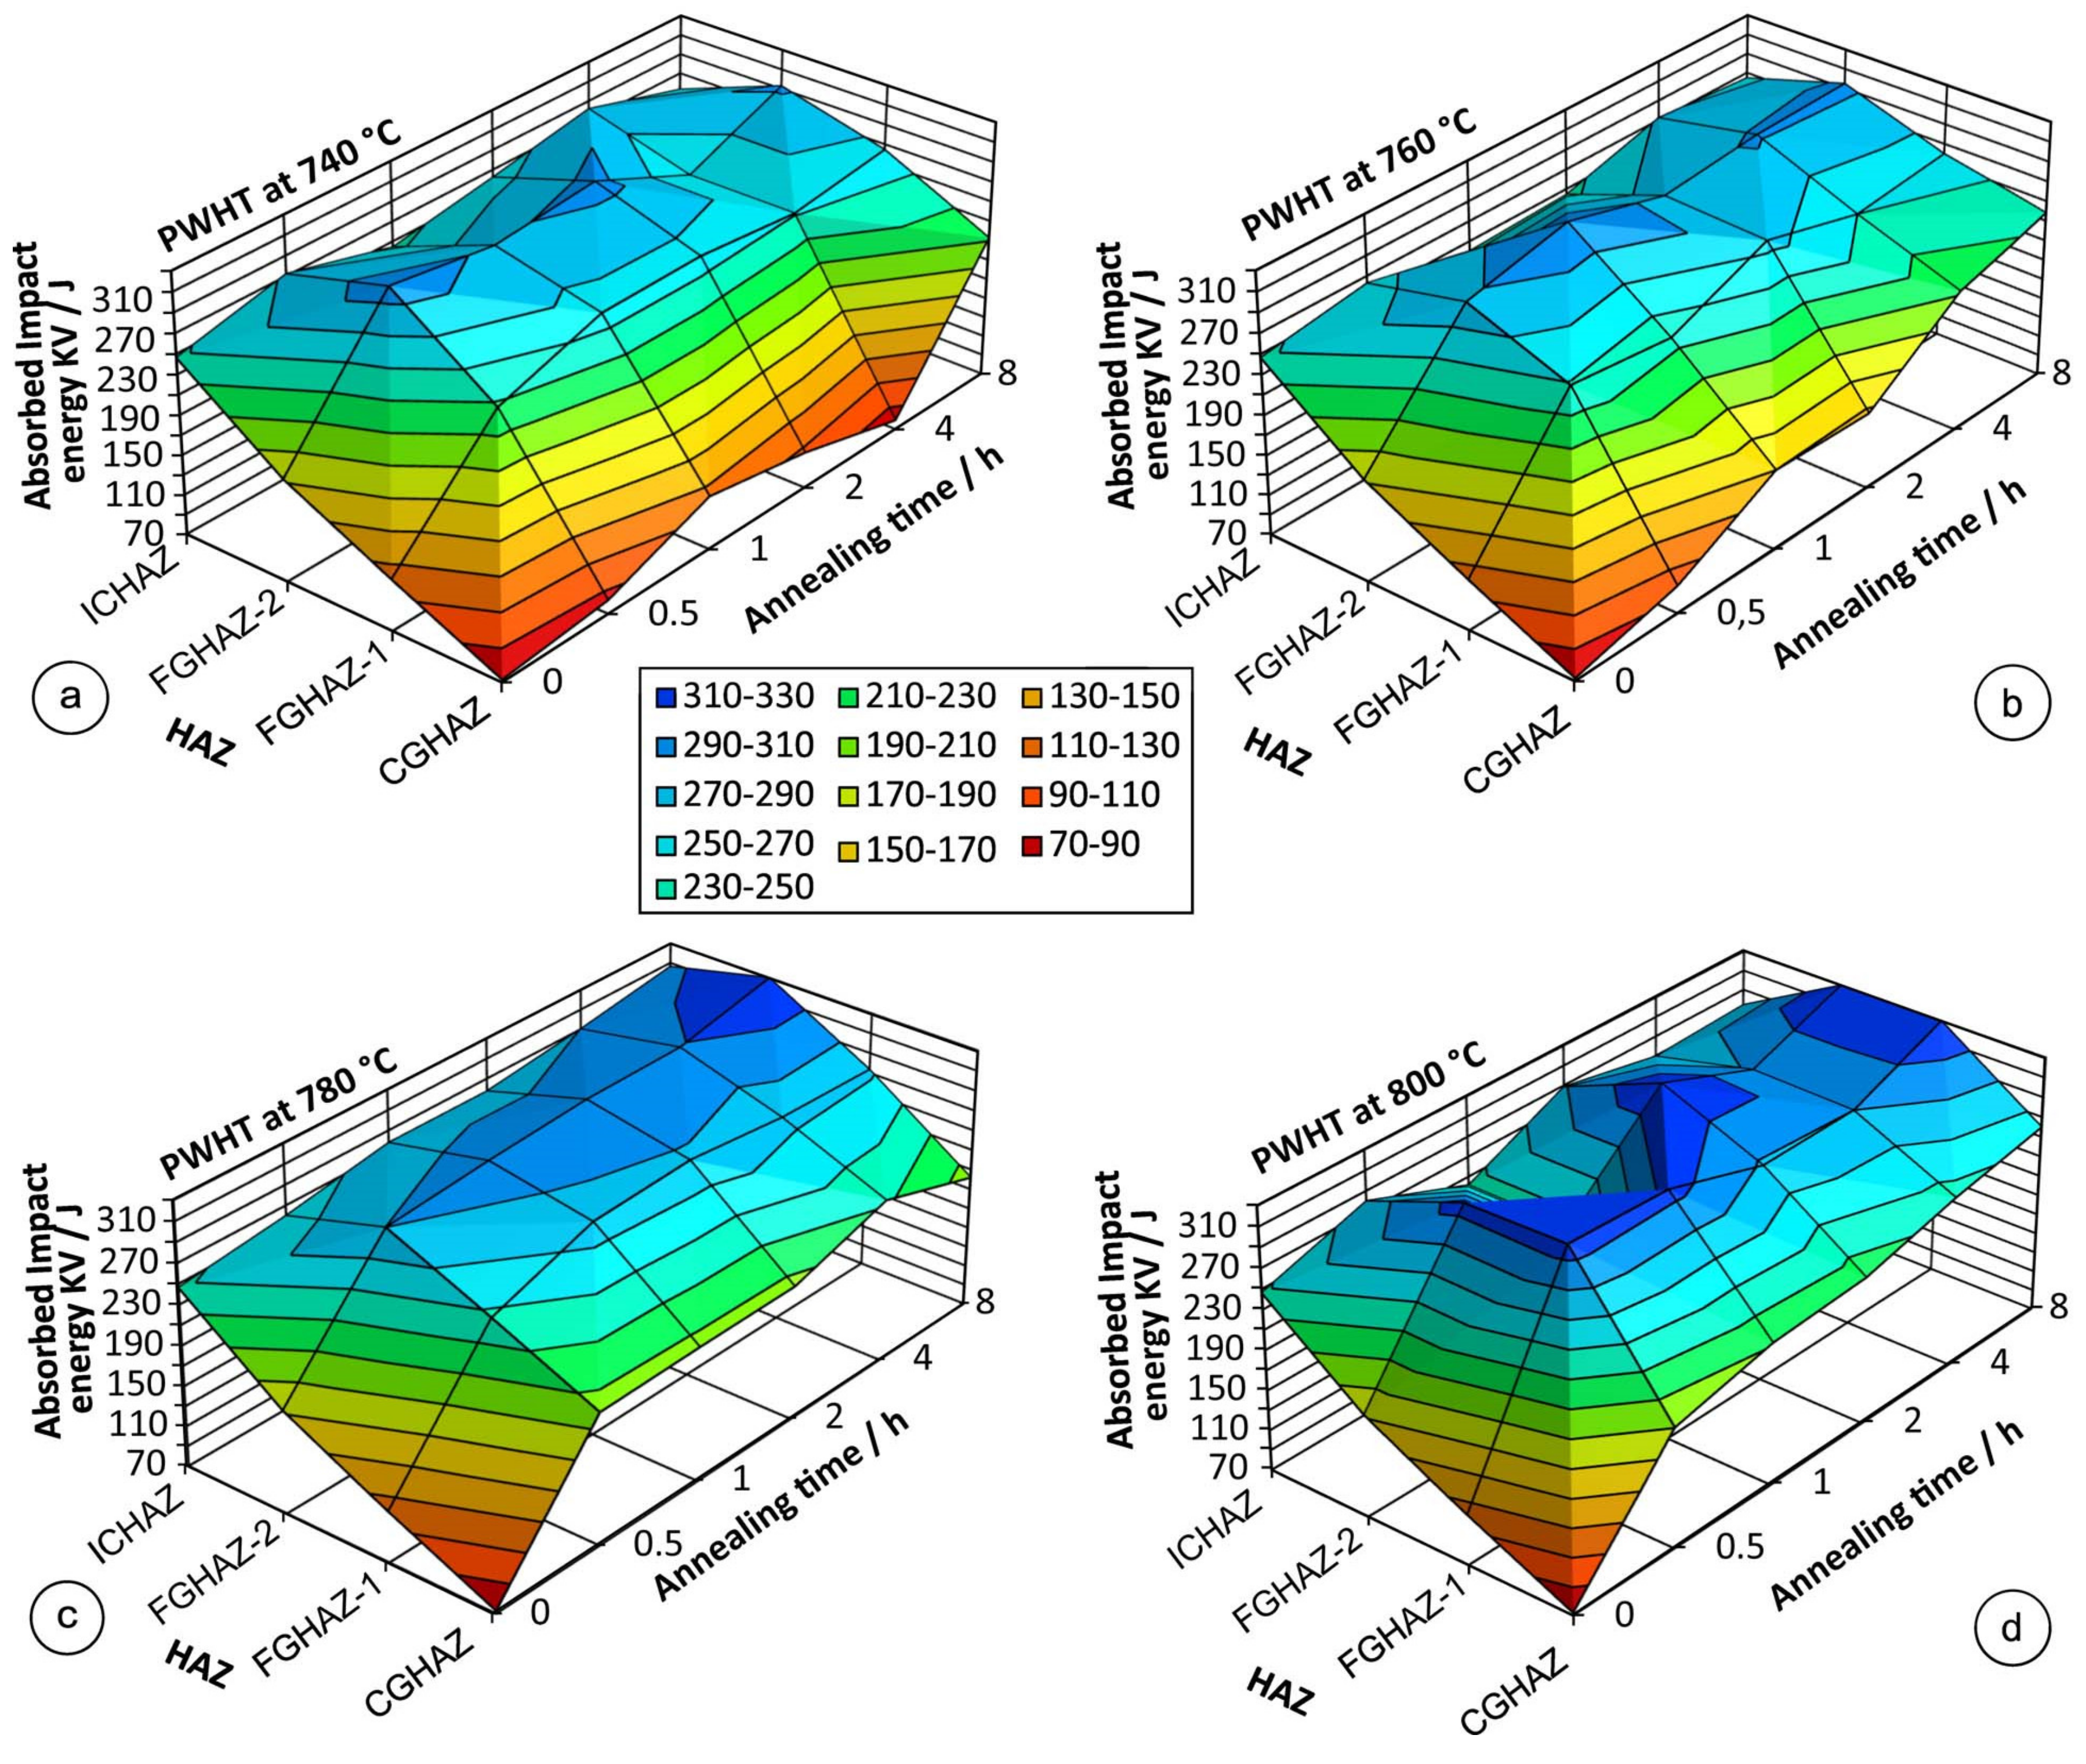
The total impact energies KV in individual HAZ subzones are shown in Figure 6. Figure 7 shows the total impact energies KV after PWHT at different temperatures. In both figures, the as-welded condition is denoted by annealing time t = 0. The colors are selected so that red means small impact toughness.
To reach KV above 190 J and 100% ductile fracture in CGHAZ, it took 8 h at 740 °C, 4 h at 760 °C, and 0.5 h at 780 °C and 800 °C, as shown in Figure 6a and Figure 7. Herewith, the results of Charpy tests show that the very often recommended PWHT up to 3 h at 760 °C is insufficient to obtain an impact toughness of CGHAZ similar to that of BM. In order to obtain good toughness in 3 h or less, higher temperatures must be applied. In FGHAZ-1, FGHAZ-2, and ICHAZ, after 0.5 h at 740 °C, the absorbed impact energy KV was between 227 and 301 J (Figure 7a) and the fracture was 100% ductile.
Diagrams of the total impact energies KV after PWHT at 780 °C and 800 °C for all HAZ subzones are shown in Figure 7c,d. After 0.5 h at 780 °C, the total impact energy KV in all HAZ subzones had reached or surpassed the level of BM.
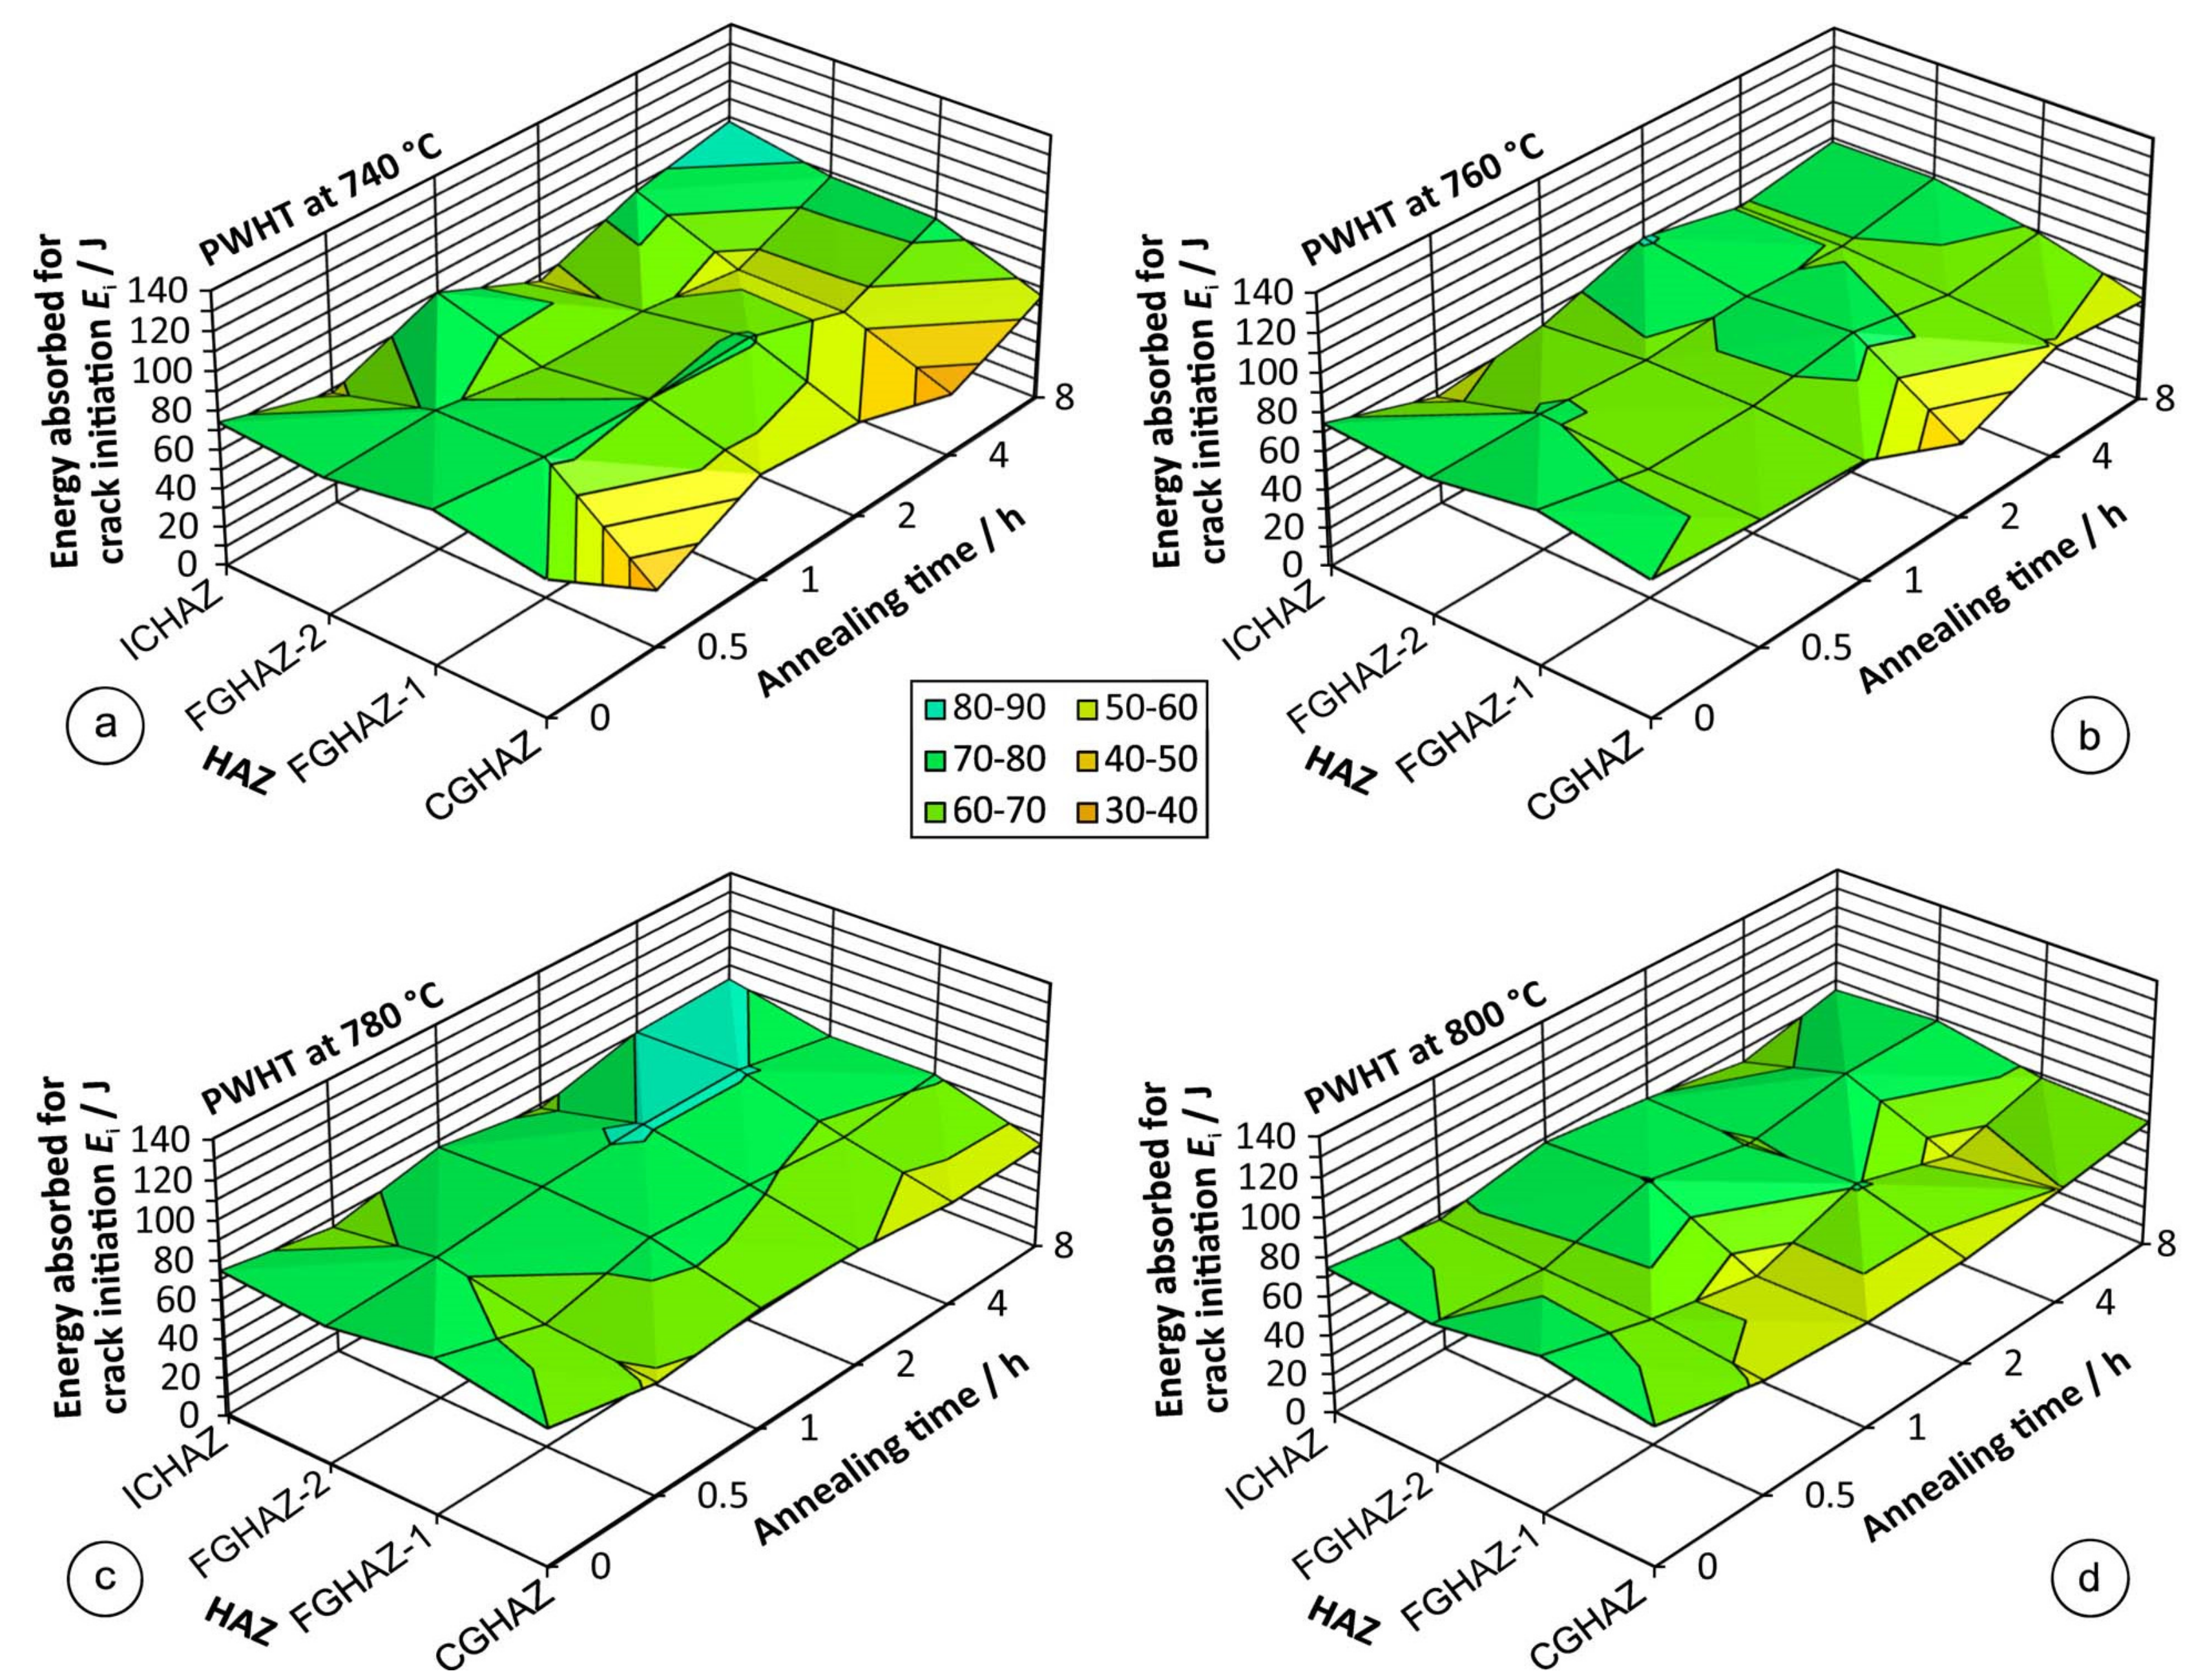
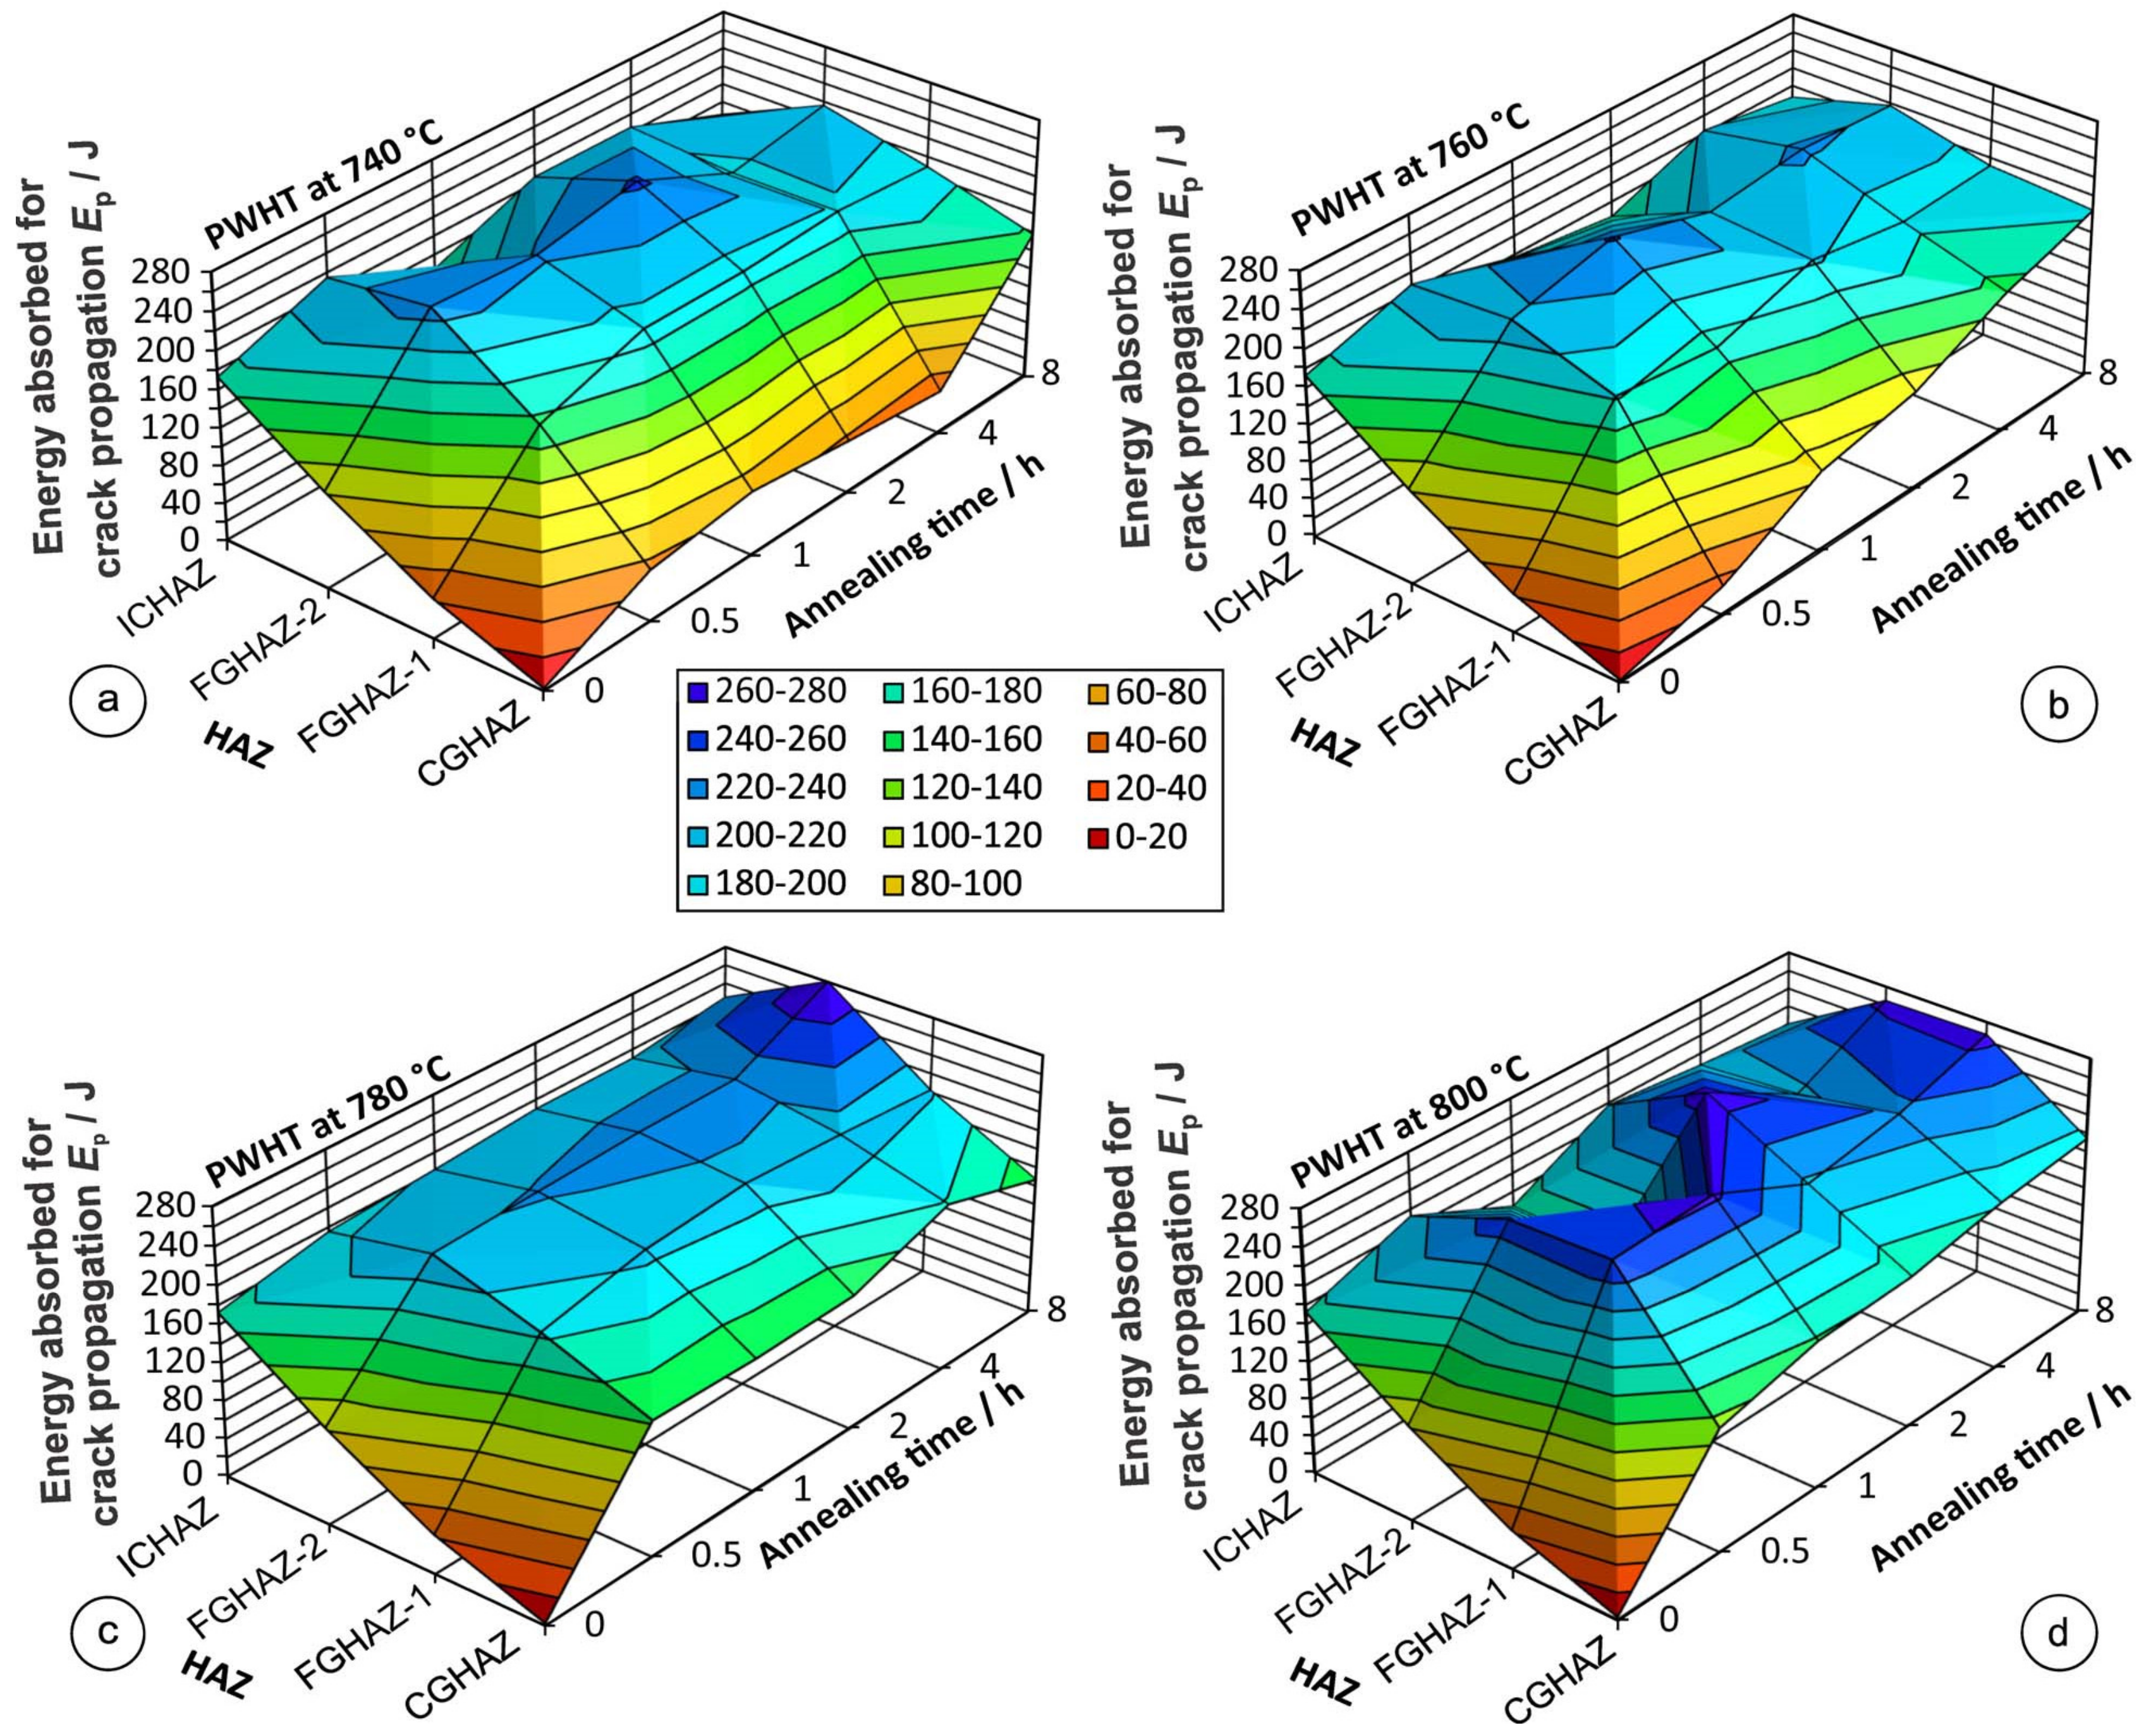
Dividing impact energies into energy for crack initiation Ei and energy for crack propagation Ep revealed that PWHTs had only a minor influence on initiation energies and a decisive influence on propagation energies, as shown in Figure 8 and Figure 9. In both figures, annealing time t = 0 means the as-welded condition, without PWHT. As show in Figure 6 and Figure 7, red means small energies.
The small influence of PWHT on initiation energies means that PWHT did not significantly affect the resistance of HAZ material to the occurrence of cracks. That is to say, Ei does not depend only on the material’s ability for plastic deformation (ductility), but also on its strength. Consequently, in harder zones, the lack of ductility can be compensated for by higher strength, and PWHT can even cause a slight decrease of Ei. A comparison of the as-welded condition (Table 4) with PWHTs of 1 h at 780 °C (Figure 8c) and 0.5 and 8 h at 800 °C (Figure 8d) shows that the maximum change of Ei was less than 15 J: −12 J in CGHAZ, −15 J in FGHAZ-1, −5–8 J in FGHAZ-2, and by −7–2 J in ICHAZ.
On the contrary, the energy absorption during propagation of a crack depends predominantly on the material’s ductility. Therefore, resistance to crack propagation can be improved significantly by PWHT. In the as-welded condition, the very brittle high carbon martensite in FGHAZ was incapable of any significant plastic deformation. The relatively high Ei was assured by its high strength. However, once a crack initiated, the accumulated elastic energy was nearly sufficient for crack propagation, as very little additional energy, of only about 3 J, was needed to complete the fracture, which was over 96% brittle (Table 4). However, if a material is capable of notable plastic deformation, additional energy (Ep) is absorbed by the plastic deformation before breaking. Consequently, with increasing ductility, Ep and the portion of ductile fracture increase. As the ductility depends on the microstructure, changes in microstructure strongly affect the Ep. The bigger the changes (embrittlement) during welding, the lower Ep is after welding. The lower Ep is after welding, the stronger the increase reached by PWHT.
In the CGHAZ, the peak temperatures are high enough to dissolve carbides. Thereby, the obstacles for rapid grain growth disappear and the austenite becomes rich with carbon. Upon cooling, the carbon rich austenite transforms into hard and brittle martensite. In the FGHAZ, the extent of changes is somewhat smaller. During welding, not all carbides can dissolve. Consequently, the remaining carbides can prevent excessive coarsening of austenitic grains and less carbon dissolves in the austenite. Both less carbon and finer grains contribute to the formation of less brittle martensite. In the ICHAZ, the peak temperature remains below AC3, transformation to austenite cannot be completed, and even fewer carbides dissolve in the austenite than in the FGHAZ. Therefore, only some new low carbon martensite forms, while the non-austenitic fraction just undergoes further tempering, i.e., coarsening of carbides and softening of the matrix. In the subcritical HAZ (SCHAZ), the original microstructure only undergoes further tempering for a short time [36,49].
In CGHAZ, not capable of any significant plastic deformation, PWHT enabled the precipitation of carbides. Martensite was tempered, the crystal lattice changed to cubic, and the ability for plastic deformation increased strongly. The difference between Ep in as-welded condition and in well-tempered condition was enormous. In FGHAZ-1 and FGHAZ-2, some carbides did not dissolve, but the matrix, although less hard and brittle than in CGHAZ, still consisted of untampered martensite. Due to a lower peak temperature, the extent of dissolution and the hardness of martensite were lower in the FGHAZ-2. Upon PWHT, martensite was tempered, already existing carbides coarsened, the distance between adjacent carbide particles increased, and ductility increased notably in FGHAZ-1. The difference to as-welded condition was still significant in FGHAZ-1, but less than in CGHAZ. In FGHAZ-2, the difference was smaller than in FGHAZ-1. In ICHAZ, only a small fraction of the microstructure was converted to fresh martensite. Therefore, Ep was already high in the as-welded condition (172 J), and the increase upon PWHT was insignificant. A comparison of the as-welded condition (Table 4) with PWHTs of 1 h at 780 °C (Figure 9c) and 0.5 and 8 h at 800 °C (Figure 9d) shows that the increase of Ep was 129–191 J in CGHAZ, 164–225 J in FGHAZ-1, 120–163 J in FGHAZ-2, and only 27–29 J in ICAHZ.

3.1.3. Comparison of Mechanical Properties Measured on Simulated Microstructures with Values Obtained with Samples from the Real Weld HAZ

Results of mechanical tests of real weld HAZ obtained with PWHT according to WPQR were compared with results obtained from simulated HAZ subzones subjected to comparable PWHT as real weld HAZ. The data are summarized in Table 5.
According to WPQR, the PWHT of real weld specimens was carried out at a temperature between 740 and 770 °C for 2.3 h, where the heating and cooling rates were 150 °C h, the same as for simulated specimens. The hardness of real weld specimens was measured according to the applicable standard in two lines, with three indentations in HAZ on each line on either side of the weld. The values were in the range 238–268 HV 10, and on average 251 HV 10. None of the individual values exceeded the upper limit specified by EN ISO 15614-1 (350 HV 10). However, one was above the maximum specified in the base metal specification. The Charpy specimens cut from the real weld HAZ exhibited impact energies KV = 130–216 J and the average of 167 J, which is not very far from the base metal. All individual values were far above the requirements of EN ISO 15614-1, though the deviations of individual values from the average are enormous–up to 29.3%.
The comparable heat treatments of simulated samples were 2 h and 4 h at 740 °C and 2 h at 760 °C. The analysis of the results obtained with simulated microstructures indicated that if only the average hardness of whole HAZ would be considered, even 2 h at 740 °C should be enough. Regarding the individual measurements, all hardness values of CGHAZ were above the base metal specification after 2 and 4 h at 740 °C and after 2 h at 760 °C. The same applies to KV values. The average for the whole HAZ was high, but individual values in CGHAZ were still far below those of the base metal. Herewith, the comparison the results shows that, if CGHAZ was still brittle in simulated specimens, then there had to be brittle areas in a comparably heat treated real weld HAZ as well. Furthermore, it shows that a PWHT designed on the basis of real weld HAZ specimens can be insufficient.
As expected, after comparable PWHTs, the KV values of the simulated CGHAZs were low compared to the real weld HAZ values. This can be explained with the large volume of homogeneous brittle material ahead of the crack tip in the simulated microstructures. Due to the inhomogeneity of the microstructure in a real weld HAZ, the plastic zone in front of the crack tip (starting from the V-notch) almost always extends into a more ductile material, which absorbs more energy. Hence, the measured KV values are higher and can lead to an overestimation of the resistance to cracks.
Especially in the case of operation under dynamic loads, cracks propagate differently compared to the Charpy test. In the Charpy test, the specimen brakes under a sudden massive overload and the crack is forced to propagate through the cross-section in the shortest way, regardless of the toughness of the material in front of the crack tip. During operation, the loads are much smaller. Therefore, in the initial stage when a crack is still short and the plastic zone in front of it is still small, the direction of propagation is towards the more brittle microstructure. If the crack is still short enough by the time it extends over the entire brittle area, it can be stopped. However, if by that time the crack is long enough and the plastic zone around the tip is large, tougher microstructures around the tip cannot always stop further propagation. Therefore, it is essential to prevent the initiation of the cracks, which can be done by sufficient improvement of the toughness in the entire volume of the HAZ.
To verify if after PWHT the entire volume of the HAZ exhibits the required properties, the testing of real weld HAZ specimens is not a sufficiently rigorous criterion. If small areas with inadequate properties still exist, their presence does not always notably reflect in the results. The comparison of real HAZ values and values obtained with simulated subzones indicates that, even if the results of real HAZ testing are in agreement with the requirements, there is no guarantee that really no small brittle areas, in which cracks could occur during operation of the component, remained in the HAZ.
Consequently, it can be recommended that in none of the HAZ subzones should the hardness exceed the maximum value specified in the standard for the base metal and that impact energies measured in all HAZ subzones should not be significantly lower than those of the base metal. If by a certain PWHT this goal was achieved, it cannot be reliably verified with real weld HAZ specimens because a real weld HAZ is usually too narrow and too inhomogeneous. This can be only done with simulated HAZ subzones.
The results of the mechanical tests on simulated microstructures also demonstrated that a temperature increase of 20 °C had a stronger influence than an additional hour at a certain temperature. At 800 °C, a soaking time of 0.5 h was sufficient to obtain adequate hardness, impact toughness, and microstructure. Vimalan et al. [41] reported that some fresh martensite and ferrite can form during PWHT even up to 12 °C below A1. However, as their presence detrimentally lowers the toughness [39], the results of Charpy impact tests indicate that they were not present in our samples. However, 800 °C is the upper permissible temperature [44], and if the temperature is lower, the soaking time must be prolonged. Therefore, PWHT at 800 °C is appropriate only if the temperature differences across the whole volume of the furnace can be kept within a very narrow range of only a few °C. If not, it is wiser to choose a lower temperature. The influence of deviations from the target temperature on the necessary soaking time decrease exponentially with temperature. So, at 780 °C, 1.2–2 h can be recommended, and at 760 °C, 3–4 h (Figure 10). The yellow arrows indicate the decrease of hardness (Figure 10a) and the increase of impact energies (Figure 10b) compared to the as-welded condition.

3.2. Microstructures

As known from the literature [59], microstructures of P91 cannot be investigated in detail by optical microscopy. This is due to the presence of numerous carbide particles of the size below the resolution of a conventional optical microscope and due to a possible presence of very small fractions of bainite, ferrite, or untampered martensite that cannot be distinguished.
However, predominantly optical microscopy was done considering that the microstructures of the base metal P91 and all HAZ-subzones were already thoroughly investigated [7,14,49,59,65,66,67], such that this work was focused on the optimization of PWHT with respect to mechanical properties, and considering the findings of Li et al. [62], who found that if the hardness of P91 was above 189 HV, operation was safe and there was no need to inspect the microstructure. Optical micrographs only enable observation of the grain size of prior austenitic grains and of the coarsest carbide particles. Nevertheless, they provide valuable information. That is to say, the grain size influences the strength as well as the impact toughness of the material. Smaller grain size is preferred, as it improves the toughness as well as the strength of the material, and the presence of carbide precipitates ensures appropriate creep resistance [7,10]).
Microstructures of HAZ subzones without PWHT are presented in Figure 11. It can be observed that the grain size increased with higher peak temperatures. Grain size is the coarsest in the CGHAZ and it decreases towards ICHAZ. Although hardly observed in the micrographs, it is well known from the literature that, without PWHAT, the microstructure of CGHAZ consists of untampered martensite, FGHAZ-1 and FGHAZ-2 of untampered martensite and some carbide particles which did not completely dissolve during austenitization, and that ICHAZ only partially transforms. Therefore, the microstructure contains fresh martensite, tempered martensite, and undissolved carbides [36,49]. However, even electron microscopy can prove unable to reveal all the details. Marzocca et al. [14] reported that, even by the observation of carbon replicas in a TEM, it was not possible to distinguish the fresh formed martensite from the tempered martensite in the ICHAZ. The problem occurs because, in the ICHAZ, numerous carbide particles do not dissolve during partial austenitization, and consequently, also in the fresh formed martensitic areas, undissolved carbides can be observed. Milović et al. [59] reported that very small amounts of bainite can form prior to martensitic transformation. However, bainite is not problematic. It is tougher than martensite and it already contains carbide precipitates.
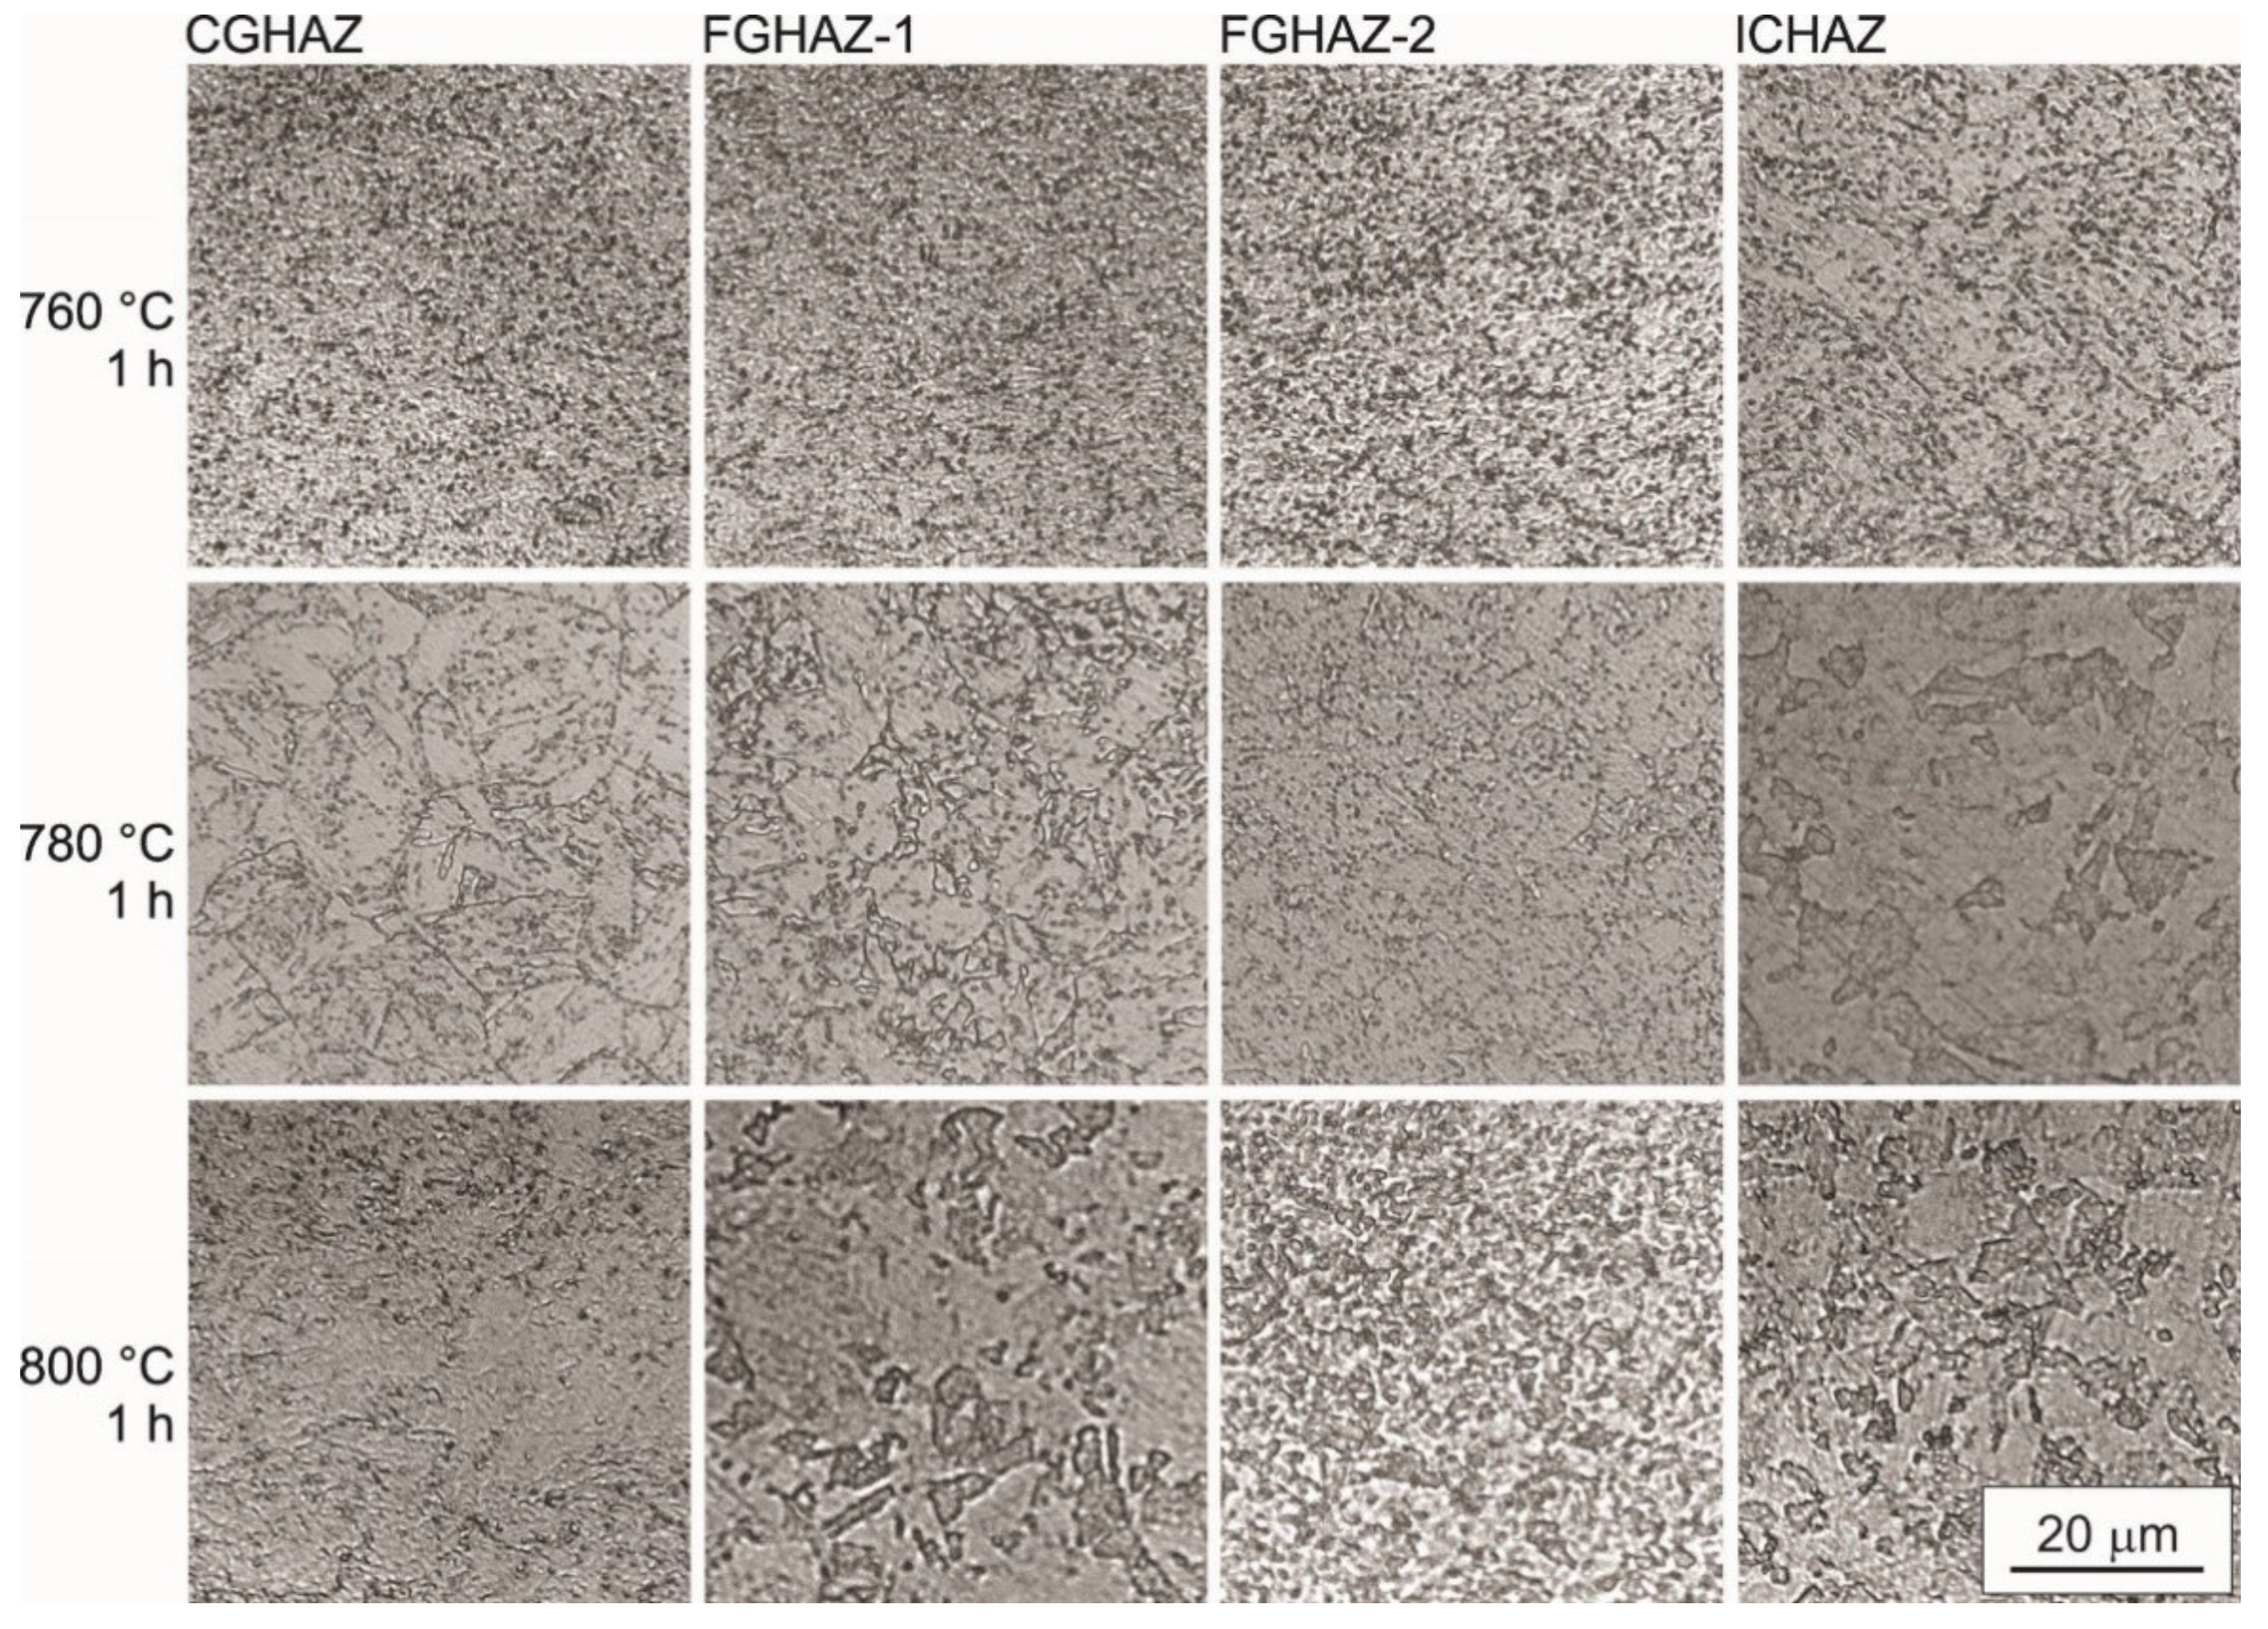
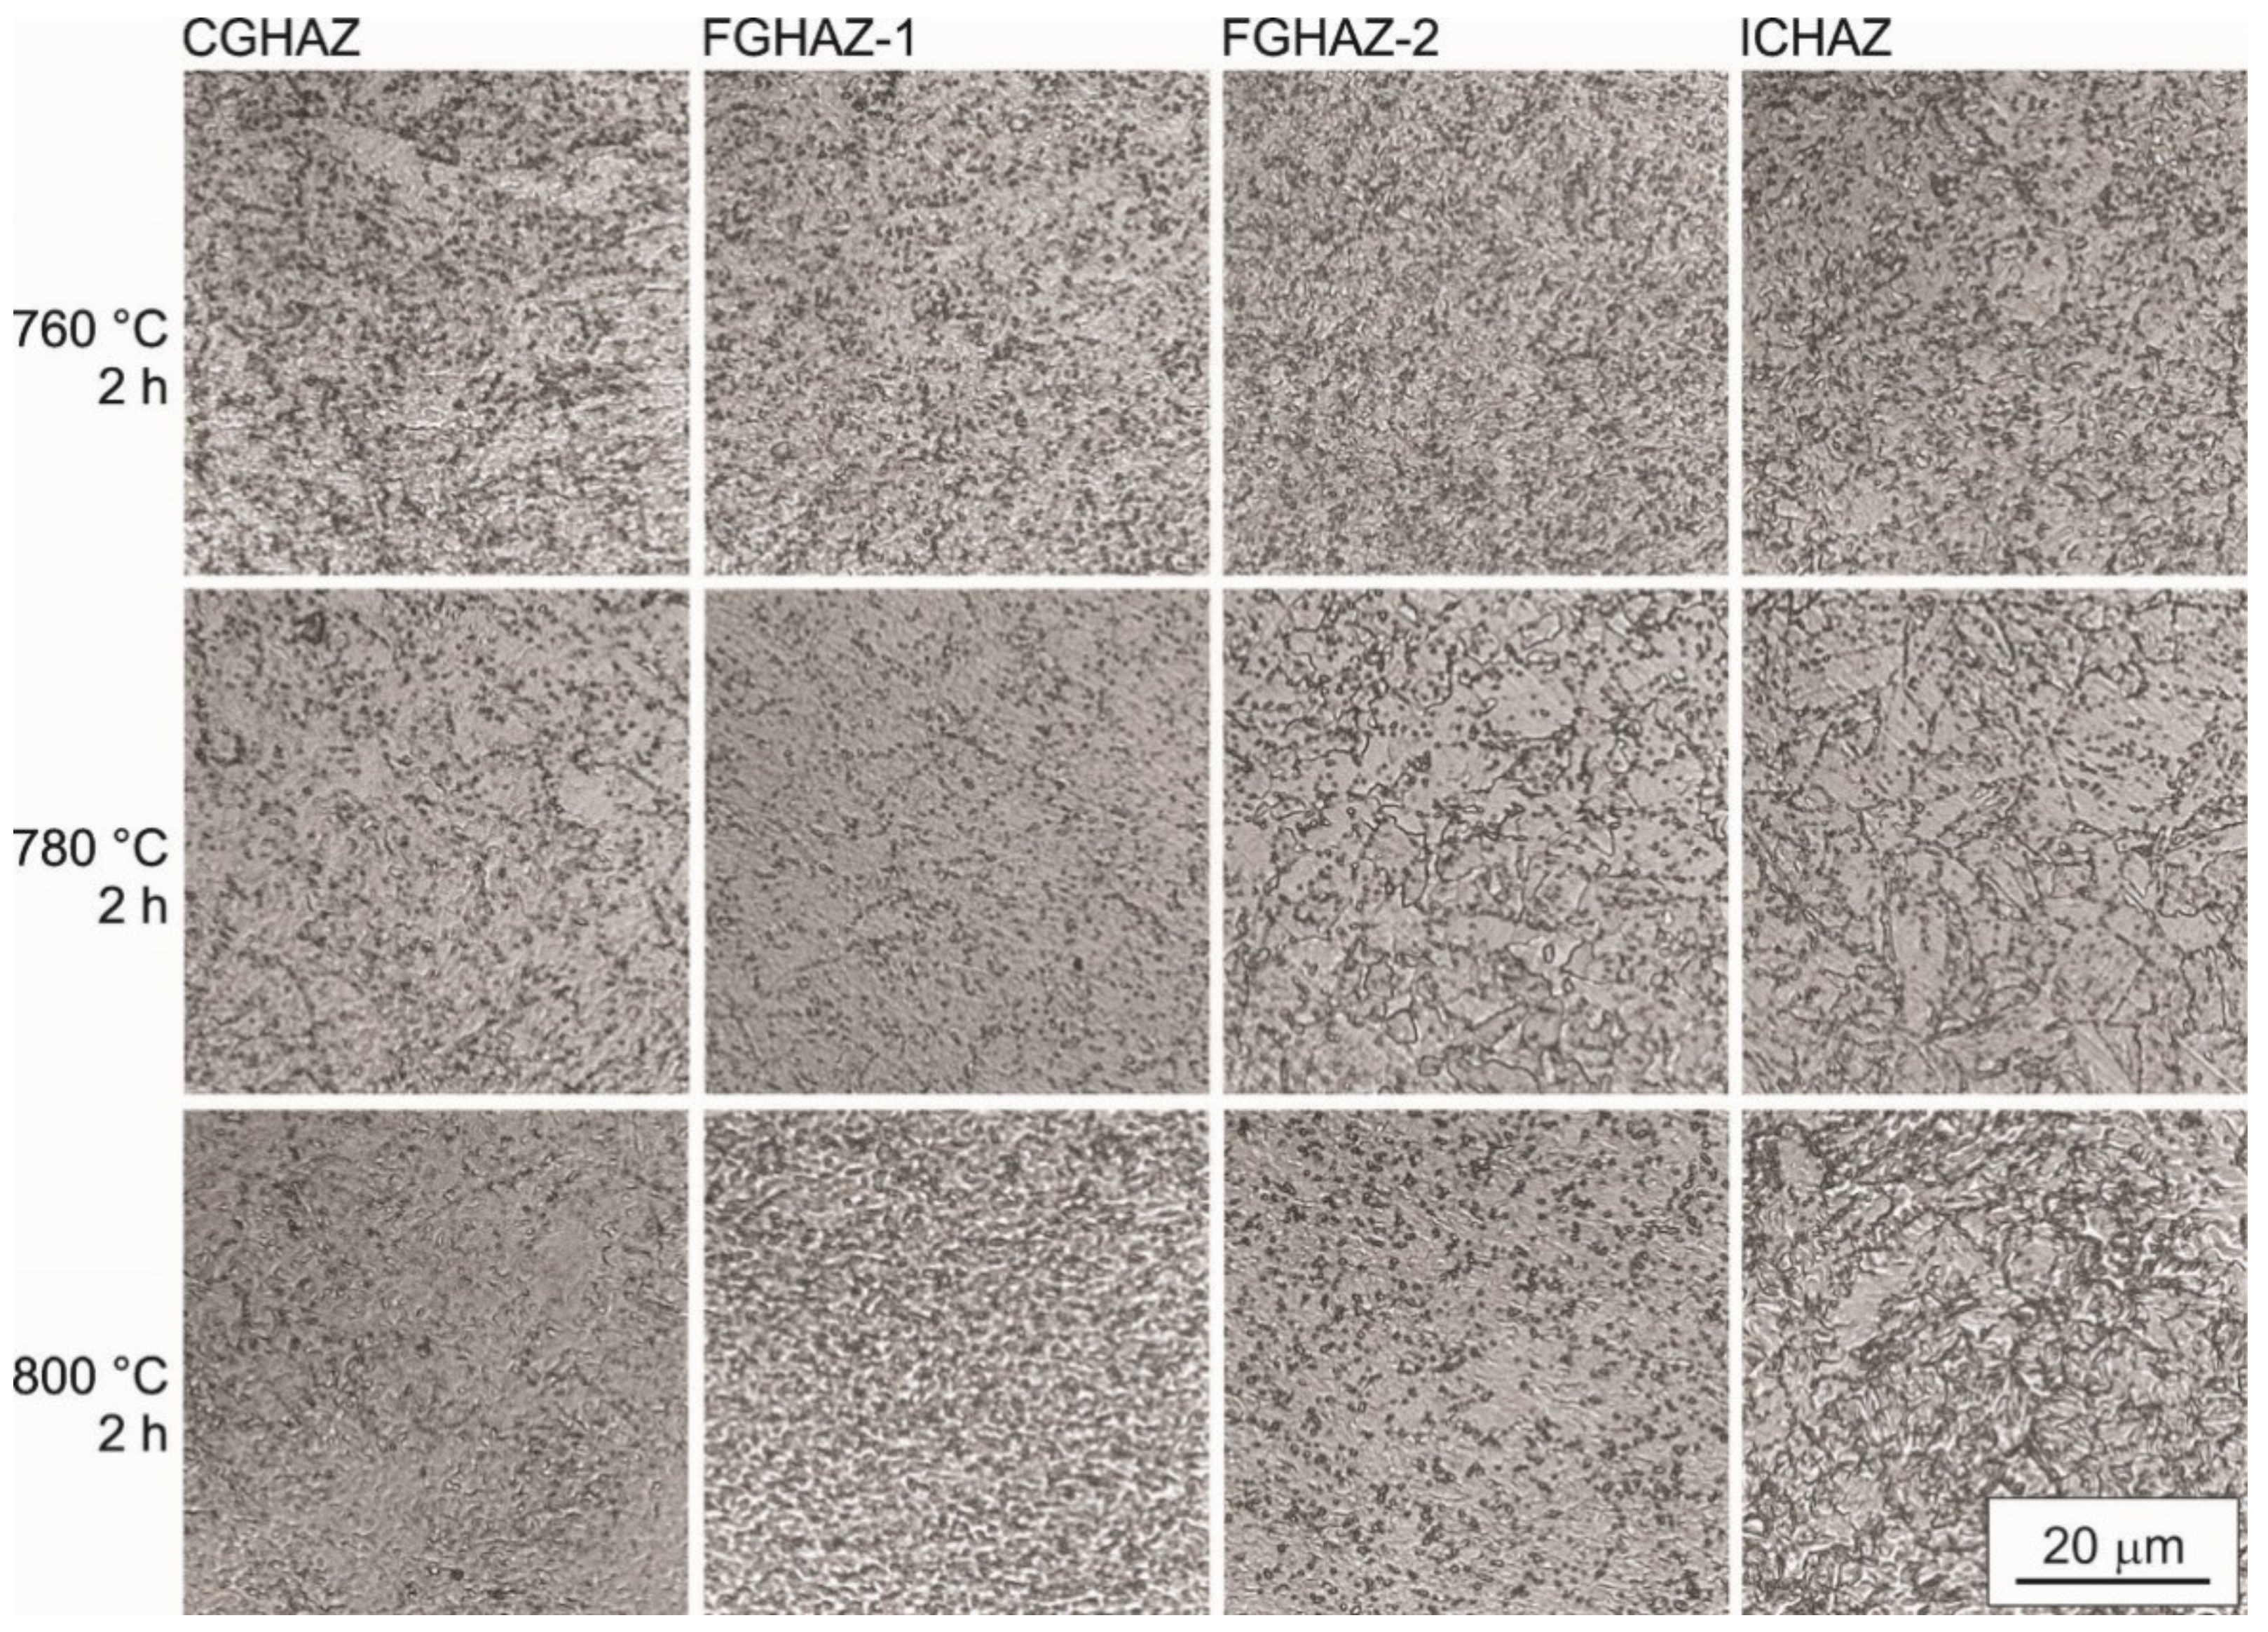
As the results of hardness measurements and the Charpy impact test suggested, PWHT at 740 °C takes too long. Therefore, only microstructures obtained with PWHT at 760–800 °C for 1 h (Figure 12) and 2 h (Figure 13) are presented below. After 1 h at 760 °C, only the hardness of CGHAZ was too high, while all subzones exhibited sufficient impact toughness.
After PWHT, tiny black dots, i.e., coarser carbides, could be observed in the micrographs (Figure 12 and Figure 13). Although finer carbides cannot be observed in the optical micrographs, their presence can be assumed and was later confirmed by SEM investigations, shown in Figure 14. Comparison of heat treated microstructures revealed that the grain and carbide size in all subzones increased slightly with the PWHT temperature. Differences between microstructures after 1 h (Figure 12) and 2 h PWHT (Figure 13) were insignificant.
Scanning electron microscopy confirmed the presence of numerous precipitates after PWHT, Figure 14. Herewith, the SEM confirmed what was indicated already by optical microscopy. If the hardness was in the target range 190–250 HV, the microstructure was adequate. This is consistent with the findings of Li et al. [62] in that, if the hardness of P91 is above 189 HV, operation is safe and there is no need to inspect the microstructure.
According to the literature [7,10], precipitation strengthening is the crucial mechanism for increasing the creep resistance of steels like P91. The intergranular precipitates (on the prior austenite grain boundaries) provide resistance against grain boundary sliding, whereas finer precipitates inside the former austenitic grains act as barriers for dislocation movement during prolonged exposure to operating temperatures [49]. A micrograph of a typical microstructure of normalized and tempered P91 steel was published by Pandey et al. [67]. This looks identical to the microstructure in the Figure 14a. Therefore, the microstructure presented in Figure 14 can be regarded as an example of an appropriate PWHT microstructure. The reports in the literature confirm our observations. The major portion of precipitates are M23C6 carbides, where M is predominantly Cr, followed by Fe and Mo [14,49,65,66,67]. They are mostly coarser than other carbides and prevail on the former austenite boundaries. Finer particles, observed in the intra-lath regions are predominantly MX type precipitates, where M is V, Cr, Mo, and/or Ta and X can be C and/or N [7,14,49]. However, EDS is not suitable to analyze very fine precipitates, because the chemical composition of the matrix can influence the results too strong. Therefore, they are mostly identified by other methods, e.g., electron diffraction in TEM.

4. Conclusions

Four different HAZ subzones were simulated with P91 steel: CGHAZ (Tpeak = 1350 °C), FGHAZ-1 (Tpeak = 1100 °C), FGHAZ-2 (Tpeak = 940 °C), and ICHAZ (Tpeak = 875 °C). Altogether, 20 different PWHTs were tested on each subzone to establish optimum time–temperature combinations. Temperatures were 740, 760, 780, and 800 °C, with soaking times of 0.5, 1, 2, 4, and 8 h. The criteria were a hardness of 200–265 HV and impact energies of KV ≥ 190 J in all HAZ subzones.
Results can be summarized as follows:
  • The PWHTs recommended in the literature were insufficient to obtain the desired combination of properties in all HAZ subzones.
  • Mechanical tests on real weld HAZ specimens cannot always reveal if the peak hardness and KV in an individual HAZ subzone are adequate or not. The peak hardness may not always be detected, and the results of Charpy tests must be regarded as some kind of an average value for the area of rupture. Therefore, smaller areas of insufficient toughness and excessive hardness may remain undetected.
  • At 740 °C, the desired combination of properties in all subzones was obtained in 8 h, while 4 h were not sufficient.
  • At 760 °C, the desired properties were obtained in 4 h, while 2 h was insufficient. Calculation of the Larson–Miller Parameter resulted in a minimum soaking time of 3.15 h.
  • At 780 °C, an impact energy above 190 J was assured after 0.5 h, while it took more than 1 h to obtain hardness below 250 HV—according to the calculation of LMP, about 1.2 h.
  • At 800 °C, the desired properties were obtained in 0.5 h.
  • Prolongation of soaking time over the necessary minimum did not deteriorate the properties. Even after 8 h at 800 °C, the hardness and impact toughness remained in the target range.
  • Upon PWHT, impact toughness reached the desired level sooner than the hardness in all subzones and at all temperatures.
  • The time vs. force signals recorded during the instrumented Charpy tests were analyzed, and total impact energies KV were divided into crack initiation energy Ei and crack propagation energy Ep. PWHT had only a minor influence on Ei, but a significant influence on Ep. This means, assuming the absence of any excess hydrogen, that the resistance against crack occurrence cannot be altered significantly by PWHT. On the contrary, the resistance against the propagation of existing cracks can be improved drastically, especially in the CGHAZ.
  • At 800 °C, 0.5 h is sufficient, at 780 °C 1–2 h are appropriate, and at 760 °C 3–4 h. With respect to a long soaking time, 740 °C is too low. As time is valuable, higher PWHT temperatures should be preferred. However, 800 °C is the upper permissible temperature [44], while any lowering prolongs the minimum duration exponentially. If the temperature differences cannot be held within a very narrow range of only a few °C across the whole volume of the furnace, it is more convenient to choose a lower temperature.

Author Contributions

Conceptualization, T.V. and G.L.; methodology, T.V.; validation, T.V. and G.L.; formal analysis, T.V. and G.L.; investigation, T.V. and G.L.; writing—original draft preparation, G.L.; writing—review and editing, G.L and T.V.; visualization, G.L and T.V.; supervision, T.V. All authors have read and agreed to the published version of the manuscript.

Funding

This research received no external funding.

Acknowledgments

The authors thank to Termoelektrarna Šoštanj d.o.o., for providing the material used for experiments.

Conflicts of Interest

The authors declare no conflict of interest.

References

  1. Arivazhagan, B.; Prabhu, R.; Albert, S.K.; Kamaraj, M.; Sundaresan, S. Microstructure and mechanical properties of 9Cr-1Mo steel weld fusion zones as a function of weld metal composition. J. Mater. Eng. Perform. 2009, 18, 999–1004. [Google Scholar] [CrossRef]
  2. Vuherer, T.; Gliha, V.; Milović, L.; Dunder, M.; Samardžić, I. Instruction of welding and review of steels for power plant equipment and possibility of using HAZ simulation in order improve weld joint quality. In Proceedings of the 6th International Scientific-Professional Conference SBW 2011: Modern Technologies and Processes in Production of Pressure Equipment, Welded Metal Constructions and Products, Slavonski Brod, Croatia, 26–28 October 2011; pp. 1–13. [Google Scholar]
  3. Despotović, B.; Marsenić, T.; Bajić, D.; Vuherer, T.; Samardžić, I. Weldability of modern 9-12 Cr martensitic steels for steam boiler components. Weld. Weld. Struct. 2013, 58, 5–14. [Google Scholar]
  4. Gnirs, G. Zavarivanje modernih kotlovskih čelika. Weld. Weld. Struct. 2002, 47, 103–113. [Google Scholar]
  5. Von Hagen, I.; Bendick, W. Creep resistant ferritic steels for power plants. Niobium, science & technology. In Proceedings of the International Symposium Niobium 2001, Orlando, FL, USA, 2–5 December 2001; pp. 753–776. [Google Scholar]
  6. Haarmann, K.; Vaillant, J.C.; Vandenberghe, B.; Bendick, W.; Asbab, A. The T91/P91 Book; Vallourec & Mannesmann Tubes: Duesseldorf, Germany, 2002. [Google Scholar]
  7. Li, H.; Mitchell, D. Microstructural characterization of P91 steel in the virgin, service exposed and post-service re-normalized conditions. Steel Res. Int. 2013, 84, 1302–1308. [Google Scholar] [CrossRef] [Green Version]
  8. Arivazhagan, B.; Kamaraj, M. A Study on Influence of D-Ferrite Phase on Toughness of P91 Steel Welds. Available online: https://www.steel-grips.com/articles/2013/sg13004.pdf (accessed on 21 June 2020).
  9. Dhandha, K.H.; Badheka, V.J. Effect of activating fluxes on weld bead morphology of P91 steel bead-on-plate welds by flux assisted tungsten inert gas welding process. J. Manuf. Process. 2015, 17, 48–57. [Google Scholar] [CrossRef]
  10. Mayer, K.H.; Masuyama, F. Creep Resistant Steels; Abe, F., Kern, T.U., Viswanathan, R., Eds.; Woodhead Publishing Limited: Cambridge, UK, 2008. [Google Scholar]
  11. Brinkmann, C.R.; Gieseke, B.; Alexander, J.; Maziasz, P.J. Modified 9Cr-1Mo Steel for Advanced Steam Generator Applications. In Proceedings of the ASME/IEEE Power Generation Conference, Boston, MA, USA, 21–25 October 1990. [Google Scholar]
  12. Natesan, K.; Majumdar, S.; Shankar, P.S.; Shah, V.N. Preliminary Materials Selection Issues for the Next Generation Nuclear Plant Reactor Pressure Vessel. Available online: https://core.ac.uk/download/pdf/71319287.pdf (accessed on 13 July 2020).
  13. Barnes, A.M. The effect of composition on microstructural development and mechanical properties of modified 9%Cr-1%Mo weld metals. In Microstructural Stability of Creep Resistant Alloys for High Temperature Plant Applications; The Institute of Materials London: London, UK, 1998; pp. 339–360. [Google Scholar]
  14. Marzocca, A.L.; Luppo, M.I.; Zalazar, M. Identification of precipitates in weldments performed in an ASTM A335 Gr P91 steel by the FCAW process. Procedia Mater. Sci. 2015, 8, 894–903. [Google Scholar] [CrossRef] [Green Version]
  15. Vidyarthy, R.S.; Dwivedi, D.K. Microstructural and mechanical properties assessment of the P91 A-TIG weld joints. J. Manuf. Process. 2018, 31, 523–535. [Google Scholar] [CrossRef]
  16. Krishnan, S.; Kulkarni, D.V.; De, A. Multipass pulsed current gas metal arc welding of P91 steel. Sci. Technol. Weld. Join. 2016, 21, 171–177. [Google Scholar] [CrossRef]
  17. Shanmugarajan, B.; Padmanabham, G.; Kumar, H.; Albert, S.K.; Bhaduri, A.K. Autogenous laser welding investigations on modified 9Cr-1Mo (P91) steel. Sci. Technol. Weld. Join. 2011, 16, 528–534. [Google Scholar] [CrossRef]
  18. Kundu, A.; Bouchard, P.J.; Kumar, S.; Venkata, K.A.; Francis, J.A.; Paradowska, A.; Dey, G.K.; Truman, C.E. Residual stresses in P91 steel electron beam welds. Sci. Technol. Weld. Join. 2013, 18, 271. [Google Scholar] [CrossRef]
  19. Pai, A.; Sogalad, I.; Albert, S.K.; Kumar, P.; Mitra, T.K.; Basavarajappa, S. Comparison of microstructure and properties of modified 9Cr-1Mo welds produced by narrow gap hot wire and cold wire gas tungsten arc welding processes. Procedia Mater. Sci. 2014, 5, 1482–1491. [Google Scholar] [CrossRef] [Green Version]
  20. Huysmans, S.; Vekeman, J. Challenging weld repair of grade 91 tubing by avoiding PWHT. Energy Mater. 2013, 4, 76–83. [Google Scholar] [CrossRef]
  21. Pal, K.; Pal, S.K. Effect of pulse parameters on weld quality in pulsed gas metal arc welding: A review. J. Mater. Eng. Perform. 2011, 20, 918–931. [Google Scholar] [CrossRef]
  22. Krishnan, S.; Kulkarni, D.V.; De, A. Pulsed current gas metal arc welding of P91 steels using metal cored wires. J. Mater. Process. Tech. 2016, 229, 826–833. [Google Scholar] [CrossRef]
  23. Rahel, M.; Tadepalli, L.D.; Balubai, M.; Reddy, K.S.K.; Subbiah, R. Tribological properties on P91 alloy steel treated with normalizing & carburizing process. Int. J. Eng. Adv. Technol. 2019, 9, 2078–2082. [Google Scholar] [CrossRef]
  24. Mroziński, S.; Piotrowski, M. Influence of temperature and loading program on the fatigue life of steel P91. Acta Mech. Autom. 2013, 7, 93–98. [Google Scholar] [CrossRef] [Green Version]
  25. Taniguchi, G.; Yamashita, K. Effects of Post Weld Heat Treatment (PWHT) Temperature on Mechanical Properties of Weld Metals for High-Cr Ferritic Heat-Resistant Steel. Available online: https://www.kobelco.co.jp/english/ktr/pdf/ktr_32/033-039.pdf (accessed on 10 July 2020).
  26. Šturm, R.; Jenko, M.; Ule, B. A creep-properties evaluation of P91 steel weldments using short-term testing—Ocenitev lastnosti lezenja vara iz jekla P91 s kratkotrajnimi preskusi. Mater. Technol. 2002, 36, 319–324. [Google Scholar]
  27. Panait, C.G.; Bendick, W.; Fuchsmann, A.; Gourgues-Lorenzon, A.F.; Besson, J. Study of the microstructure of the Grade 91 steel after more than 100,000 h of creep exposure at 600 °C. Int. J. Pres. Ves. Pip. 2010, 87, 326–335. [Google Scholar] [CrossRef] [Green Version]
  28. Albert, S.K.; Matsui, M.; Watanabe, T.; Hongo, H.; Kubo, K.; Tabuchi, M. Variation in the Type IV cracking behaviour of a high Cr steel weld with post weld heat treatment. Int. J. Pres. Ves. Pip. 2003, 80, 405–413. [Google Scholar] [CrossRef]
  29. Sawada, K.; Bauer, M.; Kauffmann, F.; Mayr, P.; Klenk, A. Microstructural change of 9% Cr-welded joints after long-term creep. Mater. Sci. Eng. A 2010, 527, 1417–1426. [Google Scholar] [CrossRef]
  30. Hyde, T.H.; Saber, M.; Sun, W. Creep crack growth data and prediction for a P91 weld at 650 degrees C. Int. J. Pres. Ves. Pip. 2010, 87, 721–729. [Google Scholar] [CrossRef]
  31. Venugopal, S.; Sasikala, G.; Kumar, Y. Creep Crack Growth Behavior of a P91 Steel Weld. Procedia Eng. 2014, 86, 662–668. [Google Scholar] [CrossRef] [Green Version]
  32. Kumar, Y.; Venugopal, S.; Sasikala, G.; Parida, P.K.; Moitra, A. Study of creep crack growth behaviour of a type 316(N) stainless steel weld and its mechanism. Mat. Sci. Eng. A Struct. 2018, 731, 551–560. [Google Scholar] [CrossRef]
  33. Baral, J.; Swaminathan, J.; Chakrabarti, D.; Ghosh, R.N. Effect of welding on creep damage evolution in P91B steel. J. Nucl. Mater. 2017, 490, 333–343. [Google Scholar] [CrossRef]
  34. Silva, F.J.G.; Pinho, A.P.; Pereira, A.B.; Paiva, O.C. Evaluation of welded joints in P91 steel under different heat-treatment conditions. Metals 2020, 10, 99. [Google Scholar] [CrossRef] [Green Version]
  35. Venkata, K.A.; Kumar, S.; Dey, H.C.; Smith, D.J.; Bouchard, P.J.; Truman, C.E. Study on the effect of post weld heat treatment parameters on the relaxation of welding residual stresses in electron beam welded P91 steel plates. Procedia Eng. 2014, 86, 223–233. [Google Scholar] [CrossRef] [Green Version]
  36. Abd El-Rahman Abd El-Salam, M.; El-Mahallawi, I.; El-Koussy, M.R. Influence of heat input and post-weld heat treatment on boiler steel P91 (9Cr–1Mo–V–Nb) weld joints part 1—Microstructure. Int. Heat Treat. Surf. Eng. 2013, 7, 23–31. [Google Scholar] [CrossRef]
  37. Kent, K.; Coleman, W.F.; Newell, J.R. Welding the new-generation Cr-Mo alloys for high-temperature service. Weld J. 2007, 86, 29–33. [Google Scholar]
  38. Sucena Marques, J.M.; Coutinho, L.; Maneta, V. Analysis of Cold Cracking in Welds of Grade 91 Steel. Available online: https://fenix.tecnico.ulisboa.pt/downloadFile/1689244997255334 (accessed on 20 July 2020).
  39. Alexandrov, B.; Wang, L.; Siefert, J.; Tatman, J.; Lippold, J. Phase transformations in creep strength enhanced ferritic steel welds. In Proceedings of the VIII International Congress “Machines, Technologies, Materials”, Varna, Bulgaria, 18–21 September 2011; pp. 13–16. [Google Scholar]
  40. Silwal, B.; Li, L.; Deceuster, A.; Griffiths, B. Effect of postweld heat treatment on the toughness of heat-affected zone for grade 91 steel. Weld J. 2013, 92, 80–87. [Google Scholar]
  41. Vimalan, G.; Ravichandran, G.; Muthupandi, V. Phase transformation behaviour in P91 during post weld heat treatment: A gleeble study. Trans. Indian Inst. Metals 2017, 70, 875–885. [Google Scholar] [CrossRef]
  42. Pandey, C.; Mahapatra, M.M.; Kumar, P.; Saini, N. Effect of normalization and tempering on microstructure and mechanical properties of V-groove and narrow-groove P91 pipe weldments. Mater. Sci. Eng. A 2017, 685, 39–49. [Google Scholar] [CrossRef]
  43. Arivazhagan, B.; Vasudevan, M. A comparative study on the effect of GTAW processes on the microstructure and mechanical properties of P91 steel weld joints. J. Manuf. Process. 2014, 16, 305–311. [Google Scholar] [CrossRef]
  44. ASME Boiler and Pressure Vessel Committee, Subcommittee on Materials. ASME Boiler and Pressure Vessel Code, Section II, Part A Ferrous Material Specifications (Beginning to SA-450); The American Society of Mechanical Engineers: New York, NY, USA, 2013; Volume II, p. 834. [Google Scholar]
  45. Peng, N.G.; Ahmad, B.; Muhamad, M.R.; Ahadlin, M. Phase transformation of P91 steels upon cooling after short term overheating above Ac-1 & Ac-3 temperature. Adv. Mater. Res. Switz. 2013, 634–638, 1756–1765. [Google Scholar] [CrossRef]
  46. De Smet, P.; Van Wortel, H. Controlling heat treatment of welded P91. Weld J. 2006, 85, 42–45. [Google Scholar]
  47. Sharma, A.; Kant Verma, D.; Kumaran, S. Effect of post weld heat treatment on microstructure and mechanical properties of Hot Wire GTA welded joints of SA213 T91 steel. Mater. Today Proc. 2018, 5, 8049–8056. [Google Scholar] [CrossRef]
  48. Pandey, C.; Mahapatra, M.M.; Kumar, P.; Daniel, F.; Adhithan, B. Softening mechanism of P91 steel weldments using heat treatments. Arch. Civ. Mech. Eng. 2019, 19, 297–310. [Google Scholar] [CrossRef]
  49. Manugula, V.L.; Rajulapati, K.V.; Reddy, G.M.; Rao, K.B.S. Role of evolving microstructure on the mechanical properties of electron beam welded ferritic-martensitic steel in the as-welded and post weld heat-treated states. Mater. Sci. Eng. A 2017, 698, 36–45. [Google Scholar] [CrossRef]
  50. Chuvas, T.C.; Garcia, P.S.P.; Pardal, J.M.; Fonseca, M.D.C. Influence of heat treatment in residual stresses generated in P91 steel-pipe weld. Mater. Res. Ibero Am. J. 2015, 18, 614–621. [Google Scholar] [CrossRef] [Green Version]
  51. Ohlsson, J. Effects of different heat treatments on hardness of Grade 91 steel. Degree project for Bachelor of Science in Mechanical Engineering. Bachelor’s Thesis, Karstads University, Karlstad, Sweden, 2014. [Google Scholar]
  52. Abd El-Rahman Abd El-Salam, M.; El-Mahallawi, I.; El-Koussy, M.R. Influence of heat input and post-weld heat treatment on boiler steel P91 (9Cr–1Mo–V–Nb) weld joints part 2—Mechanical properties. Int. Heat Treat. Surf. Eng. 2013, 7, 32–37. [Google Scholar] [CrossRef]
  53. Kucharczyk, P.; Madia, M.; Zerbst, U.; Schork, B.; Gerwien, P.; Münstermann, S. Fracture-mechanics based prediction of the fatigue strength of weldments. Material aspects. Eng. Fract. Mech. 2018, 198, 79–102. [Google Scholar] [CrossRef]
  54. Vuherer, T.; Godina, A.; Burzic, Z.; Gliha, V. Fatigue crack initiation from microstructurally small vickers indentations. Metalurgija 2007, 46, 237–243. [Google Scholar]
  55. Rojko, D.; Gliha, V. Simulations of transformation kinetics in a multi-pass weld. Mater. Manuf. Process. 2007, 20, 833–849. [Google Scholar] [CrossRef]
  56. Celin, R.; Burja, J.; Kosec, G. A comparison of as-welded and simulated heat affected zone (HAZ) microstructures. Mater. Tehnol. 2016, 50, 455–460. [Google Scholar] [CrossRef]
  57. Sulaiman, S. Structure of Properties of the Heat Affected Zone of P91 Creep Resistant Steel. Ph.D. Thesis, University of Wollongong, Wollongong, Australia, 2007. [Google Scholar]
  58. Vuherer, T.; Dunder, M.; Milovic, L.J.; Zrilic, M.; Samardzic, I. Microstructural investigation of the heat-affected zone of simulated welded joint of P91 steel. Metalurgija 2013, 52, 317–320. [Google Scholar]
  59. Milović, L.; Vuherer, T.; Blačić, I.; Vrhovac, M.; Stanković, M. Microstructures and mechanical properties of creep resistant steel for application at elevated temperatures. Mater. Design. 2013, 46, 660–667. [Google Scholar] [CrossRef]
  60. Pandey, C.; Mahapatra, M.M.; Kumar, P.; Saini, N. Effect of creep phenomena on room-temperature tensile properties of cast & forged P91 steel. Eng. Fail. Anal. 2017, 79, 385–396. [Google Scholar] [CrossRef]
  61. Lomozik, M.; Zielinska-Lipiec, A. Microscopic analysis of the influence of multiple thermal cycles on simulated Haz toughness in P91 steel. Arch. Metall. Mater. 2008, 53, 1025–1034. [Google Scholar]
  62. Li, D.K.; Hu, S.; Liu, X.; Xie, Y.; Feng, C. Safety performance assessment strategies of P91 steel based on leeb hardness. IOP Conf. Ser. Earth Environ. 2019, 295. [Google Scholar] [CrossRef]
  63. Paddea, S.; Francis, J.A.; Paradowska, A.M.; Bouchard, P.J.; Shibli, I.A. Residual stress distributions in a P91 steel-pipe girth weld before and after post weld heat treatment. Mater. Sci. Eng. A 2012, 534, 663–672. [Google Scholar] [CrossRef]
  64. Pandey, C.; Mahapatra, M.M.; Kumar, P.; Saini, N. Some studies on P91 steel and their weldments. J. Alloy Compd. 2018, 743, 332–364. [Google Scholar] [CrossRef]
  65. Wang, Y.; Kannan, R.; Li, L. Characterization of as-welded microstructure of heat-affected zone in modified 9Cr–1Mo–V–Nb steel weldment. Mater. Charact. 2016, 118, 225–234. [Google Scholar] [CrossRef] [Green Version]
  66. Pandey, C.; Mahapatra, M.M. Evolution of phases during tempering of P91 steel at 760 °C for varying tempering time and their effect on microstructure and mechanical properties. Proc. Inst. Mech. Eng. Part E J. Process Mech. Eng. 2016, 231, 1141–1161. [Google Scholar] [CrossRef]
  67. Pandey, C.; Mahapatra, M.M.; Kumar, P.; Giri, A. Microstructure characterization and charpy toughness of P91 weldment for as-welded, post-weld heat treatment and normalizing & tempering heat treatment. Metals Mater. Int. 2017, 23, 900–914. [Google Scholar] [CrossRef]
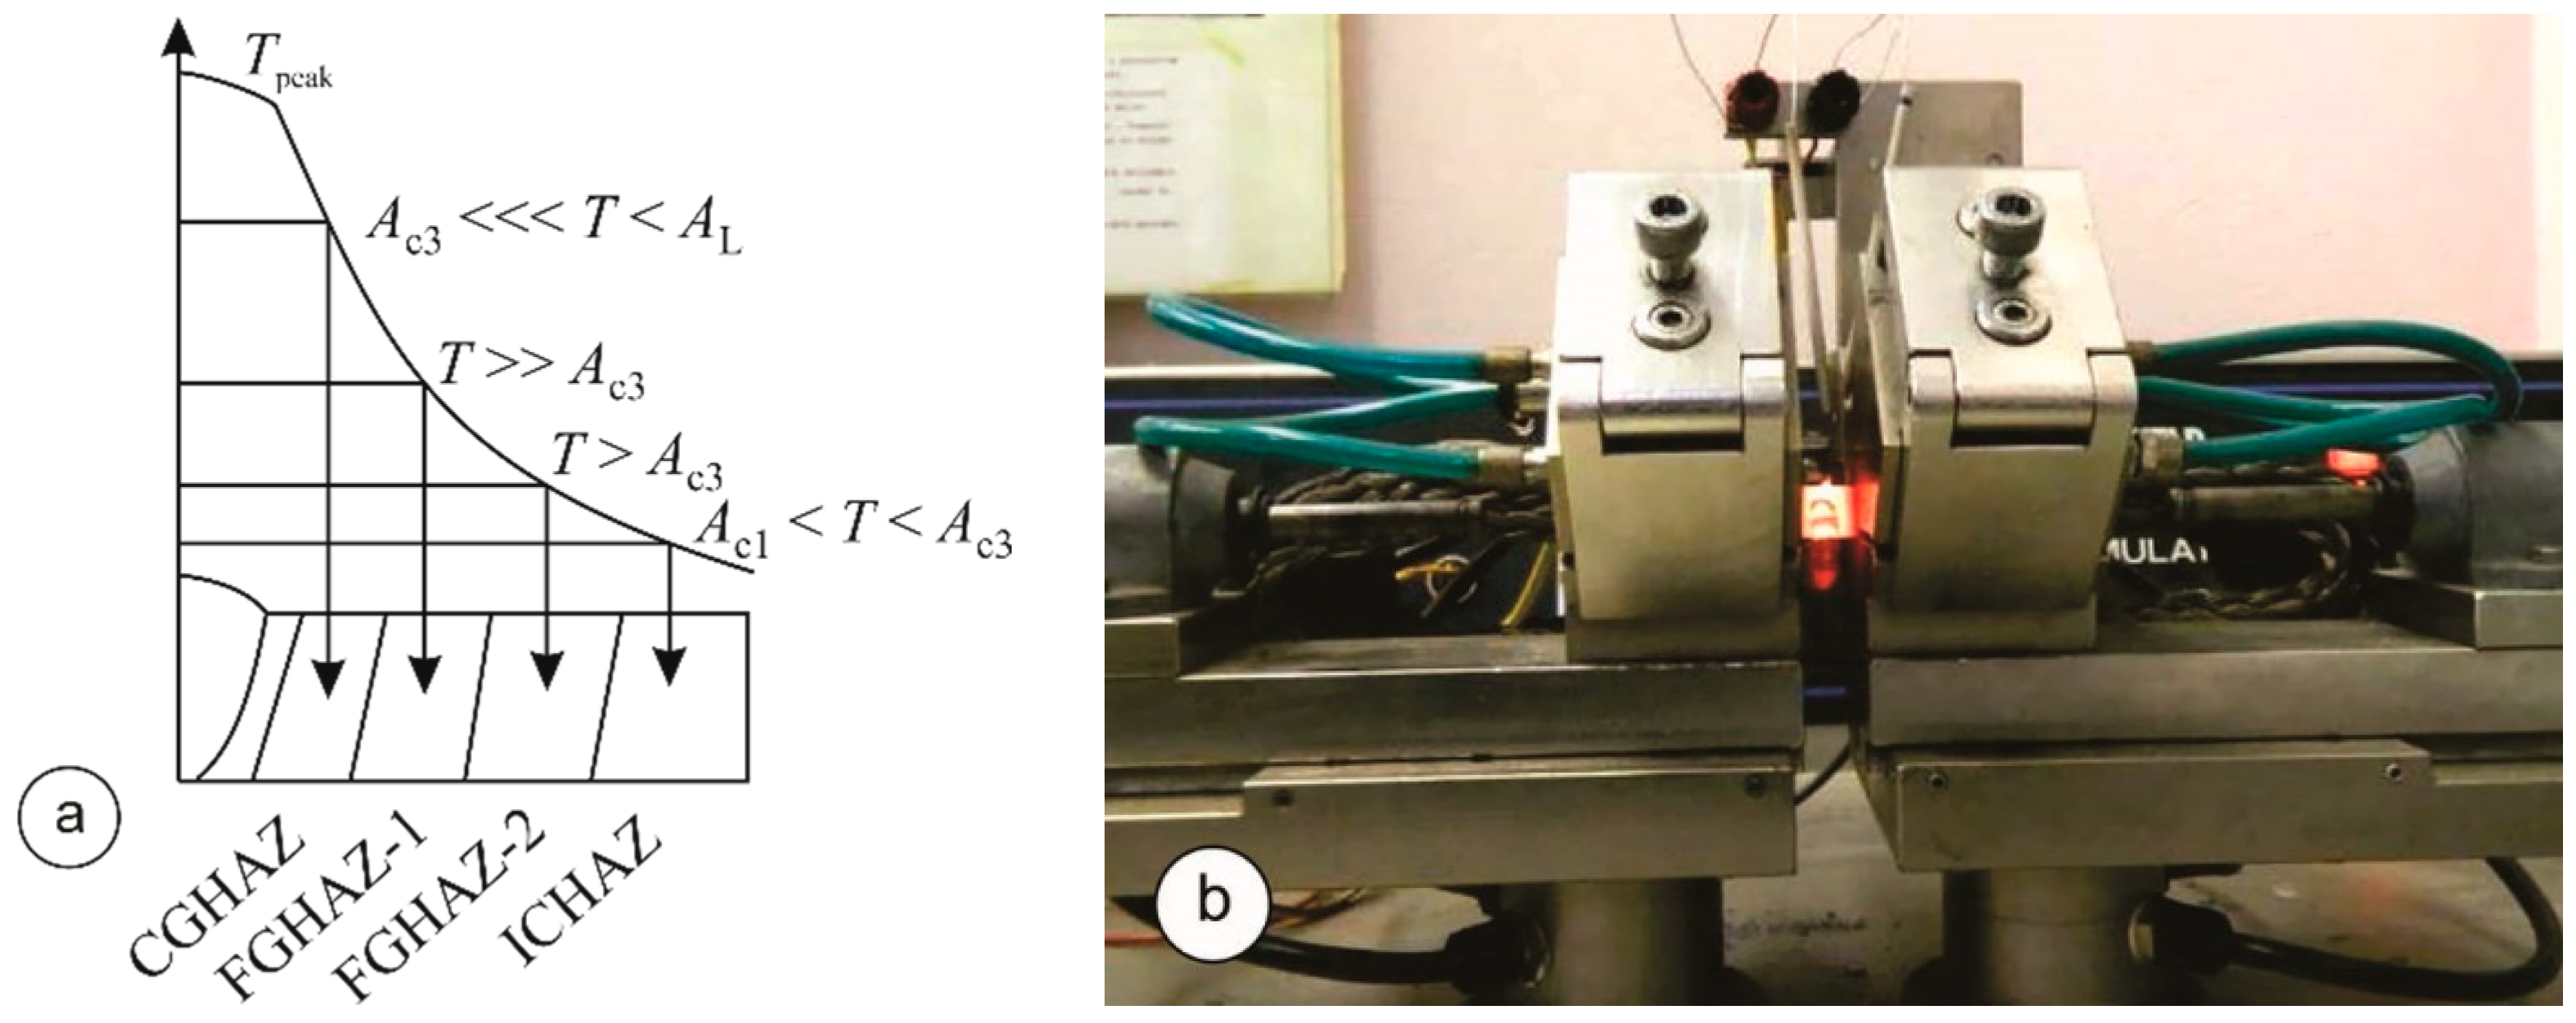
Figure 1. (a) HAZ subzones of interest; (b) A specimen during simulation-SMITWELD 1405.
Metals 10 01215 g001
Figure 2. Characteristic (a) T-t and (b) TL curves for determination of transformation temperatures AC1, AC3, Ms and Mf.
Metals 10 01215 g002
Figure 3. Schematic diagram of heat treatments; tPWHT equals soaking time at the selected annealing temperature.
Metals 10 01215 g003
Figure 4. Principle of dividing the total impact energy KV into energy for crack initiation Ei and energy for crack propagation Ep; the diagram belongs to the sample of FGHAZ-1 without PWHT.
Metals 10 01215 g004
Figure 5. Hardness after PWHT at (a) 740 °C; (b) 760 °C; (c) 780 °C and (d) 800 °C.
Metals 10 01215 g005
Figure 6. The total impact energies KV in individual HAZ subzones: (a) CGHAZ; (b) FGHAZ-1; (c) FGHAZ-2; (d) ICHAZ; Annealing time t = 0 denotes as-welded condition.
Metals 10 01215 g006
Figure 7. The total impact energies KV in individual HAZ subzones: (a) after PWHT at 740 °C; (b) after PWHT at 760 °C; (c) after PWHT at 780 °C; (d) after PWHT at 800 °C; Annealing time t = 0 denotes as-welded condition.
Metals 10 01215 g007
Figure 8. Crack initiation energies Ei of HAZ subzones after PWHT at (a) 740 °C; (b) 760 °C; (c) 780 °C; (d) 800 °C.
Metals 10 01215 g008
Figure 9. Crack propagation energies Ep of HAZ subzones after PWHT at (a) 740 °C; (b) 760 °C; (c) 780 °C; (d) 800 °C.
Metals 10 01215 g009
Figure 10. Change of (a) hardness and (b) impact energy upon recommendable PWHTs.
Metals 10 01215 g010
Figure 11. Microstructures of HAZ subzones without PWHT.
Metals 10 01215 g011
Figure 12. Microstructures after PWHT at 760–800 °C for 1 h.
Metals 10 01215 g012
Figure 13. Microstructures after PWHT at 760–800 °C for 2 h.
Metals 10 01215 g013
Figure 14. (a) SEM micrograph of the post weld heat treated FGHAZ-2; PWHT 2 h at 780 °C; (b) White arrows point at some Cr, Fe, V and Mo-rich M23C6 type carbide precipitates (analyzed by EDS).
Metals 10 01215 g014
Table 1. Chemical composition of the P91 steel according to the material’s certificate (wt.%).
CSiMnPSCrMoNiVNNb
0.100.440.460.010.0028.810.900.30.230.050.08
Table 2. Mechanical properties of the P91 steel.
Rp02/MPaRm/MPaA5/%HV 10KV (ISO-V) at 20 °C/J
45062019211192
Table 3. Parameters for HAZs material preparation in a weld thermal cycle simulator.
ParameterCGHAZFGHAZ-1FGHAZ-2ICHAZ
Preheat T/°C200200200200
Heating rate/°C s−1150150150150
Tpeak/°C13501100940875
Thold/°C13501100940875
thold/s0.50.50.50.5
Δt8–5/s10101010
Tfinish/°C220220220220
Table 4. Hardness and impact energies of simulated HAZ subzones.
HAZ subzoneTpeak/°CHV 10KV/JEi/JEp/J% of Ductile Fracture
CHHAZ1350462737033.9
FGHAZ-11100466121794244.1
FGHAZ-29403901727010274.3
ICHAZ87523524674172100
Table 5. Hardness and impact energies of real weld HAZ and simulated HAZ subzones after similar PWHTs. The values in the columns “HV 10” and “KV” are the results of individual measurements.
HAZHAZHV 10Average HV 10KVAverage KV
SubzonesIndividual MeasurementsSubzoneHAZInd. Measur.SubzoneHAZ
Real weld HAZ
740–770 °C, 2.3 h
-243, 262, 254-251154, 216, 130-167
-238, 268, 258-
-243, 254-
-251, 243, 243-
Simulated HAZ
740 °C, 2 h
CGHAZ299, 300, 300, 300, 300, 30930125487, 120, 112106232
FGHAZ-1255, 250, 250, 249, 252, 254252251, 254, 280262
FGHAZ-2233, 234, 239, 237, 235, 237236298, 287, 305297
ICHAZ232, 229, 227, 229, 223, 228228265, 271, 251262
Simulated HAZ
740 °C 4 h
CGHAZ281, 298, 296, 295, 296, 285292247101, 95, 4279216
FGHAZ-1237, 237, 233, 240, 240, 237237247, 249, 256251
FGHAZ-2241, 232, 236, 232, 238, 237236237, 256, 261251
ICHAZ222, 226, 230, 221, 219,221223269, 284, 292282
Simulated HAZ
760 °C, 2 h
CGHAZ296, 311, 303, 307, 304, 303304257152, 149, 138146237
FGHAZ-1262, 254, 263, 260, 259, 262260279, 283, 270277
FGHAZ-2240, 250, 242, 245, 241, 244244269, 286, 292282
ICHAZ221, 221, 222, 221, 221, 225222248, 243, 240244
Simulated HAZ
760 °C, 4 h
CGHAZ275, 272, 267, 265, 270, 272270246212, 221, 207213257
FGHAZ-1255, 256, 260, 255, 257, 257257255, 239, 257250
FGHAZ-2234, 233, 232, 231, 232, 232232286, 289, 302292
ICHAZ225, 226, 229, 231, 223, 223226280, 277, 260272