Abstract
It is necessary to establish a constitutive model of 30CrMoA steel to optimize the forming shape and mechanical properties of high-speed train axles. The experimental stress–strain curve of 30CrMoA steel was obtained by an isothermal compression test on a Gleeble-3500 thermal simulation test machine under temperature of 1273~1423 K and strain rate of 0.01~10 s−1. Considering the effect of strain on the material constant, an empirical constitutive model was proposed with strain correction for 30CrMoA steel. In addition, the material constant in the constitutive model is determined by linear regression analysis of the experimental stress–strain curve. Comparing the theoretical value and experimental value of flow stress, the correlation R is 0.9828 and the average relative error (ARRE) is 4.652%. The constitutive model of 30CrMoA steel with strain correction can reasonably predict the flow stress under various conditions. The results provide an effective numerical tool for further study on accurate near-net forming of high-speed train axles.
1. Introduction
30CrMoA steel is a medium carbon alloy structural steel with high hardenability, good strength, and toughness. It is widely used in special equipment such as train axles, aviation parts, and pressure vessels. The forming quality and accuracy of mechanical parts depend on the forming process [1,2,3,4,5]. Therefore, in order to better formulate the plastic forming process of 30CrMoA steel at high temperature, it is important to study the flow stress behavior of 30CrMoA steel during hot working. There are three main types of constitutive equations that generally describe the high-temperature rheological properties of metals: the empirical model, the probability model, and the internal variable model. The empirical model is the most widely used one in practice among them [6,7]. An empirical constitutive model is based on dislocation and dynamic recrystallization theories. The model expressed by the Arrhenius equation is widely used for the prediction of the deformation behavior of materials. Lin et al. [8] studied the flow stress behavior of 42CrMo steel at a deformation temperature of 850~1150 °C and a strain rate of 0.01~50 s−1. The research shows that the maximum error between the theoretical value and the experimental value of the peak stress is only 4.54%. Wang et al. [9] implemented the compression tests of 20Cr2Ni4A steel on a Gleeble-3500 thermal simulation machine at different deformation temperatures and strain rates. The Arrhenius-type constitutive equation and Zener-Hollomon parameter are determined to describe the deformation behavior of 20Cr2Ni4A steel. Dou and Liu [10] obtained the flow stress curves of YQ450NQR1 steel by conducting isothermal compression tests using Gleeble-1500 thermal simulation machine covering the temperature range of 1143–1433 K. Additionally, they established a constitutive model considering deformation activation energy from the experimental stress–strain data. Since the empirical constitutive model described by the Arrhenius equation only takes steady-state stress or peak stress into account, it cannot completely reflect the flow stress behavior of the material during the thermal deformation process [11]. Hence, in order to completely and accurately describe the flow stress behavior of metal at high temperature, the influence of strain on the constitutive model needs to be considered. Cai et al. [12] found that considering strain correction, the constitutive equation can predict the flow stress of Ti6-Al-4V alloy. Ding et al. [13] developed a constitutive model with strain correction for as-cast high-Cr ultra-super-critical (USC) rotor steel. The average relative error between the predicted value and the experimental value was only 4.637%. Duan et al. [14] studied the deformation behavior of 42CrMo gear steel. By polynomial fitting, the relationship between strain and material constants, the strain-compensated Arrhenius constitutive equation for 42CrMo gear steel was established. Based on the researches above, this paper uses thermal simulation experiments to obtain the stress–strain curve of 30CrMoA steel during isothermal compression. In addition, then an empirical constitutive equation based on the Arrhenius model is established. Considering the effect of strain, the constitutive equation with strain correction of 30CrMoA steel is proposed. Last, the correlation coefficient and average relative error are introduced to verify the accuracy of the constitutive model.
The core of this work is the calibration process of an Arrhenius model-based constitutive model by curve fitting. The contribution of the paper is the experimental data and a calibration model specific to 30CrMoA steel. The establishment of the constitutive model of 30CrMoA steel can be used to further study the processing technology of 30CrMoA steel at high temperature and to establish its material model in simulation.
2. Experimental Materials and Methods
The chemical composition of the 30CrMoA steel used in the experiment is shown in Table 1. A small cylindrical specimen of dimensions Φ8 mm × 12 mm was used. The stress–strain curve is measured on a Gleeble-3500 thermal simulation test machine (DATA SCIENCES INTERNATIONAL Inc., Saint Paul, MN, USA).

Table 1.
Chemical composition of 30CrMoA steel (wt.%).
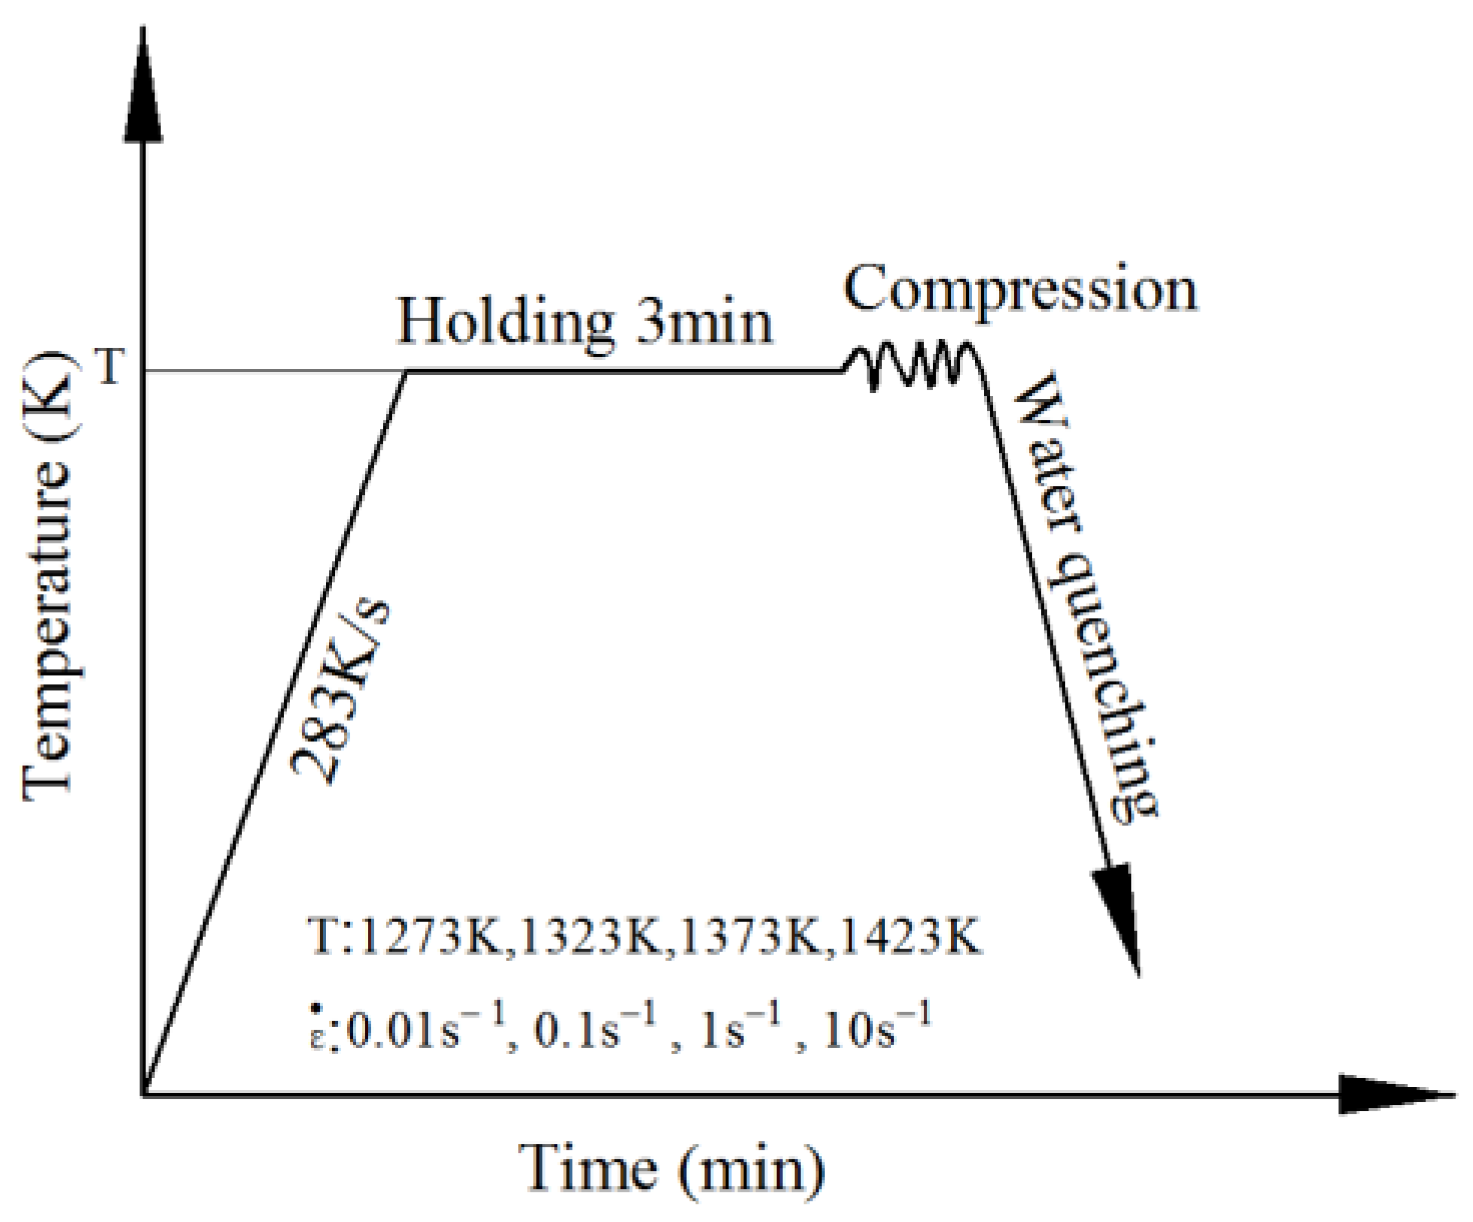
Thermal simulation experiments can be used to determine the heating temperature range of the billet when the high-speed train axle is rolled by three-roll skew rolling. According to the process characteristics of three-roll skew rolling and the material properties of 30CrMoA steel, the experimental stress–strain curve measurement process is shown in Figure 1. First, the small cylindrical sample is heated to the experimental temperature T at a heating rate of 283 K/s. Second, the sample is held for 3 min in order to be uniformly heated. Then, the sample is compressed by 60% in the axial direction at a certain strain rate and the experimental data is recorded by a computer. Lastly, the sample is water quenched immediately after the compression is completed.
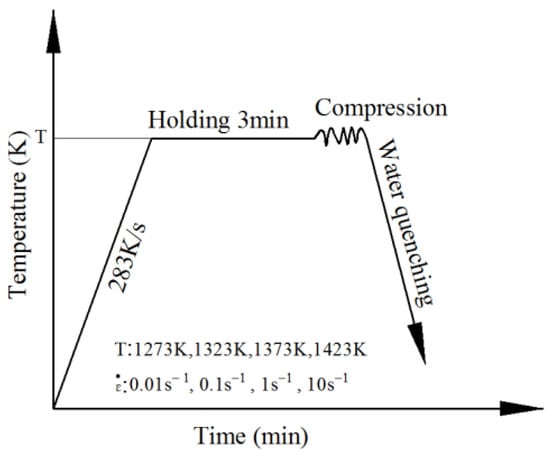
Figure 1.
Experimental procedure for measuring the experimental stress–strain curve of 30CrMoA.
3. Measurement Results and Analysis of Experimental Stress–Strain Curves
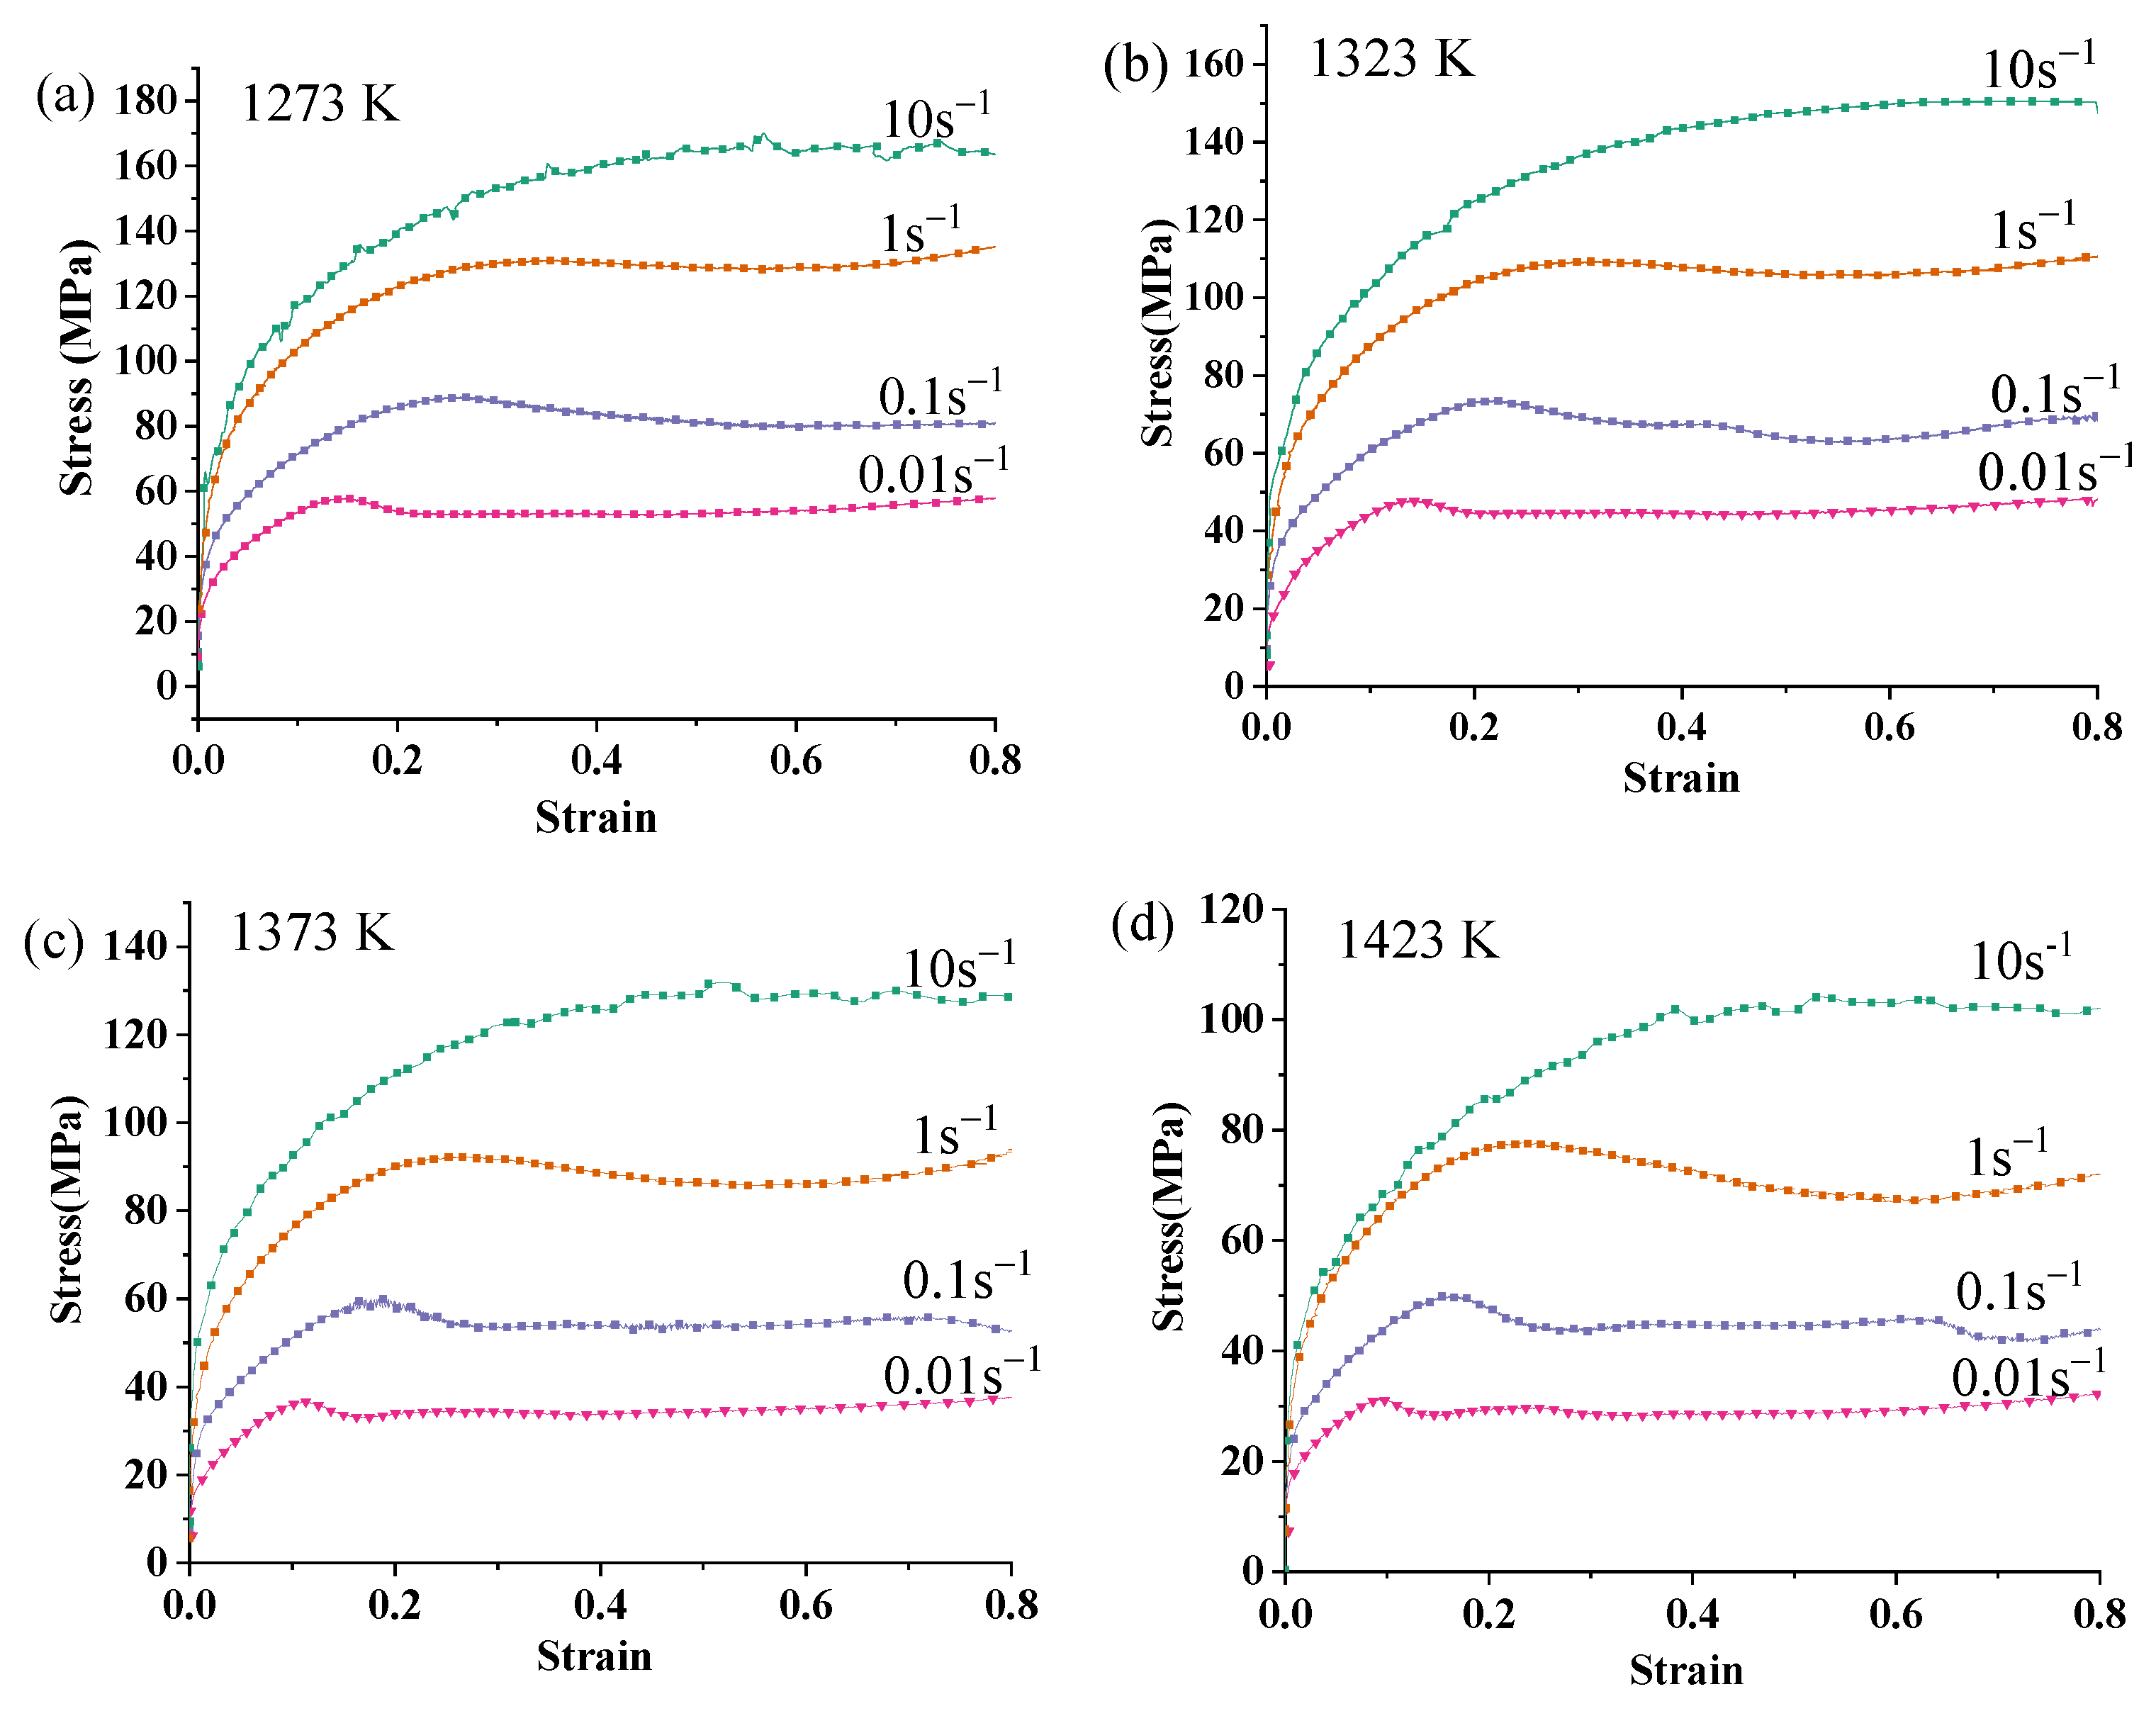
The experimental stress–strain curves of 30CrMoA steel at different deformation temperatures and strain rates are shown in Figure 2. It can be seen from the figure that the flow stress increases rapidly with the increase of the strain at the early stage. Then, it will peak and stabilize. At the same temperature, the smaller the strain rate, the smaller the flow stress and the peak stress. At the same strain rate, the higher the temperature, the smaller the flow stress and the peak stress. At low strain rates, the stress–strain curve rapidly rises to a peak, then decreases significantly, and finally, stabilizes, which indicates that the softening of the material caused by dynamic recrystallization plays a leading role. At high strain rates, the stress–strain curve first rises rapidly, later rises slowly, and finally stabilizes, which indicates that material softening caused by dynamic recovery and work hardening caused by strain both play a leading role.
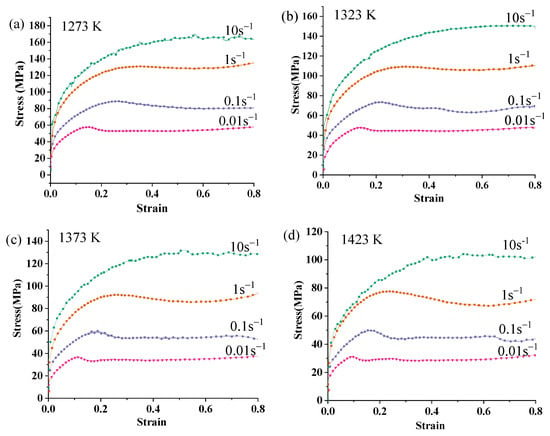
Figure 2.
Experimental stress–strain curve of 30CrMoA steel under high-temperature compression: (a) T = 1273 K, (b) T = 1323 K, (c) T = 1373 K, and (d) T = 1423 K.
4. Establishment of Empirical Constitutive Model
It can be seen from Figure 2 that the flow stress mainly depends on the strain rate and the deformation temperature. The relationship among the flow stress, strain rate, and temperature of metallic materials can be described by power function, exponential function, and hyperbolic sine function. The power function is mainly applicable to low stress conditions, and the exponential function is mainly applicable to high stress conditions. The hyperbolic sine function proposed by Sellars et al. [15] is applicable under all stress conditions.
The stress function in the form of a hyperbolic sine function is often used to express the plastic strain rate during the deformation of metal at high temperature [15]:
where is the strain rate (s−1); A, α, and n are the material constants; σp is the peak stress; Q is the deformation activation energy (J·mol−1); R is the gas constant (8.314 J·mol−1·K−1); and T is the temperature (K).
Under low stress conditions:
where n0 is the material constant.
Under high stress conditions:
where β is the material constant to be solved, α = β/n0.
Logarithmic operations on both sides of Equations (2) and (3) are:
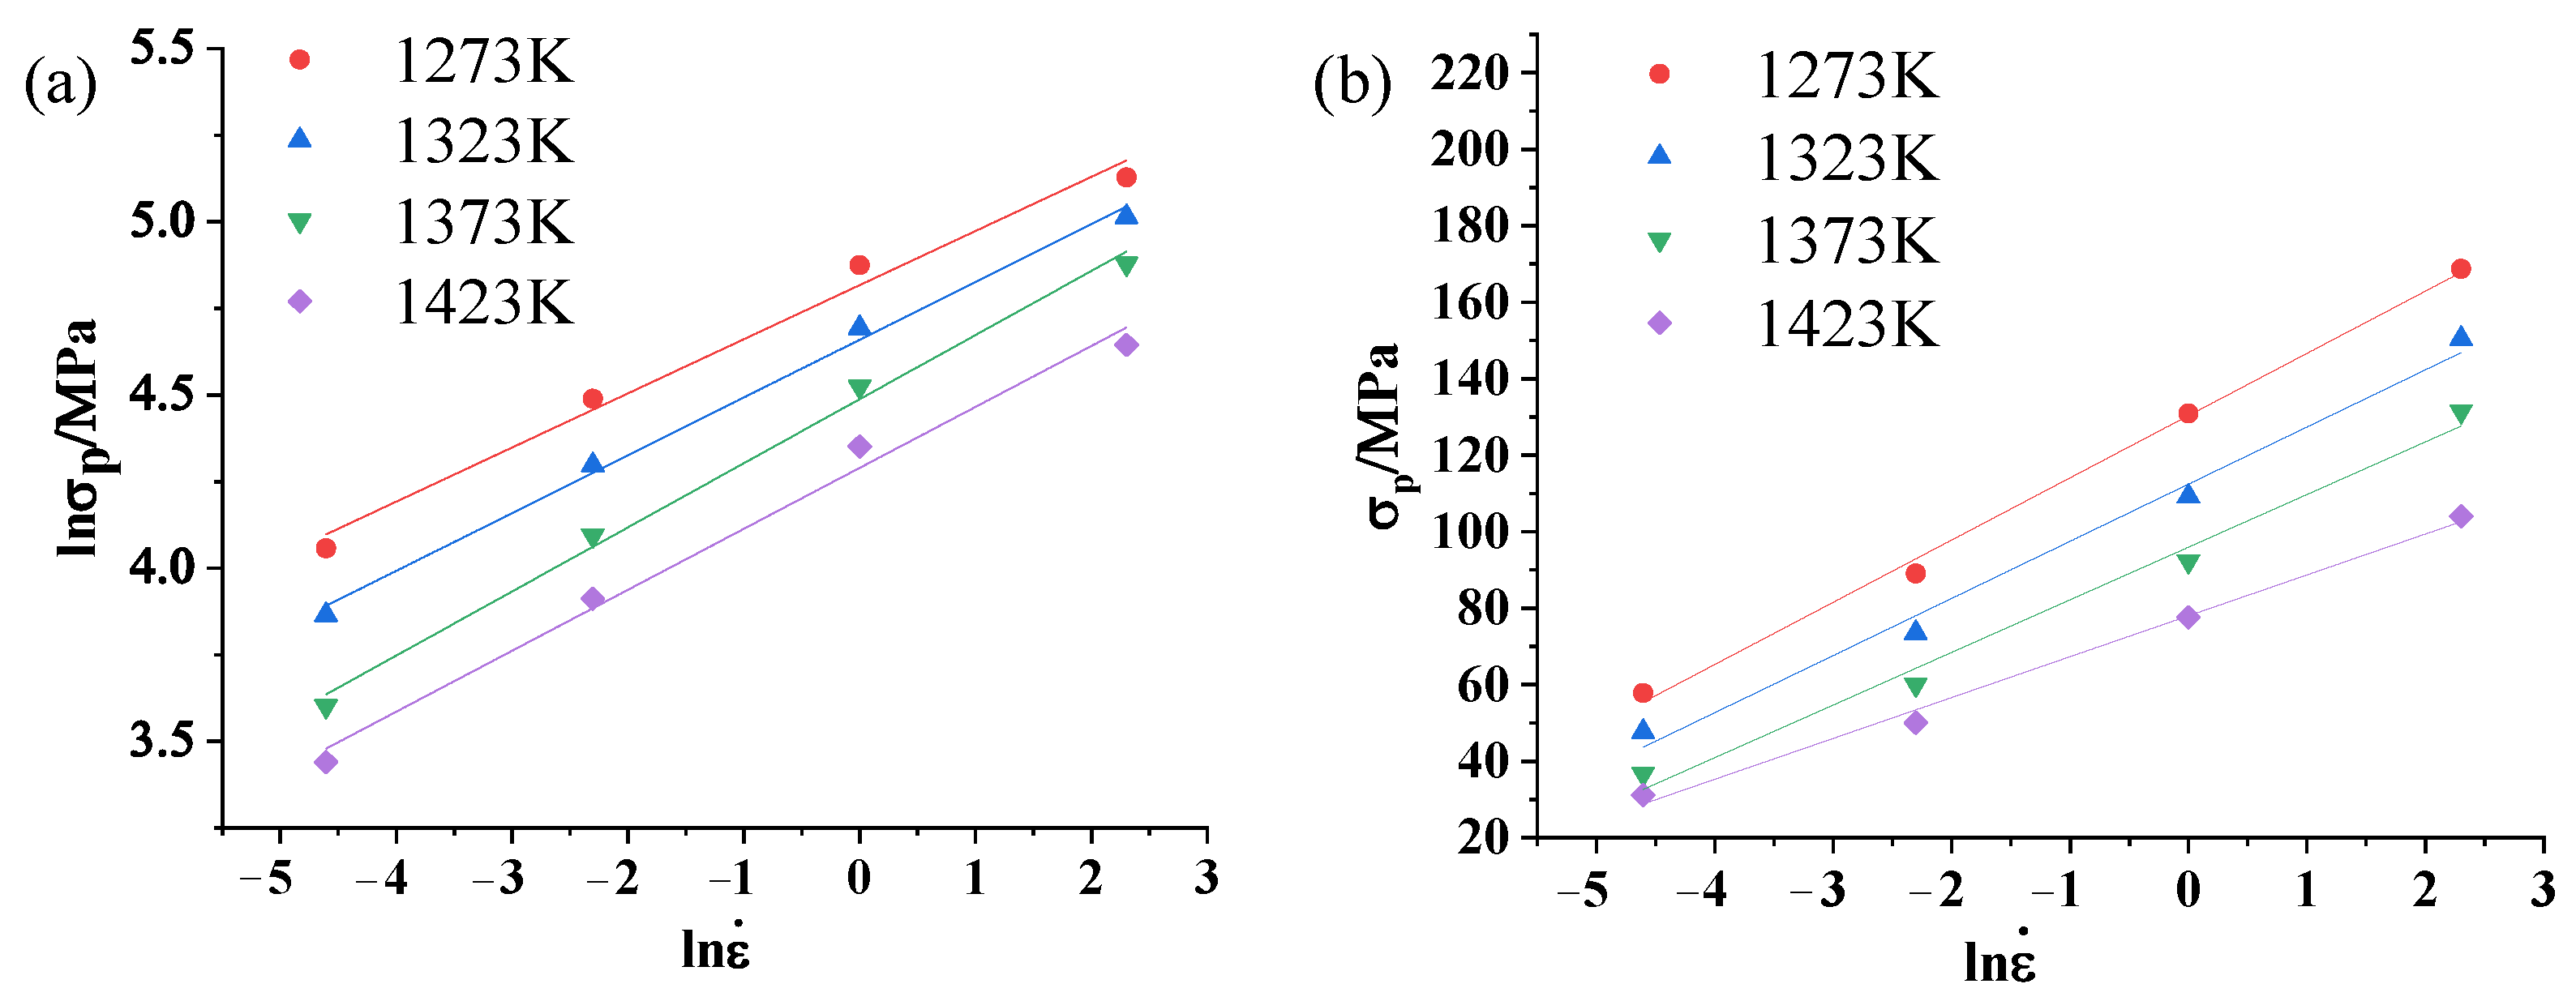
By performing a linear regression analysis on the data in Figure 2, the relationship between and lnσp and the relationship between and σp are all clearly shown as a typical univariate linear relationship in Figure 3. From Equations (4) and (5), we know that the inverse of the slope of the straight line are n0 and β. Besides, the mean of n0 is 5.929 and the mean of β is 0.066 MPa−1. Then, α = β/n0 = 0.011 MPa−1.
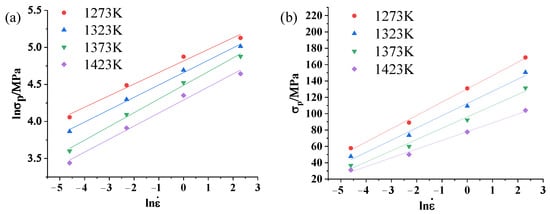
Figure 3.
Relationship between strain rate and peak stress at different temperatures: (a) —lnσp and (b) —σp.
Perform logarithmic operations on both sides of Equation (1):
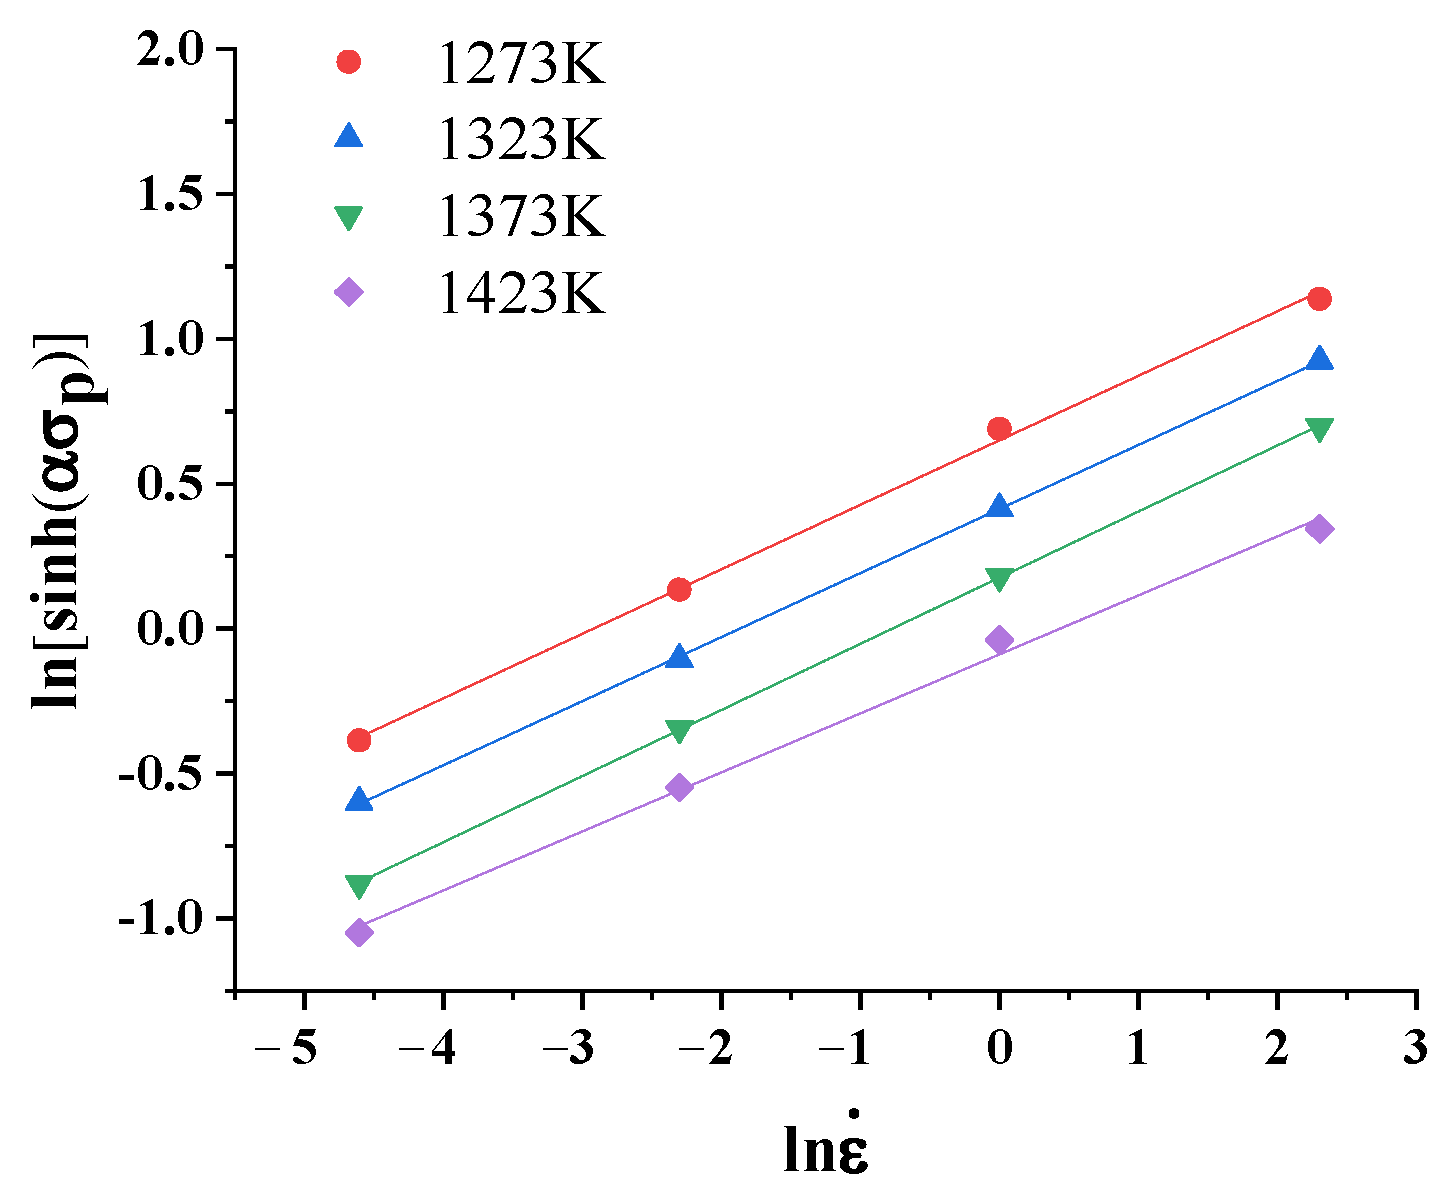
By substituting α = 0.011 MPa−1 into Equation (6), the relationship between and ln[sinh(ασp)] can be obtained, as shown in Figure 4. From Equation (6), the inverse of the slope of the straight line is n and the mean of n is 4.403.
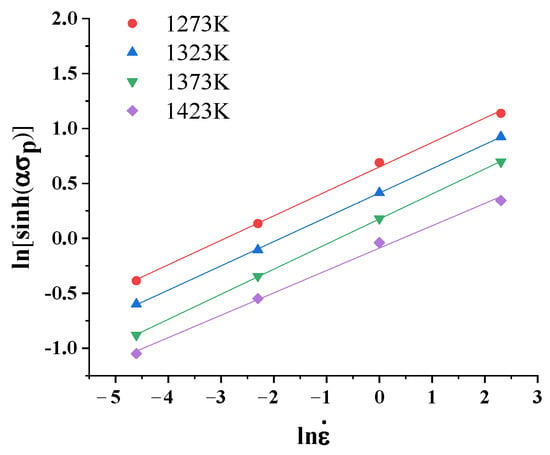
Figure 4.
Relationship between ln and ln[sinh(ασp)] at different temperatures.
When the strain rate is constant, the partial derivative of Equation (6) for 1/T is obtained:
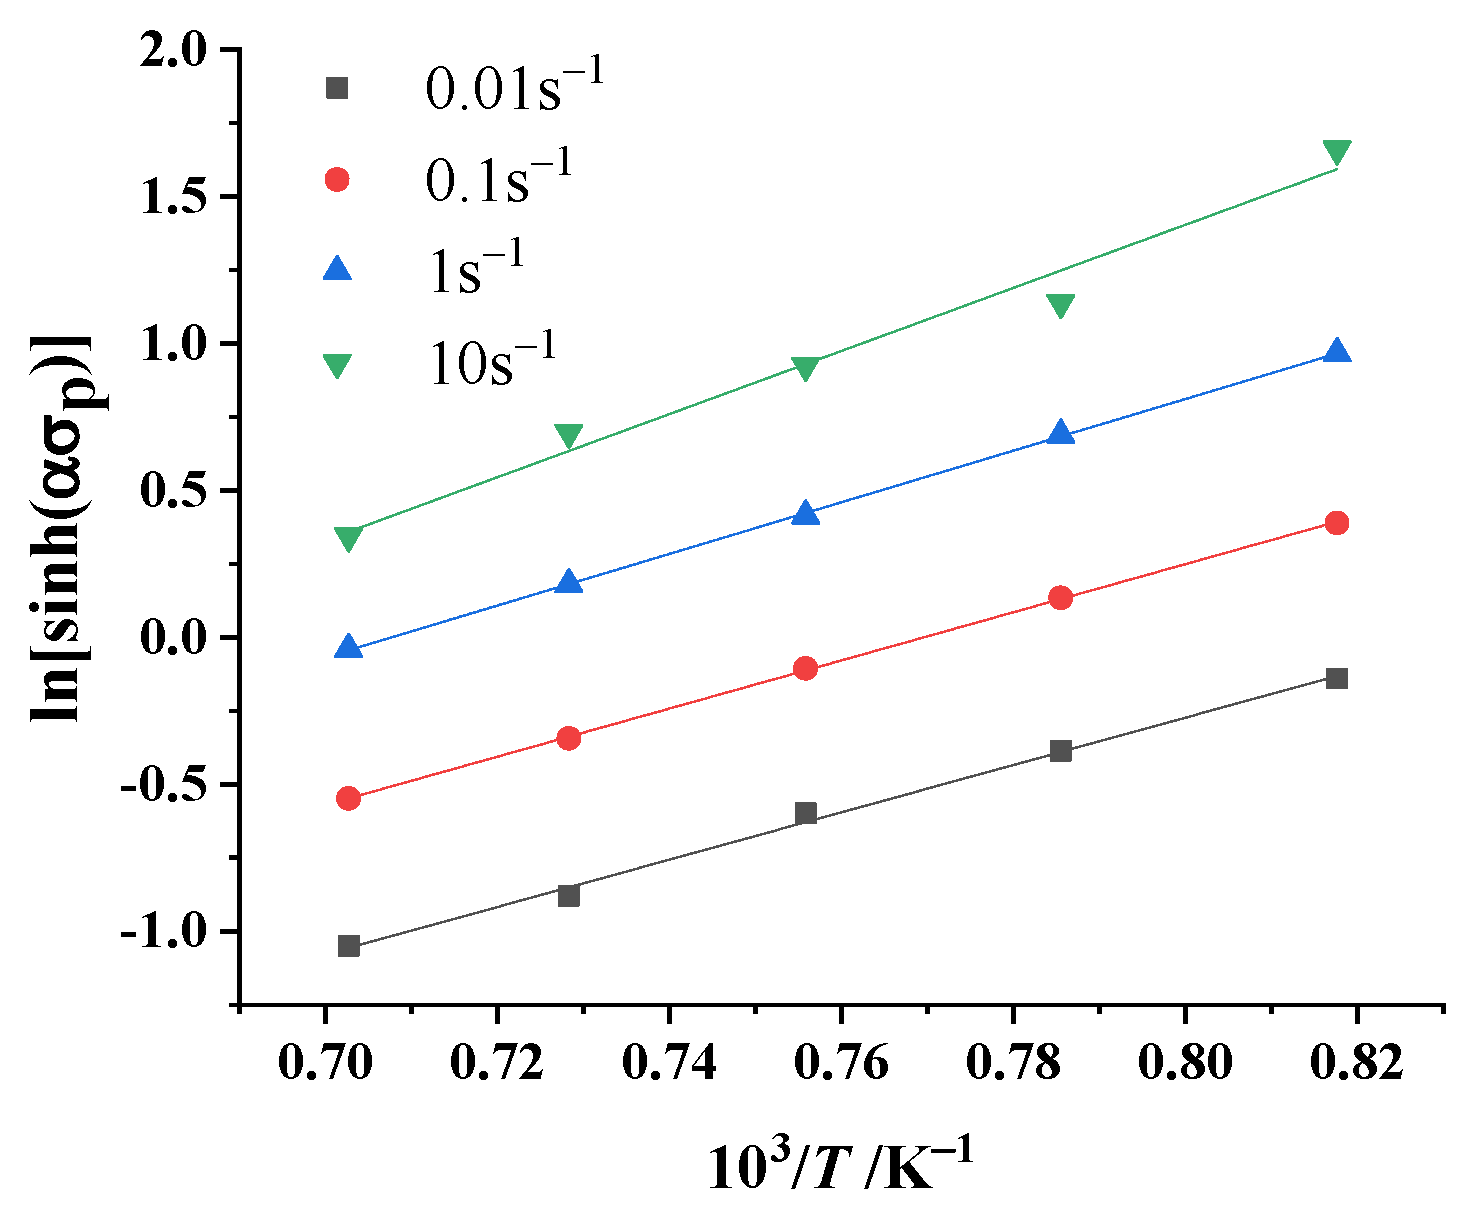
The linear relationship between 1/T and ln[sinh(ασp)] is shown in Figure 5. From Equation (9), the slope of the straight line in Figure 5 is Q/(nR). In addition, the values of n and R are substituted into it to obtain the average deformation activation energy Q, which is 261.85 kJ·mol−1.
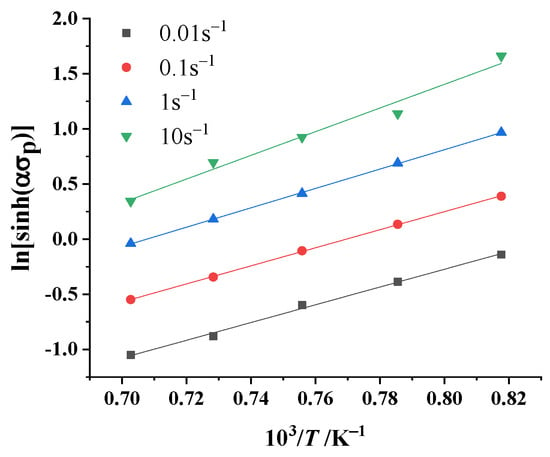
Figure 5.
Relationship between 1/T and ln[sinh(ασp)].
From Equation (6), the intercept of the straight line in Figure 4 is Q/(nRT)-(lnA)/n, and Q, n, R, and T are substituted into it to obtain A as 3.67 × 10⁹ s−1. Substituting the material constants A, α, Q, and n into Equation (1), Equation (6) becomes:
The flow stress behavior of metal at high temperature can also be described by the Zener–Hollomon parameter (Z parameter) [16]. It is a parameter to measure the influence of temperature and strain rate on thermal deformation behavior and its expression is as follows:
Substituting Equation (1) into Equation (9) gives the Z parameter expressed by the flow stress σp:
Combining the definition of the hyperbolic sine function with Equation (10), the flow stress equation expressed by the Z parameter can be obtained:
Substituting the material constants α, A, and n into Equation (11) gives the empirical constitutive equation described by the Z parameter:
5. Strain Correction for Empirical Constitutive Models
When the constitutive model based on the Arrhenius equation is applied, the influence of the strain at high temperature on the flow stress of the material is usually ignored. Only the steady-state stress or the peak stress is analyzed when the model is established [17,18]. In fact, the material constant changes with strain. The material constant can be described as a polynomial function of strain. In addition, the fitting accuracy is the highest when the polynomial degree is 5 [19,20]. In the empirical constitutive model, considering the effect of strain on the material constant is called strain correction.
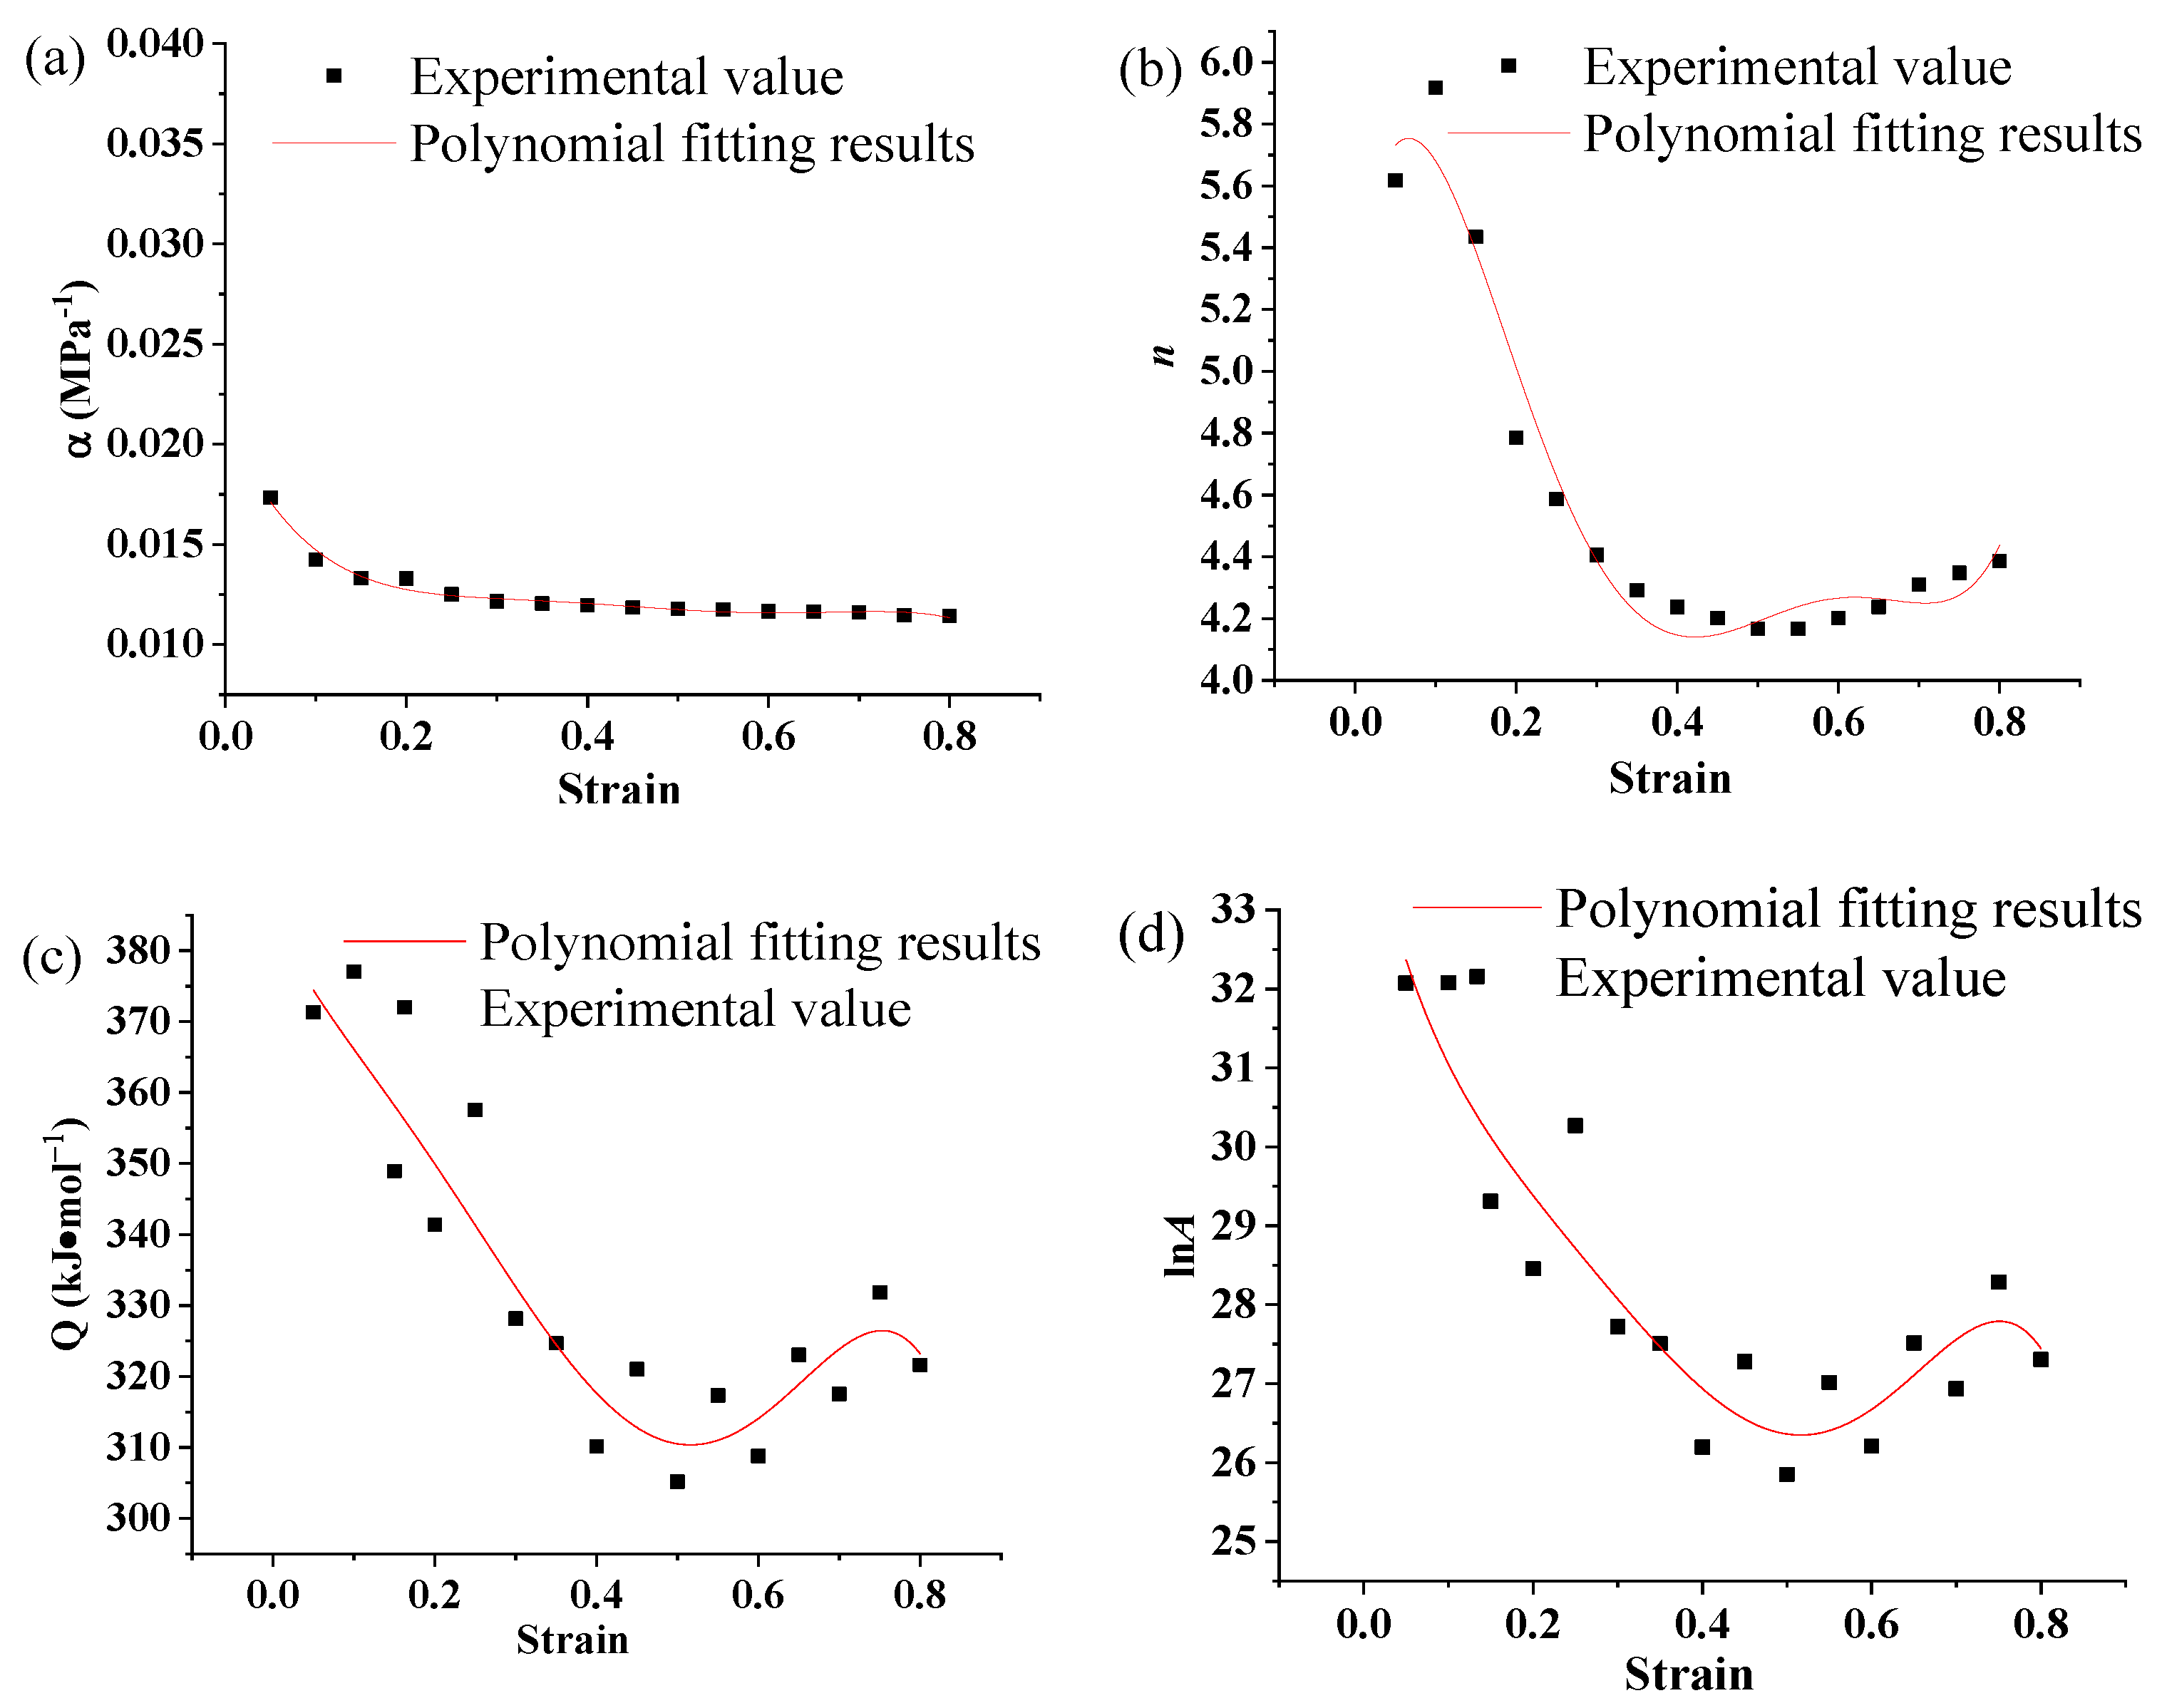
The steps for strain correction of the empirical constitutive model of 30CrMoA steel are as follows: First, the points with strains ranging from 0.1 to 0.8 at intervals of 0.05 are taken in Figure 2. Next, the material constants of each point are solved. Finally, the obtained result to a fifth-degree polynomial fitting is fitted according to Equation (13). The fitting results of the material constants with strain are shown in Figure 6. The fitted polynomial coefficients are shown in Table 2.
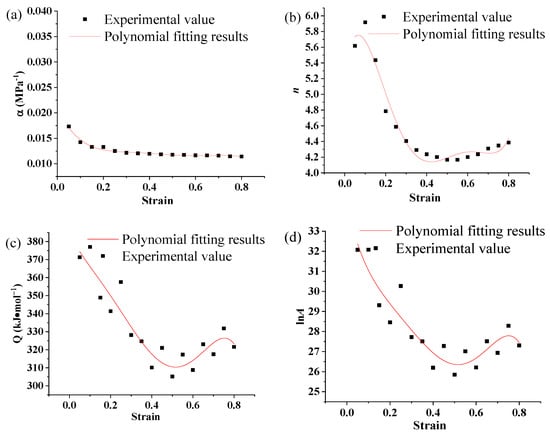
Figure 6.
Fifth-degree polynomial fitting of material constants lnA, α, Q, and n with strain: (a) α, (b) n, (c) Q, and (d) lnA.

Table 2.
Fifth-degree polynomial coefficients of lnA, α, Q, and n.
By substituting the material constant with the fifth-degree polynomial fitting into Equation (1), the empirical constitutive model with strain correction of 30CrMoA steel can be obtained. The model is as follow:
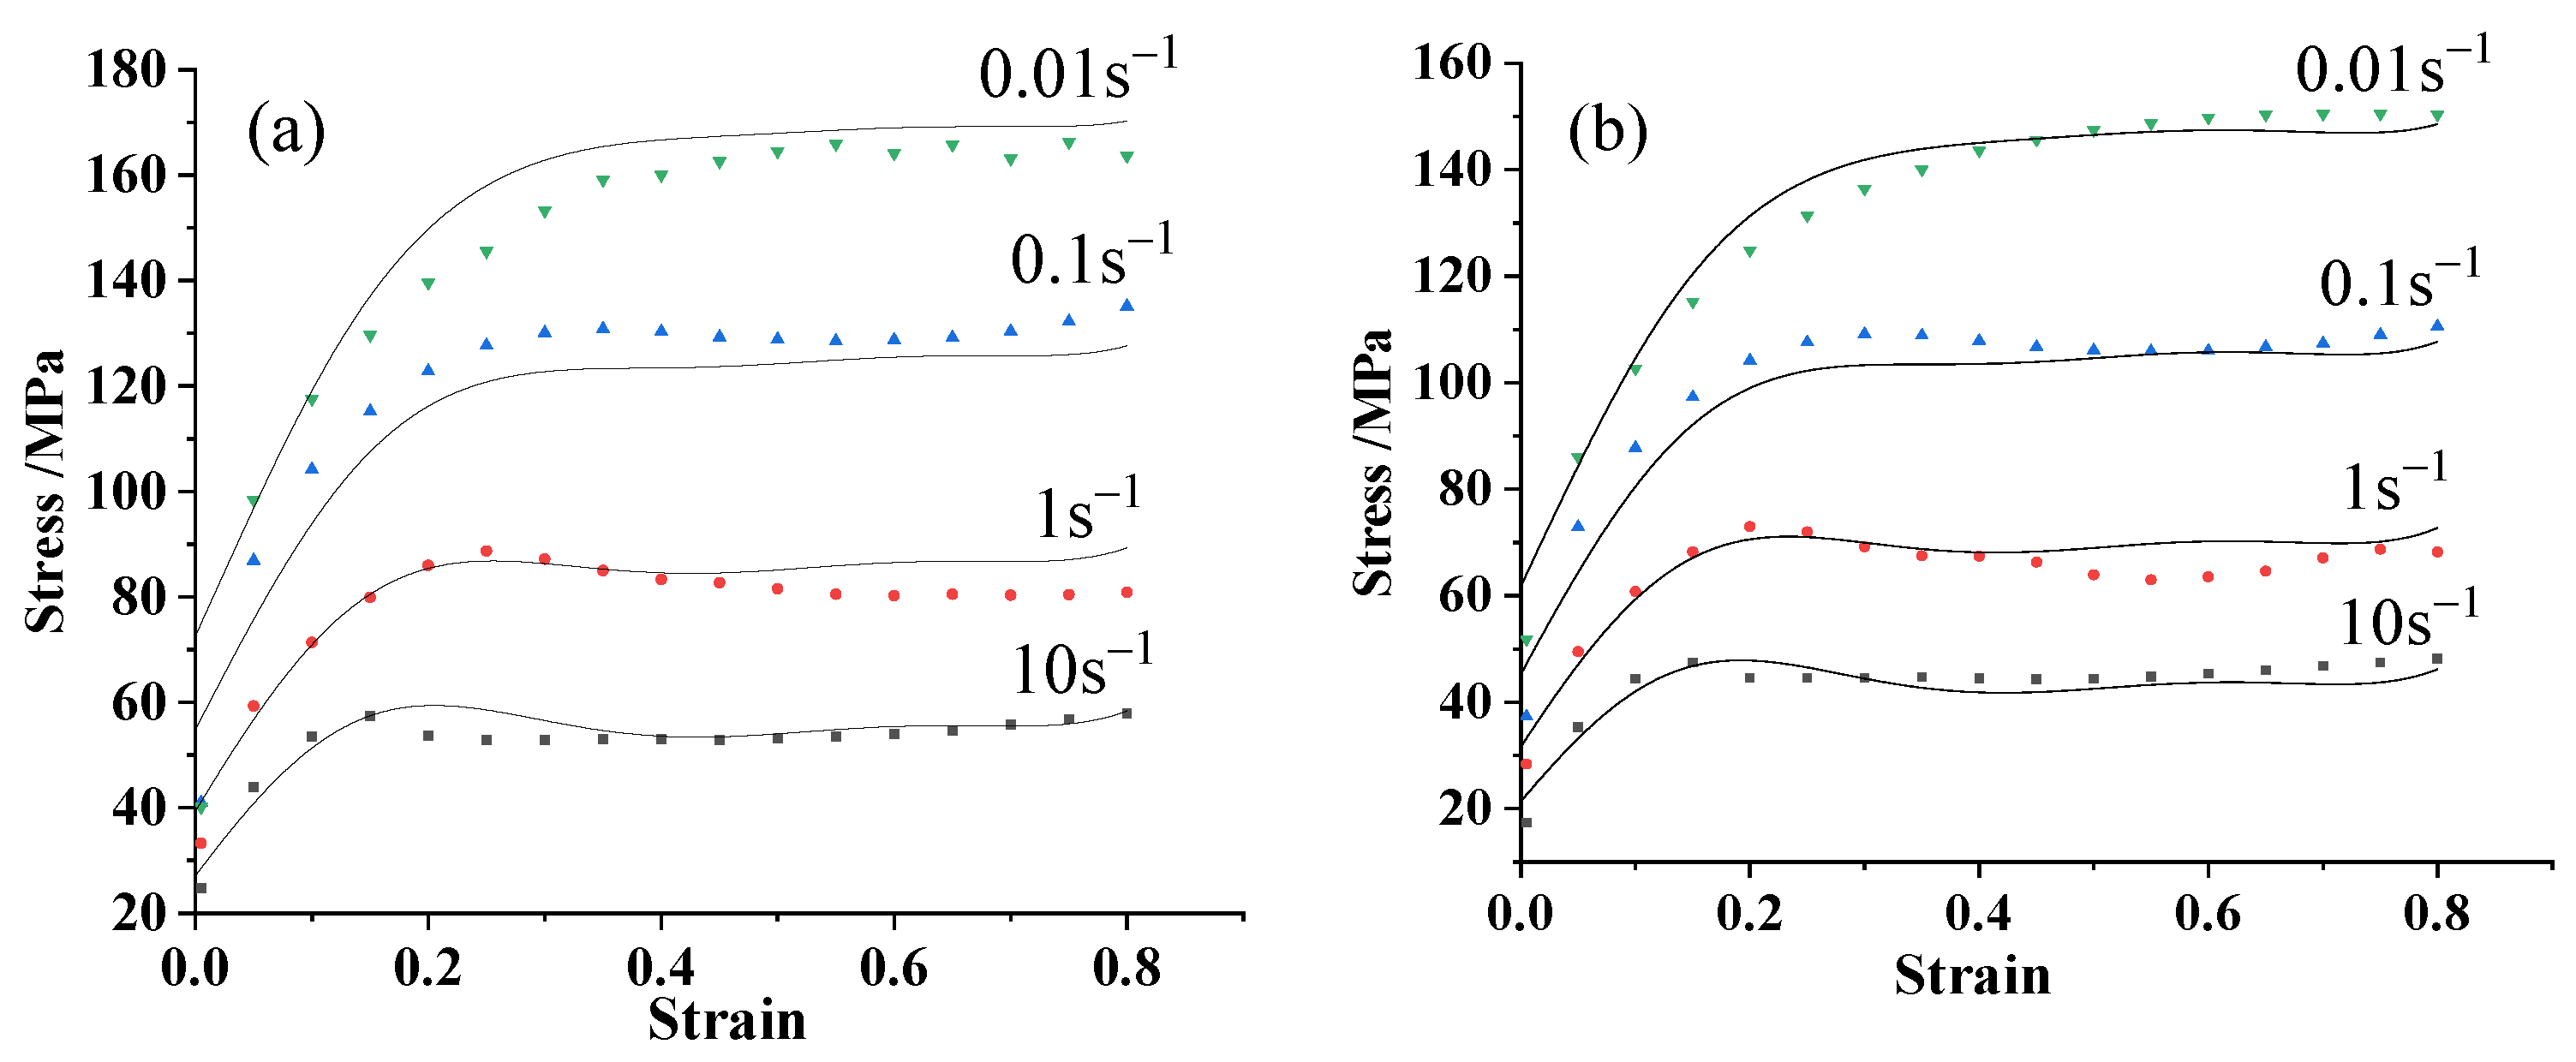
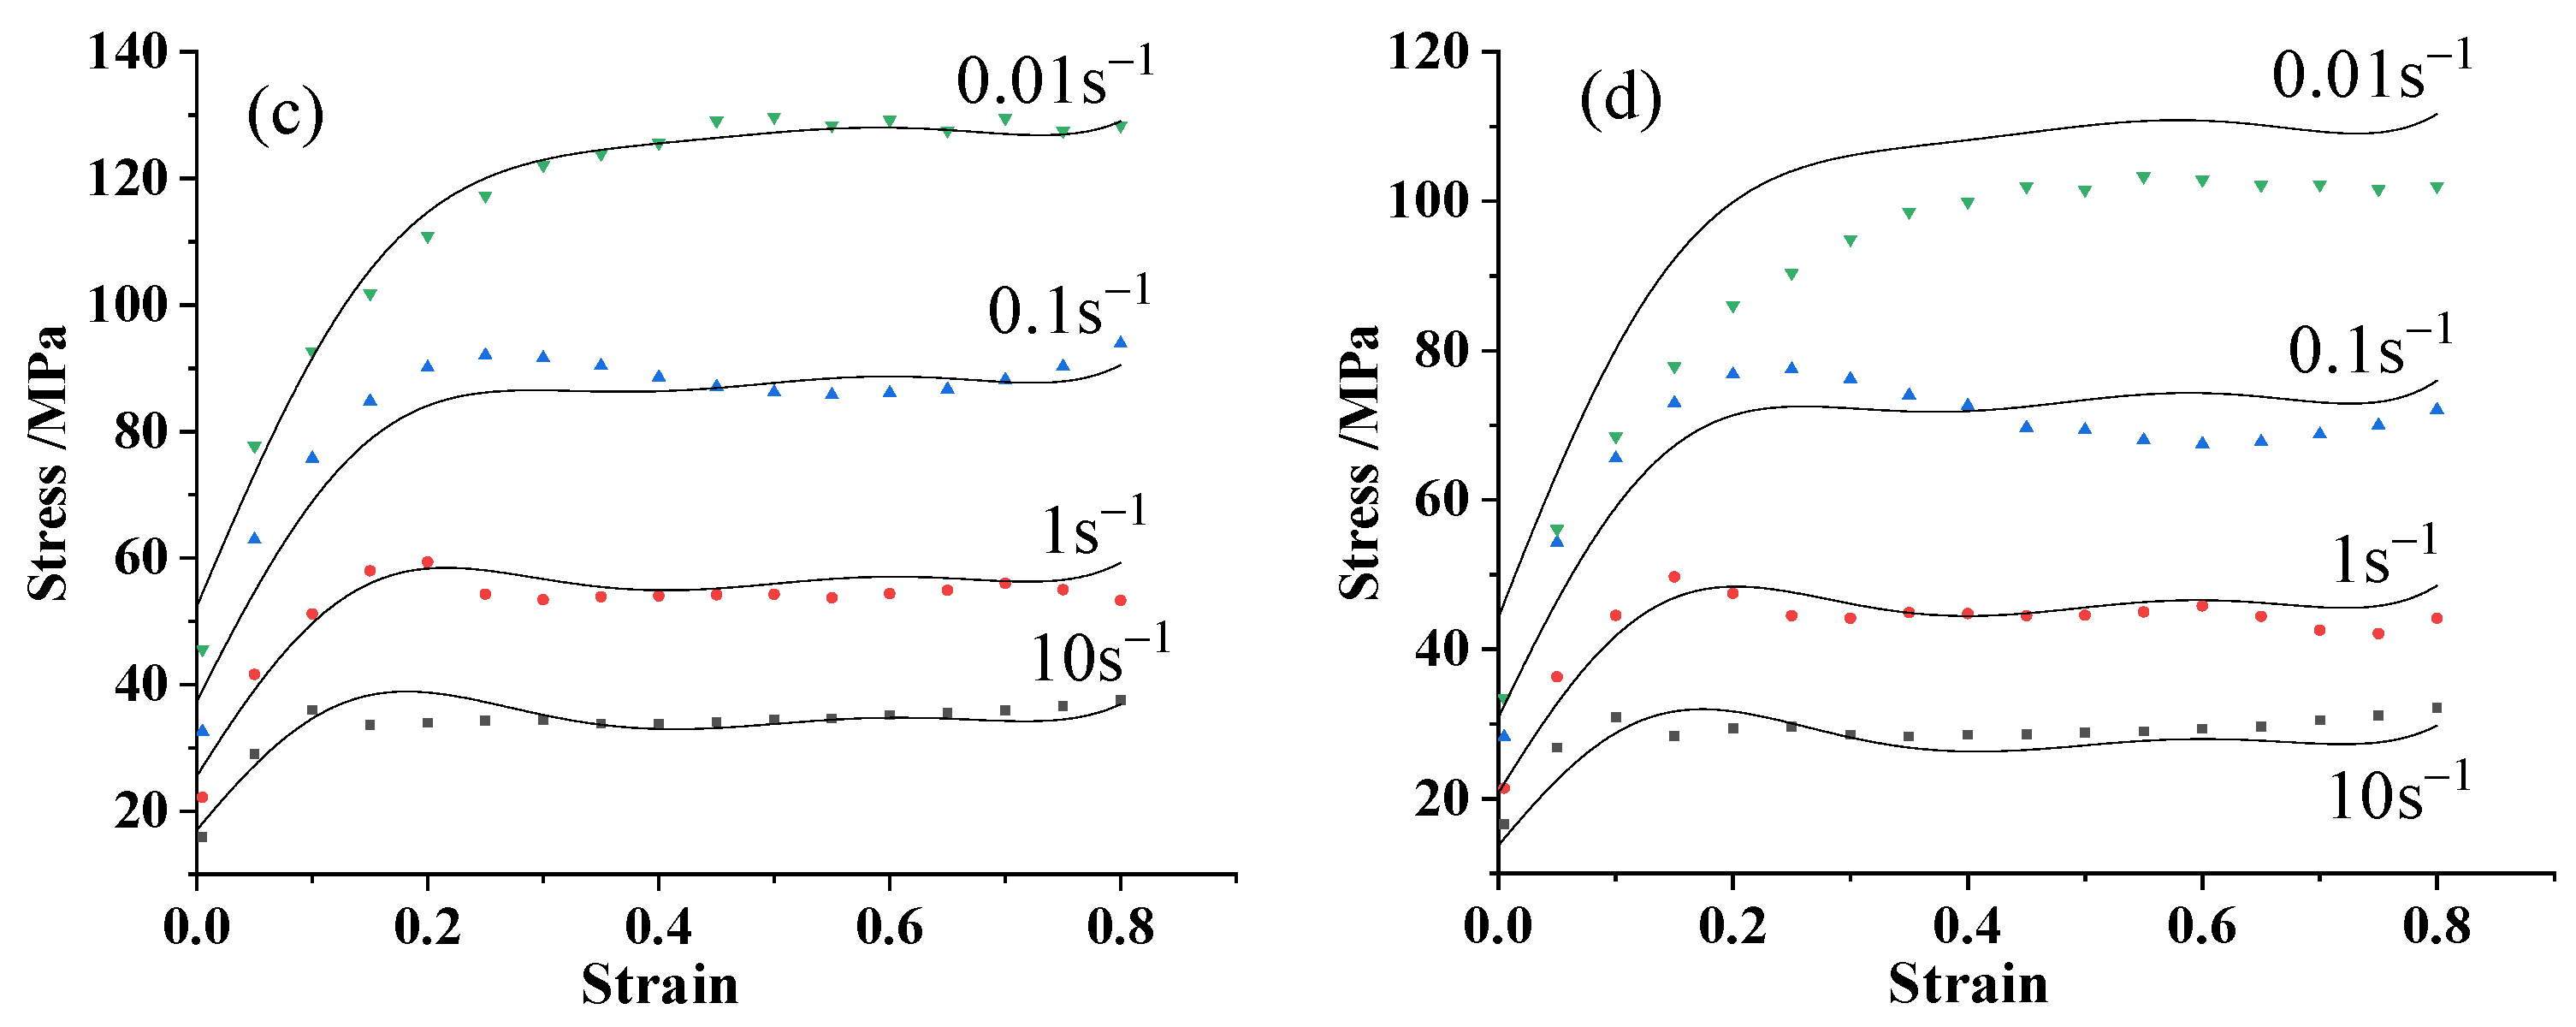
In order to verify the constitutive model of 30CrMoA steel with strain correction, the fifth-degree polynomial coefficients in Table 2 are substituted into Equation (14). The theoretical values are compared with experimental values of flow stress with a strain variable of 0.1–0.8 at an interval of 0.05. The comparison result is shown in Figure 7. The solid lines in the figure are the theoretical value, and the points are the experimental value. It can be seen from Figure 7 that the theoretical value is very close to the experimental value of the flow stress.
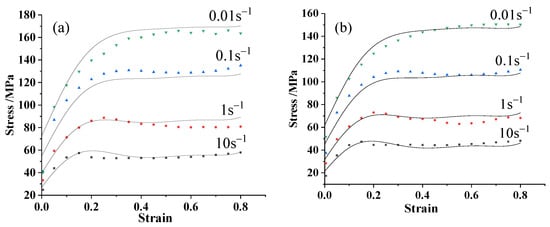
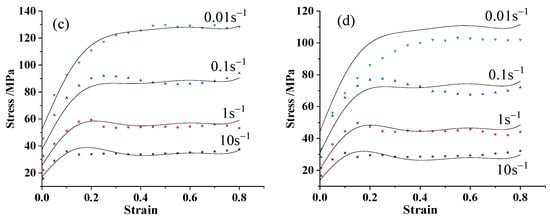
Figure 7.
Comparison of theoretical and experimental values of the constitutive equation with strain correction: (a) 1273 K, (b) 1323 K, (c) 1373 K, and (d) 1423 K.
The accuracy of the 30CrMoA steel constitutive model with strain correction can be verified by the correlation coefficient R and the average relative error ARRE, which are, respectively, expressed in Equations (15) and (16).
where Xi and Yi are experimental and theoretical values of flow stress, respectively, and are average values, and N is the number of values of flow stress.
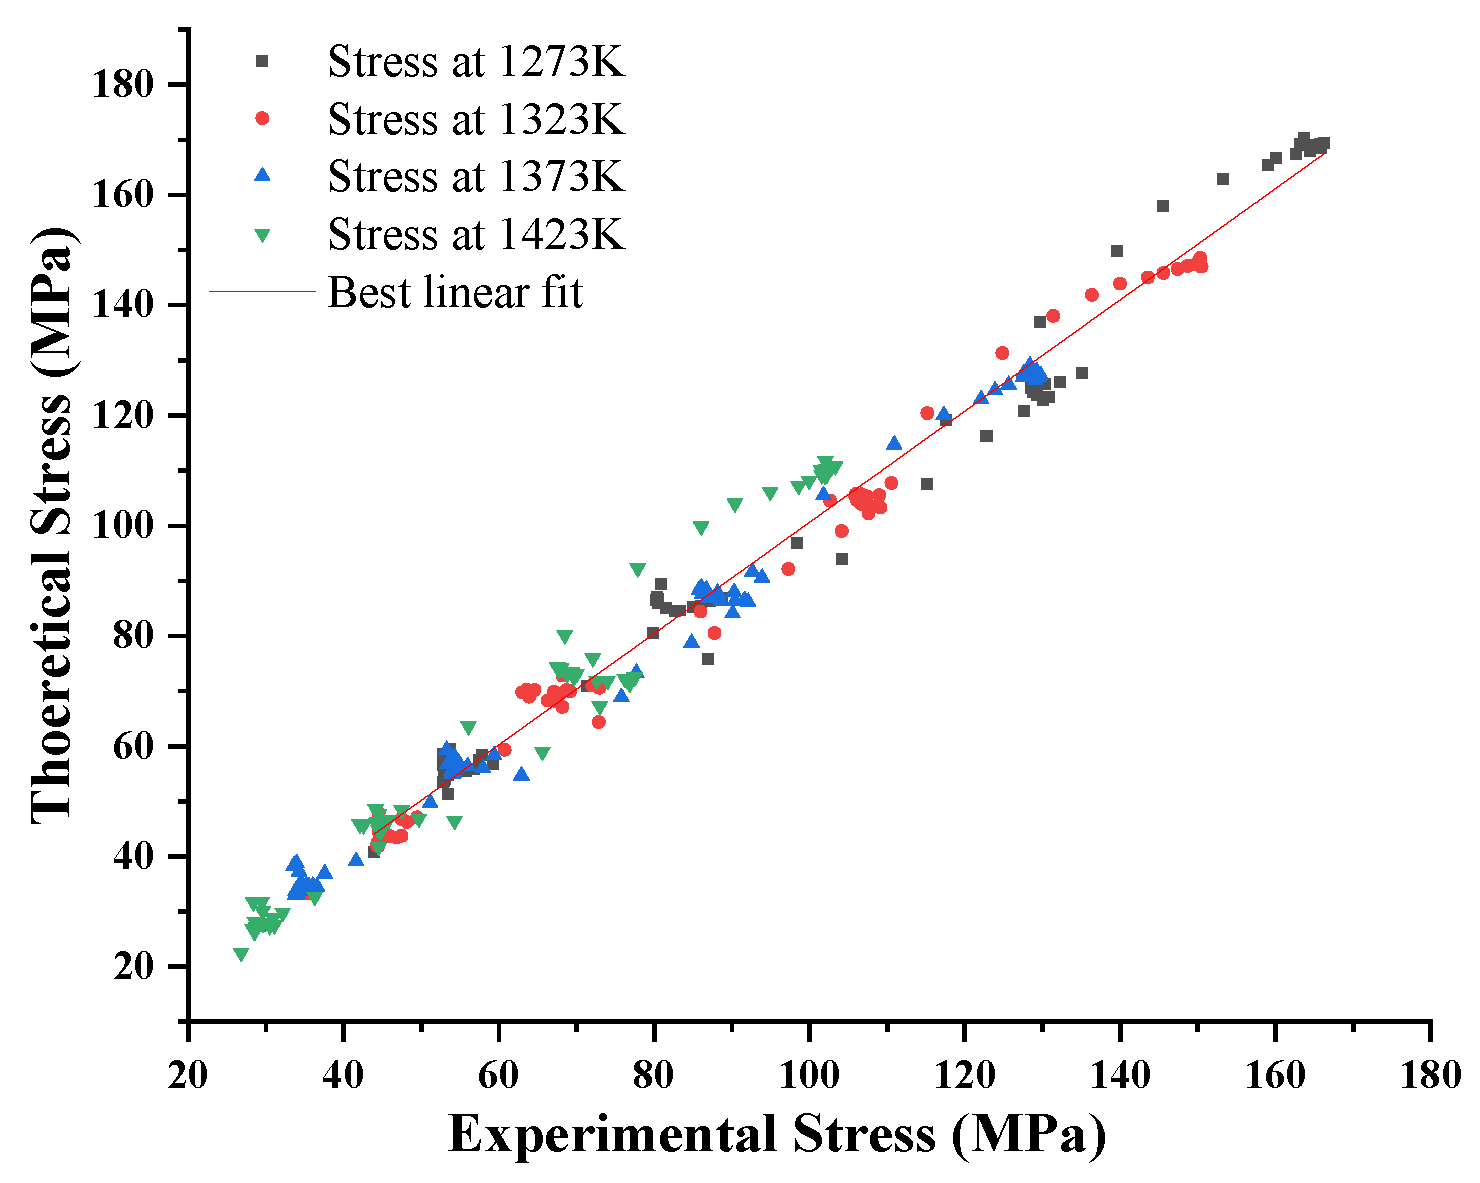
Although there are a few curves in Figure 7 with significant deviations between predicted and experimental values, the correlation is a comparative analysis of all predicted and experimental values. So, these curves with significant deviations have limited impact on the correlation. The correlation between the experimental and theoretical values of flow stress is shown in Figure 8. It can be seen from the figure that the correlation coefficient R between the experimental and theoretical values of flow stress is 0.9828 and the average relative error ARRE is 4.652%. The experimental value and the theoretical value of the flow stress have a strong correlation. Obviously, the constitutive model of strain correction of 30CrMoA steel can accurately predict the flow stress value under different conditions.
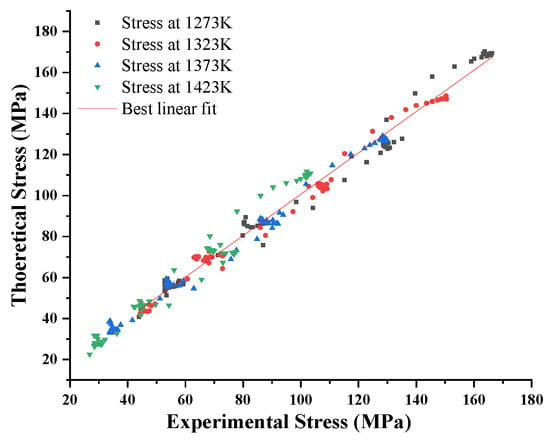
Figure 8.
Correlation between experimental and theoretical values of flow stress.
6. Conclusions
During the high-temperature compression deformation of 30CrMoA steel, the stress–strain curve at low strain rate shows dynamic recrystallization characteristics. The softening of the material at high strain rate is gradually dominated by dynamic recovery. Flow stress decreases with increasing temperature and increases with increasing strain rate. The higher the temperature and the lower the strain rate, the easier the dynamic recrystallization occurs.
The empirical constitutive model of 30CrMoA steel described by Z parameters is as follows:
Constitutive model with strain correction:
The theoretical values are compared with the experimental values of flow stress. The results show that the correlation R is 0.9828 and the average relative error ARRE is 4.652%. The 30CrMoA steel constitutive model with strain correction has high validity and accuracy.
Author Contributions
Conceptualization, S.Z. and X.S.; methodology, S.Z.; software, S.Z.; validation, X.S., S.Z., and J.W.; formal analysis, S.Z.; investigation, S.Z.; resources, S.Z.; data curation, S.Z.; writing—original draft preparation, S.Z.; writing—review and editing, S.Z. and J.W.; visualization, Y.X. and J.W.; supervision, Y.X.; project administration, X.S.; funding acquisition, X.S. All authors have read and agreed to the published version of the manuscript.
Funding
This research was funded by the National Natural Science Foundation of China, grant number 51975301 and the Natural Science Foundation of Zhejiang, grant number LZ17E050001.
Conflicts of Interest
The authors declare no conflict of interest.
References
- Xiao, J.; Li, D.; Li, X.; Deng, T. Constitutive modeling and microstructure change of Ti–6Al–4V during the hot tensile deformation. J. Alloy. Compd. 2012, 541, 346–352. [Google Scholar] [CrossRef]
- Wang, B.; Yi, Z.; Lai, X.; Zhang, K. Analysis on heating performance and thermal forming of lightweight alloy using pulse current heating. Procedia Eng. 2017, 207, 639–644. [Google Scholar] [CrossRef]
- Fang, H.; Wang, G.; Liu, S.; Li, X. Research on Resistance Heating Behavior of High-Strength Steel and its Hot-Stamping Forming. J. Mater. Eng. Perform. 2018, 27, 4829–4837. [Google Scholar] [CrossRef]
- Shu, X.D.; Zhang, S.; Wang, J.T.; Shi, J.N.; Xia, Y.X. Flow stress behavior of 30CrMoA steel under high temperature compression. Metalurgija 2020, 59, 313–316. [Google Scholar]
- Zhang, S.; Shu, X.; Xu, C.; Wang, J.; Li, Z. Research on Wall Thickness Uniformity of Hollow Axles by Three-Roll Skew Rolling. In Proceedings of the ASME 2019 International Mechanical Engineering Congress and Exposition, Salt Lake City, UT, USA, 11–14 November 2019. [Google Scholar] [CrossRef]
- Peng, H.B.; Zhang, H.J. Research Development of the Constitutive Models of Metal Materials. Mater. Mechan. Eng. 2012, 3, 9–14, 79. [Google Scholar]
- Silva, T.E.F.; Gain, S.; Pinto, D.; de Jesus, A.M.P.; Xavier, J.; Reis, A.; Rosa, P.A.R. Fracture Characterization of a Cast Aluminium Alloy Aiming Machining Simulation. J. Mater. Design Appl. 2019, 233, 402–412. [Google Scholar]
- Lin, Y.C.; Chen, M.S.; Zhong, J. Flow stress behaviors of 42CrMo steel during hot compression. J. Cent. South Univ. 2008, 39, 549–553. [Google Scholar]
- Wang, W.; Zhao, J.; Zhai, R.X.; Ma, R. Arrhenius-Type Constitutive Model and Dynamic Recrystallization Behavior of 20Cr2Ni4A Alloy Carburizing Steel. Steel Res. Int. 2016, 88, 1600196. [Google Scholar] [CrossRef]
- Dou, K.; Liu, Q. Hot deformation behavior and constitutive modelling of low carbon micro-alloyed steel YQ450NQR1 during isothermal compression. Mech. Mater. 2020, 148, 103430. [Google Scholar] [CrossRef]
- Galiyev, A.; Kaibyshev, R.; Gottstein, G. Correlation of plastic deformation and dynamic recrystallization in magnesium alloy ZK60. Acta Mater. 2001, 49, 1199–1207. [Google Scholar] [CrossRef]
- Cai, J.; Li, F.; Liu, T.; Chen, B.; He, M. Constitutive equations for elevated temperature flow stress of Ti–6Al–4V alloy considering the effect of strain. Mater. Des. 2011, 32, 1144–1151. [Google Scholar] [CrossRef]
- Ding, Z.-Y.; Hu, Q.; Zeng, L.; Li, J.-G. Hot deformation characteristics of as-cast high-Cr ultra-super-critical rotor steel with columnar grains. Int. J. Miner. Met. Mater. 2016, 23, 1275–1285. [Google Scholar] [CrossRef]
- Duan, H.L.; Huang, X.M.; Ji, H.C.; Li, Y.G. The arrhenius constitutive model of steel 42CrMo for gear. Metalurgija 2020, 59, 63–66. [Google Scholar]
- Sellars, C.; McTegart, W. On the mechanism of hot deformation. Acta Met. 1966, 14, 1136–1138. [Google Scholar] [CrossRef]
- Zener, C.; Hollomon, H. Effect of strain-rate upon the plastic flow of steel. J. Appl. Phys. 1944, 15, 22–27. [Google Scholar] [CrossRef]
- Li, L.; Zhou, J.; Duszczyk, J. Determination of a constitutive relationship for AZ31B magnesium alloy and validation through comparison between simulated and real extrusion. J. Mater. Process. Technol. 2006, 172, 372–380. [Google Scholar] [CrossRef]
- Lin, Y.; Chen, X.-M. A critical review of experimental results and constitutive descriptions for metals and alloys in hot working. Mater. Des. 2011, 32, 1733–1759. [Google Scholar] [CrossRef]
- Li, H.-Y.; Li, Y.-H.; Wei, D.-D.; Liu, J.-J.; Wang, X.-F. Constitutive equation to predict elevated temperature flow stress of V150 grade oil casing steel. Mater. Sci. Eng. A 2011, 530, 367–372. [Google Scholar] [CrossRef]
- Saravanan, L.; Senthilvelan, T. Constitutive equation and microstructure evaluation of an extruded aluminum alloy. J. Mater. Res. Technol. 2016, 5, 21–28. [Google Scholar] [CrossRef]
© 2020 by the authors. Licensee MDPI, Basel, Switzerland. This article is an open access article distributed under the terms and conditions of the Creative Commons Attribution (CC BY) license (http://creativecommons.org/licenses/by/4.0/).

