Article

Mechanical Properties and Microstructural Aspects of Two High-Manganese Steels with TWIP/TRIP Effects: A Comparative Study

1
Department Ingeniería Metalúrgica, Faculty Ingeniería, Universidad de Santiago de Chile, Santiago 9160000, Chile
2
GMF-CONICET, Cipolletti 8324, Argentina
3
LMF METALMAT UFRJ, Río de Janeiro 21941598, Brazil
4
Instituto de Física de Rosario, UNR-CONICET, Rosario 2000, Argentina
*
Author to whom correspondence should be addressed.
Metals 2021, 11(1), 24; https://doi.org/10.3390/met11010024
Submission received: 6 December 2020 / Revised: 19 December 2020 / Accepted: 21 December 2020 / Published: 25 December 2020
(This article belongs to the Section Metal Casting, Forming and Heat Treatment)

Abstract

:
This article is focused on the mechanical behavior and its relationship with the microstructural changes observed in two high-manganese steels presenting twinning-induced plasticity (TWIP) and transformation-induced plasticity (TRIP), namely Steel B and Steel C, respectively. Chemical compositions were similar in manganese, but carbon content of Steel B approximately doubles Steel C, which directly impacted on the stacking fault energy (SFE), microstructure and mechanical response of each alloy. Characterization of as-cast condition by optical microscope revealed a fully austenitic microstructure in Steel B and a mixed microstructure in Steel C consisting of austenite grains and thermal-induced (εt) martensite platelets. Same phases were observed after the thermo-mechanical treatment and tensile tests, corroborated by means of X-Ray Diffraction (XRD), which confirms no phase transformation in Steel B and TRIP effect in Steel C, due to the strain-induced γFCC→εHCP transformation that results in an increase in the ε-martensite volume fraction. Higher values of ultimate tensile strength, yield stress, ductility and impact toughness were obtained for Steel B. Significant microstructural changes were revealed in tensile specimens as a consequence of the operating hardening mechanisms. Scanning Electron Microscopy (SEM) observations on the tensile and impact test specimens showed differences in fracture micro-mechanisms.

Graphical Abstract

1. Introduction

The constant technological development that took place during the last decades in many areas of the metal-mechanical industry led to important challenges. These were reflected in the need to manufacture components with complex designs and employ materials capable of resisting external stresses imposed, both in manufacturing processes and during service performance. Aspects related to safety, reliability and production costs must also be considered. The so-called advanced high-strength steels (AHSS) largely achieved these requirements. High-manganese twinning-induced and transformation-induced plasticity (TWIP/TRIP) belong to a new generation of AHSS with typical manganese contents between 15 and 30 wt%. Their exceptional combination of strength and ductility (~900–1000 MPa at ~50–60%) and excellent energy absorption in impact tests took the attention of the automotive industry [1,2,3,4,5,6,7].
Three hardening mechanisms can develop in high-manganese steels: Dislocation glide, mechanical twinning and γFCCεHCP phase transformation [8,9]. The TWIP phenomenon is explained by the dynamic Hall–Petch effect, based on a competition between dislocation glide and mechanical twinning [10,11,12]. The TRIP effect is characterized by the formation of ε-martensite phase with hexagonal close-packed (HCP) structure from face-centered cubic (FCC) austenite, which can be thermally induced (εt) or stress-induced (εd) [13,14,15]. Both twin boundaries and ε-martensite platelets act as a barrier to dislocation glide, resulting in high strain-hardening rate, delayed necking and large uniform elongations, as usually observed in high-manganese steels [16]. There are also important crystallographic aspects in common that arise from the Hirth interpretation of a stacking fault in an FCC structure as an HCP embryo [17,18]. Mechanical twins are consequence of the collaborative glide of intrinsic Shockley partial dislocations a/6 ‹112› on successive parallel {111} planes defining the twinning habit plane, whereas ε-martensite is the result of the same dislocation gliding on every second {111} plane. The energy cost involved in the dissociation of one dislocation in two Shockley partials and the creation of such kinds of planar defects is controlled by stacking-fault energy (SFE), which plays a central role in the interaction between the previously mentioned hardening mechanisms and the preponderance of one over another [19,20,21,22,23,24,25,26,27].
A widely used method to calculate SFE is through the Olson and Cohen thermodynamic model [28]. SFE, which is strongly dependent on chemical composition and temperature, plays a very important role in mechanical behavior of high-manganese steels. There is a general agreement that for values lower than 18 mJ/m2 TRIP effect takes place, whereas in the range 19–45 mJ/m2 twinning replaces the γFCCεHCP phase transformation as subsidiary hardening mechanism. Only dislocation glide is active for higher SFE values [23,29]. Finer austenitic grain sizes tend to increase SFE suppressing TWIP and TRIP effects [30], whilst coarser sizes tend to promote them due to a decrease in SFE [31,32].
The carbon content effect on high manganese steels was studied in this work, including the relationship between tensile and impact characteristics with hardening mechanisms and microstructure. For this purpose, two high-manganese steels with approximately 0.28 and 0.54 wt% C were fabricated according to a pre-defined chemical composition and subjected to the same thermo-mechanical treatment with the objective of achieving TWIP effect in one and TRIP effect in the other. SFE calculations, microstructural characterization, uniaxial tensile tests, Charpy V tests and microindentation hardness tests on bulk material and adjacent to the fracture zones, as well as XRD analysis and fracture surface observations were performed to understand and quantify the differences in mechanical behavior and microstructural features between them.

2. Materials and Methods

Two 25 kg steel ingots of 90 mm thickness × 90 mm width × 400 mm length with different chemical compositions were cast by induction melting. The thermo-mechanical processing adopted was the same for both steels and similar to that described by Wietbrock et al. in [33]. As-cast structures were destroyed by a hot forging process consisting in many passes in an open-die forging, reheating up to the initial temperature of 1150 °C, until attaining 20 mm thickness. Homogenization was performed at 1200 °C for two hours to attenuate segregation effects and then hot rolling was carried out in two passes in the range 950–1150 °C with a 20% reduction (16 mm final thickness). Immediately after the last pass, specimens were quenched in a salt bath at 350 °C for 40 min in order to avoid carbide precipitation, and then cooled in calm air.
SFE calculations were carried out based on the known relationship between SFE and the driving force for the ε-martensite transformation established by Hirth [17] and popularized later by Olson and Cohen [28]:
SFE = 2 ρ G γ ε + 2 σ γ / ε
where ρ is the molar surface density, G γ ε is the total Gibbs free energy change for the γFCCεHCP transformation ( G γ ε ) which has a chemical contribution ( G c h e m γ ε ) and a magnetic contribution ( G m a g γ ε ) and σγ/ε is the interfacial energy between the austenite and ε-martensite adopted as 10 mJ/m2 [34]. Expressions for G c h e m γ ε have been taken from references [22,35,36] and for G m a g γ ε from references [37,38].
Specimens used for microstructural characterization were cut by wire electrical discharge machining (EDM) and prepared via grinding and mechanical polishing procedure starting with wetted SiC sandpapers from 120 until 2500 grit size, continued with diamond paste of 6 μm and 1 μm and finished with 0.5 μm alumina paste. Two etchants were employed to reveal the as-cast microstructures: 2% nital (2% v/v nitric acid in ethanol) for ~20 s and Vilella’s reagent (100 mL ethanol, 1 g picric acid and 5 mL HCl) for ~30 s. Only nital was used for comparative purposes in the rest of the observations. Microstructures were studied in a Zeiss Axiotech optical microscope (Carl Zeiss AG, Zeiss, Oberkochen, Germany) with an annexed three-chip CCD RGB camera Donpisha XC-003 (Sony, Tokyo, Japan) and image digitizer.
Hardness was measured in six different points side-to-side along the thickness of each sample taken from the mechanical-processed steel plates in an EMCO-TEST M4R-075 hardness testing machine (EMCO-TEST Prüfmaschinen GmbH, Kuchl, Austria). Rockwell B scale (HRB) was adopted in accordance with ASTM E18 [39].
Two standard rectangular tension test specimens per composition were machined by EDM in accordance with ASTM E8 [40] with length parallel to the rolling direction and width parallel to the transverse direction. Main dimensions were 3 mm thickness, 12.5 mm width and 50 mm gauge length. Uniaxial tensile tests were carried out at room temperature in a Zwick/Roell Z050 ProLine universal testing machine (Zwick GmbH & Co. KG, Ulm, Germany) maintaining a crosshead velocity of 2.5 mm/min (a strain rate of 8.33 × 10⁻⁴ s−1) and adopting a data acquisition rate of 10 values per second. Deformation was measured initially with a clip-on extensometer model digiClip manufactured by Zwick/Roell and then commuted to crosshead displacement at values of deformation of 5%.
Charpy V-notch impact tests were conducted in full-size specimens according to ASTM E23 [41] machined by EDM in L-T orientation per ASTM E1823-18 [42]. Tests were performed at room temperature on a pendulum impact tester TIME Group Inc. brand and JB-S300 model (TIME Group Inc, Beijing, China) with a capacity of up to 300 Joule. Three specimens were tested per each alloy.
Fracture surfaces of the specimens were studied in a JEOL JSM-6100 (JEOL, JSM-6100, Akishima, Japan) scanning electron microscopy (SEM) using secondary electron (SE) imaging mode operating at 15 kV. Working distances of 14 and 13 mm were employed for tensile and Charpy specimens, respectively.
Microindentation hardness Vickers was measured according to ASTM E384 [43] using a Zwick/Roell Indentec ZHVμ tester machine (Zwick GmbH & Co. KG, Ulm, Germany) under a load of 200 gf sustaining 10 s (HV0.2). Fifteen indents per thermo-mechanical processed samples were made side-to-side along the thickness. Microhardness profiles along the fracture surfaces at a distance of approximately 500 μm were carried out at the midthickness of the tensile and Charpy specimens. Twelve indents were made in the first case (tensile samples) and seven in the second (Charpy samples), starting close to the V notch and following the crack propagation. Spacing adopted between indents was 1 mm in all measurements.
XRD patterns were obtained in samples taken from thermo-mechanical processed steel plates and close to the fracture surfaces of the tensile specimens. Sample sizes were 15 mm in length, 12 mm in width and the entire thickness and were polished in the surfaces parallel to the rolling plane. XRD determinations were carried out in a Philips PANalytical X’Pert Pro MPD diffractometer (PANalytical B.V., Almelo, The Netherlands) using Cu-Kα radiation operating at 40 kV and 30 mA filament current with 0.02° step and speed of 5°/min. Measurements were taken within the radial range from 35° to 105°. Free-license MAUD (Materials Analysis Using Diffraction) software v. 2.93 [44] based on the Rietveld method was employed to fit the entire XRD patterns with the aim to perform quantification of the present phases. Crystallite sizes and r.m.s. (root mean square) microstrain values were evaluated from the “size strain” analysis using the Popa model [45] which is suitable for anisotropic properties. Planar faults were taken into account following Warren’s treatment [46] and correction for preferred orientation was considered using the arbitrary texture correction method as explained in the work of Dini et al. [47]. The quality of the fittings was assessed using three criteria: The weighted summation of the residual of least-squares (Rwp), the expected least-squares fit (Rexp) and the “goodness of fit” (GoF), a factor of the reliability of the whole refinement obtained as Rwp/Rexp. Ideal fit corresponds to GoF = 1.

3. Results

3.1. Chemical Compositions and SFE

Chemical compositions determined by spark atomic emission spectrometry are listed in Table 1. Using these compositions, SFE values were obtained at a temperature of 20 °C and are summarized in Table 2.

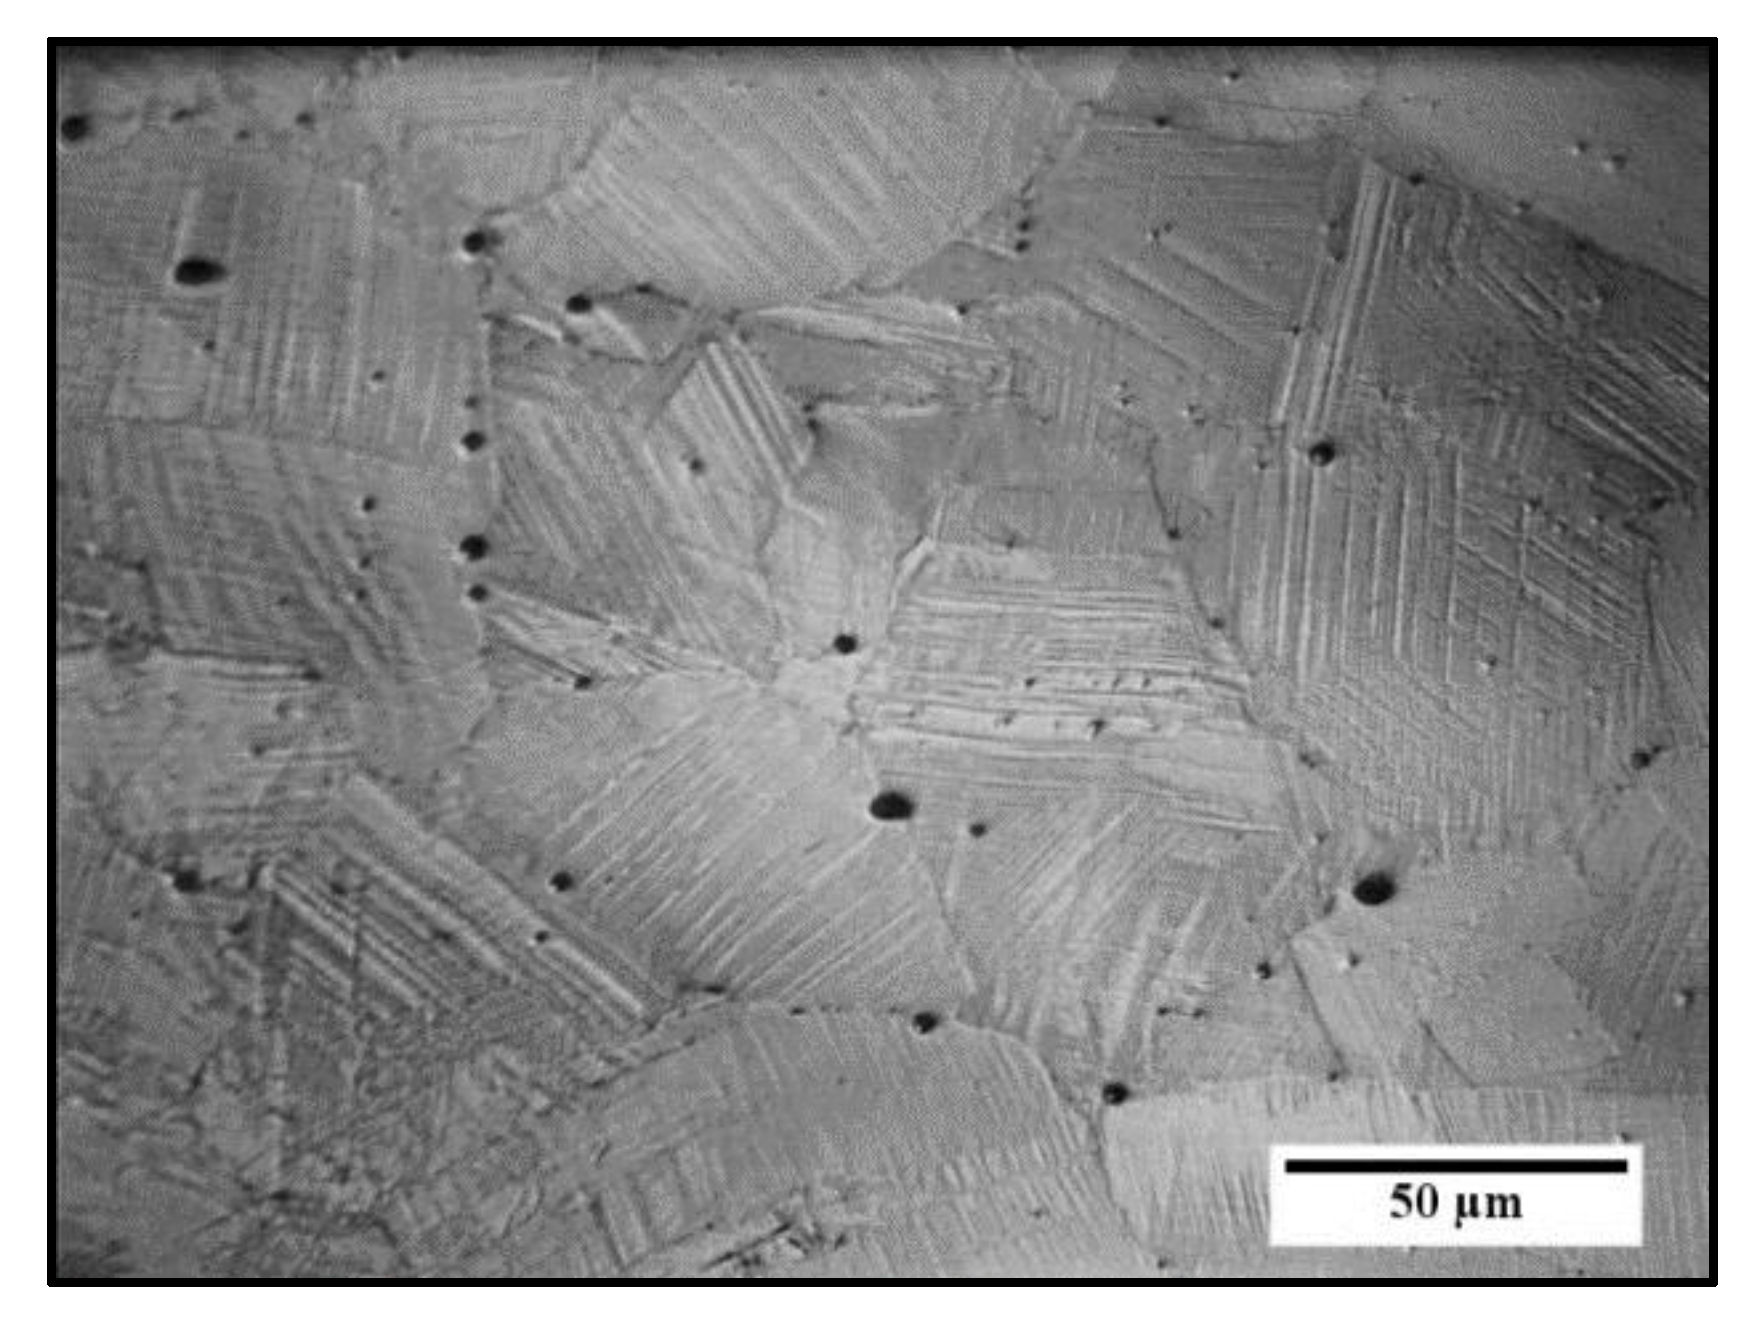
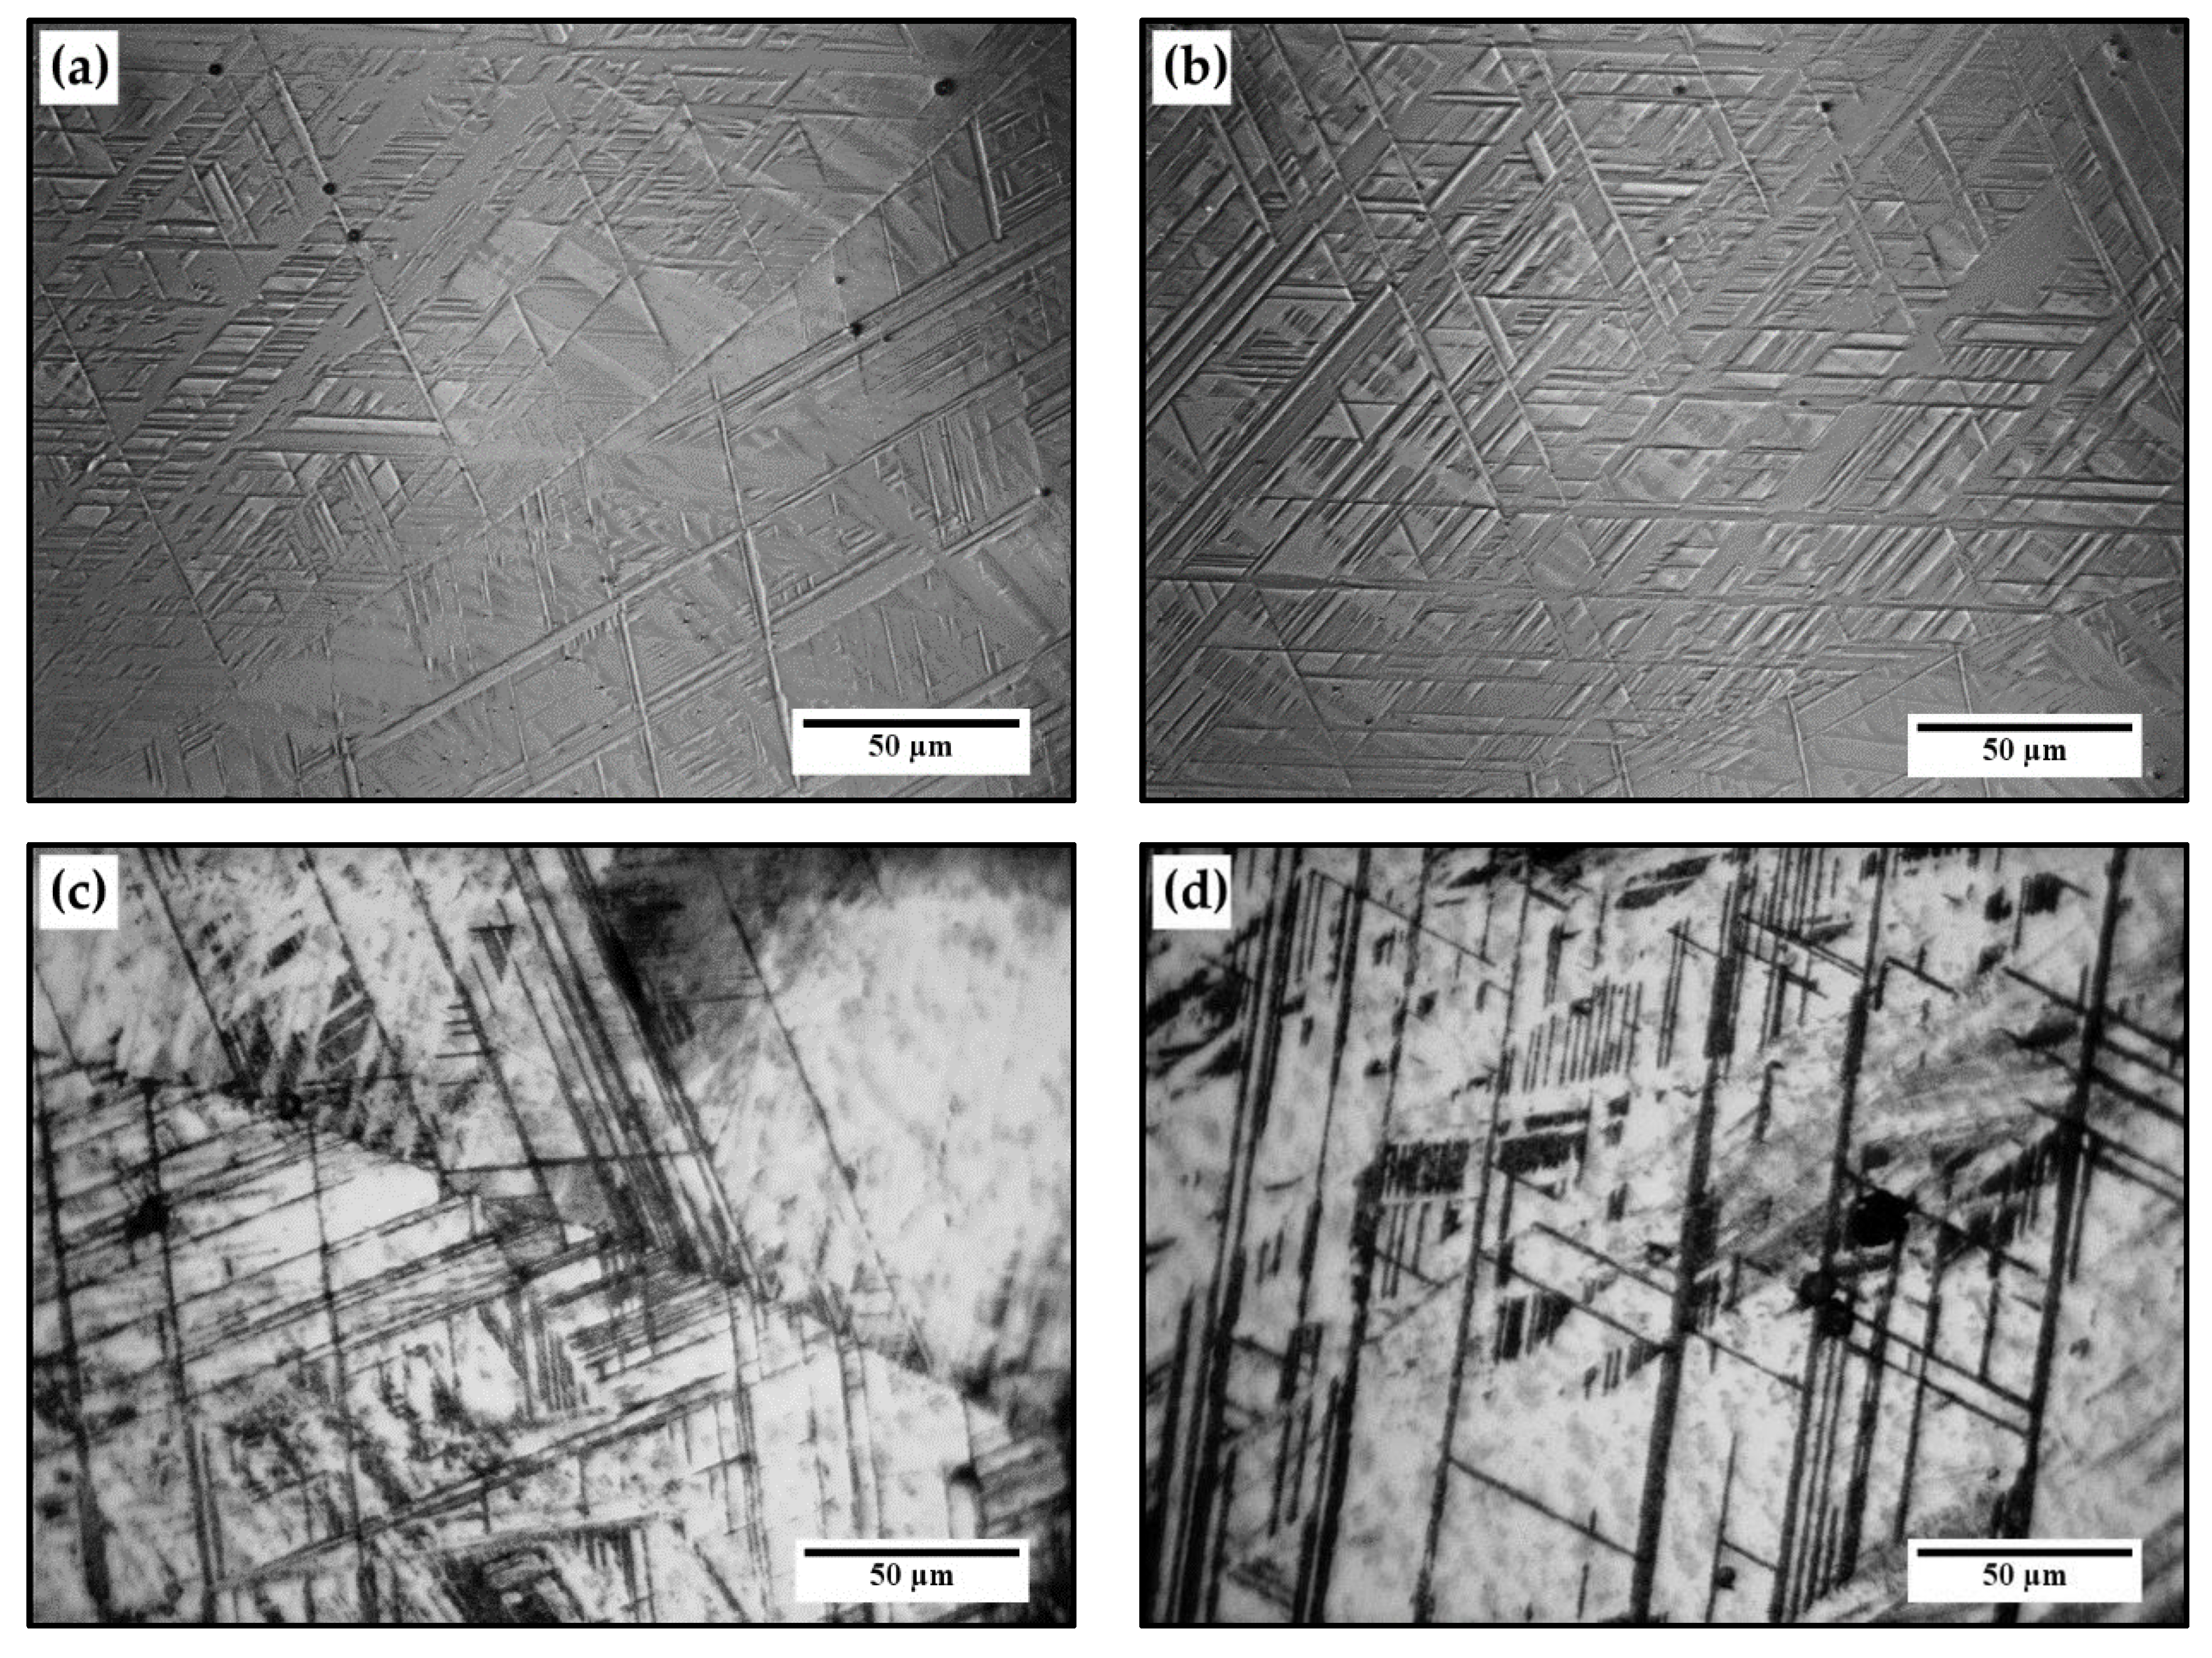
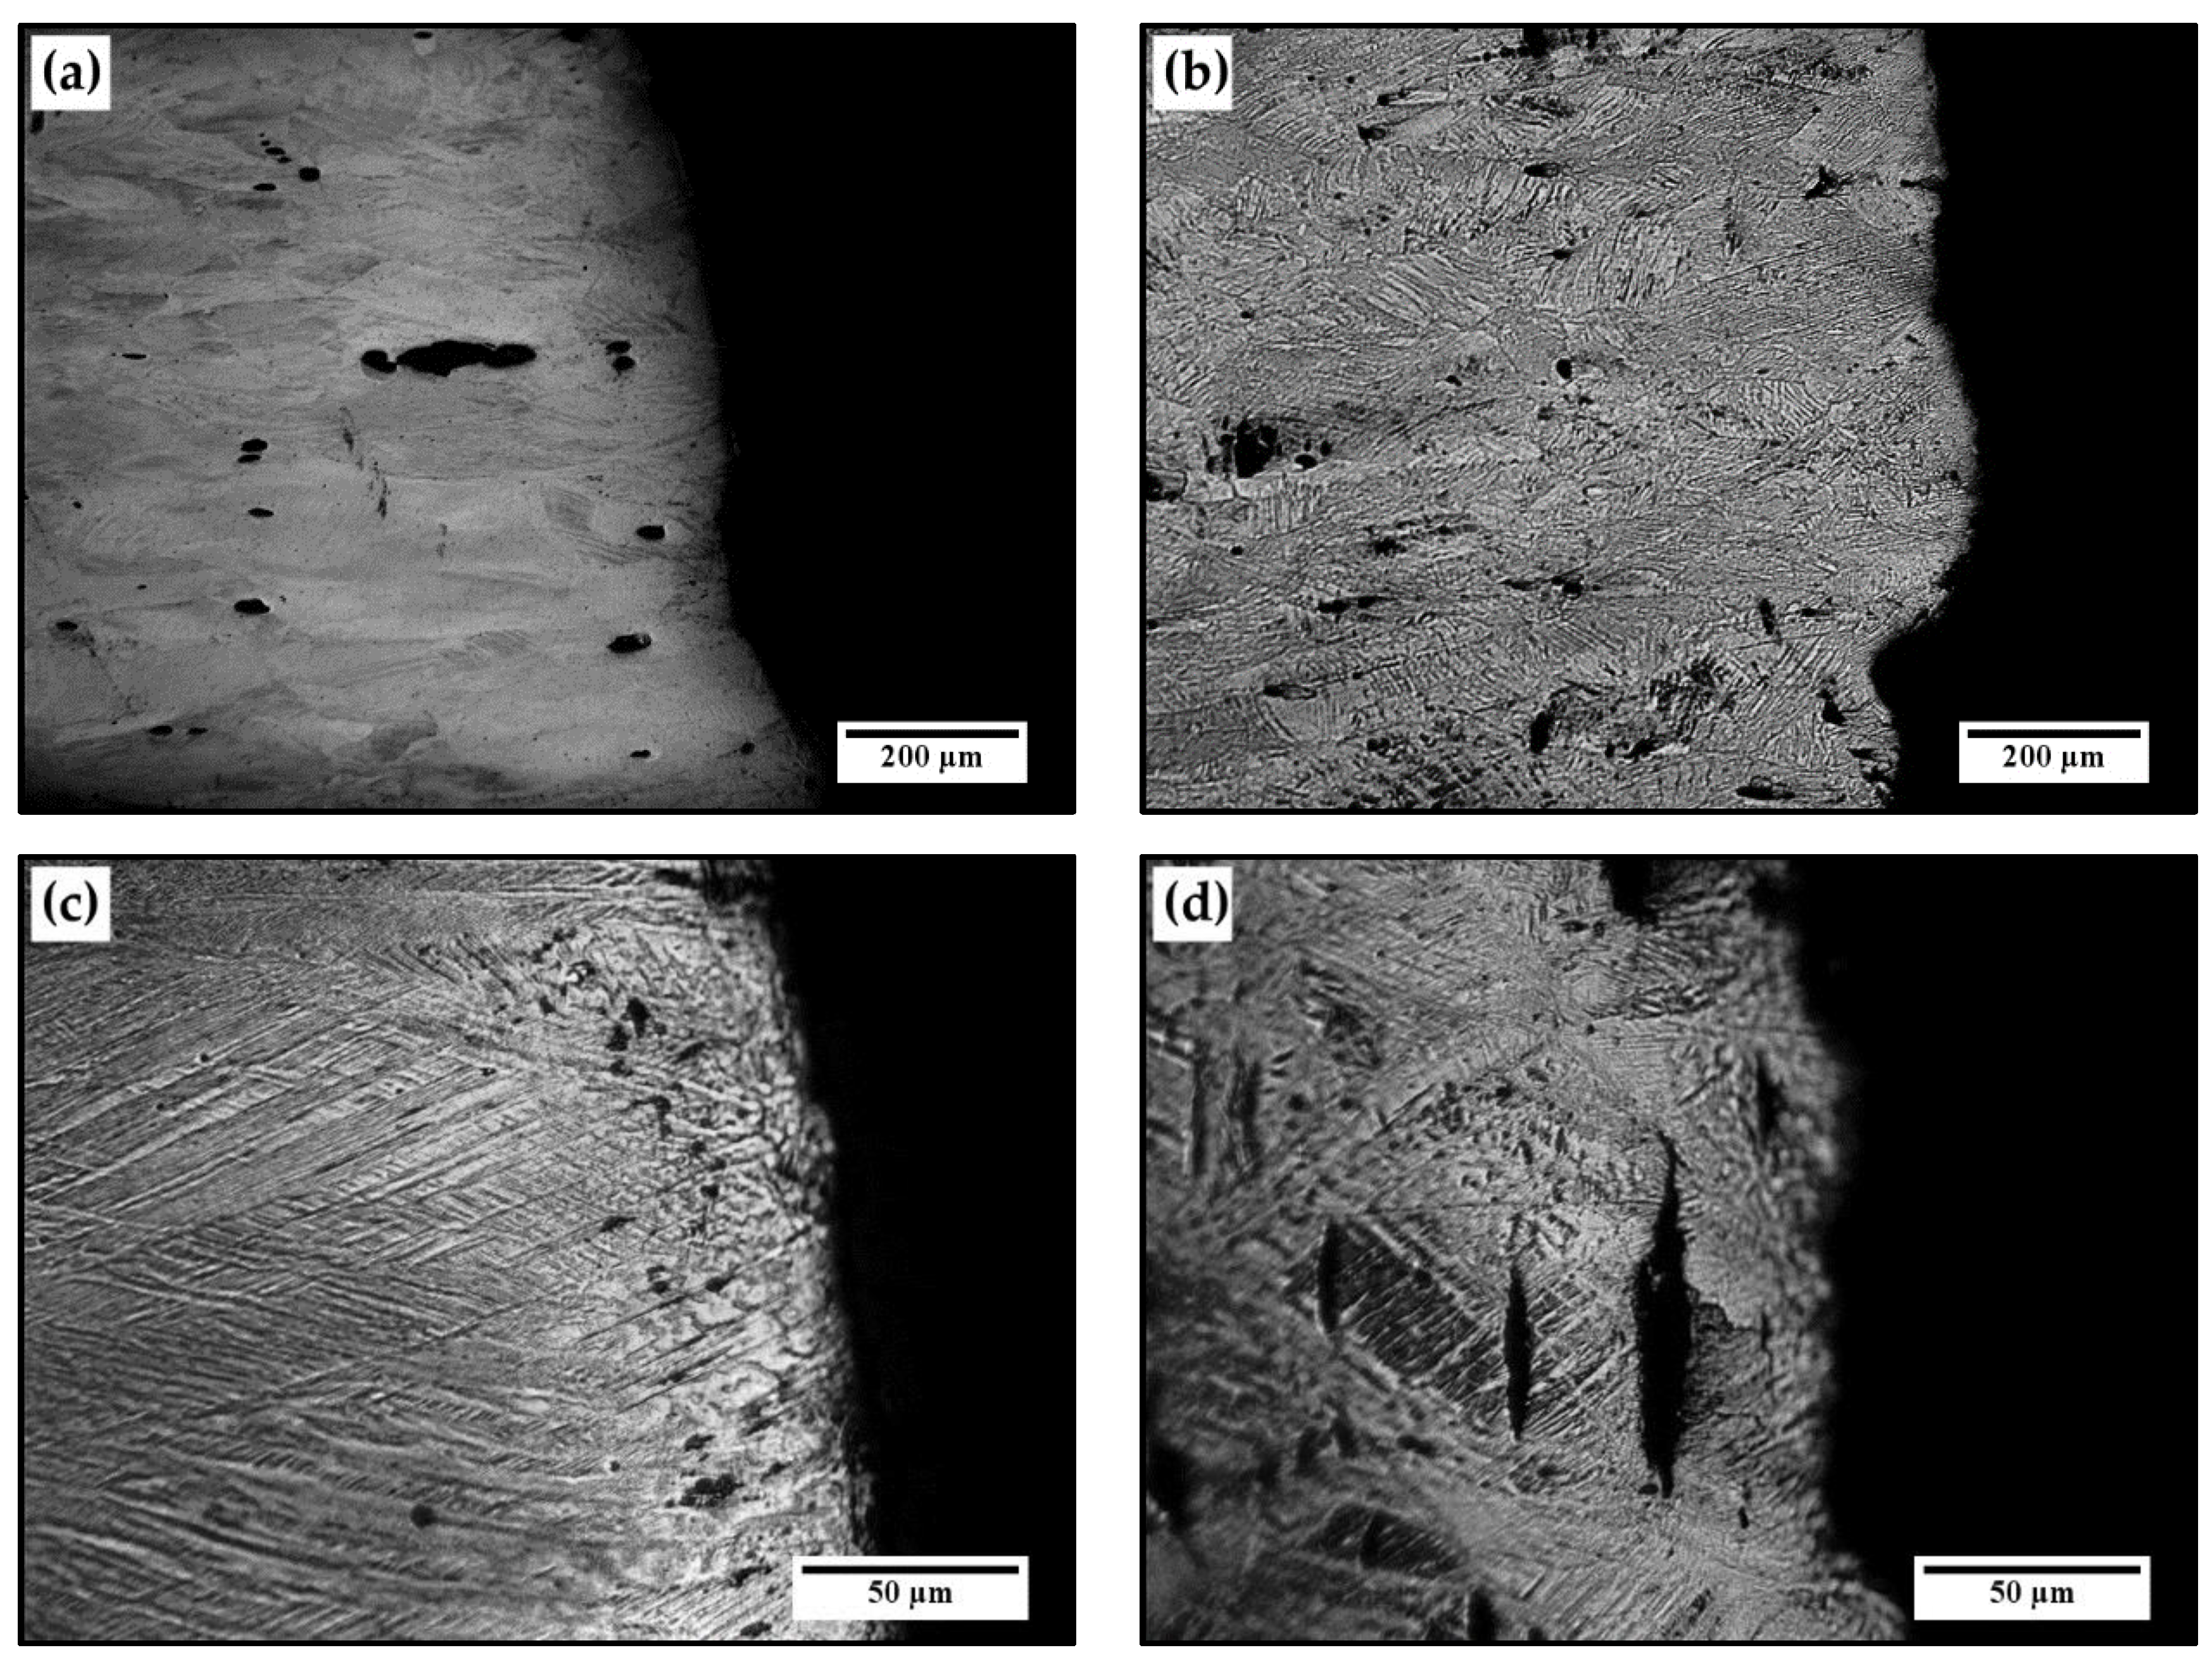
3.2. Initial Microstructural Characterization

Figure 1 shows the optical micrographs taken in different stages from the cast ingots until the end of thermo-mechanical processing revealed with nital. The dendritic coarse-grained microstructure corresponding to the as-cast condition is clearly seen in Figure 1a,b. Steel B is fully austenitic, whereas Steel C exhibits thin platelets inside the austenite grains. Figure 1c,d show typical banded microstructures with segregation resulting from hot forging processes and no evidence of dendritic structure is visible. Figure 1e,f correspond to the microstructural condition after the final steps (hot-rolling and quenching). A more uniform grain size distribution and less notorious effect of segregation bands is observed. Steel B microstructure resulted completely austenitic, and thin platelets are still present in Steel C. Details of this condition can be seen in Figure 2. Black points in this image are pits resulting from etching.
Further examinations were performed in as-cast specimens of Steel C in order to describe more accurately the microstructure. Acquired images with polarized light and nital etchant are depicted in Figure 3a,b. Superficial striations consisting in straight lines with multiple orientations can be seen. Microstructures of Figure 3c,d were revealed with Vilella’s reagent. Fine plate morphology structure represented with dark lines in austenite matrix (gray) conforming blocks or packets are present. Note that in Figure 3a,c the lines do not cross the grain boundary. All these characteristics are consistent with εt -martensite plates [13,14] generated during air cooling of the ingot after melting. According to these observations it is probable that both kinds of ε- martensite are present, as seen in Figure 1f and Figure 2. That is, εt originated after casting and strain-induced ε-martensite (εd) as a consequence of the thermo-mechanical processing.
Average grain size estimations were made using the comparative method described in ASTM E112-13 [48]. Table 3 presents the results expressed by ASTM number (G) and its equivalent size in μm, which can be considered coarse [21].

3.3. Mechanical Characterization

Values of Rockwell B hardness, yield stress (σYS) determined by the 0.2% offset method, ultimate tensile strength (σUTS), elongation to fracture (εR) measured via tensile tests and absorbed energy in impact tests are given in Table 4.
The true stress versus true strain curves are displayed in Figure 4a and a jerky-serrated flow, indicating a non-uniformity of deformation, can be observed. Figure 4b shows remarkable differences in slopes at low deformation values. First serrations appear at a true strain of ≈0.025 in Steel B and ≈0.15 in Steel C, continuously increasing their amplitude until rupture. Normalized strain-hardening rate defined as (dσt/dεpt)/G versus plastic true strain (εpt) is displayed in Figure 5. The shear modulus, G, was adopted as 74 GPa.
Figure 6a shows a general view of the Charpy tested specimens. All of them remained unbroken and were separated, pushing the hinged halves manually to inspect the fracture surfaces. As can be seen in Figure 6b, both steels presented similar macroscopic aspects: Dull gray appearance, significantly lateral expansion and small shear lips.
Samples were taken from tensile test specimens for microstructural observations on the RD-TD plane, perpendicular to the fracture surface. Figure 7a,b show the microstructures close to the fracture surfaces where cavities can be observed. Some of these cavities appear to be elongated in the stress direction in Steel B and have random orientations in Steel C. As can be seen in the images at higher magnification, shown in Figure 7c,d, the microstructures suffered substantial modifications as a consequence of plastic deformation produced during the tensile tests. Curved lines on fractured austenite grains are visible in Steel B and localized damage associated to small cracks perpendicular to the tensile axis in Steel C. Similar characteristics were observed in micrographs taken close to the fracture profiles depicted in Figure 7d,f. The same curved lines limited by grain boundaries are present in Steel B, whilst dark lines with multiple orientations that probably correspond to ε-martensite laths are next to small fissures in Steel C.
Microhardness measurements are summarized in Table 5. Thermo-mechanical processed samples presented the lower values and standard deviation. Measurements performed adjacent to the fracture surface in tensile specimens showed similar values to those taken along the gauge length and were higher than those obtained in thermo-mechanical processed samples. Substantial increase of microhardness was revealed in Charpy specimens only when measured close to the fracture surface.

3.4. Fractography

SEM examinations of the fracture surfaces on tensile specimen shown in Figure 8a,b exhibit typical transgranular dimpled ductile fracture in both steels, occurred by nucleation, growth and coalescence of microcavities. Non-metallic inclusions inside larger equiaxial microcavities surrounded by smoothed zones can be seen and play a central role in this mechanism. Steel B shows coarser microcavities than Steel C. Images obtained at the center of the Charpy specimen are visualized in Figure 8c,d. Steel B shows a dimpled fracture with an increased fraction of smoothed zones in relation to the corresponding tensile specimen, which seems to overlap the microvoids. Almost the entire fracture surface of Steel C has a smoothed ductile appearance, though isolated cleavage facets and a few tiny dimples could be seen.

3.5. XRD Analysis

Normalized XRD patterns obtained from samples before and after the tensile tests are visualized in Figure 9. A first approach indicates that phases are the same in both conditions: Only austenite in Steel B and the coexistence of austenite and ε-martensite in Steel C. It is interesting to note that a Steel C diffractogram of the sample shows an increased intensity of ε-martensite peaks. This suggests that εd generated as the result of tensile deformation joined the initial εt. At the same time, peaks of two steels suffered alterations that are associated with variations in crystallite size and the introduction of planar defects (such as stacking faults), linear defects (such as dislocations) and other forms of atomic disorder [49]. Depending on the type of defect, the alteration of a diffraction peak is manifested in intensity, broadening and asymmetry [50].
Table 6 shows the results of the refinements. GoF values are of the same order between fittings and can be considered acceptable for comparative purposes. From the phase quantification arises that TWIP effect developed in Steel B because austenite is the unique phase present in the analyzed diffractograms. In contrast, a high amount of ε-martensite whose volume fraction increased considerably is the result of the γFCCεHCP strain-induced transformation involved in the TRIP effect. Quantification and analysis of planar faults and dislocation densities are outside the scope of the present work.

4. Discussion

4.1. SFE, Chemical Compositions and Initial Microstructure

Thermodynamic models have been used by several authors to obtain SFE as an alternative to experimental methods which can be more complicated and time-consuming [51,52]. The calculated SFE values presented in Table 2 via the Olson and Cohen model are consistent with those published in other papers [34,51].
The selected chemical compositions for the fabrication of the investigated steels were defined to accomplish TWIP and TRIP effects at room temperature in Steels B and C, respectively, by controlling SFE. This goal was achieved as depicted in Figure 10, where secondary hardening mechanisms to dislocation gliding and values of SFE from others investigations [23,31,51,53,54,55] are also indicated. As was stated previously, between 19 and 45 mJ/m2 deformation twinning is dominant (Steel B) and below the minimum value twinning is replaced by γFCCεHCP strain-induced transformation (Steel C). From Figure 10 arises that at higher carbon contents SFE tends to increase, so carbon stabilizes austenite [23]. Grain size effects were not taken into account in our calculations since the influence of this parameter is negligible considering the current measured sizes [31].
A clear difference that arises comparing the as-cast microstructures of the fabricated steels is the presence of εt in Steel C, which is directly linked to the SFE. The value of martensite-starting temperature for the γFCCεHCP transformation (Msγε) was calculated in −27 °C for this steel using Equation (2) derived from multiple regression analysis by Yang et al. [56] where w represents the weight percent of each element identified in the subscript. The formation of εt as a consequence of cooling to room temperature after melting is in agreement with the present observations and could be explained as follows. Athermal martensite is formed only when Msγε is reached during cooling. Since the Steel C Msγε was estimated below room temperature, the presence of εt in as-cast specimens shown in Figure 3 is expected to be isothermally formed during continuous slow cooling of the ingot, which is affordable even to a temperature slightly higher than Msγε, as stated in the works of Sahu et al. [15,57]. Residual stresses are generated in this process due to the contraction of the ingot during cooling. A certain amount of εd is induced through forging and hot rolling followed by quenching that complements εt. The final microstructure of Steel C is consistent with experimental results of Schumann [58], who predicts austenitic and ε-martensitic domains at room temperature for this composition. Steel B also satisfies these results because carbon and manganese contents ensure a fully austenitic microstructure, so strain-induced γFCCεHCP transformation is precluded in this case. Msγε for this alloy is well below room temperature (−150 °C).
M S   γ ε ( K ) = 576 489 w C 9.1 w Mn 17.6 w Ni 9.2 w Cr + 21.3 w Al + 4.1 w Si 19.4 w Mo 1 w Co 41.3 w Cu          50 w Nb 86 w Ti 34 w V 13 w W

4.2. Mechanical Properties and Their Relationship with Hardening Mechanisms

The serrated flow depicted in Figure 4a is a characteristic usually observed in uniaxial tensile tests at room temperature in Fe-Mn-C alloys and is attributed to the initiation and propagation of Portevin–LeChatelier bands in which the deformation is located. The phenomenon underlying the formation and propagation of these bands in high-manganese steels corresponds to dynamic strain aging (DSA) based on the interaction between sliding dislocations and diffusion of carbon atoms tending to anchor them [59]. An important macroscopic consequence of the DSA phenomenon is a negative strain rate sensitivity, which explains the inability of these steels to sustain large post-uniform strains after initiation of necking [29].
Ultimate tensile strength, 0.2% offset yield stress, Charpy absorbed energy and elongation to fracture results reported in Table 4 were plotted in Figure 11. One of the most remarkable differences that arise from this figure corresponds to the elongation to fracture, which resulted considerably lower in Steel C. This is in agreement with the work of Yang et al. [60], who investigated the incidence of carbon content on the tensile properties of Fe-22M-xC, with x = 0.2, 0.4 and 0.6. They found lower values of elongation to fracture in steels with less carbon contents. With regard to this behavior in terms of hardening mechanisms, Chun et al. [61] attributed the decrease in ductility of a TRIP-aided steel with respect to fully austenitic TWIP steel to the presence of thermal-induced ε-martensite, which is in accordance with this investigation. Another difference that emerged from the tensile tests is revealed by comparing the σYS/σUTS ratio from Table 4. The value obtained in Steel B doubles Steel C and this difference can be attributed to the low yield stress in Steel C. Bouaziz pointed out that yield stress induced by solid solution hardening is greatly increased with carbon content [21], and this could be the primary cause of a higher value of Steel B than Steel C, which even has a finer grain size. Hardness measurements were repetitive and similar to hot-rolled and fully recrystallized 300 series stainless steels [62].
From XRD analysis and microstructural observations, it is evident that Steel B is single-phase austenite before and after the tensile tests, while a considerable increase in ε-martensite was revealed in Steel C. Its final volume fraction reported in Table 6 (0.69) corresponds to the sum of εt and εd, induced during cooling and straining until fracture, respectively, and is in agreement with that considered as the threshold value for damage initiation [63]. Moreover, no α’-martensite with body-centered tetragonal (BCT) structure was detected in XRD patterns obtained in samples subjected to plastic deformation, so the TRIP effect developed in Steel C is only due the previously cited phase transformation.
In general terms, Steel C showed higher strain-hardening than Steel B, if one considers the values of (σUTS- σYS)t/εpt-UTS reported in Table 4 as (σUTS- σYS)t, which is the difference between true values of ultimate tensile strength and yield stress, and εpt-UTS is the plastic true strain at ultimate tensile strength. With regard to the normalized strain-hardening rate displayed in Figure 5, Steel C exhibited remarkably higher values at low strains, decreasing continuously until fracture. On the other hand, Steel B, showed a pronounced decrease in (dσt/dεpt)/G up to a value of around 0.032 from 0 to 0.025 plastic true strain, increasing to (dσt/dεpt)/G ≈ 0.035 and then maintained approximately constant at this value (dσt/dεpt)/G ≈ 0.035 until fracture. From a plastic true strain ≈0.20, the Steel B curve is over the Steel C curve, so in this zone the normalized strain-hardening rate of the former is higher than the latter.
Dislocation gliding is active in all deformation ranges for both alloys. After a critical dislocation density is attained, mechanical twinning, which is explained in terms of the dynamic Hall–Petch effect [9], is activated in Steel B. The start of serrated flow in this steel, associated with DSA, is observed from Figure 4b at low strains (≈0.025) and more noticeable at higher strains. In Steel C, in which the strain-induced ε-martensitic transformation is the secondary hardening mechanism, the serrations are noted from true strains ≈0.15. According to the work of Koyama et al. [55], the contribution of DSA in work hardening is less significative than twinning and ε-martensitic transformation.
Considerable high absorbed energy was measured in both steels via impact tests, which was corroborated by substantial lateral expansion noted from direct macroscopic visual examinations of the fractured specimens exposed in Figure 6b. From Figure 11 it is noteworthy to mention that Steel B not only has better impact toughness, but also significantly higher ductility under quasi-static loading expressed as elongation to rupture. These distinctive behaviors are the consequence of the secondary hardening mechanisms operating in each alloy, promoted by the differences in carbon content and the developed fracture modes which will be discussed in the following section. Notwithstanding the foregoing, the strain-hardening of the two alloys is evidenced considering the values of microhardness (Table 5), where measurements close to the fracture surfaces in both tensile and Charpy specimens were reported. It was proven that measurements throughout the gauge length in tensile specimens were similar to those obtained adjacent to the fracture surfaces and higher than those corresponding to the non-tested materials. In Charpy specimens, the increase in microhardness was corroborated in the fracture zone, whilst lower values were obtained distant to this zone.

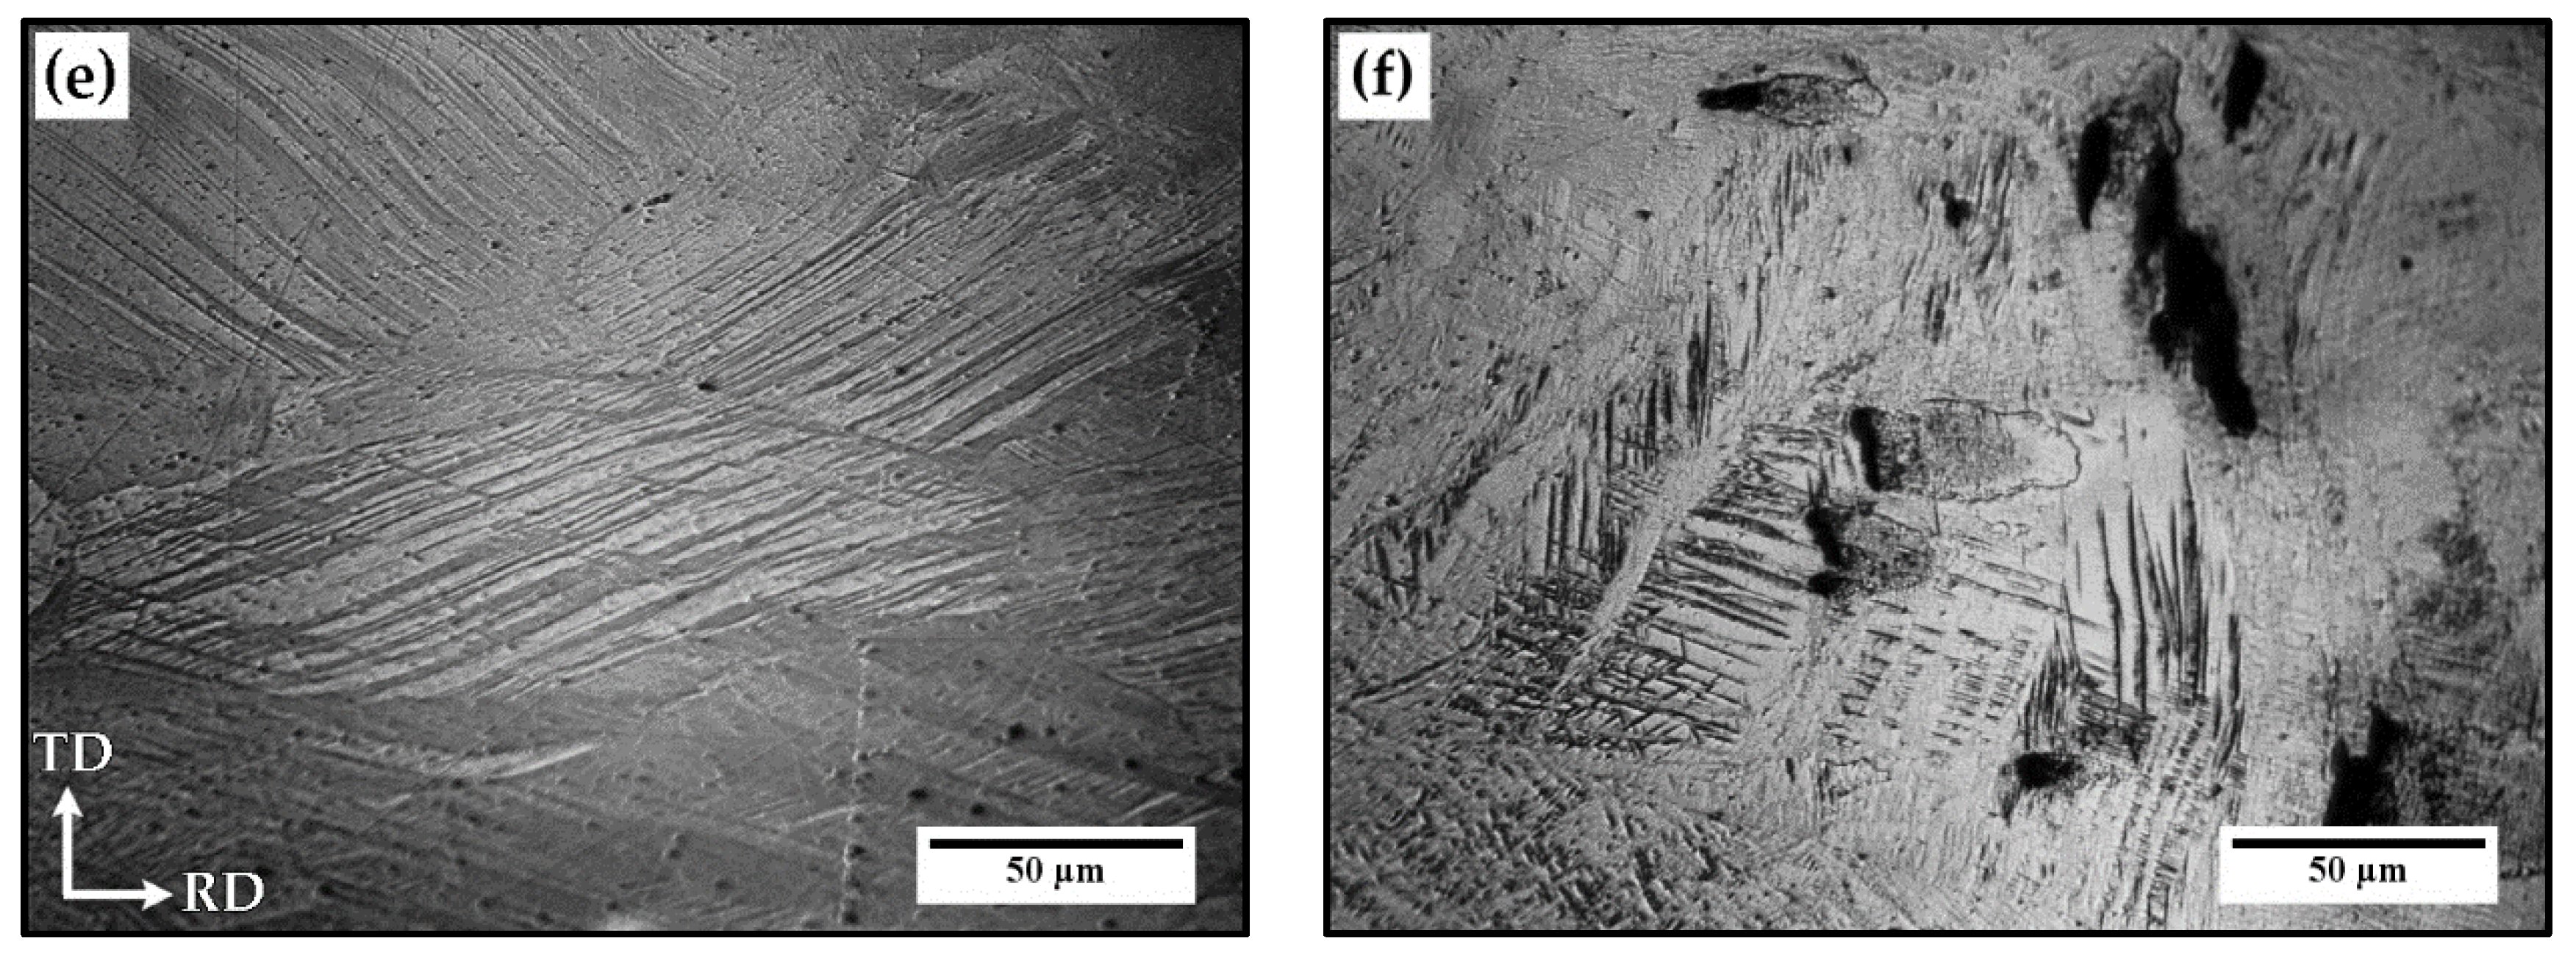
4.3. Fracture Behavior, Damage Mechanisms and Microstructural Changes under Plastic Deformation

Despite of the presence of ε-martensite in Steel C, typical ductile dimpled fractures were clearly observed by SEM in tensile specimens of both alloys. As can be seen in Figure 8a,b, microvoids are similar in size and uniformly distributed over the entire surface. A similar mechanism has been reported for Hadfield steels [64], austenitic stainless steels [65] and high-manganese steels with TWIP/TRIP effects [53,66]. As well as in tensile tests, under impact loading Steel B failed in a ductile manner. However, the fracture appearance is smoother than that in tensile tests, with tiny elongated dimples randomly distributed (Figure 8c) which could be explained by virtue of the differences in stress states and strain rates in tensile and Charpy tests, respectively. In contrast, the Steel C fracture mechanism changed from completely ductile in tensile tests to quasi-cleavage in impact tests, revealed by the presence of isolated cleavage facets or tongues surrounded by smooth regions and a small fraction of sheared microcavities. According to Li et al. [67], γFCCεHCP transformation is strongly influenced by strain rate. Indeed, cleavage fractures connected with the TRIP effect and impact loads in Steel C produced a slight decrease in the impact toughness in comparison to Steel B, in which the TWIP effect is the subsidiary hardening mechanism.
Figure 7 clearly shows microstructural differences on tensile specimens resulting from the TWIP and TRIP phenomena. Morphologies of the twins generated after plastic deformation in Steel B are characterized by curved lines enclosed in austenite grains, similar to those described in the work of Xiong et al. [52]. The incidence of strain-induced γFCCεHCP transformation in Steel C can be rationalized as dispersed tiny cracks with random orientations in the matrix, although some of the cracks close to the fracture profile were normal to the tensile axis. An important contribution in this regard was made by Chun and co-workers [61] who investigated, by means of tensile tests, the incidence of thermal-induced γFCCεHCP transformation in high-manganese steels. They demonstrated, using SEM, that cracks nucleate in ε-martensite platelets which are harder than austenite. Ghasri-Kouzhani and McDermid [63] also observed damage associated with the ε-martensite phase in Fe-22Mn and Fe-22Mn-0.2C and reasserted the fact that interfaces between austenite and ε-martensite platelets are sites that favor the onset of damage that leads to the debonding of the interface and consequent cracking. Based on the observed evidence and that of the cited authors, it can be postulated that damage on Steel C tensile specimens is associated with ε-martensite and could be the reason for the lower ultimate tensile strength and elongation to fracture compared to Steel B.

5. Conclusions

Two high-manganese steels with different carbon contents and SFEs of 21.2 (Steel B) and 12.5 mJ/m2 (Steel C) were studied in this work. The following aspects can be highlighted:
  • XRD analysis revealed the presence of 100% austenite in Steel B both before and after the tensile tests until fracture. Instead, in Steel C, an increment from 0.45 to 0.69 in ε-martensite volume fraction was determined.
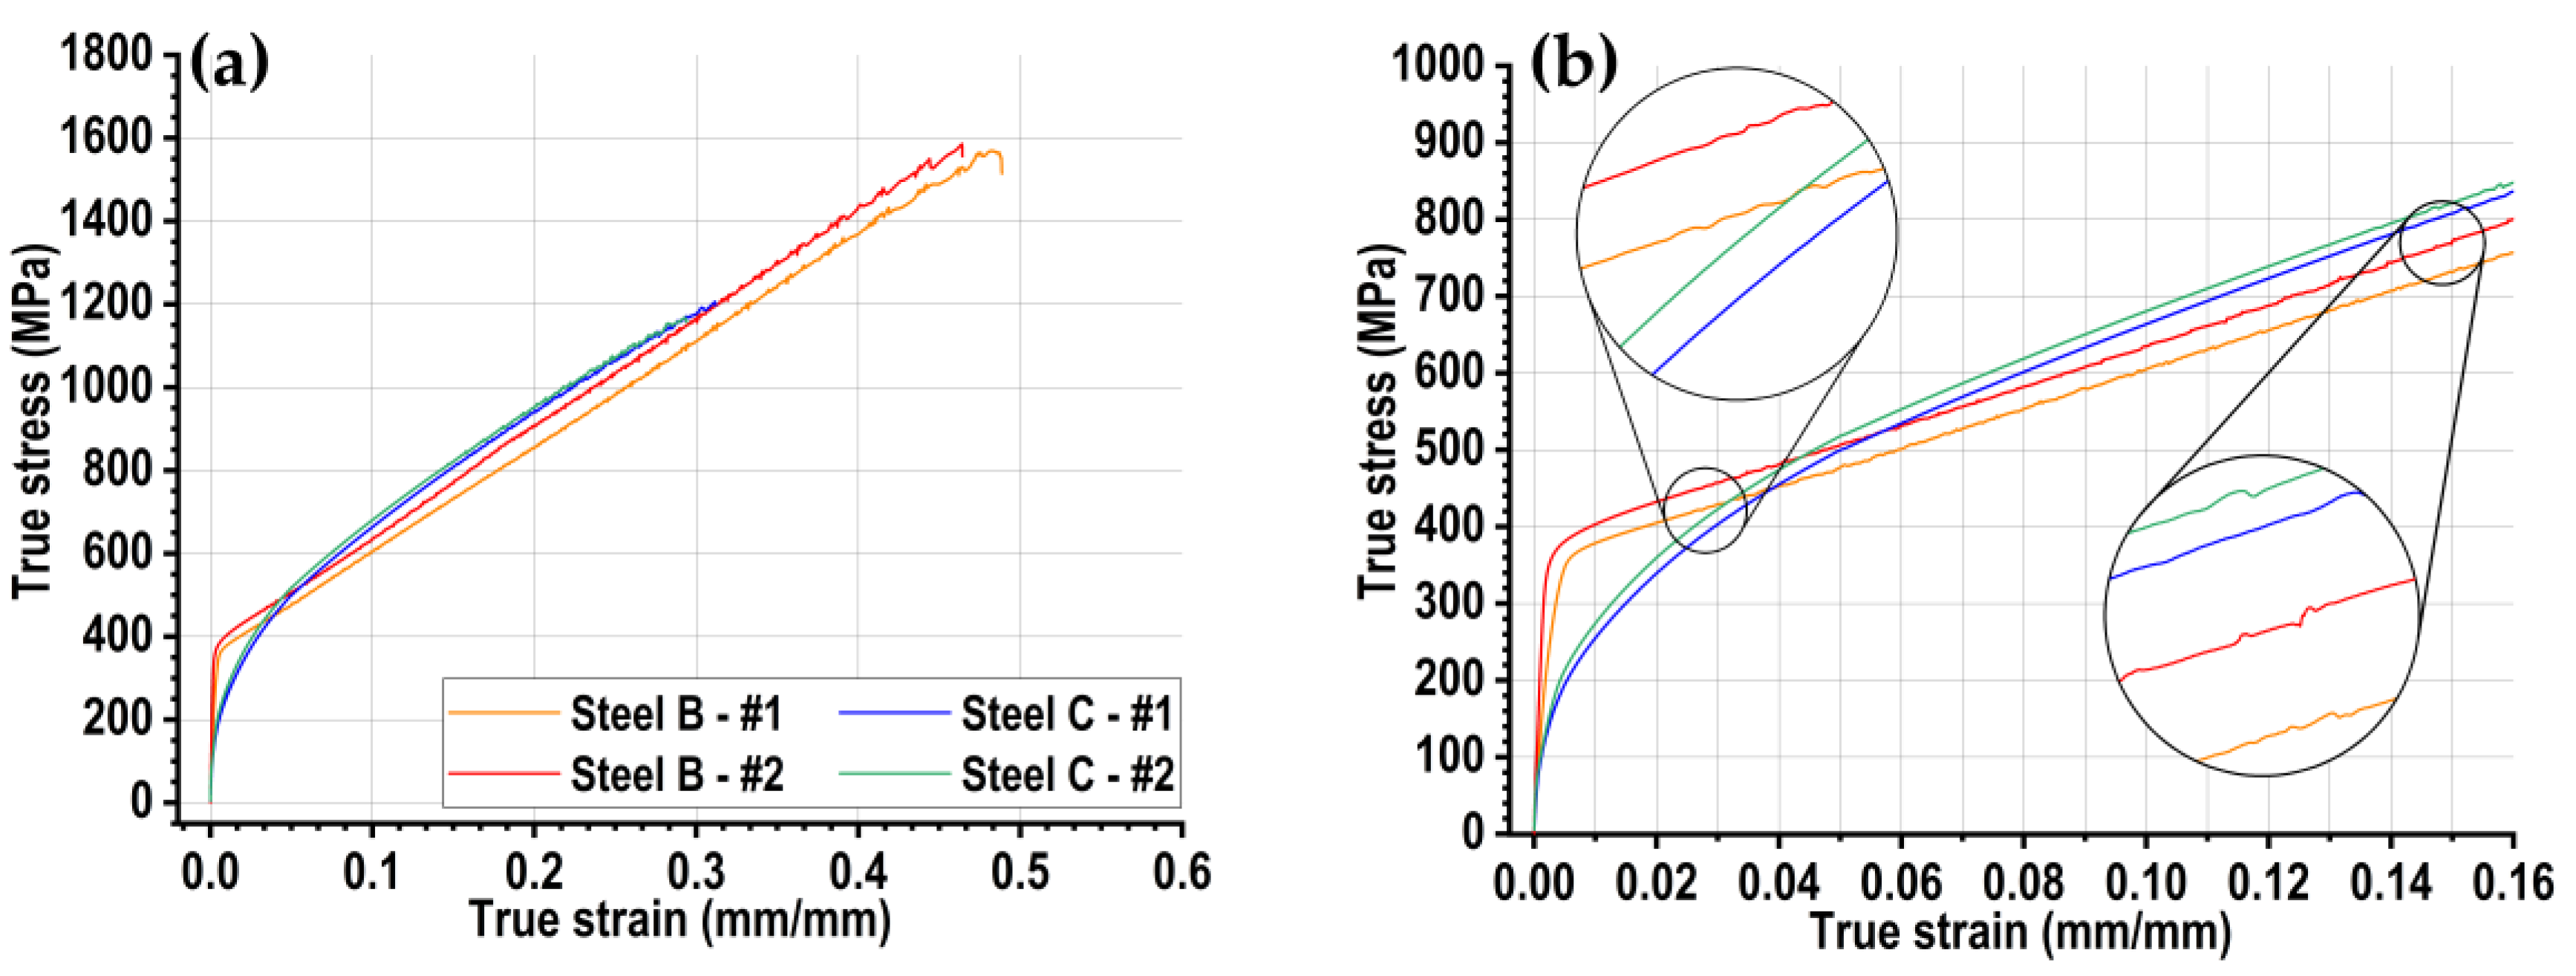
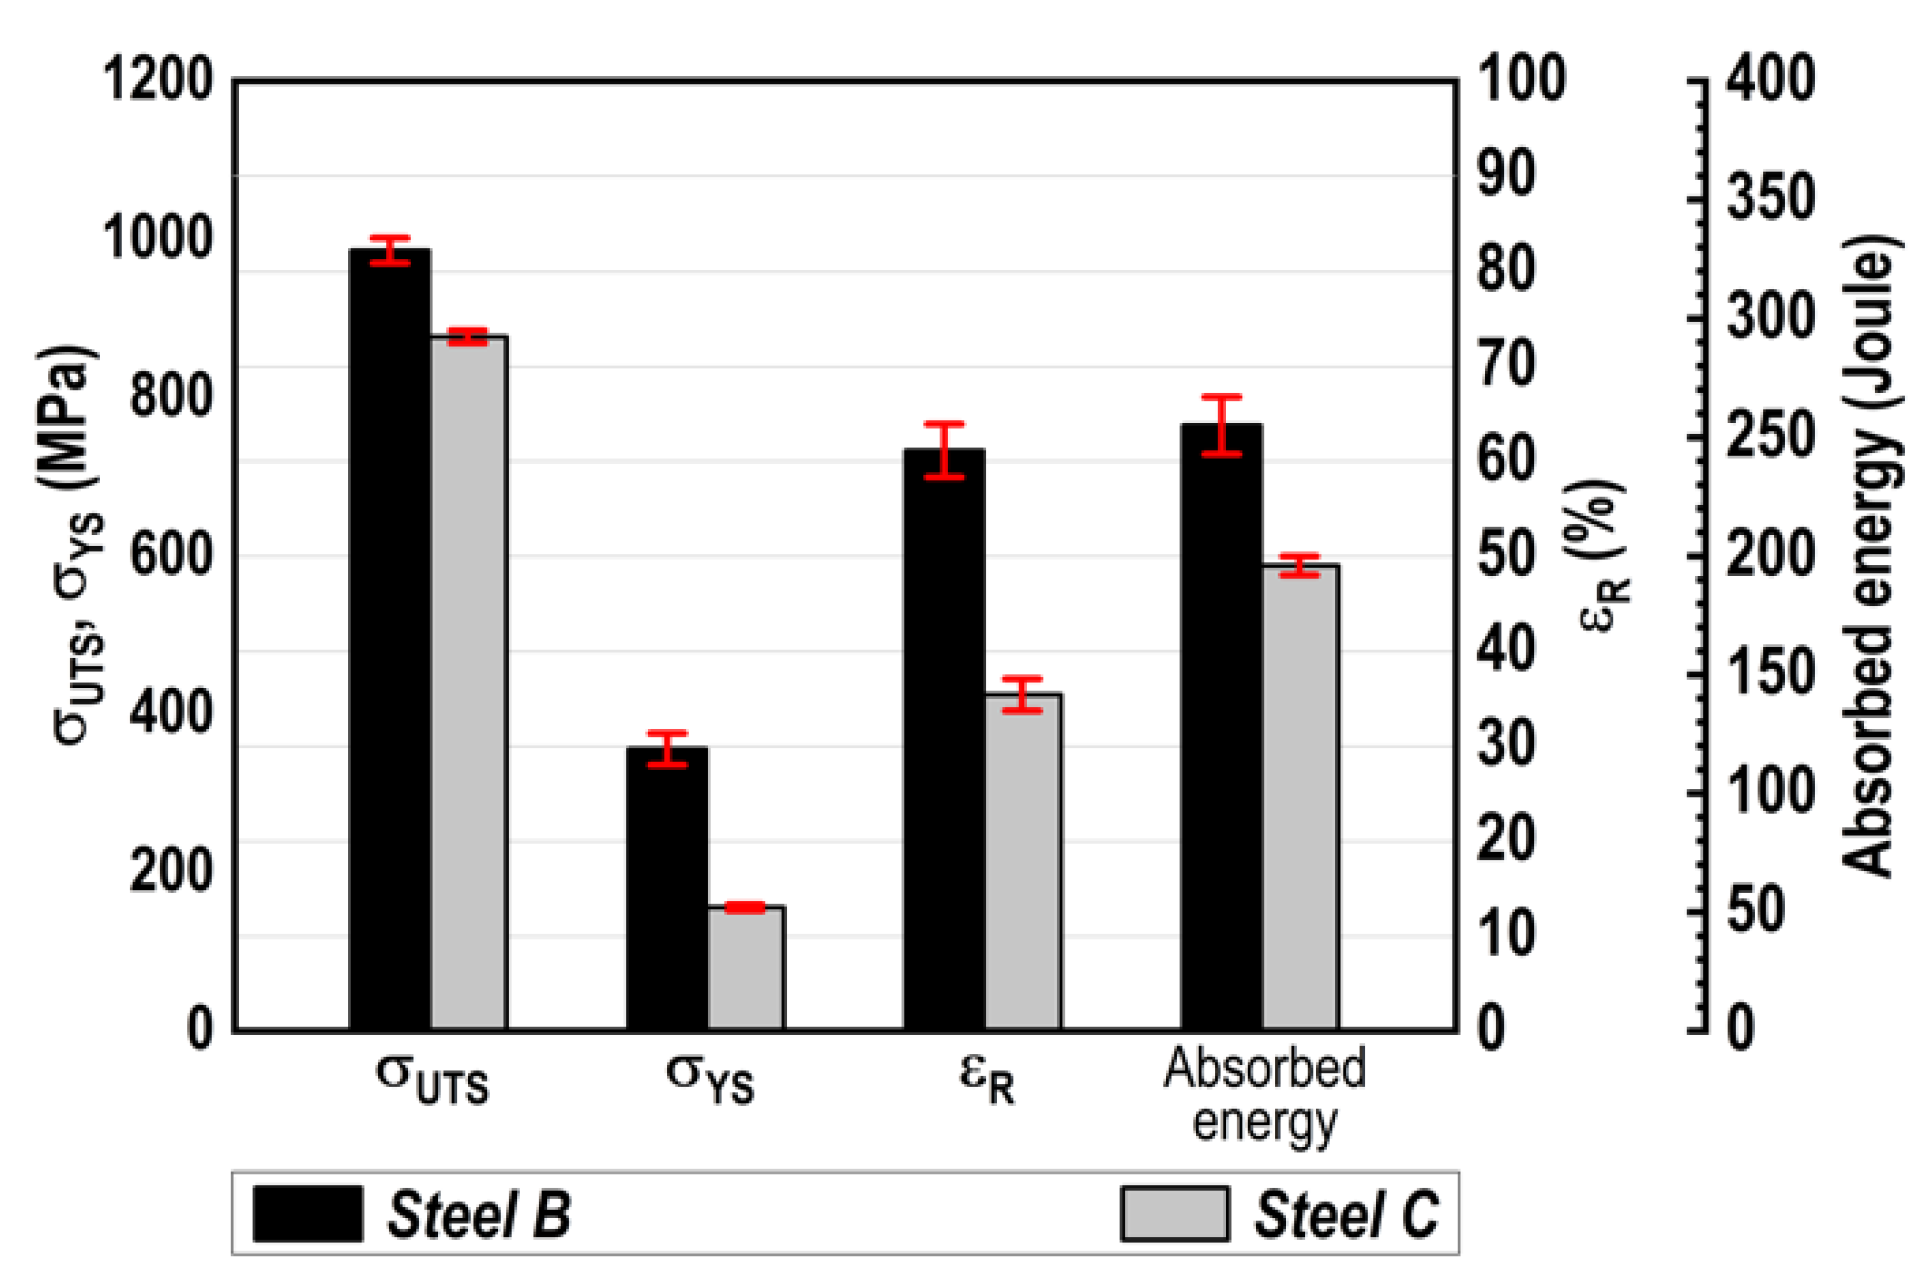
  • Steel B clearly presented better performance in tensile and impact tests than Steel C (ultimate tensile strength, 0.2% offset yield stress, elongation to fracture and absorbed energy).
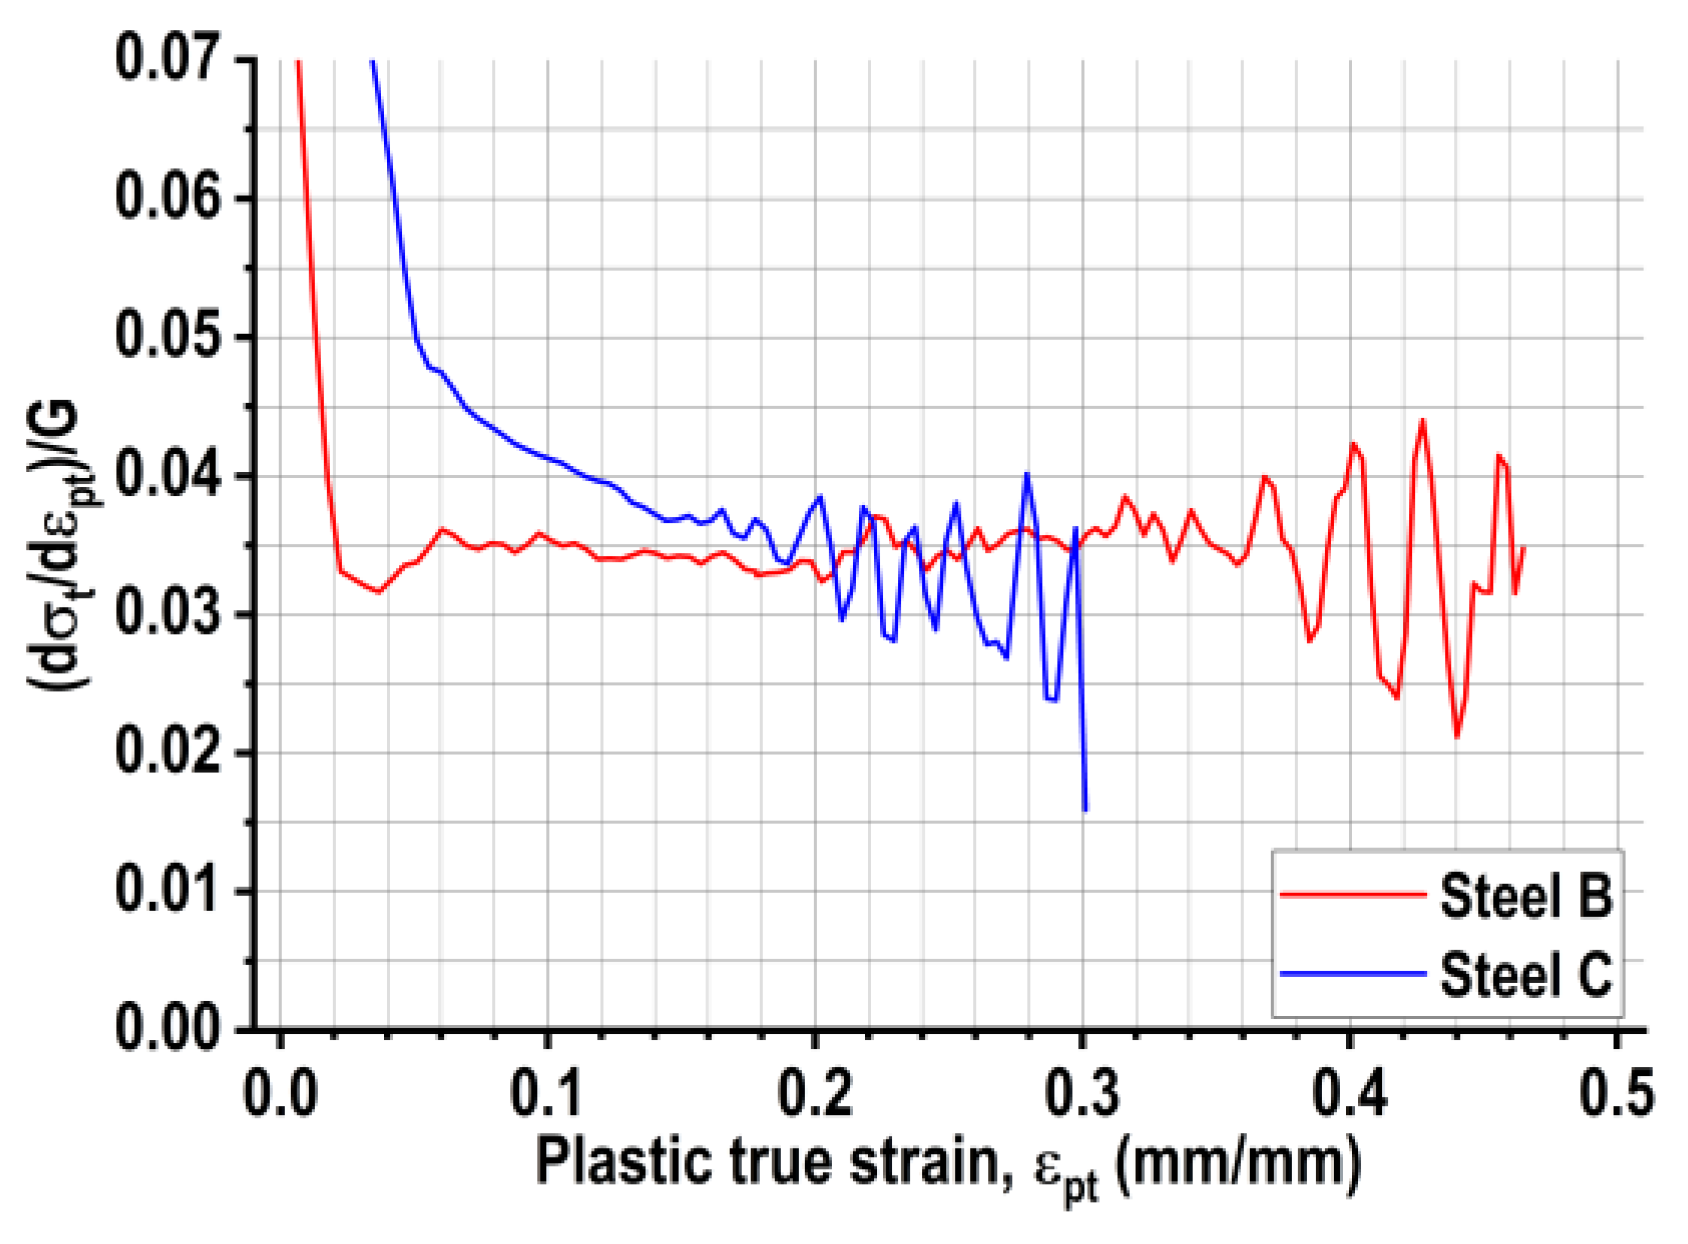
  • Normalized strain-hardening rate, (dσt/dεpt)/G, was considerably higher in Steel C at low deformation values due to dislocation glide, continuously decreasing up to fracture. From plastic true strains ≈0.20, Steel B presented higher values (dσt/dεpt)/G than Steel C. These behaviors are the consequence of the operating secondary hardening mechanisms in each alloy (mechanical twinning in Steel B and strain-induced γFCCεHCP transformation in Steel C).
  • Serrated flow related to DSA was observed from plastic true strains of ≈0.025 and ≈0.15 for Steel B and Steel C, respectively.
  • The foremost microstructural difference revealed in tensile specimens is the presence of dispersed tiny cracks in the Steel C matrix and close to the fracture surface that could be related to ε-martensite platelets associated with the TRIP effect.
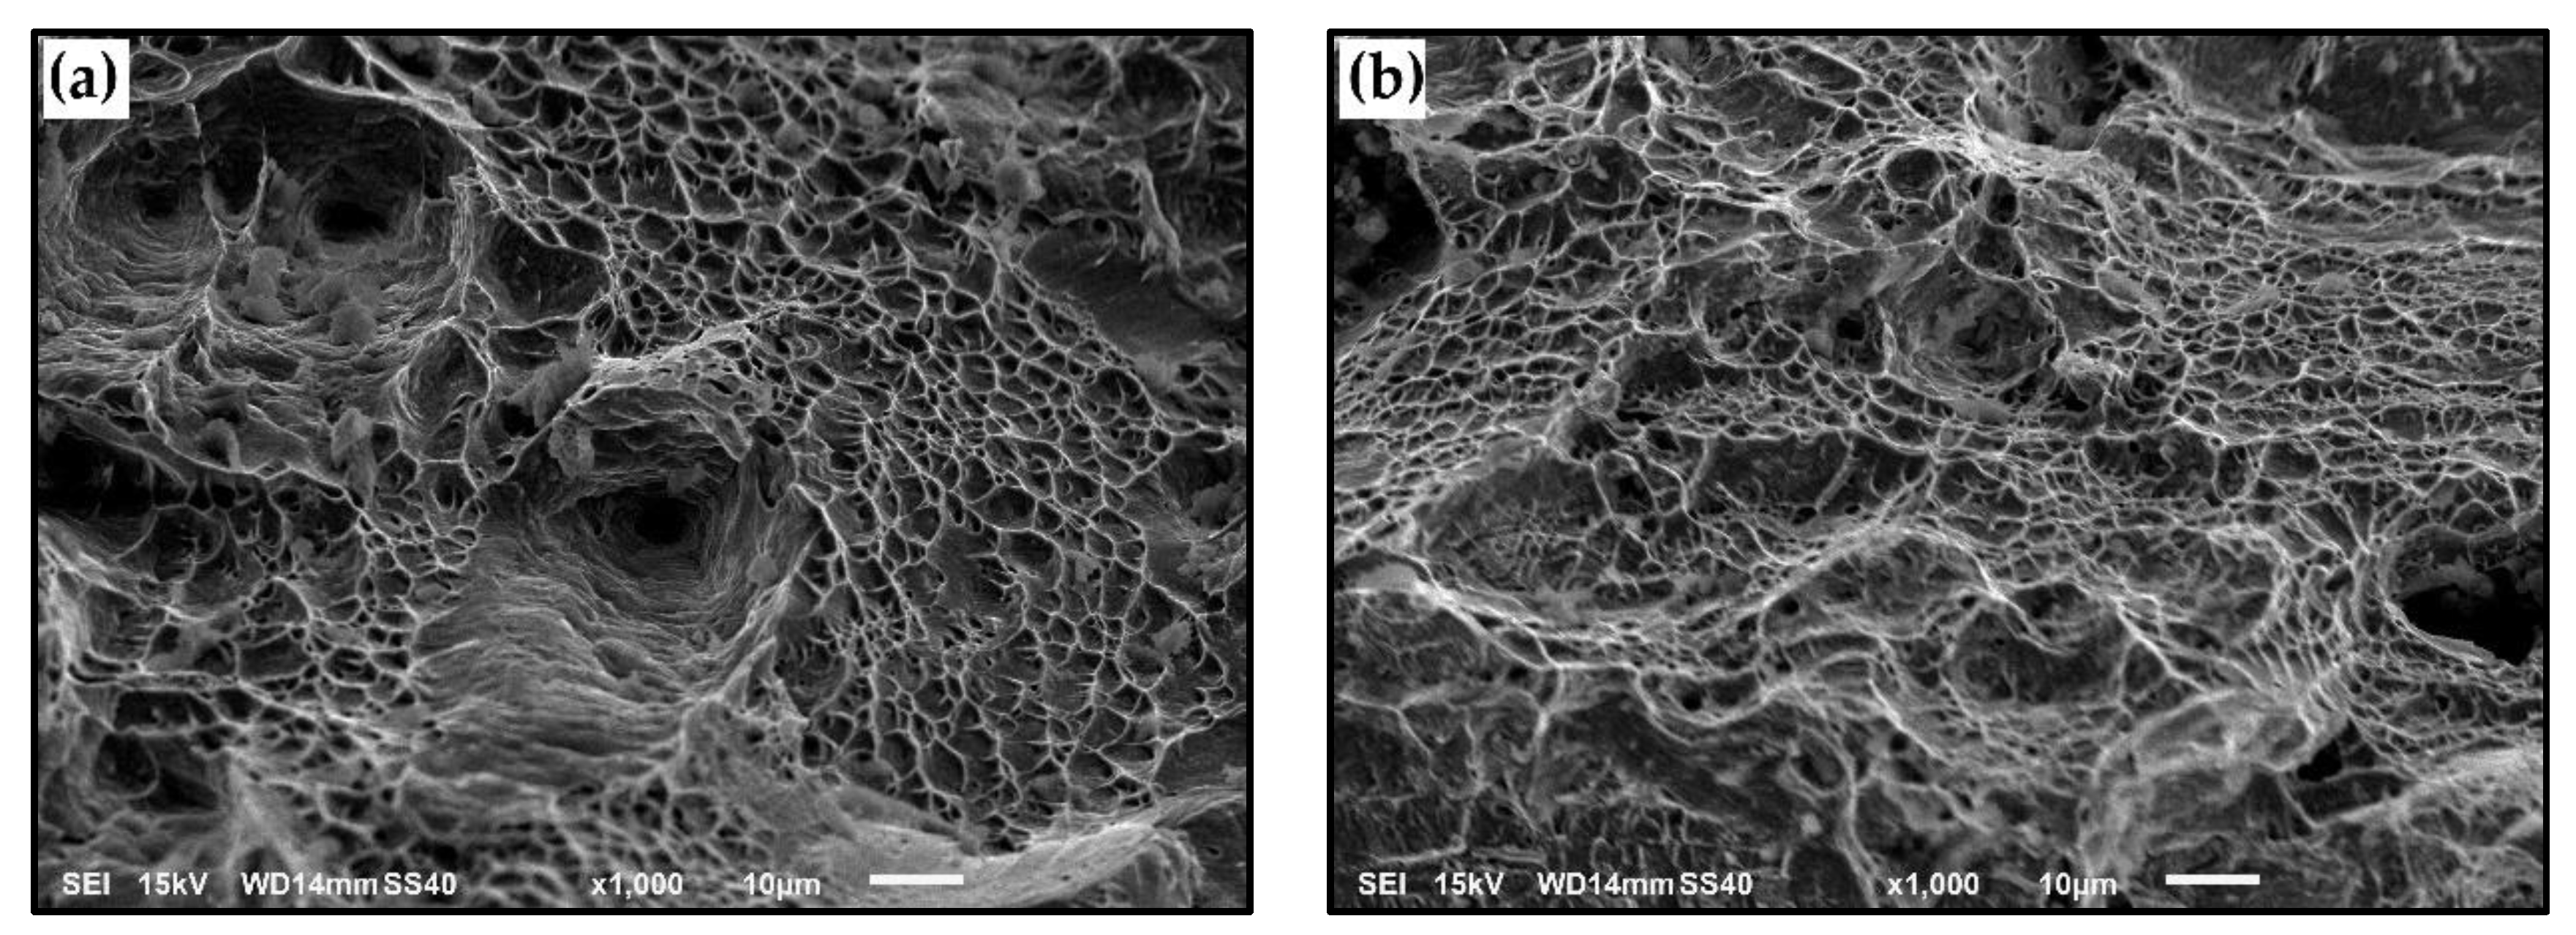
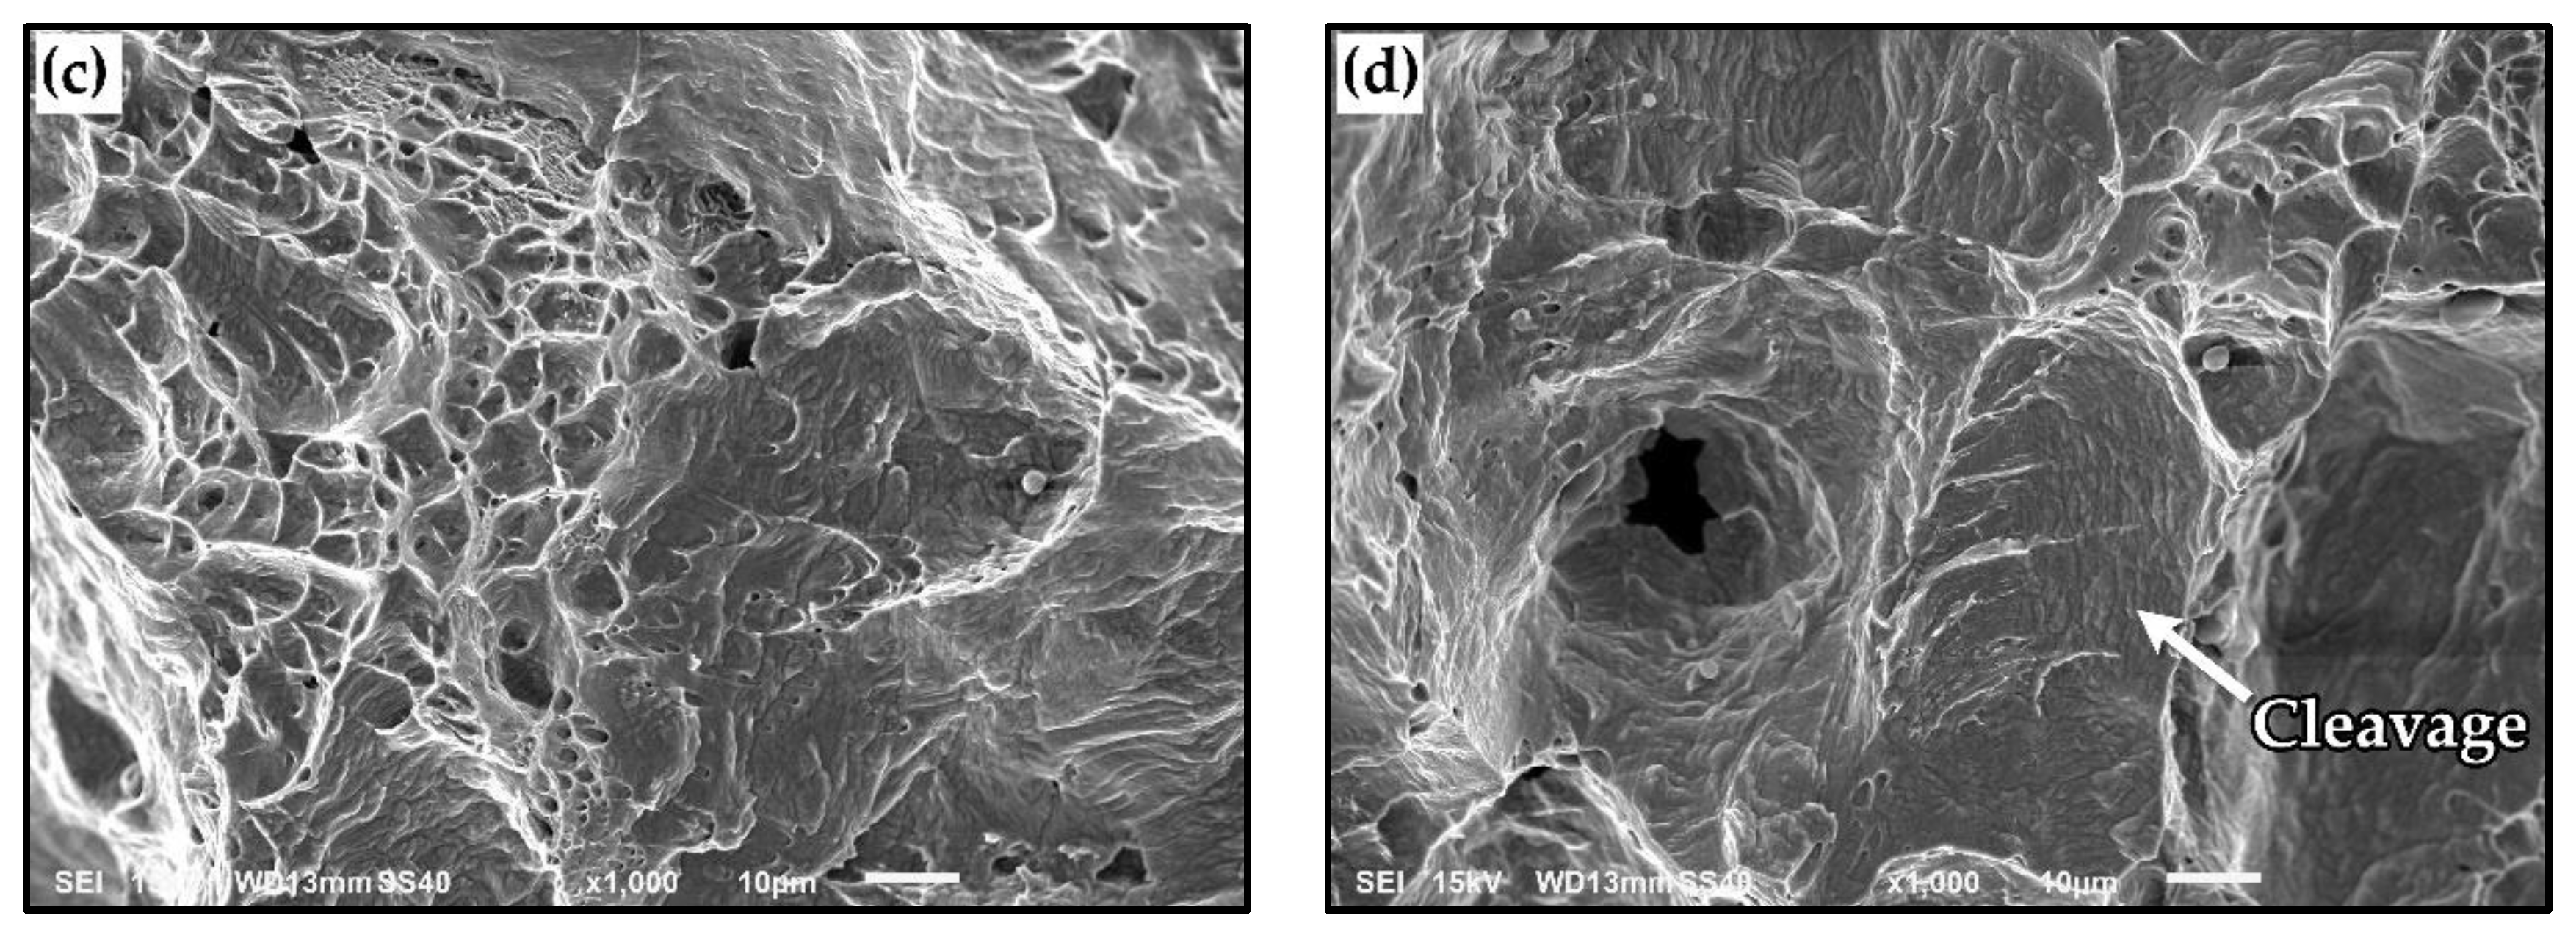
  • Typical dimpled fracture surfaces were observed in both alloys under quasi-static loading applied in tensile tests. Under impact load, Steel B fractured in a ductile manner, although a quasi-cleavage mode was observed in Steel C. Isolated cleavage facets connected with the TRIP effect could be the reason for a slight reduction in impact toughness of this alloy.

Author Contributions

Conceptualization, M.B., J.P.-I. and A.M.; data curation, M.B. and R.B.; formal analysis, M.B., J.P.-I. and A.M.; funding acquisition, A.M.; investigation, M.B.; methodology, M.B., J.P.-I. and A.M.; project administration, A.M.; resources, A.A. and A.M.; software, M.B. and R.B.; supervision, J.P.-I., R.B. and A.M.; validation, M.B. and A.A.; visualization, M.B.; writing—original draft, M.B.; writing—review & editing, M.B., J.P.-I. and A.M. All authors have read and agreed to the published version of the manuscript.

Funding

This research was funded by the National Agency for Research and Development (ANID)/Scholarship Program/DOCTORADO BECAS CHILE/2019—21190016 and DICYT, Dirección de Investigaciones Científicas y Tecnológicas, Grant 052014MG, from Universidad de Santiago de Chile.

Institutional Review Board Statement

Not applicable.

Informed Consent Statement

Not applicable.

Data Availability Statement

Data is contained within the article or supplementary material. The data presented in this study are available in Ph. D. Thesis of Matías Bordone entitled “Characterization by means of an elastoplastic methodology of the fracture toughness of TWIP steels with different carbon contents”, USACH 2021, Santiago, Chile.

Acknowledgments

Matías Bordone gratefully acknowledges the support provided by “Laboratorio de Desarrollo y Tecnología de Materiales” (DEYTEMA) of F.R.S.N—U.T.N. (Argentina) and “SIMET-USACH” of Universidad de Santiago de Chile. Alberto Monsalve gratefully acknowledges the support of DICYT USACH.

Conflicts of Interest

The authors declare no conflict of interest.

References

  1. Fonstein, N. Advanced High Strength Sheet Steels; Springer: Berlin/Heidelberg, Germany, 2015. [Google Scholar]
  2. Rana, R.; Singh, S.B. Automotive Steels: Design, Metallurgy, Processing and Applications; Elsevier: Amsterdam, The Netherlands, 2016. [Google Scholar]
  3. Chiaberge, M. New Trends and Developments in Automotive System Engineering; IntechOpen: Rijeka, Croatia, 2011. [Google Scholar]
  4. Rowe, J. Advanced Materials in Automotive Engineering; Elsevier: Amsterdam, The Netherlands, 2012. [Google Scholar]
  5. Badeshia, H.; Honeycombe, R. Steels. Microstructure and Properties, 3rd ed.; Elsevier: Amsterdam, The Netherlands, 2006. [Google Scholar]
  6. Frommeyer, G.; Brüx, U.; Neumann, P. Supra-Ductile and High-Strength Manganese-TRIP/TWIP Steels for High Energy Absorption Purposes. ISIJ Int. 2003, 43, 438–446. [Google Scholar] [CrossRef] [Green Version]
  7. De Cooman, B.C.; Chin, K.; Kim, J. High Mn TWIP Steels for Automotive Applications. In New Trends and Developments in Automotive System Engineering; InTech: Rijeka, Croatia, 2011. [Google Scholar]
  8. Remy, L. Kinetics of f.c.c. deformation twinning and its relationship to stress-strain behaviour. Acta Metall. 1978, 26, 443–451. [Google Scholar] [CrossRef]
  9. De Cooman, B.C.; Findley, K. Introduction to the Mechanical Behavior of Steel; Association for Iron & Steel Technology (AIST): Warrendale, PA, USA, 2018. [Google Scholar]
  10. Bouaziz, O.; Allain, S.; Scott, C.P. Effect of grain and twin boundaries on the hardening mechanisms of twinning-induced plasticity steels. Scr. Mater. 2008, 58, 484–487. [Google Scholar] [CrossRef]
  11. Kim, J.K.; Chen, L.; Kim, H.-S.; Kim, S.K.; Estrin, Y.; De Cooman, B.C. On the tensile behavior of high-manganese twinning-induced plasticity steel. Metall. Mater. Trans. A Phys. Metall. Mater. Sci. 2009, 40, 3147–3158. [Google Scholar] [CrossRef]
  12. De Cooman, B.C.; Estrin, Y.; Kim, S.K. Twinning-induced plasticity (TWIP) steels. Acta Mater. 2018, 142, 283–362. [Google Scholar] [CrossRef]
  13. Kikuchi, T.; Kajiwara, S.; Tomota, Y. Microscopic studies on stress-induced martensite transformation and its reversion in an Fe-Mn-Si-Cr-Ni shape memory alloy. Mater. Trans. JIM 1995, 36, 719–728. [Google Scholar] [CrossRef] [Green Version]
  14. Bergeon, N.; Guenin, G.; Esnouf, C. Characterization of the stress-induced m martensite in a Fe-Mn-Si-Cr-Ni shape memory alloy: Microstructural observation at different scales, mechanism of formation and growth. Mater. Sci. Eng. A 1997, 238, 309–316. [Google Scholar] [CrossRef]
  15. Sahu, P.; Hamada, A.S.; Ghosh, R.N.; Karjalainen, L.P. X-ray diffraction study on cooling-rate-induced γ fcc → ε hcp martensitic transformation in cast-homogenized Fe-26Mn-0.14C austenitic steel. Metall. Mater. Trans. A Phys. Metall. Mater. Sci. 2007, 38, 1991–2000. [Google Scholar] [CrossRef]
  16. Benzing, J.T.; Poling, W.A.; Pierce, D.T.; Bentley, J.; Findley, K.O.; Raabe, D.; Wittig, J.E. Effects of strain rate on mechanical properties and deformation behavior of an austenitic Fe-25Mn-3Al-3Si TWIP-TRIP steel. Mater. Sci. Eng. A 2018, 711, 78–92. [Google Scholar] [CrossRef]
  17. Hirth, J. Thermodynamics of Stacking Faults. Metall. Trans. 1970, 1, 2367–2374. [Google Scholar]
  18. Kelly, A.; Knowles, K. Crystallography and Crystal Defects; John Wiley & Sons, Inc.: Hoboken, NJ, USA, 2012; Volume 2. [Google Scholar]
  19. Pierce, D.T.; Bentley, J.; Jimenez, J.A.; Wittig, J.E. The Influence of Stacking-Fault Energy on Deformation Mechanisms in an Fe-Mn-Al-Si Austenitic TRIP/TWIP Steel. Acta Mater. 2012, 18, 1894–1895. [Google Scholar] [CrossRef]
  20. Pierce, D.T.; Jiménez, J.A.; Bentley, J.; Raabe, D.; Wittig, J.E. The influence of stacking fault energy on the microstructural and strain-hardening evolution of Fe-Mn-Al-Si steels during tensile deformation. Acta Mater. 2015, 100, 178–190. [Google Scholar] [CrossRef]
  21. Bouaziz, O.; Zurob, H.; Chehab, B.; Embury, J.D.; Allain, S.; Huang, M. Effect of chemical composition on work hardening of Fe-Mn-C TWIP steels. Mater. Sci. Technol. 2011, 27, 707–709. [Google Scholar] [CrossRef]
  22. Curtze, S.; Kuokkala, V.T. Dependence of tensile deformation behavior of TWIP steels on stacking fault energy, temperature and strain rate. Acta Mater. 2010, 58, 5129–5141. [Google Scholar] [CrossRef]
  23. Allain, S.; Chateau, J.P.; Bouaziz, O.; Migot, S.; Guelton, N. Correlations between the calculated stacking fault energy and the plasticity mechanisms in Fe-Mn-C alloys. Mater. Sci. Eng. A 2004, 387–389, 158–162. [Google Scholar] [CrossRef]
  24. Zhang, L.; Liu, X.H.; Shu, K.Y. Microstructure and Mechanical Properties of Hot-Rolled Fe-Mn-C-Si TWIP Steel. J. Iron Steel Res. Int. 2011, 18, 45–48. [Google Scholar] [CrossRef]
  25. Kim, J.K.; De Cooman, B.C. Stacking fault energy and deformation mechanisms in Fe-xMn-0.6C-yAl TWIP steel. Mater. Sci. Eng. A 2016, 676, 216–231. [Google Scholar] [CrossRef]
  26. Lee, S.; Lee, K.; De Cooman, B.C. Observation of the TWIP + TRIP Plasticity-Enhancement Mechanism in Al-Added 6 Wt Pct Medium Mn Steel. Metall. Mater. Trans. A Phys. Metall. Mater. Sci. 2015, 46, 2356–2363. [Google Scholar] [CrossRef]
  27. De Cooman, B.C.; Kwon, O.; Chin, K.-G. State-of-the-knowledge on TWIP steel. Mater. Sci. Technol. 2012, 28, 513–527. [Google Scholar] [CrossRef]
  28. Olson, G.; Cohen, M. A general mechanism of martensitic nucleation: Part I. General concepts and the FCC→ HCP transformation. Metall. Trans. A 1976, 7, 1897–1904. [Google Scholar]
  29. Bouaziz, O.; Allain, S.; Scott, C.P.; Cugy, P.; Barbier, D. High manganese austenitic twinning induced plasticity steels: A review of the microstructure properties relationships. Curr. Opin. Solid State Mater. Sci. 2011, 15, 141–168. [Google Scholar] [CrossRef]
  30. Lee, T.; Koyama, M.; Tsuzaki, K.; Lee, Y.H.; Lee, C.S. Tensile deformation behavior of Fe-Mn-C TWIP steel with ultrafine elongated grain structure. Mater. Lett. 2012, 75, 169–171. [Google Scholar] [CrossRef]
  31. Zambrano, O.A. Stacking fault energy maps of Fe-Mn-Al-C-Si steels: Effect of temperature, grain size, and variations in compositions. J. Eng. Mater. Technol. 2016, 138, 041010. [Google Scholar] [CrossRef]
  32. Ishida, K. Direct estimation of stacking fault energy by thermodynamic analysis. Phys. Status Solidi 1976, 36, 717–728. [Google Scholar] [CrossRef]
  33. Wietbrock, B.; Bambach, M.; Seuren, S.; Hirt, G. Homogenization strategy and material characterization of high-manganese TRIP and TWIP steels. Mater. Sci. Forum 2010, 638, 3134–3139. [Google Scholar] [CrossRef]
  34. Saeed-Akbari, A.; Imlau, J.; Prahl, U.; Bleck, W. Derivation and variation in composition-dependent stacking fault energy maps based on subregular solution model in high-manganese steels. Metall. Mater. Trans. A Phys. Metall. Mater. Sci. 2009, 40, 3076–3090. [Google Scholar] [CrossRef]
  35. Curtze, S.; Kuokkala, V.T.; Oikari, A.; Talonen, J.; Hänninen, H. Thermodynamic modeling of the stacking fault energy of austenitic steels. Acta Mater. 2011, 59, 1068–1076. [Google Scholar] [CrossRef]
  36. Dumay, A.; Chateau, J.P.; Allain, S.; Migot, S.; Bouaziz, O. Influence of addition elements on the stacking-fault energy and mechanical properties of an austenitic Fe-Mn-C steel. Mater. Sci. Eng. A 2008, 483, 184–187. [Google Scholar] [CrossRef]
  37. Hillert, M.; Jarl, M. A model for alloying in ferromagnetic metals. Calphad 1978, 2, 227–238. [Google Scholar] [CrossRef]
  38. Li, L.; Hsu, T.Y.; Zuyao, X. Gibbs free energy evaluation of the fcc (γ) and hcp (ε) phases in Fe-Mn-Si alloys. Calphad 1997, 21, 443–448. [Google Scholar] [CrossRef]
  39. ASTM E18-20. Standard Test Methods for Rockwell Hardness of Metallic Materials; ASTM International: West Conshohocken, PA, USA, 2020. [Google Scholar]
  40. ASTM E8/E8M-16ae1. Standard Test Methods for Tension Testing of Metallic Materials; ASTM International: West Conshohocken, PA, USA, 2016. [Google Scholar]
  41. ASTM E23-18. Standard Test Methods for Notched Bar Impact Testing of Metallic Materials; ASTM International: West Conshohocken, PA, USA, 2018. [Google Scholar]
  42. ASTM E1823-13. Standard Terminology Relating to Fatigue and Fracture Testing; ASTM International: West Conshohocken, PA, USA, 2013. [Google Scholar]
  43. ASTM E384-17. Standard Test Method for Microindentation Hardness of Materials; ASTM International: West Conshohocken, PA, USA, 2017. [Google Scholar]
  44. Lutterotti, L. Materials Analysis Using Diffraction (MAUD), Versión 2.93. Available online: http://nanoair.dii.unitn.it:8080/maud/ (accessed on 3 February 2020).
  45. Popa, N.C. The (hkl) dependence of diffraction-line broadening caused by strain and size for all Laue groups in Rietveld refinement. J. Appl. Crystallogr. 1998, 31, 176–180. [Google Scholar] [CrossRef]
  46. Warren, B.E. X-Ray Diffraction; Dover Publications, Inc.: New York, NY, USA, 1969. [Google Scholar]
  47. Dini, G.; Najafizadeh, A.; Monir-Vaghefi, S.M.; Ueji, R. Grain size effect on the martensite formation in a high-manganese TWIP steel by the Rietveld method. J. Mater. Sci. Technol. 2010, 26, 181–186. [Google Scholar] [CrossRef]
  48. ASTM E112-13. Standard Test Methods for Determining Average Grain Size; ASTM International: West Conshohocken, PA, USA, 2013. [Google Scholar]
  49. Young, R.A. The Rietveld method. Phys. Scr. 1993, 6, 132–166. [Google Scholar]
  50. Balogh, L.; Ribárik, G.; Ungár, T. Stacking faults and twin boundaries in fcc crystals determined by x-ray diffraction profile analysis. J. Appl. Phys. 2006, 100, 023512. [Google Scholar] [CrossRef]
  51. Mazancová, E.; Mazanec, K. Stacking Fault Energy in High Manganese Alloys. Mater. Eng. 2009, 16, 26–31. [Google Scholar]
  52. Xiong, R.; Peng, H.; Si, H.; Zhang, W.; Wen, Y. Thermodynamic calculation of stacking fault energy of the Fe-Mn-Si-C high manganese steels. Mater. Sci. Eng. A 2014, 598, 376–386. [Google Scholar] [CrossRef]
  53. Tewary, N.K.; Ghosh, S.K.; Chakrabarti, D.; Chatterjee, S. Deformation behaviour of a low carbon high Mn TWIP/TRIP steel. Mater. Sci. Technol. 2019, 35, 1483–1496. [Google Scholar] [CrossRef]
  54. De Barbieri, F.; Cerda, F.C.; Pérez-Ipiña, J.; Artigas, A.; Monsalve, A. Temperature dependence of the microstructure and mechanical properties of a twinning-induced plasticity steel. Metals 2018, 8, 262. [Google Scholar] [CrossRef] [Green Version]
  55. Koyama, M.; Sawaguchi, T.; Lee, T.; Lee, C.S.; Tsuzaki, K. Work hardening associated with ɛ-martensitic transformation, deformation twinning and dynamic strain aging in Fe-17Mn-0.6 C and Fe-17Mn-0.8 C TWIP steels. Mater. Sci. Eng. A 2011, 528, 7310–7316. [Google Scholar] [CrossRef]
  56. Yang, H.S.; Jang, J.H.; Bhadeshia, H.K.D.H.; Suh, D.W. Critical assessment: Martensite-start temperature for the γ → ε transformation. Calphad Comput. Coupling Phase Diagr. Thermochem. 2012, 36, 16–22. [Google Scholar] [CrossRef] [Green Version]
  57. Sahu, P.; Hamada, A.S.; Ghosh Chowdhury, S.; Karjalainen, L.P. Structure and microstructure evolution during martensitic transformation in wrought Fe-26Mn-0.14C austenitic steel: An effect of cooling rate. J. Appl. Crystallogr. 2007, 40, 354–361. [Google Scholar] [CrossRef]
  58. Schumann, H. Martensitische umwandlungen in austenitischen mangan-kohlenstoff-stählen. Neue Hütte 1972, 17, 605–609. [Google Scholar]
  59. Chen, L.; Kim, H.-S.; Kim, S.-K. Localized Deformation due to Portevin–LeChatelier Effect in 18Mn–0.6C TWIP Austenitic Steel. ISIJ Int. 2007, 47, 1804–1812. [Google Scholar] [CrossRef] [Green Version]
  60. Yang, E.E. The Effect of Carbon Content on the Mechanical Properties and Microstructural Evolution of Fe-22Mn-C TWIP/TRIP Steels. Master’s Thesis, McMaster University, Hamilton, ON, Canada, 2010. [Google Scholar]
  61. Chun, Y.S.; Kim, J.S.; Park, K.T.; Lee, Y.K.; Lee, C.S. Role of ε martensite in tensile properties and hydrogen degradation of high-Mn steels. Mater. Sci. Eng. A 2012, 533, 87–95. [Google Scholar] [CrossRef]
  62. McGuire, M.F. Stainless Steels for Design Engineers; ASM International: Almere, The Netherlands, 2008; ISBN 9780871707178. [Google Scholar]
  63. Ghasri-Khouzani, M.; McDermid, J.R. Effect of carbon content on the mechanical properties and microstructural evolution of Fe-22Mn-C steels. Mater. Sci. Eng. A 2015, 621, 118–127. [Google Scholar] [CrossRef]
  64. Dastur, Y.N.; Leslie, W.C. Mechanism of Work Hardening in Hadfield Manganese Steel. Metall. Trans. A 1981, 12, 749–759. [Google Scholar] [CrossRef]
  65. Mills, W.J. Fracture toughness of type 304 and 316 stainless steels and their welds. Int. Mater. Rev. 1997, 42, 45–82. [Google Scholar] [CrossRef]
  66. Bracke, L.; Mertens, G.; Penning, J.; De Cooman, B.C.; Liebeherr, M.; Akdut, N. Influence of phase transformations on the mechanical properties of high-strength austenitic Fe-Mn-Cr steel. Metall. Mater. Trans. A Phys. Metall. Mater. Sci. 2006, 37, 307–317. [Google Scholar] [CrossRef]
  67. Li, S.H.; Dan, W.J.; Zhang, W.G.; Lin, Z.Q. A model for strain-induced martensitic transformation of TRIP steel with pre-strain. Comput. Mater. Sci. 2007, 40, 292–299. [Google Scholar] [CrossRef]
Figure 1. Initial microstructural characterization. Series of optical micrographs taken in different stages from the casting until finishing thermo-mechanical processing. Upper row: As cast. Middle row: As forged. Lower row: Hot rolled and quenched. (a,c,e): Steel B. (b,d,f) Steel C. Etched with 2% nital.
Metals 11 00024 g001
Figure 2. Initial microstructural characterization. Metallographic analysis. Steel C. Magnification of Figure 1f. Etched with 2% nital.
Metals 11 00024 g002
Figure 3. Initial microstructural characterization. Steel C, as cast. Thermal induced ε-martensite (εt). (a,b) Etched with 2% nital. (c,d) Etched with Vilella’s reagent.
Metals 11 00024 g003
Figure 4. Uniaxial tensile tests. (a) True stress-strain curves. (b) Magnification at low deformation values to show differences in slopes and yield stress. The beginning of serrated flow on each steel is also detailed.
Metals 11 00024 g004
Figure 5. Normalized strain-hardening rate curve as a function of true plastic strain.
Metals 11 00024 g005
Figure 6. Charpy impact tests. (a) General view of the tested specimens. (b) Macroscopic aspects of the fracture surfaces.
Metals 11 00024 g006
Figure 7. Metallographic analysis on tensile specimens. Upper row: Fracture profiles. Middle row: Magnification of fracture profiles. Lower row: Details of microstructures next to the fracture profiles. (a,c,e) Steel B. (b,d,f) Steel C. Etched with 2% nital. The tensile axis is in the horizontal direction.
Metals 11 00024 g007aMetals 11 00024 g007b
Figure 8. Secondary electron (SE) images obtained by SEM observations at 1000×. Upper row: tensile specimens. Lower row: Charpy specimens. (a,c) Steel B. (b,d) Steel C.
Metals 11 00024 g008aMetals 11 00024 g008b
Figure 9. X-ray diffractograms. (a) Steel B. (b) Steel C.
Metals 11 00024 g009
Figure 10. Calculated SFE values and comparison with those obtained in other investigations. See references in the figure.
Metals 11 00024 g010
Figure 11. Bar diagram representing the mean values of mechanical properties obtained in the investigated steels. Standard deviation is indicated in each bar with red lines.
Metals 11 00024 g011
Table 1. Chemical composition of the investigated steels (%wt).
SteelsCMnSiCrPSFe
Steel B0.5420.690.190.130.0210.001Bal.
Steel C0.2821.180.200.140.0220.001Bal.
Table 2. Stacking fault energy (SFE) values obtained in the investigated steels at 20 °C.
SteelsSFE
(mJ/m2)
Steel B21.2
Steel C12.5
Table 3. Average grain sizes determined using the comparison method according to ASTM E112-13 [48].
Grain SizeSteel BSteel C
G2–34–5
d ¯ (μm)179.6–127.089.8–63.5
Table 4. Mechanical properties (standard deviation in parenthesis).
SteelsHardnessσYSσUTSσYS/σUTSεR (L0 = 50 mm)(σUTS - σYS)t/εpt-UTSAbsorbed Energy
(HRB)(MPa)(MPa)(%)(MPa)(J)
Steel B90.3 (1.2)356 (20)986 (16)0.36 (0.01)61.1 (2.8)2642 (32)255 (12)
Steel C90.8 (2.0)156 (4)877 (8)0.18 (0.00)35.4 (1.7)3480 (78)196 (4)
Table 5. Microhardness measurements (standard deviation in parentheses).
SteelsMicrohardness
(HV0.2)
Condition
Thermo-Mechanical Processed SamplesTensile SpecimensCharpy Specimens
Steel B282 (16)733 (51)573 (61)
Steel C298 (12)690 (52)532 (49)
Table 6. Reliability parameters and phase quantification obtained from Rietveld analysis.
SteelsConditionGoFVolume Fraction
Steel BThermo-mechanical processed1.44γFCC
Tensile1.27γFCC
Steel CThermo-mechanical processed1.860.55 γFCC/0.45 εHCP
Tensile1.300.31 γFCC/0.69 εHCP
Publisher’s Note: MDPI stays neutral with regard to jurisdictional claims in published maps and institutional affiliations.

