Article

Study on Enhancing the Thermoelectric Properties of Ti2CrSn Alloys

1
School of Materials Science and Engineering, Hebei University of Technology, Tianjin 300130, China
2
Beijing National Laboratory for Condensed Matter Physics, Institute of Physics, Chinese Academy of Sciences, Beijing 100190, China
3
School of Physical Sciences, University of Chinese Academy of Sciences, Beijing 100190, China
4
Technical Institute of Physics and Chemistry, CAS, Beijing 100190, China
*
Authors to whom correspondence should be addressed.
Metals 2021, 11(10), 1503; https://doi.org/10.3390/met11101503
Submission received: 4 September 2021 / Revised: 19 September 2021 / Accepted: 20 September 2021 / Published: 23 September 2021
(This article belongs to the Special Issue Intelligent Materials and Structures)

Abstract

:
Based on the Hg2CuTi structure, the full-Heusler alloy Ti2CrSn, with a ground state band gap of semiconductor, is a thermoelectric material with potential applications. Through preparing Ti2CrSn1−xAlx (x = 0, 0.05, 0.1, 0.15, 0.2) series bulk materials via arc melting, the effects of the electrical and thermal transport properties of Ti2CrSn series alloys were investigated, and different Al doping on the phase structure, the microscopic morphology, and the thermoelectric properties of Ti2CrSn were examined. The results show that the materials all exhibit characteristics of p-type semiconductors at the temperature range of 323 to 923 K. Al elemental doping can significantly increase the Seebeck coefficient and reduce the thermal conductivity of the materials. Among them, the sample Ti2CrSn0.8Al0.2 obtained a maximum value of 5.03 × 10⁻³ for the thermoelectric optimal ZT value at 723 K, which is 3.6 times higher than that of Ti2CrSn.

1. Introduction

Thermoelectric materials are a type of semiconductor-functional material that can induce the direct conversion of thermal energy to electrical energy [1]. Thermoelectric power generation and thermoelectric cooling devices made of thermoelectric materials have the advantages of simple structure, small size, no noise, easy maintenance, and environmental friendliness, and have broad application prospects in industries such as medicine, electronic products, and aerospace [2]. In general, the thermoelectric properties of a material can be measured by the dimensionless thermoelectric figure ZT:
Z T = α 2 σ T / ( k L + k e )
where α , σ , T , κ L , and κ e represent the Seebeck coefficient, electrical conductivity, absolute temperature, lattice thermal conductivity, and carrier thermal conductivity, respectively, while α2·σ is the power factor [3]. From Equation (1), it can be seen that higher ZT values can be obtained by increasing the Seebeck coefficient and electrical conductivity of the material, or by decreasing the thermal conductivity of the material [4]. In general, metallic materials have low Seebeck coefficients, and are only suitable for thermoelectric measurements. However, certain semiconductor materials—particularly alloyed semiconductor materials—have high Seebeck coefficients, and are the preferred materials for thermoelectric transducers.
Since the original discovery of the thermoelectric effect in 1821, researchers have developed a large number of thermoelectric materials [5,6,7,8,9]. These could include traditional thermoelectric alloy material systems such as Bi2Te3, PbTe, and SiGe, new thermoelectric material systems such as Heusler and skutterudite, as well as low-dimensional thermoelectric materials [10,11]. All of these materials can experience improved thermoelectric properties by increasing the power factor or decreasing the lattice thermal conductivity. Among them, Heusler-structured thermoelectric materials have attracted a lot of attention from researchers in the field of thermoelectrics, because of their excellent electrical and mechanical properties, good thermal stability, etc. [12].
Full-Heusler alloys are ternary intermetallic compounds with a face-centred cubic structure, with the chemical formula X2YZ, in which X and Y are usually transition metal elements and Z is a main group element [13]. The single-cell structure can be represented as consisting of four interlocking face-centred cubic sublattices with Wyckoff positions A (0, 0, 0), B (1/4, 1/4, 1/4), C (1/2, 1/2, 1/2), and D (3/4, 3/4, 3/4) within a cell. The chemical formula of a half-Heusler alloy is XYZ; its structure can be discerned to be a full-Heusler alloy X2YZ with the X-atom at the B-position (Hg2CuTi type) or C-position (Cu2MnAl type) removed [14,15,16,17,18]. The thermoelectric properties of half-Heusler alloys have been well researched due to their semiconducting nature, while full-Heusler alloys are also attracting attention in thermoelectric applications, because of their adjustable elements and rich structure. M. Mikami et al.’s [19] research showed a significant improvement in performance when W was used to replace some of the vanadium in the full-Heusler alloy Fe2VAl, with a thermoelectric figure of merit of 0.2 at 400 K for Fe2V0.9W0.1Al at a W substitution of 0.1; this is twice that of the Si-substituted Fe2VAl alloy at the same temperature, and much greater than the ZT value of the half-Heusler alloy ANiSn (A = Ti, Zr, Hf) (0.006, 0.01, and 0.005, respectively) at room temperature [20].
In terms of theoretical calculations, Li et al. [21] predicted maximum power factors of approximately 48.77 (1014 μWcm−1K−2s−1) and 47.11 (1014 μWcm−1K−2s−1) for the full-Heusler alloys Sc2FeSi and Sc2FeGe, respectively, at room temperature—properties of a level comparable to the equivalent properties in conventional Bi2Te3. Meanwhile, Ma et al. [22] calculated the electronic structure and magnetic and thermoelectric properties of the Ti-based full-Heusler alloy Ti0.75HfMo0.25CrGe, which has a valence electron number Zt of 18 and a total magnetic moment Mt that satisfies the rule Mt = Zt 18 (for the thermoelectric properties of Heusler alloys, compounds with an off-nuclear valence electron number Zt = 18 of the constituent elements usually have superior thermoelectric properties [12]). The alloy Ti0.75HfMo0.25CrGe reached a ZT value of approximately 260 × 10−3 at 723 K. The above-detailed studies indicate the scope of interest that research into full-Heusler-type materials has within the field of thermoelectrics. Furthermore, in 2016, Li et al. [23] predicted, based on first principles and Boltzmann transport theory, that the full-Heusler alloy Ti2CrSn with an extranuclear valence electron number of 18 would have a significant band gap and good thermoelectric properties near the Fermi energy level in terms of electron density. In 2017, Li et al. [24] employed another computational method to demonstrate the stability of the band gap in Ti2CrSn, which was found to be 0.23–0.25 eV. The calculated value of the thermoelectric power factor was near to that of Bi2Te3, marking its potential application values in thermoelectrics. Building on this theoretical result, a series of Ti2CrSn1−xAlx (x = 0, 0.05, 0.1, 0.15, 0.2) bulk materials were prepared for the work presented here, and the electrical and thermal transport properties of said materials were investigated; they were found to exhibit a maximum ZT value of 5.03 × 10⁻³ at 723 K when x = 0.2, which is promising for future applications.

2. Experiments

The raw materials required for the experiments were Ti, Cr, Sn, and Al with a purity of 4N. The actual amount of Sn added was increased by 10% (i.e., Ti:Cr:Sn = 2:1:1.1) in consideration of the volatilization of Sn. The melting was carried out in a vacuum electric arc furnace (high-purity argon gas protection, 3 melting cycles) to obtain the bulk alloy samples. The samples were then annealed at 800 Celsius for 48 h. The alloy’s structure was characterized using a Bruker D8 Discover X-ray diffractometer, and the morphology of the sample was determined using a field emission scanning electron microscope. Sample strips measuring 2.5 × 2.5 × 10 mm3 were cut for the measurement of the Seebeck coefficient and conductivity at different temperatures (in this instance, helium was used as a protective gas to prevent the samples from oxidizing at high temperatures). The sample for measuring the carrier mobility was a 10 × 10 × 1 mm3 tile, and the sample disc for the determination of the thermal diffusion coefficient D was 6 mm in diameter and 2.5 mm in thickness. Once again, argon was the preventative measure against oxidation of the sample during the test. The specific heat capacity Cp of the sample was obtained by taking Dulong–Petit limits, the density ρ was measured using the Archimedes’ drainage method, and the thermal conductivity was calculated as follows:
k = ρ × C p × D

3. Results and Discussion

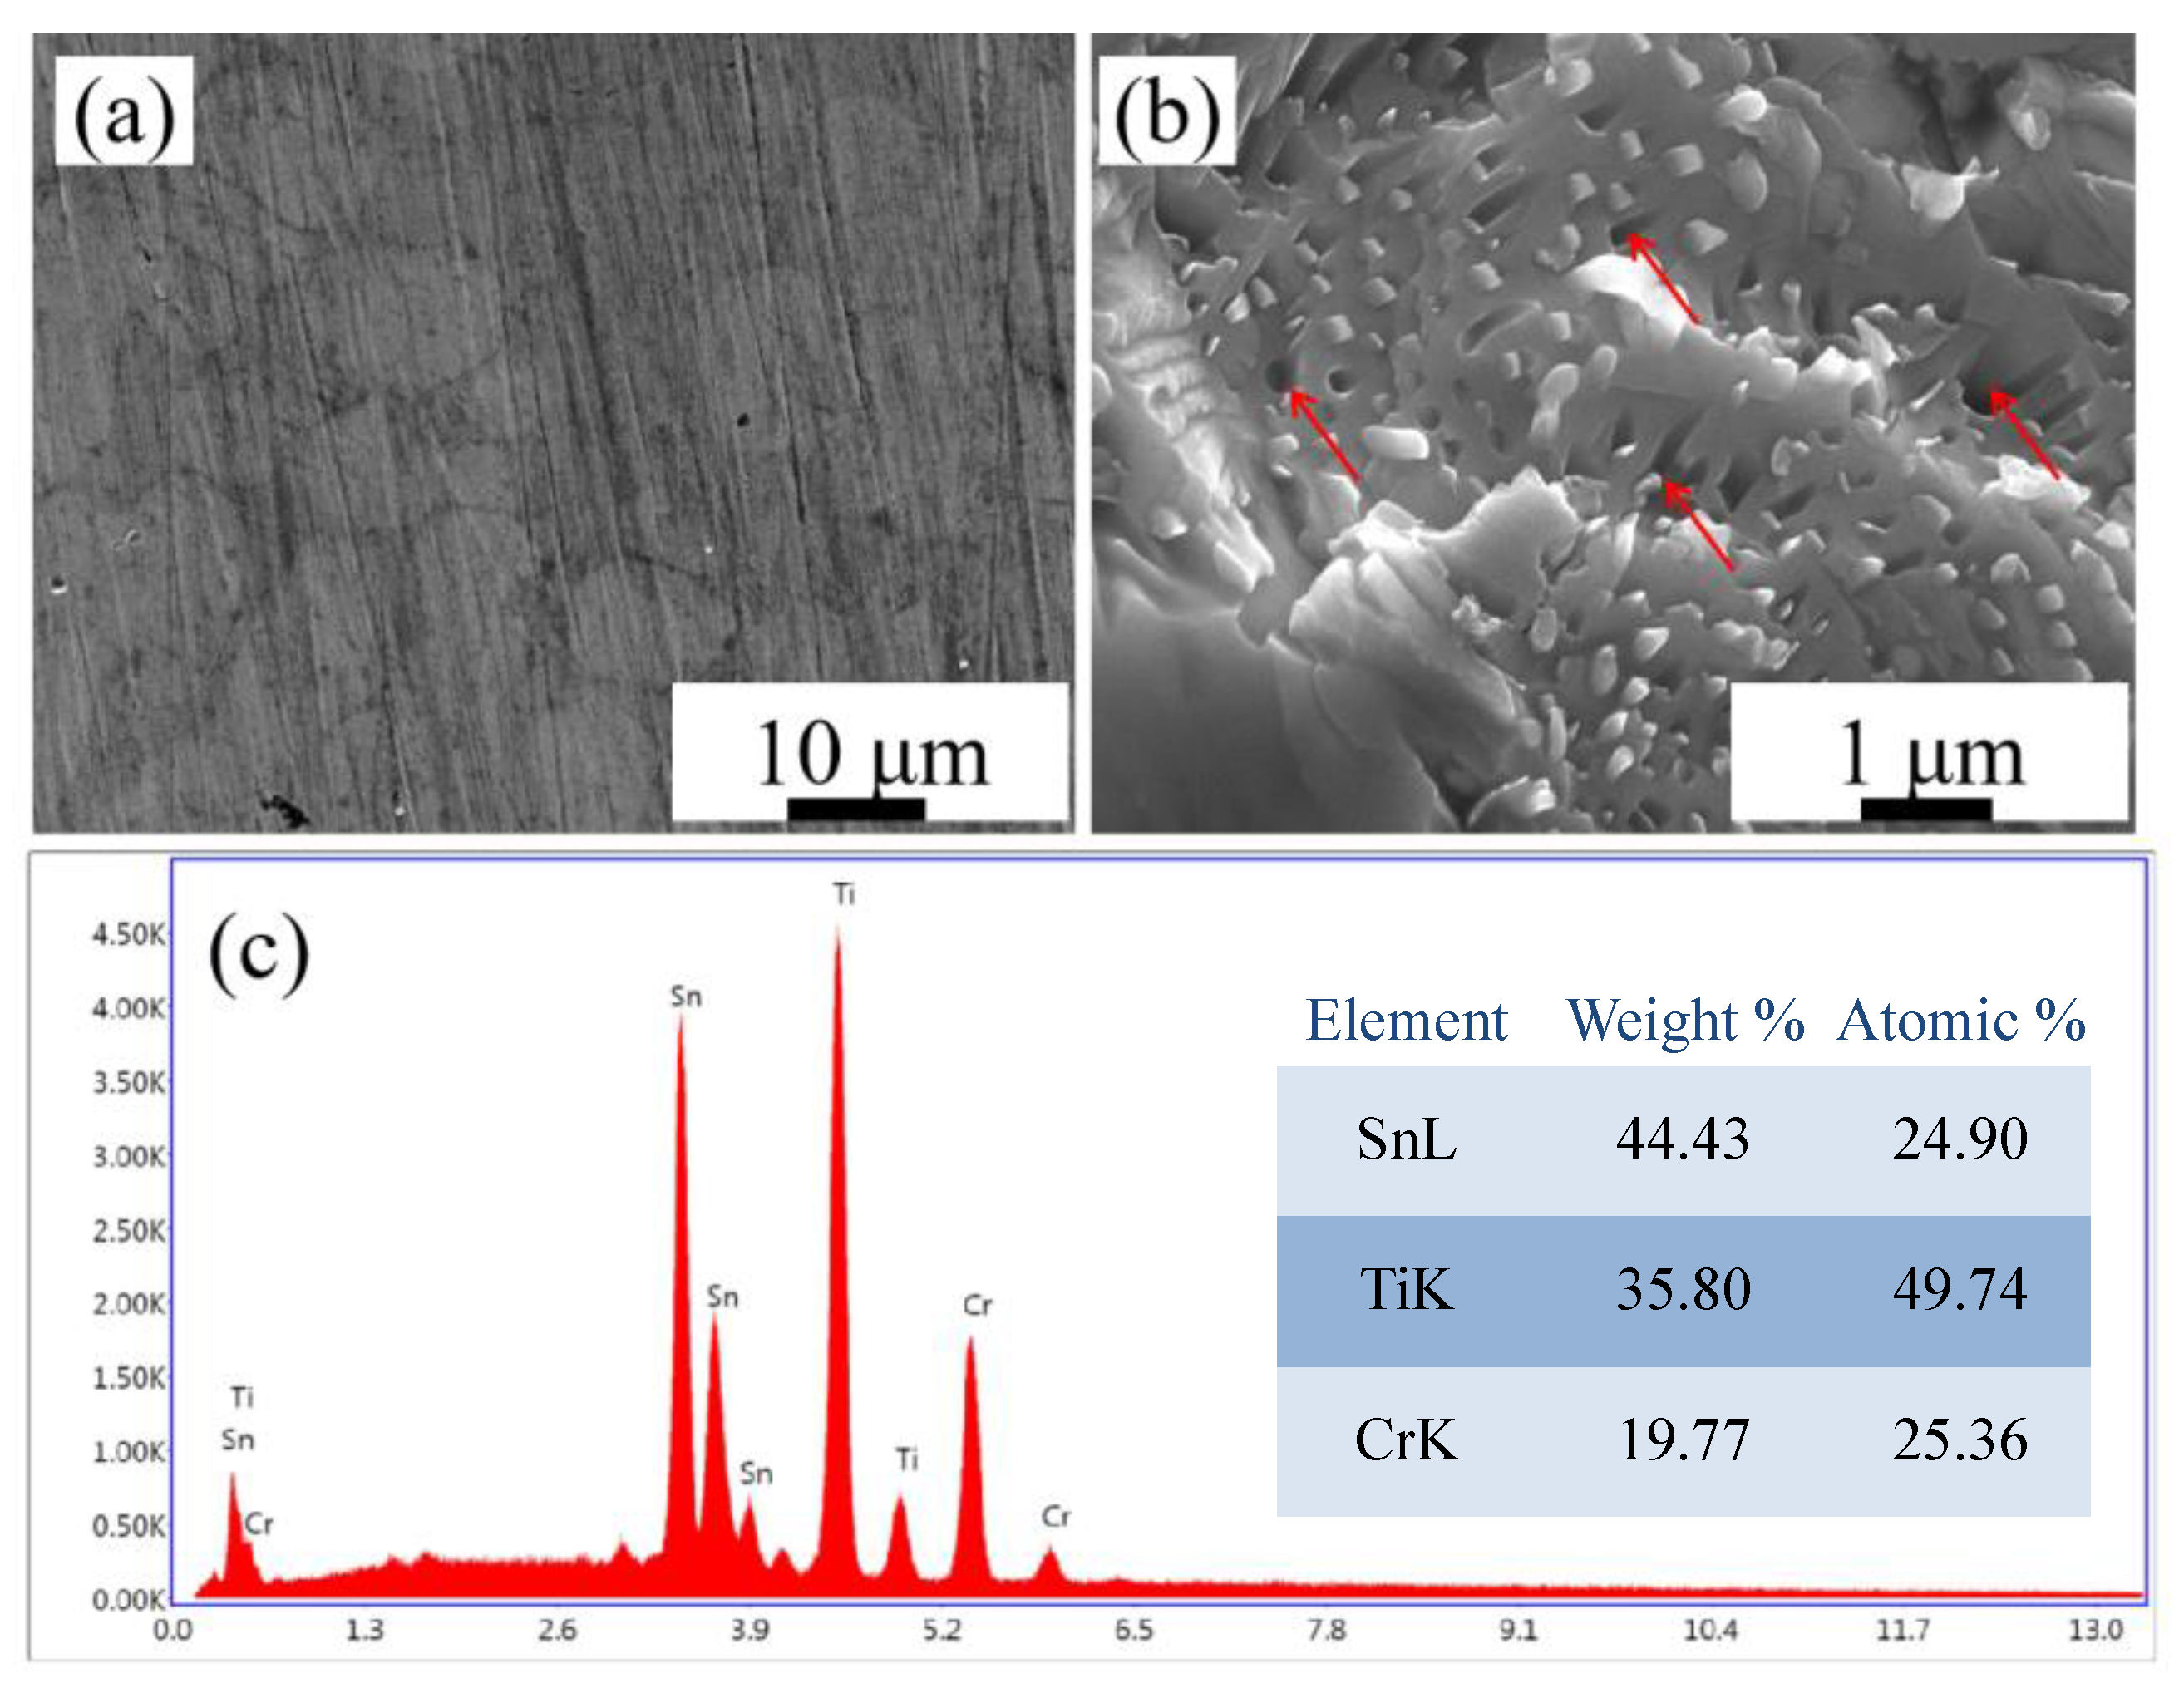
3.1. Structural Analysis

Figure 1 shows the XRD analysis spectrum of the Ti2CrSn1−xAlx (x = 0, 0.05, 0.1, 0.15, 0.2) series of alloys. As can be seen in Figure 1, after melting and annealing, the observed structure of Ti2CrSn1−xAlx is in general agreement with the Ti2CrSn diffraction peaks of the full-Heusler structure obtained using CrystalMaker calculations. CrystalMaker simulation calculation is based on the cubic crystal system, Fm-3m space group, and lattice constant of 6.56 Å. The material model is created and the powder diffraction peak of the Ti2CrSn sample is obtained. This indicates that full-Heusler structure alloy materials were indeed obtained. As the Al content increases, the diffraction peaks on the crystalline surface of the samples gradually shift towards a higher angle due to the smaller atomic radius of Al (1.43 Å) compared to that of Sn (1.58 Å). In the Al doping range of 0–0.2, as the amount of Al substitution gradually increases, the lattice constant of the material decreases, resulting in a rightward shift of the diffraction peaks. However, the structure does not change, and remains a cubic crystal system with the Fm-3m space group. The peak of singlet Sn, observed in the XRD diffraction peaks of the prepared samples (marked with ‘*’), is due to the material’s low melting point, which causes its precipitation during the melting phase. Yin M and Nash P [25] also precipitated monomer Ru with a low melting point in the experiments synthesizing the full-Heusler alloy Ru2TiSn.
Figure 2 presents an SEM photograph of the Ti2CrSn sample. The Ti2CrSn sample has an overall homogeneous structure with clearly visible grain boundaries (Figure 2a). The presence of submicron pores in the Ti2CrSn material at a scale of around 200–300 nm can be discerned, instances of which are indicated by arrows (Figure 2b). The presence of grain boundaries and micropores enhances phonon scattering, resulting in a significant reduction in lattice thermal conductivity [26]. Figure 2c shows the EDS energy-dispersive spectra, confirming the atomic contents of Ti, Cr, and Sn in the alloy as being 49.74%, 25.36%, and 24.90%, respectively. The ratios are close to the intended positive distribution ratio of 2.0:1.0:1.0.

3.2. Analysis of Electrical Transport Properties

A graph of the Seebeck coefficients of the samples in response to temperature is displayed in Figure 3. As the graph illustrates, the Seebeck coefficients of the samples are all positive in the tested temperature range, with p-type semiconductor conductivity characteristics. On aggregate, this indicates that the material’s thermoelectric transport is mainly dominated by holes. The Seebeck coefficient increases significantly with the increasing Al content, due to the large concentration of ionised impurities in the material, and their contribution to the scattering factor as the extent of doping increases. When the scattering caused by ionised impurities is enhanced, the carrier (electron or hole) mobility decreases, but the value of the Seebeck coefficient increases dramatically. Coefficient α increases with temperature for all samples in the temperature range 373 to 873 K. When the temperature reaches the intrinsic excitation temperature (873 K), the Seebeck coefficient of Ti2CrSn0.8Al0.2 reaches a maximum value of 9.18 μV/K, which is approximately 3 μV/K higher than that of Fe2TiSn [27] in the medium-to-high-temperature region (at 873 K, ~3 μV/K), and close to that of Fe2VAl [19] (15 μV/K at 750 K). This suggests that Ti2CrSn0.8Al0.2 has some potential application in the medium-to-high-temperature region. This variant of the alloy also exhibits a high Seebeck coefficient due to the increased concentration of ionised impurities after Al doping, leading to enhanced scattering which, in turn, results in higher Seebeck coefficients. In addition, as Figure 3 shows, upon reaching the intrinsic excitation temperature, the value of α demonstrates saturation—or even a decreasing trend—with increasing temperature. This is because the concentration of minority carriers inside the sample increases after intrinsic excitation, increasing the chance of it compounding with the majority carriers. The material then becomes a semiconductor with predominantly intrinsic carrier conductivity, thus leading to a sharp decrease in α.
Figure 4a shows the curve of the conductivities of the samples with respect to temperature, while Figure 4b shows the carrier mobility and carrier concentration with respect to Al doping at a temperature of 296 K. From Figure 4a, we can conclude that the conductivity of the doped sample decreases as temperature rises, exhibiting the behaviour of a heavily doped semiconductor. With Al doping, the conductivity showed a parabolic trend (rising then falling) with increasing doped content (there was a doping threshold of 5%), indicating that the sample started to gradually metallise as the doping threshold was approached, and when the doping amount continued to increase, the metallicity diminished (the conductivity decreased with increasing temperature, showing metallic characteristics, before increasing alongside the temperature, reverting to semiconductor-like features). The conductivity of the Ti2CrSn0.9Al0.1 alloy exhibits a maximum value of 6.82 mΩ−1cm−1 at 323 K, which is higher than the values of 1.60 mΩ−1cm−1 reported in the literature for the full-Heusler alloy Fe2VAl0.97Ge0.03 [28] and 1.00 mΩ−1cm−1 for Fe2TiSn [29]; it is even higher than the recorded conductivities of the half-Heusler alloys Hf0.25Zr0.75NiSn0.99Sb0.01, Nb0.75Ti0.25FeSb, Ti0.75Zr0.25NiSn0.98Sb0.02, and NbCoSn0.9Sb0.1 [30]. This is explained by the presence of grain boundaries and pores in the material, which increase the scattering factor of the material, resulting in Ti2CrSn1−xAlx exhibiting higher conductive capabilities overall.
Furthermore, it can be observed from Figure 4b that the carrier mobility displays a similar parabolic trend as metallicity (initially upward towards a maximum, then downward) with the increase in Al doping; it gradually increases with the level of doping while the Al content is low, but when the Al content reaches 5%, continued increase in doping causes defects in the sample to proliferate significantly. This leads to enhanced scattering and valence band convergence, and the effective mass of carriers inside the sample increases, which eventually causes the carrier mobility to decrease rapidly [31].
The power factor of the thermoelectric material can be calculated as follows:
PF = α 2 × σ
The variation in the power factor with temperature for the Ti2CrSn1−xAlx (x = 0, 0.05, 0.1, 0.15, 0.2) alloy is displayed in Figure 5. As shown, the trend of the power factor with respect to temperature is similar to that of the Seebeck coefficient (see Figure 3), indicating that the latter has an influential effect on the power factor. In particular, the sample of Ti2CrSn0.8Al0.2 exhibited the largest power factor at 20% Al doping (56.62 μWm−1K2, 873 K), which is higher than the power factor of Fe2Ti1−xVxSn in the medium-to-high-temperature region (approximately 6.88 μWm−1K2) [27], comparable to the maximum power factor of Fe2TiSn (60 μWm−1K2 at 170 K) [29], and close to that of Ru2VAl0.25Ga0.75 (~90 μWm−1K2 at 300 K). Although this value is still far from the power factor of 4500 μWm−1K2 at 300 K for Bi2Te3 [7,32], it shows a trend of gradually increasing power factor as the level of Al doping rises, indicating the expectation of further improvements in the performance of the material.

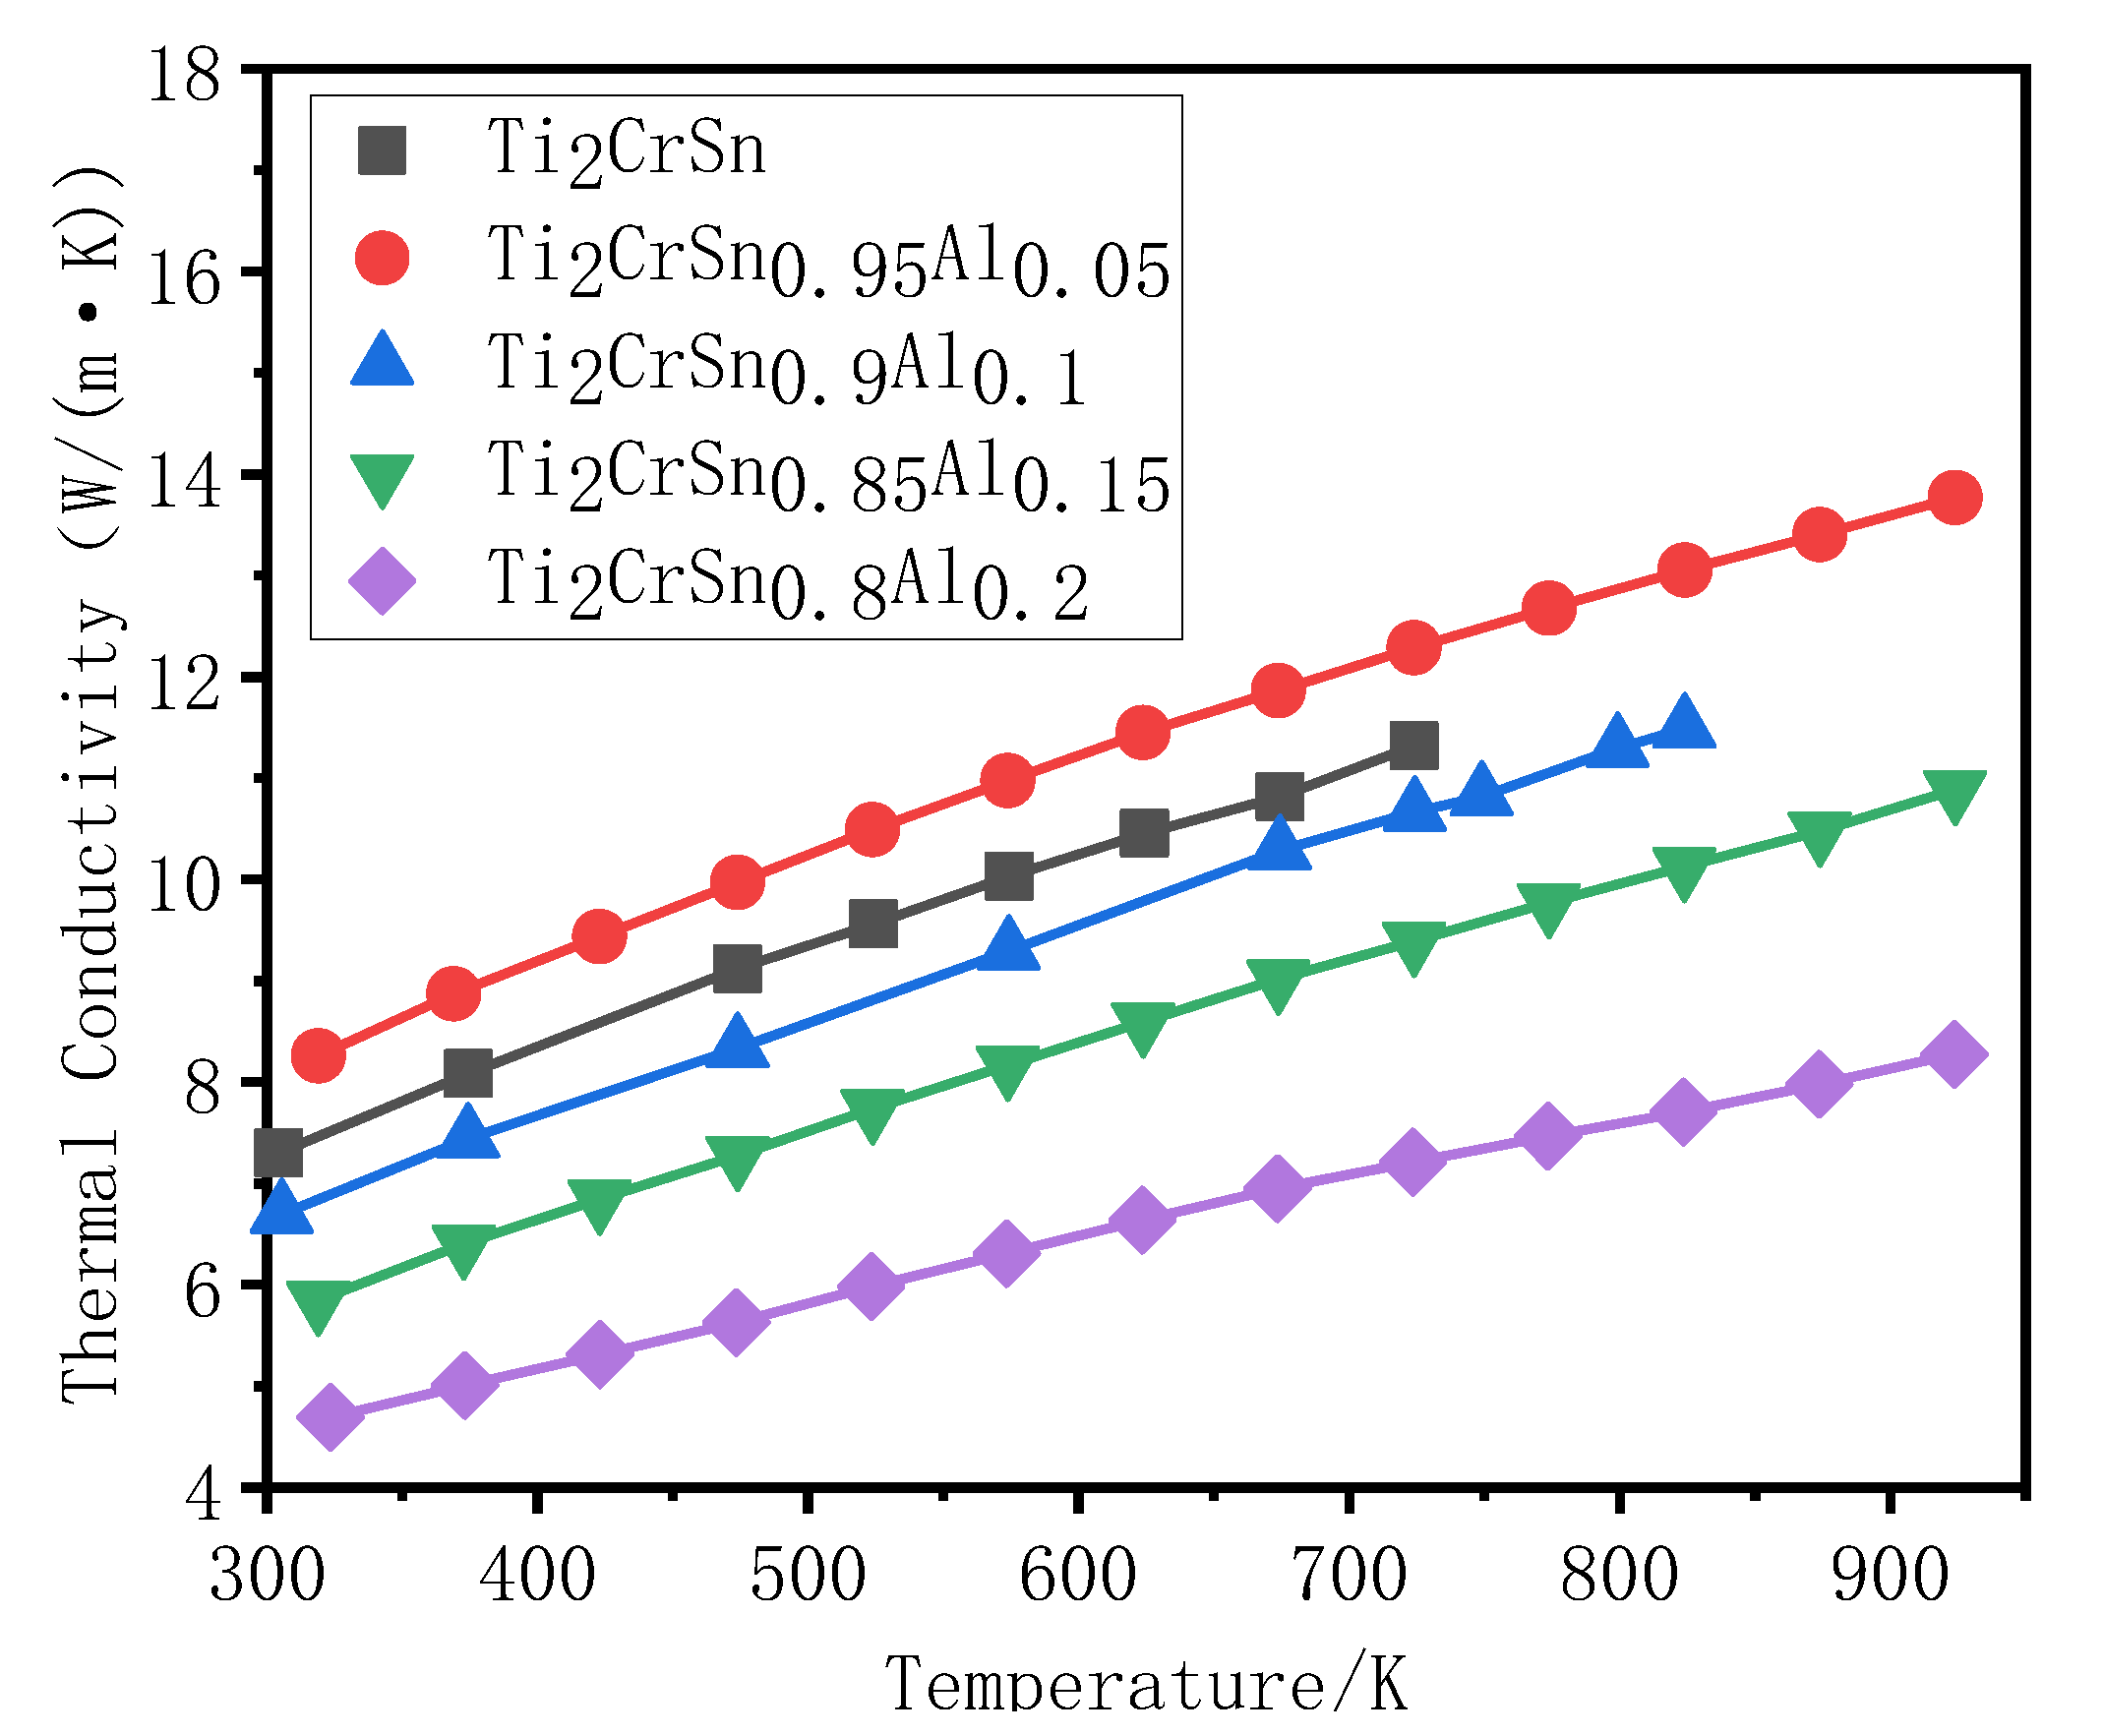
3.3. Analysis of Thermal Transport Properties

Displayed in Figure 6 are the variations in total thermal conductivity κ against temperature for different levels of Al content. The graph shows that the total thermal conductivity exhibits a gradual increase as the temperature is raised, which can be explained by this particular property of metals including the contribution of free electron and phonon thermal conductivities. For pure metals, thermal conductivity through free electron motion is the main mechanism, while for alloys, in addition to the scattering of free electrons by phonons, this effect is further contributed to by solute atoms, hence resulting in a significant reduction in thermal conductivity. Unlike phonons, the scattering effect of solute atoms decreases with increasing temperature. Thus, the thermal conductivity of an alloy increases with temperature when its effect on the thermal conductivity of solute atoms plays a dominant role over a range of temperatures [33]. Figure 6 also shows yet another parabolic trend in the alloy’s characteristics based on a single variable—in this instance, thermal conductivity as Al content increases. This is the result of the joint action of carrier and lattice thermal conductivities. When the Al content is low, as the degree of doping increases, the carrier concentration also increases; thus, the carrier thermal conductivity plays a more significant role. However, when Al doping reaches 5%, the scattering is enhanced, which leads to a slowing in the migration rate to a certain extent. Simultaneously, the introduced lattice distortion enhances phonon scattering and diminishes the lattice thermal conductivity.

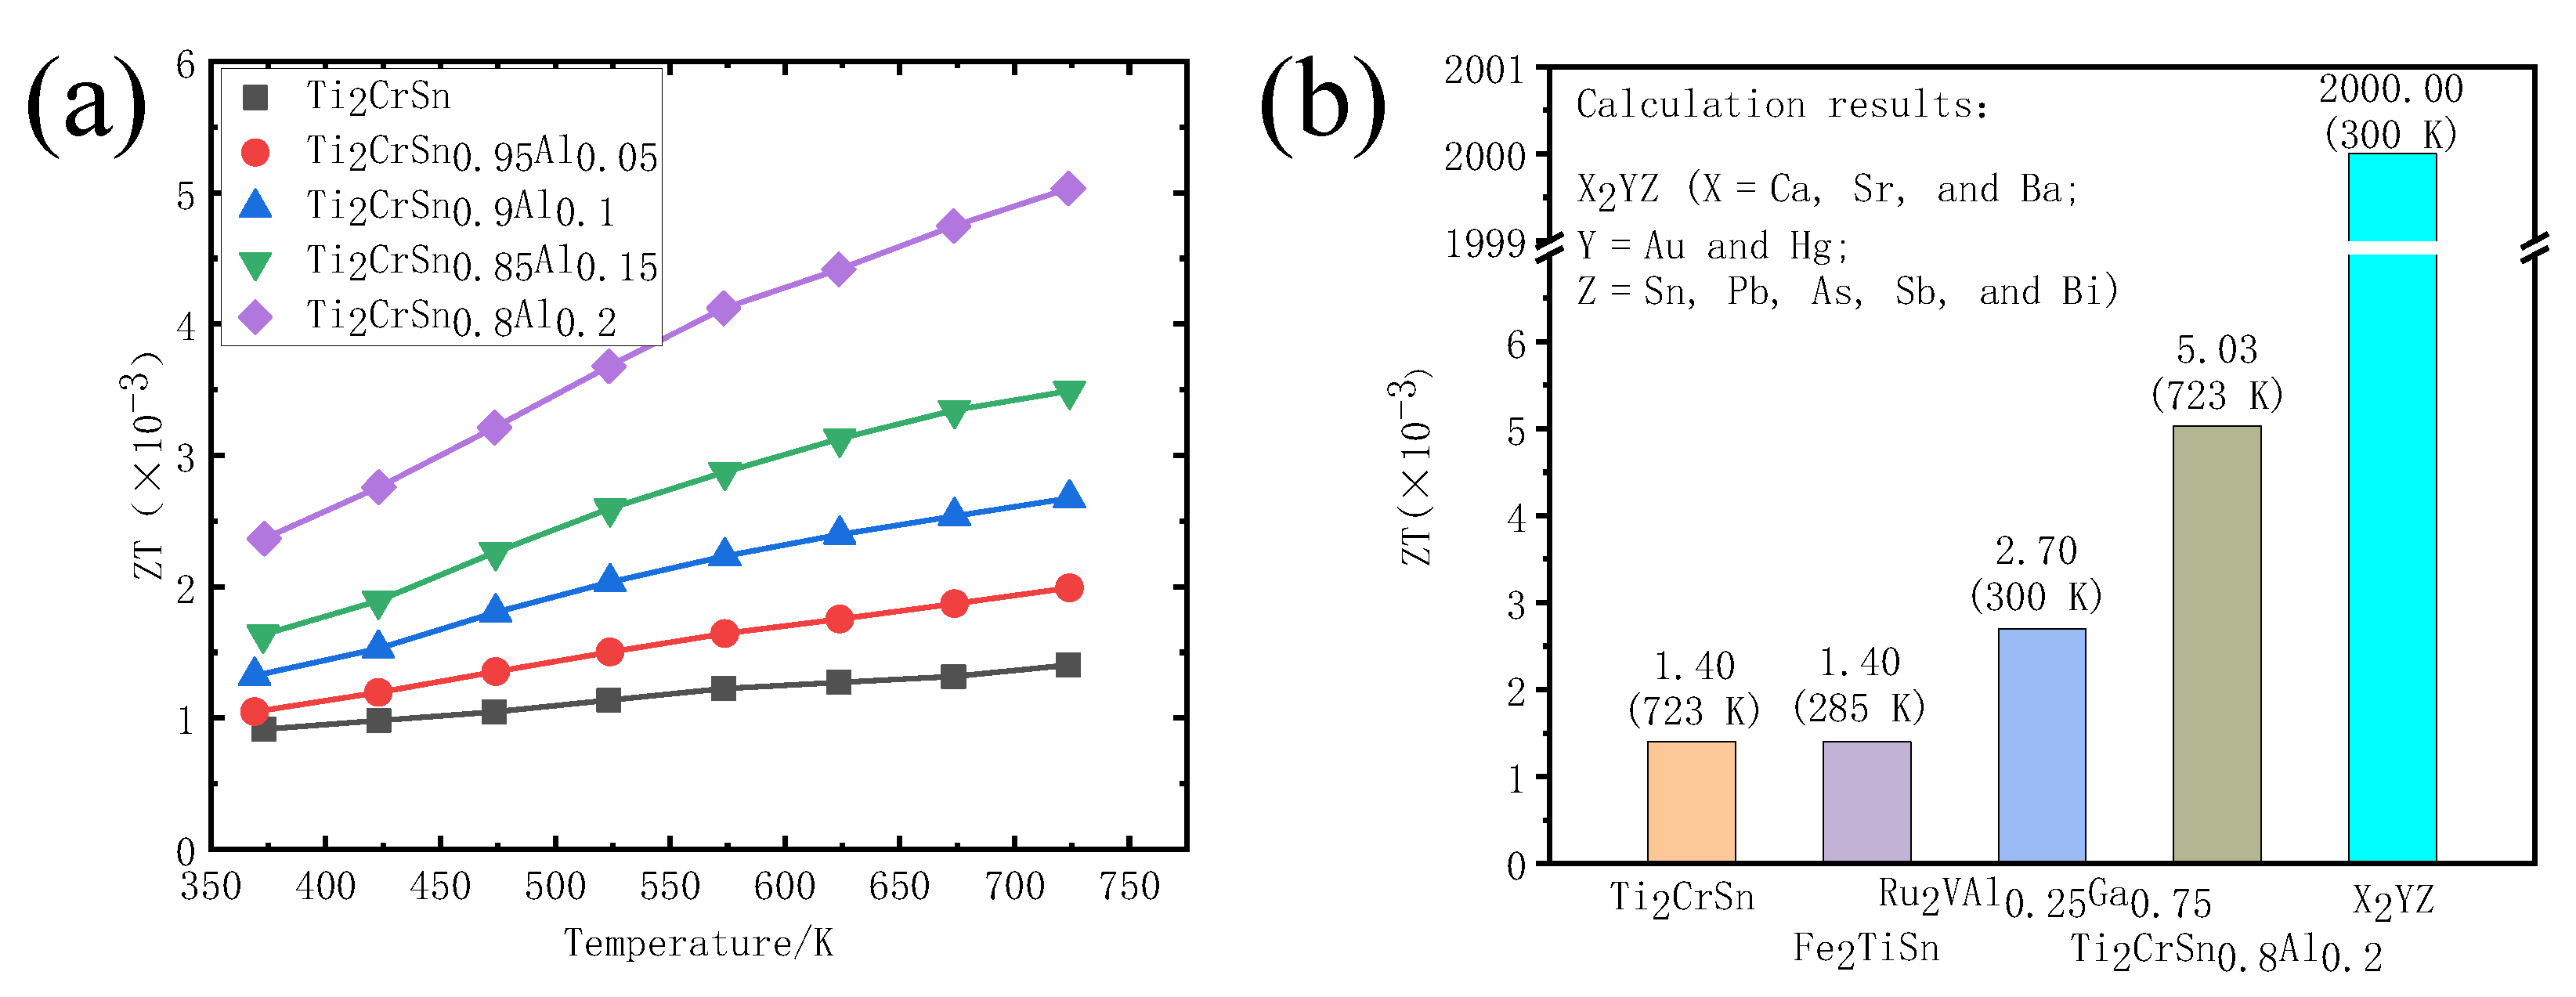
3.4. Thermoelectric Properties

The variation of ZT values of Ti2CrSn1−xAlx (x = 0, 0.05, 0.1, 0.15, 0.2) in response to temperature is plotted as per Figure 7a. As the temperature increases, the ZT values of the samples initially rise, before falling, similar to the trend displayed by the Seebeck coefficient. According to Equation (1), at 723 K, Ti2CrSn0.8Al0.2 reaches a maximum ZT value of 5.03 × 10⁻³, which is significantly greater than the maximum reached for Ti2CrSn. This is due to the effect of Al doping in reducing the thermal conductivity of the material while enhancing the Seebeck coefficient, indicating that a degree of doping can significantly improve the thermoelectric properties of Ti2CrSn. A comparison between the thermoelectric optimal ZTs of the Ti2CrSn1−xAlx (x = 0, 0.05, 0.1, 0.15, 0.2) alloy and other full-Heusler thermoelectric materials [29,34,35] is charted in Figure 7b. From this comparison, Ti2CrSn0.8Al0.2 reaches its aforementioned maximum ZT value of 5.03 × 10⁻³ at 723 K; it has a higher maximum thermoelectric figure of merit than Fe2TiSn ground in argon and Ru2VAl0.25Ga0.75 [34], as prepared in a previously reported work [29]. The thermoelectric figure of merit of Ti2CrSn was seen to be increased by a factor of 3.6 after Al doping of 20%. Although this property in Ti2CrSn0.8Al0.2 is much smaller than for BiSbTe [7,32], and is also significantly different from full-Heusler semiconductors X2YZ (X = Ca, Sr, and Ba; Y = Au and Hg; Z = As, Sb, Bi, Sn and Pb) (which are investigated using first-principles electronic structure methods and Boltzmann transport theory). The minimum ZT of X2YZ should be more than 2.0 at 300 K. This shows that there is a certain gap between experiment and theory. Allowance for macroscopic sample preparation is provided by the simplicity of the method of synthesis, as the material is synthesised by the melting method. Additionally, because Ti2CrSn1−xAlx exhibits gradually increasing thermoelectric merit values with further Al doping, future research can investigate the thermoelectric properties of this material system with further increases in Al doping.

4. Conclusions

In this study, a new material system was investigated, and the results of calculations from the literature were compared with experimental results, providing new ideas for the optimization of thermoelectric materials. To that end, a series of Ti2CrSn1−xAlx (x = 0, 0.05, 0.1, 0.15, 0.2) alloys were prepared via arc melting, and the effect of Al doping on their thermoelectric properties was investigated. The results show that they exhibited p-type conductivity characteristics, where the incremental addition of Al content resulted in increases in the Seebeck coefficient and initial increases in conductivity, before it reached a maximum value and then decreased. Among the synthesised alloys, Ti2CrSn0.8Al0.2 achieved a maximum power factor of 56.62 μWm−1K−2 at 873 K. The thermoelectric optimal ZT reached a maximum value of 5.03 × 10⁻³ at 723 K, which is 3.6 times higher than that of undoped Ti2CrSn. The alloys were shown to have potential applications in the medium-to-high-temperature region. This study demonstrates the importance of Al doping in optimising ZT values, and subsequent experiments can be carried out to explore further increasing Al doping to improve the thermoelectric optimum. Furthermore, this goal can be achieved through the refinement of the synthesis process, with such techniques as SPS sintering, in order to produce fine crystals and further reduce the thermal conductivity. The present work experimentally verifies the theoretical prediction of excellent thermoelectric properties of the full-Heusler alloy Ti2CrSn—a new thermoelectric material system.

Author Contributions

Conceptualization, G.Y. and Z.L.; methodology, Y.R., S.S., J.G. and G.Y.; writing—original draft, G.Y. and L.Y.; supervision and funding acquisition, Z.L. and J.S. All authors have read and agreed to the published version of the manuscript.

Funding

This research was funded by the National Natural Science Foundation of China (No. 51771067, 51925605).

Institutional Review Board Statement

Not applicable.

Informed Consent Statement

Not applicable.

Data Availability Statement

Not applicable.

Conflicts of Interest

The authors declare no conflict of interest.

References

  1. Zhang, X.; Zhao, L.D. Thermoelectric materials: Energy conversion between heat and electricity. J. Mater. 2015, 1, 92–105. [Google Scholar] [CrossRef] [Green Version]
  2. Shi, X.L.; Zou, J.; Chen, Z.G. Advanced Thermoelectric Design: From Materials and Structures to Devices. Chem. Rev. 2020, 120, 7399–7515. [Google Scholar] [CrossRef] [PubMed]
  3. Dehkordi, A.M.; Zebarjadi, M.; He, J.; Tritt, T.M. Thermoelectric power factor: Enhancement mechanisms and strategies for higher performance thermoelectric materials. Mater. Sci. Eng. R Rep. 2015, 97, 1–22. [Google Scholar] [CrossRef] [Green Version]
  4. Makongo, J.P.A.; Misra, D.K.; Zhou, X.; Pant, A.; Shabetai, M.R.; Su, X.; Uher, C.; Stokes, K.L.; Poudeu, P.F. Simultaneous Large Enhancements in Thermopower and Electrical Conductivity of Bulk Nanostructured Half-Heusler Alloys. J. Am. Chem. Soc. 2011, 133, 18843–18852. [Google Scholar] [CrossRef]
  5. Venkatasubramanian, R.; Siivola, E.; Colpitts, T.; O’quinn, B. Thin-film thermoelectric devices with high room-temperature figures of merit. Nature 2001, 413, 597–602. [Google Scholar] [CrossRef]
  6. Minnich, A.J.; Dresselhaus, M.S.; Ren, Z.F.; Chen, G. Bulk nanostructured thermoelectric materials: Current research and future prospects. Energy Environ. Sci. 2009, 2, 466–479. [Google Scholar] [CrossRef]
  7. Poudel, B.; Hao, Q.; Ma, Y.; Lan, Y.; Minnich, A.; Yu, B.; Yan, X.; Wang, D.; Muto, A.; Vashaee, D.; et al. High-Thermoelectric Performance of Nanostructured Bismuth Antimony Telluride Bulk Alloys. Science 2008, 320, 634–638. [Google Scholar] [CrossRef] [PubMed] [Green Version]
  8. Moshwan, R.; Lei, Y.; Jin, Z.; Chen, Z.G. Eco-Friendly SnTe Thermoelectric Materials: Progress and Future Challenges. Adv. Funct. Mater. 2017, 27, 1703278.1–1703278.18. [Google Scholar] [CrossRef]
  9. Qiu, P.F.; Shi, X.; Chen, L.D. Cu-based thermoelectric materials. Energy Storage Mater. 2016, 3, 85–97. [Google Scholar] [CrossRef]
  10. Chen, L.D.; Huang, X.Y.; Zhou, M.; Shi, X.; Zhang, W.B. The high temperature thermoelectric performances of Zr0.5Hf0.5Ni0.8Pd0.2Sn0.99Sb0.01 alloy with nanophase inclusions. J. Appl. Phys. 2006, 99, 064305. [Google Scholar] [CrossRef]
  11. Sales, B.C.; Mandrus, D.; Williams, R.K. Filled Skutterudite Antimonides: A New Class of Thermoelectric Materials. Science 1996, 272, 1325–1328. [Google Scholar] [CrossRef] [PubMed]
  12. Zhang, Z.W.; Wang, X.Y.; Liu, Y.J.; Cao, F.; Zhao, L.D.; Zhang, Q. Development on thermoelectric materials. J. Chin. Ceram. Soc. 2018, 46, 288–305. [Google Scholar]
  13. Luo, H.; Xin, Y.; Liu, B.; Meng, F.; Liu, H.; Liu, E.; Wu, G. Competition of L21 and XA structural ordering in Heusler alloys X2CuAl (X = Sc, Ti, V, Cr, Mn, Fe, Co, Ni). J. Alloys Compd. 2016, 665, 180–185. [Google Scholar] [CrossRef]
  14. Li, J. First-Principles Theoretical Design of Heusler Alloy Thermoelectric Materials; Hebei University of Technology: Tianjin, China, 2017. [Google Scholar]
  15. Jiang, H.J. First-Principles Study on Electronic Structure, Magnetism and Semimetallic Properties of Half Heusler Alloy [D]; Yanbian University: Yanbian, China, 2008. [Google Scholar]
  16. Bhat, I.H.; Bhat, T.M.; Gupta, D.C. Magneto-electronic and thermoelectric properties of some Fe-based Heusler alloys. J. Phys. Chem. Solids 2018, 119, 251–257. [Google Scholar] [CrossRef]
  17. Bhat, T.M.; Nabi, M.; Gupta, D.C. Structural, elastic, thermodynamic and thermoelectric properties of Fe2TiSn Heusler alloy: High pressure study. Results Phys. 2019, 12, 15–20. [Google Scholar] [CrossRef]
  18. Li, C.; Li, J.; Mao, X.; Liu, Z.; Xu, X.; Liu, Y.; Teng, S.; Yin, F.; Congcong, L.; Xiujuan, M.; et al. Improved thermoelectric performance of p-doped half-Heusler Ti0.5Zr0.5CoSb0.5P0.5, Ti0.5Hf0.5CoSb0.5P0.5, and Zr0.5Hf0.5CoSb0.5P0.5 compounds. Mater. Res. Express 2019, 6, 126305. [Google Scholar] [CrossRef]
  19. Mikami, M.; Kinemuchi, Y.; Ozaki, K.; Terazawa, Y.; Takeuchi, T. Thermoelectric properties of tungsten-substituted Heusler Fe2VAl alloy. J. Appl. Phys. 2012, 111, 093710. [Google Scholar] [CrossRef]
  20. Huang, X.Y.; Xu, Z.; Chen, L.D. Half Heusler thermoelectric semiconductor material. Inorg. Mater. 2004, 19, 25–30. [Google Scholar]
  21. Li, J.; Yang, G.; Yang, Y.M.; Zhang, Q.; Zhang, Z.; Fang, W.; Yin, F.; Li, J. Electronic and thermoelectric properties of nonmagnetic inverse Heusler semiconductors Sc2FeSi and Sc2FeGe. J. Magn. Magn. Mater. 2017, 442, 371–376. [Google Scholar] [CrossRef]
  22. Ma, H.R.; Li, J.; Yang, G.; Yang, Y.; Mao, X.; Li, C.; Yin, F. Improved thermoelectric property of Ti0.75HfMo0.25CrGe by doping Ti2CrGe Heusler alloy with Hf and Mo: Confirmation of entropy "gene" in thermoelectric materials design. J. Appl. Phys. 2018, 124, 235104. [Google Scholar] [CrossRef]
  23. Li, J.; Li, J.; Zhang, Q.; Zhang, Z.; Yang, G.; Ma, H.; Lu, Z.; Fang, W.; Xie, H.; Liang, C.; et al. The thermoelectric properties of predicted semiconducting Ti2CrGe and Ti2CrSn: A first principles study. Comput. Mater. Sci. 2016, 125, 183–187. [Google Scholar] [CrossRef]
  24. Li, J.; Zhang, Q.; Li, J.; Yang, G.; Ma, H.; Zhou, G.; Lu, Z.; Fang, W.; Xie, H.; Liang, C.; et al. A new stable antiferromagnetic semiconductor: The case of inverse Heusler compound Ti2CrSn. Intermetallics 2017, 85, 149–155. [Google Scholar] [CrossRef]
  25. Yin, M.; Nash, P. Standard enthalpies of formation of selected Ru2YZ Heusler compounds. J. Alloys Compd. 2015, 634, 70–74. [Google Scholar] [CrossRef]
  26. Yu, B.L.; Tang, X.F.; Qi, Q.; Zhang, Q.J. Preparation and heat transport properties of CoSb3 nanothermal materials. Acta Phys. Sin. 2004, 9, 3131. [Google Scholar]
  27. Taranova, A.I.; Novitskii, A.P.; Voronin, A.I.; Taskaev, S.V.; Khovaylo, V.V. Influence of V Doping on the Thermoelectric Properties of Fe2Ti1–xVxSn Heusler Alloys. Semiconductors 2019, 53, 768–771. [Google Scholar] [CrossRef]
  28. Nishino, Y.; Deguchi, S.; Mizutani, U. Thermal and transport properties of the Heusler-type Fe2VAl1−xGex (0 ≤ x ≤ 0.20) alloys: Effect of doping on lattice thermal conductivity, electrical resistivity, and Seebeck coefficient. Phys. Rev. B 2006, 74, 115115–1–115115–6. [Google Scholar] [CrossRef]
  29. Nakatsugawa, H.; Ozaki, T.; Kishimura, H.; Okamoto, Y. Thermoelectric Properties of Heusler Fe2TiSn Alloys. J. Electron. Mater. 2020, 49, 2802–2812. [Google Scholar] [CrossRef]
  30. Pedersen, S.V.; Croteau, J.R.; Kempf, N.; Zhang, Y.; Butt, D.P.; Jaques, B.J. Novel synthesis and processing effects on the figure of merit for NbCoSn, NbFeSb, and ZrNiSn based Half-Heusler thermoelectrics. J. Solid State Chem. 2020, 285, 121203. [Google Scholar] [CrossRef]
  31. Guo, F.K.; Cui, B.; Liu, Y.; Meng, X.; Cao, J.; Zhang, Y.; He, R.; Liu, W.; Wu, H.; Pennycook, S.J.; et al. Thermoelectric SnTe with Band Convergence, Dense Dislocations, and Interstitials through Sn Self-Compensation and Mn Alloying. Small 2018, 14, 1802615. [Google Scholar] [CrossRef]
  32. Kim, S., II; Lee, K.H.; Mun, H.A.; Kim, H.S.; Hwang, S.W.; Roh, J.W.; Yang, D.J.; Shin, W.H.; Li, X.S.; Lee, Y.H.; et al. Dense dislocation arrays embedded in grain boundaries for high-performance bulk thermoelectrics. Science 2015, 348, 109–144. [Google Scholar] [CrossRef] [Green Version]
  33. Su, T.J.; Wang, F.C.; Li, S.K.; Wang, L. Regression relationships established for thermal conductivity of steels as function of chemical composition at various temperatures. Ordnance Mater. Sci. Eng. 2004, 27, 14–16. [Google Scholar]
  34. Ramachandran, B.; Lin, Y.H.; Kuo, Y.K.; Kuo, C.N.; Gippius, A.A.; Lue, C.S. Thermoelectric properties of Heusler-type Ru2VAl1−xGax alloys. Intermetallics 2018, 92, 36–41. [Google Scholar] [CrossRef]
  35. Yan, Y.; Yang, J.; Li, J.; Wang, Y.X.; Ren, W. High thermoelectric properties in full-Heusler X2YZ alloys (X = Ca, Sr, and Ba; Y = Au and Hg; Z = Sn, Pb, As, Sb, and Bi). J. Phys. D Appl. Phys. 2019, 52, 495303. [Google Scholar] [CrossRef]
Figure 1. X-ray diffraction pattern of the Ti2CrSn1−xAlx (x = 0, 0.05, 0.1, 0.15, 0.2) alloy.
Metals 11 01503 g001
Figure 2. SEM photographs and atomic percentages of Ti2CrSn samples: (a) Sample surface morphology. (b) Sample fracture surface morphology and Red arrows point to submicron holes. (c) atomic percentages.
Metals 11 01503 g002
Figure 3. Curves of the Seebeck coefficient with respect to temperature for the Ti2CrSn1−xAlx (x = 0, 0.05, 0.1, 0.15, 0.2) alloy.
Metals 11 01503 g003
Figure 4. (a) Temperature dependence of conductivity for the Ti2CrSn1−xAlx (x = 0, 0.05, 0.1, 0.15, 0.2) alloy; and (b) variation in carrier mobility and carrier concentration with respect to Al doping at 296 K.
Metals 11 01503 g004
Figure 5. Power factor variation curve with temperature for the Ti2CrSn1−xAlx (x = 0, 0.05, 0.1, 0.15, 0.2) alloy.
Metals 11 01503 g005
Figure 6. Variation of thermal conductivity with respect to temperature for Ti2CrSn1−xAlx (x = 0, 0.05, 0.1, 0.15, 0.2).
Metals 11 01503 g006
Figure 7. (a) Variation in the ZT values of the Ti2CrSn1−xAlx (x = 0, 0.05, 0.1, 0.15, 0.2) alloy in response to temperature (x = 0, 0.05, 0.1, 0.15, 0.2). (b) Comparison of the dimensionless thermoelectric optimal ZT of the Ti2CrSn1−xAlx (x = 0, 0.05, 0.1, 0.15, 0.2) alloy at the corresponding temperature with other reported full-Heusler alloys [29,34,35].
Metals 11 01503 g007
Publisher’s Note: MDPI stays neutral with regard to jurisdictional claims in published maps and institutional affiliations.

