
Computational Failure Analysis under Overloading


1
Mathematical Institute of the Serbian Academy of Sciences and Arts, 11000 Belgrade, Serbia
2
Department of Engineering and Architecture, University of Parma, 43124 Parma, Italy
*
Author to whom correspondence should be addressed.
Metals 2021, 11(10), 1509; https://doi.org/10.3390/met11101509
Submission received: 2 August 2021
/
Revised: 11 September 2021
/
Accepted: 15 September 2021
/
Published: 23 September 2021
(This article belongs to the Special Issue Fracture, Fatigue, and Structural Integrity of Metallic Materials and Components Undergoing Random or Variable Amplitude Loadings)
Abstract
:The aim of this research work is to shed more light on performance-based design through a computational framework that assesses the residual strength of damaged plate-type configurations under overloading. Novel expressions are generated to analyze the power of crack-like stress raisers coupled with retardation effects. Analytical outcomes show that careful consideration of the overload location and crack size can be quite effective in improving safety design and failure mode estimation.
1. Introduction
The well-known role of surface flaws in compromising bearing capacity during service operations, characterized by variable amplitude loading where overload and underload often exist, constantly warns that such stress raisers can cause sudden hazards in large moving systems.
An understanding of the load interaction effects on the fatigue crack extension, resulting from changes in the cyclic load level, is desirable to ensure the safety integrity and full functioning of structural components exposed to dynamic load environments with/without mixed loading modes, by employing reliable computational frameworks.
From the point of view of fracture mechanics, the driving mode interactions due to overload may be considered through several mechanisms such as residual stress [1], crack closure [2], crack tip blunting [3], strain hardening [4], crack branching [5] and reversed yielding [6].
The interest in the overload phenomenon, even if it has been researched for a long time, has become more pronounced in order to meet increasingly stringent damage tolerance-based demands for modern systems, combining relevant mechanisms and/or concepts. Thus, Elber [2] suggested that the concept of crack opening stress can be applied to generate the driving interactions in the vicinity of the crack tip due to overload. Budiansky and Hutchinson [7] employed the strip-yield hypothesis, generally attributed to the work of Dugdale [8] and Barenblatt [9], to model the plasticity-induced fatigue crack closure. Ohji et al. [10] introduced an incremental plasticity model incorporating kinematic hardening and crack growth simulation, extending the fatigue flaw in each stress cycle by a prescribed length that was equal to the finite element mesh size. Willenborg et al. [11] and Wheeler [12] suggested that residual compressive stresses can retard post-overload crack growth, and they developed their fracture mechanics models. Later, Suresh [5] discussed that retardation can persist even when the post-overload has traversed through the predicted zone of residual compressive stresses. Fleck [13] and Wang et al. [14] performed the finite element analysis to generate a plasticity-induced crack closure in two-dimensional configurations under plain-strain conditions.
Through a stability analysis under overload, Sander and Richard [15] employed the strip yield model and the modified generalized Willenborg model, implemented in the NASGRO [16] software package. Pavlou et al. [17] developed a fracture mechanics model based on strain-hardening fatigue mechanisms in the plastic zone in order to explore the influence of yield stress changes within the overload plastic zone on the fatigue crack growth rate. Huang et al. [18] introduced a modified Wheeler model incorporating an improved fatigue crack growth rate solution and the equivalent stress-intensity concept.
Further, Mohanty et al. [19] took into account Frost and Dugdale’s fracture mechanics concept and the modified two-parameter crack growth model proposed by Jones et al. [20]. Harmain [21] proposed several modifications to Wheeler’s crack growth idea involving an effective stress intensity factor based on Elber’s crack closure concept [2], the relationship between overload ratio and the Wheeler’s exponent, and the fatigue crack growth rate calculation. Boljanović and Maksimović [22] examined the fatigue performance of a through-crack under overloading using the Kujawski crack growth concept [23] together with the Wheeler retardation concept. Further, Boljanović et al. [24] analyzed the stability of the same stress raiser, linking the Zhan et al. concept [25] and the Wheeler concept [12] together with relevant solutions suggested by Richard et al. [26] for assessing the stress intensity factor under mixed mode loading with overload.
In the present work, the trends of fatigue strength degradation are evaluated taking into account the overload effect. In order to identify and characterize the potential features of such a phenomenon, an analytical framework is proposed, and a detailed body of evidence is provided for evaluating detrimental effects of a crack-like through flaw coupled with retardation effect due to overloading. Solutions from relevant literature demonstrate that this computational tool is able to provide a physical interpretation of the overload mechanism governing the propagation of the fatigue flaw so that it is possible to generate stress intensities and residual life through a consistent set of fracture-mechanics parameters.
2. Driving Mode Analysis under Cyclic Loading
Achieving high safety performances necessarily requires a detailed analysis of the fatigue-critical hot spots in large moving systems through relevant fracture mechanics-based crack growth concepts [19,24,27,28]. Hence, the driving mode progression due to crack-like edge flaw (Figure 1) is evaluated by employing the Huang–Moan crack growth concept [29], expressed as follows:
where da/dN and a are the crack growth rate and crack length, respectively, ∆K is the stress intensity factor range, C and m are material parameters experimentally obtained, and N is the number of loading cycles.
Further, relevant interactions between in-service loading profiles and environmental effects are theoretically examined by means of the following fracture mechanics parameter [29]:
where R is the stress ratio, β1 and β are material parameters, experimentally obtained in the case of one negative and two positive cyclic loading domains [29], respectively.
Through a safety-relevant analysis herein presented, after integration crack growth rate (Equation (1)) from initial a0 to final af crack length, the residual life can be evaluated as follows:
In order to make correct durability decisions and have well-coordinated fatigue responses to potential hazard events, a reliable assessment of residual bearing capacity and severity of plate-type system damage is needed. According to damage tolerance requirements, nonlinear driving force interactions in the vicinity of the crack tip are herein explored through the stress intensity range expressed as follows:
where ∆P is applied force range, w and t are width and thickness of the plate, respectively.
Further, in order to quantify the effect of an edge crack-like through flaw and geometry of considered plate, the following fracture mechanics-based parameter is employed [19].
3. Crack Growth Evolution Taking into Account the Retardation Effect
Variable amplitude cyclic-load environment may often have a significant impact on the strength capacity of large moving systems due to the appearance of overload, underload, and overload followed by underload, characterized by retardation, acceleration, and reduced retardation. Thus, if overload is applied, a relevant plastic zone of residual compressive stresses is generated in the vicinity of the crack tip. Such a nonlinear stress state field causes retardation in crack propagation by reducing the exiting crack tip driving force. In this context, fatigue analysis is herein performed employing the fracture mechanics-based concepts [29] combined with the retardation concept [12], i.e.,
where Cpi is the fatigue parameter related to the overload effect.
Complex interactions in the zone where compressive stress states exist are theoretically examined using the following fracture mechanics solution proposed by Wheeler [12]:
where rpi and ai are the current plastic zone in the ith cyclic and corresponding crack size, and rpo and aol represent the overload plastic zone size and appropriate overload crack size, respectively, and p is the retardation exponent experimentally obtained.
Since the power of the overload effect decreases when the current plastic zone approaches the overload plastic zone, the relevant sizes of current plastic zone and monotonic overload plastic zone are computed [30,31] as follows:
where ∆K and Kol are the relevant stress intensity factor range and the stress intensity factor generated by an overload, respectively, and σys is the yield strength of the material.
Furthermore, fatigue-based overload evaluations are herein performed in terms of the number of loading cycles, integrating the proposed solution for crack growth rate in Equation (6), i.e.,
where a0 and af are initial and final crack length, respectively.
With the need to reduce design life cyclic time and costs with ever more complex large moving systems, the possibility of assessing the failure strength against fatigue-induced loading interactions through advanced computational strategies is attractive. Thus, a damage tolerance-based analytical framework is herein developed, in which Euler’s algorithm is implemented for generating fatigue resistance under overloading, as is discussed through several case study applications in the next section.
4. Residual Strength Design Using Developed Computational Framework
4.1. Fatigue Evaluations under Cyclic Loading with Overload
The failure performance design presented here tackles the crack-like edge stress raiser (Figure 1) under cyclic loading with overload. Through the life evaluations for the plate made of 6061 T6 aluminum alloy, the following material and loading parameters are employed: C = 6 × 10⁻¹¹, m = 3.2, β = 0.7, λ = 1, p = 0.21, σys = 296 MPa, Pmax = 11,772 N with R = 0. Relevant geometrical sizes are characterized by w = 50 mm, t = 3 mm, L = 180 mm, and an initial crack length equal to a0= 6 mm is examined. By adopting that the crack length of a single overload is equal to aol = 7.5 mm, driving mode interactions are theoretically examined in the case of three overload stress ratios (Rol = 1.42, 1.67, and 1.88) which are shown in Table 1.
The fatigue vulnerability analysis performed via a novel computational framework evaluates the driving mode caused by through-crack and the residual life through Equations (1)–(5) coupled with Equations (6)–(9), respectively. Safety outcomes shown in Figure 2a generate the stress intensities in the vicinity of the crack tip caused by overload (Rol = 1.42), whereas the number of loading cycles versus crack length is examined in Figure 2b and Figure 3, and Table 1 in the case of three different overload stress ratios (Rol = 1.42, 1.67, and 1.88). Further experimental outcomes discussed by Kumar [32] are employed to estimate the predictive capability of generated plate lives.
Through different comparisons presented in this section, it can be inferred that the developed computational framework provides conservative estimates for plates with edge through-crack subjected to overload. In addition, the main contribution of the fatigue resistance analysis presented is that it can be stated that, for the considered plate with through-crack (characterized by t = 3 mm), the higher the overload ratio and applied overload force range, the more pronounced the impact of retardation effects under cyclic loading (see Table 1). Since complex interactions between the effects of through-crack and the stress ratio effect coupled with the effects of thin plate thickness are adequately evaluated via fatigue life (with respect to experiments [32]), the computational strategy herein proposed can significantly contribute to further improvements in safety design and optimization of large moving systems.
4.2. The Effect of Overload Crack Length and the Stress Ratio Effect on the Fatigue Strength
In this section, the strength performance under cyclic loading with single overload is designed for plates made of 6061 T6 aluminum alloy (w = 50 mm, t = 4 mm, L = 200 mm, Figure 1). Fatigue stability is explored in the case of overload crack length equal to aol = 8.5 mm, 14.5 mm, and 24.5 mm assuming the following overload and cyclic loading parameters: Pmaxol = 22,150 N, Rol = 1.75, Pmax = 15,500 N, R = 0.2. The initial crack length is characterized by a0 = 5.5 mm.
Damage tolerance-based assessments in terms of the residual life generated via novel analytical solutions (Equations (2)–(5)) are shown in Figure 4a for the three different single-overload conditions considered. Furthermore, the interactions between the effect of through-crack and overload effect are theoretically examined for plates (w = 50 mm, t = 3.5 mm, a0 = 4.5 mm) subjected to three different values of stress ratio, i.e., R = 0.1, 0.3, and 0.5, respectively, as is shown in Figure 4b. Note that relevant force range and maximum overload force are equal to Pmax = 17,200 N, Pmaxol= 24,420 N, Rol = 1.95, and aol = 10.5 mm, whereas material parameters are the same as those adopted in the previous section.
By analyzing relevant theoretical outcomes shown in Figure 4, it can be concluded that the number of loading cycles decreased from 49,450 to 45,180 due to the increase in overload crack length from 8.5 mm to 14.5 mm. Furthermore, if the stress ratio increases from 0.1 to 0.3, the number of loading cycles increases from 27,820 to 36,790. Evidently, an increase in overload crack length leads to a decrease in the retardation effect due to overloading. In addition, increasing the value of stress ratio under cyclic loading can contribute to increasing the impact of overload leading to an additional increase in residual life to failure.
4.3. Fatigue Evaluations under Mixed Mode Loading with Overload
Finally, the performance design carries out the driving mode progression due to the mixed mode flaws (Figure 5). The fatigue life is assessed here in the case of plate made of 2024 T3 aluminum alloy (w = 52 mm, t = 6.5 mm σys = 324 MPa, E = 73.1 GPa, β = 0.7, p = 0.21, C = 5 × 10⁻¹¹, m = 3.05). Further, maximum force Pmax = 7197 N (with stress ratio R = 0.1) and relevant maximum overload force Pmaxol = 17,993 N (with overload stress ratio Rol = 0.1 applied at crack length aol = 20.4 mm) are adopted in order to analyze the loading angle effect of crack-like flaw, whose initial length is equal to a0 = 17.75 mm.
In-service large moving systems often face a complex fatigue environment which can cause the formation of mixed-mode and/or multi-axial flaws. From the point of view of fracture mechanics, the detrimental effects of such randomly oriented quantities, represented as manufacturing and in-service flaws/defects, should be analyzed through the equivalent stress intensity factor [33]. Thus, the stress state in the vicinity of the crack tip, where combined loading modes exist (see Figure 5), may be evaluated as follows:
Fatigue-induced interactions caused by local mode I and mode II load environment are herein assessed via relevant stress intensity factors [34], i.e.,
where ∆P is applied force ranges, a represents the crack length, and w and t are the width and thickness of the plate, respectively.
Through the failure resistance design, the crack growth rate and residual life are evaluated employing Equations (1)–(3) and Equations (6)–(8) together with Equations (9)–(12) for three different loading profiles i.e., ϕ = 18°, 36°, and 54°, respectively. Figure 6a presents the equivalent stress intensity factors evaluated in the case of three different loading angles, whereas the residual strength in terms of the number of loading cycles is plotted in Figure 6b and Figure 7a,b.
Further, literature-based experimental/theoretical outcomes reported by Mohanty et al. [19] are examined for the same mixed mode configurations in order to assess the predictive capability of the generated computational framework. From Figure 6 and Figure 7, it can be inferred that relevant experimental data and theoretical outcomes are in quite good agreement. Further, fatigue lives evaluated through this research work are compared with those discussed by Boljanović et al. [24] and Mohanty et al. [19], as is shown in Table 2. Note that relevant calculations from [24] represent those in which stress intensities due to the fact that mixed modes were analyzed using the Richard et al. [26] concept.
Comparisons in Table 2 indicate that relevant concepts discussed through this paper and those proposed within [24] adequately generate interactions between the stress raiser effects and mixed mode effects under overloading, where the framework previously developed provides a more conservative trend of estimates with respect to fatigue outcomes reported in [19]. It is evident that theoretical outcomes represent high performance/quality estimates.
Further, it should be noted that, during mandatory large moving systems inspections/controls in the case of loading angles ϕ = 36° and 54°, a computational framework herein developed can have an important role since it generates residual life values closer to relevant experimental/theoretical outcomes [19] than the ones discussed in [24].
Moreover, the safety analysis demonstrates that retardation effect due to overloading is pronounced for loading angle ϕ = 18°, while its impact in the case of ϕ = 36° and 54° decreased by about 10% if the edge crack-like flaw is subjected to mixed (I and II) loading modes.
5. Conclusions
Due to heavy usage, large moving systems usually work and deteriorate in a variable amplitude dynamic environment, where deleterious factors caused by localized flaws can seriously compromise their bearing capacities. Thus, reliable and target-oriented assessments of fatigue degradation under overload, according to damage tolerance requirements, are very important. A challenging and also interesting task is to monitor/control the failure strength through the residual life evaluations simultaneously and independently in the case of axial loading and mixed mode loading, taking into account the load interaction effect. In this context, the present research work proposes a novel analytical framework for analyzing interactions between the effects of crack-like through flaws and overload effect.
In order to explore crack growth retardation, a two-parameter driving force concept is combined with the fracture mechanics concept proposed by Wheeler. Further, relevant fatigue life solutions are established which are essential to the reliable control of through-flaw configurations under axial and mixed mode loading. Several case study applications are given to demonstrate the fatigue assessments under targeted cyclic load profiles and to verify the developed computational tool taking into account the effect of overload stress ratio and the loading angle effects due to mixed modes. In addition, a significant contribution of this research is that it supplies notable information about overload mechanisms and sheds a light on improving the safe-integrity performance design of failure-critical aeronautical systems.
Author Contributions
Conceptualizations, S.B. and A.C.; methodology, S.B. and A.C.; software, S.B.; validation, S.B. and A.C. writing-original draft preparation, S.B.; writing-review and editing S.B. and A.C. All authors have read and agreed to the published version of the manuscript.
Funding
This research received no external funding.
Data Availability Statement
Not available.
Acknowledgments
The present scientific research was supported by the Serbian Ministry of Education, Science and Technological Development through the Mathematical Institute of the Serbian Academy of Sciences and Arts, Belgrade and the COST Association, Brussels, Belgium within the Action CA 18203, which is gratefully acknowledge.
Conflicts of Interest
The authors declare no conflict of interest.
References
- Schijve, J.; Broek, D. Crack propagation: The results of a test programme based on a gust spectrum with variable amplitude loading. Aircraft Eng. Aerospace Techn. 1962, 34, 314–316. [Google Scholar] [CrossRef]
- Elber, W. The significance of fatigue crack closure. In Damage Tolerance in Aircraft Structures; ASTM STP: Philadelphia, PA, USA, 1971; Volume 486, pp. 230–242. [Google Scholar]
- Christensen, R.H. Fatigue crack. In Fatigue Cracking, Fatigue Damage and Their Detection, Metal Fatigue; Sines, G., Waisman, J.L., Eds.; McGraw-Hill Book Co.: New York, NY, USA, 1959; pp. 376–412. [Google Scholar]
- Jones, R.E. Fatigue crack growth retardation after single-cycle peak overload in Ti-6Al-4V titanium alloy. Eng. Fract. Mech. 1973, 5, 585–604. [Google Scholar] [CrossRef]
- Suresh, S. Micromechanisms of fatigue crack growth retardation following overloads. Eng. Fract. Mech. 1983, 18, 577–593. [Google Scholar] [CrossRef] [Green Version]
- Nicoletto, W. Fatigue crack-tip field measurements. In Nonlinear Fracture Mechanics; ASTM STP: Philadelphia, PA, USA, 1989; Volume 995, pp. 415–432. [Google Scholar]
- Budiansky, B.; Hutchinson, J.W. Analysis of closure in fatigue crack growth. ASME J. Appl. Mech. 1978, 45, 267–276. [Google Scholar] [CrossRef]
- Dugdale, D.S. Yielding of steel sheets containing slits. J. Mech. Phys. Solids 1960, 8, 100–104. [Google Scholar] [CrossRef]
- Barenblatt, G.I. The mathematical theory of equilibrium cracks in brittle fracture. In Advances in Applied Mechanics 7; USSR Academy of Sciences: Moscow, Russia, 1962; pp. 55–129. [Google Scholar]
- Ohji, K.; Ogura, K.; Yoshiji, O. Cyclic analysis of a propagating crack and its correlation with fatigue crack growth. Eng. Fract. Mech. 1975, 7, 457–464. [Google Scholar] [CrossRef]
- Willenborg, J.D.; Engle, R.M.; Wood, H.A. A Crack Growth Retardation Model Using an Effective Stress Concept; Report AFFDL-TM-71-1-FBR; Air Force Flight Laboratory, Wright-Patterson Air Force Base: Dayton, OH, USA, 1971. [Google Scholar]
- Wheeler, O.E. Spectrum loading and crack growth. J. Bas. Eng. Trans. ASME Ser. D 1972, 94, 181–186. [Google Scholar] [CrossRef]
- Fleck, N.A. Finite element analysis of plasticity induced crack closure under plane strain conditions. Eng. Fract. Mech. 1986, 25, 441–449. [Google Scholar] [CrossRef]
- Wang, C.H.; Rose, L.R.F.; Newman, J.C. Closure of plane-strain cracks under large-scale yielding conditions. Fatigue Fract. Eng. Mater. Struct. 2002, 25, 127–139. [Google Scholar] [CrossRef]
- Sander, M.; Richard, H.S. Lifetime predictions for real loading situations–concepts and experimental results of fatigue crack growth. Int. J Fatigue 2003, 25, 999–1005. [Google Scholar] [CrossRef]
- NASGRO. Fatigue Crack Growth Computer Program “NASGRO”; Version 3.0-Reference Manual, JSC-22267B; NASA, Lyndon B. Johnson Space Center: Houston, TX, USA, 2000. [Google Scholar]
- Pavlou, D.G.; Vlachakis, N.V.; Pavlou, M.G.; Vlachakis, V.N. Estimation of fatigue crack growth retardation due to crack branching. Comp. Mater. Sci. 2004, 29, 446–452. [Google Scholar] [CrossRef]
- Huang, X.; Moan, T.; Weicheng, C. An engineering model of fatigue crack growth under variable amplitude loading. Int. J. Fatigue 2008, 30, 2–10. [Google Scholar] [CrossRef]
- Mohanty, J.R.; Verma, B.B.; Ray, P.K. Prediction of fatigue life with interspersed mode-I and mixed-mode (I and II) overloads by an exponential model: Extensions and improvements. Eng. Fract. Mech. 2009, 76, 454–468. [Google Scholar] [CrossRef]
- Jones, R.; Molent, L.; Pitt, S. Crack growth of physically small cracks. Int. J. Fatigue 2007, 29, 1658–1667. [Google Scholar] [CrossRef]
- Harmain, G.A. A model for predicting the retardation effect following a single overload. Theor. Appl. Fract. Mech. 2010, 53, 80–88. [Google Scholar] [CrossRef]
- Boljanović, S.; Maksimović, S. Computational mixed mode failure analysis under fatigue loadings with constant amplitude and overload. Eng. Fract. Mech. 2017, 174, 168–179. [Google Scholar] [CrossRef]
- Kujawski, D. A new (ΔK+Kmax)0.5 driving force parameter for crack growth in aluminium alloy. Int. J. Fatigue 2001, 23, 733–740. [Google Scholar] [CrossRef]
- Boljanović, S.; Maksimović, S.; Carpinteri, A. Fatigue-resistance evaluations for mixed mode damages under constant amplitude and overload. Theor. Appl. Fract. Mech. 2020, 108, 102599. [Google Scholar] [CrossRef]
- Zhan, W.; Lu, N.; Zhang, C. A new approximate model for the R-ratio effect on fatigue crack growth rate. Eng. Fract. Mech. 2014, 119, 85–96. [Google Scholar] [CrossRef]
- Richard, H.A.; Linning, W.; Henn, K. Fatigue crack propagation under combined loading. Forensic Eng. 1991, 3, 99–109. [Google Scholar]
- Carpinteri, A.; Spagnoli, A.; Vantadori, S.; Bagni, C. Structural integrity assessment of metallic components under multiaxial fatigue: The C-S criterion and its evaluation. Fatigue Fract. Eng. Mater. Struct. 2013, 36, 870–883. [Google Scholar] [CrossRef]
- Carpinteri, A.; Spagnoli, A.; Ronchei, C.; Scorza, D.; Vantadori, S. Critical plane criterion for fatigue life calculation: Time and frequency domain formulations. Procedia Eng. 2015, 101, 518–523. [Google Scholar] [CrossRef]
- Huang, X.; Moan, T. Improved modeling of the effect of R-ratio on crack growth rate. Int. J. Fatigue 2007, 29, 591–602. [Google Scholar] [CrossRef]
- Antunes, F.V.; Borrego, L.F.P.; Costa, J.M.; Ferreira, J.M. A numerical study of fatigue crack closure induced by plasticity. Fatigue Fract. Eng. Mater. Struct. 2004, 27, 825–835. [Google Scholar] [CrossRef]
- Rushton, P.A.; Taheri, F. Prediction of crack growth in 350WT steel subjected to constant amplitude with over- and under-loads using a modified wheeler approach. Mar. Struct. 2003, 16, 517–539. [Google Scholar] [CrossRef]
- Kumar, R. Prediction of delay cycles due to instant of single overload cycles. Eng. Fract. Mech. 1992, 42, 563–571. [Google Scholar] [CrossRef]
- Tanaka, K. Fatigue crack propagation from a crack inclined to the cyclic tensile axis. Eng. Fract. Mech. 1974, 6, 493–507. [Google Scholar] [CrossRef]
- Chao, Y.J.; Liu, S. On the failure of cracks under mixed-mode loads. Int. J. Fract. 1997, 87, 201–223. [Google Scholar] [CrossRef]
Figure 1.
Geometry of the plate with edge crack-like flaw subjected to cyclic loading with overload (unit: mm).
Figure 1.
Geometry of the plate with edge crack-like flaw subjected to cyclic loading with overload (unit: mm).
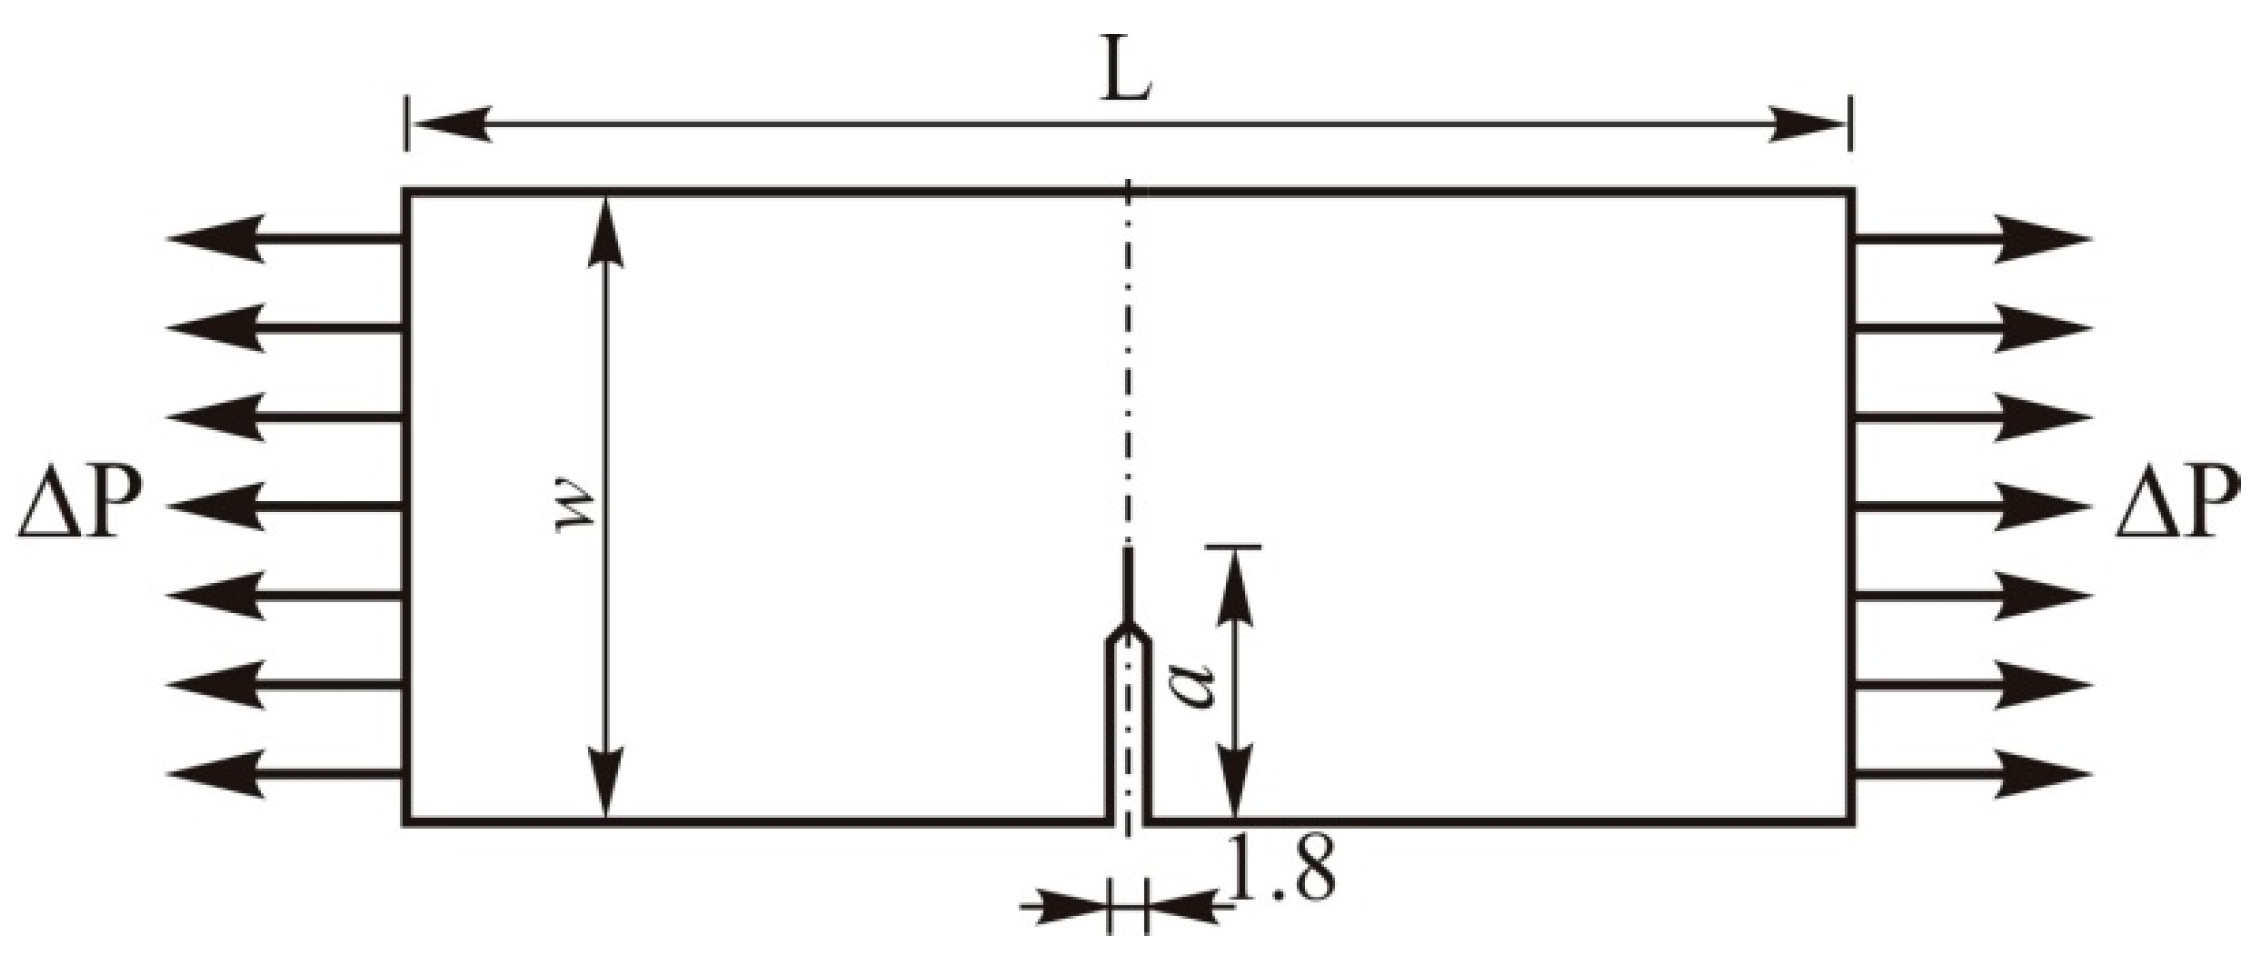
Figure 2.
Fatigue resistance analysis: (a) KI versus a, Rol = 1.42 and (b) a versus N, Rol = 1.42, calculated curves from the present work, experiments reported by Kumar [32].
Figure 2.
Fatigue resistance analysis: (a) KI versus a, Rol = 1.42 and (b) a versus N, Rol = 1.42, calculated curves from the present work, experiments reported by Kumar [32].
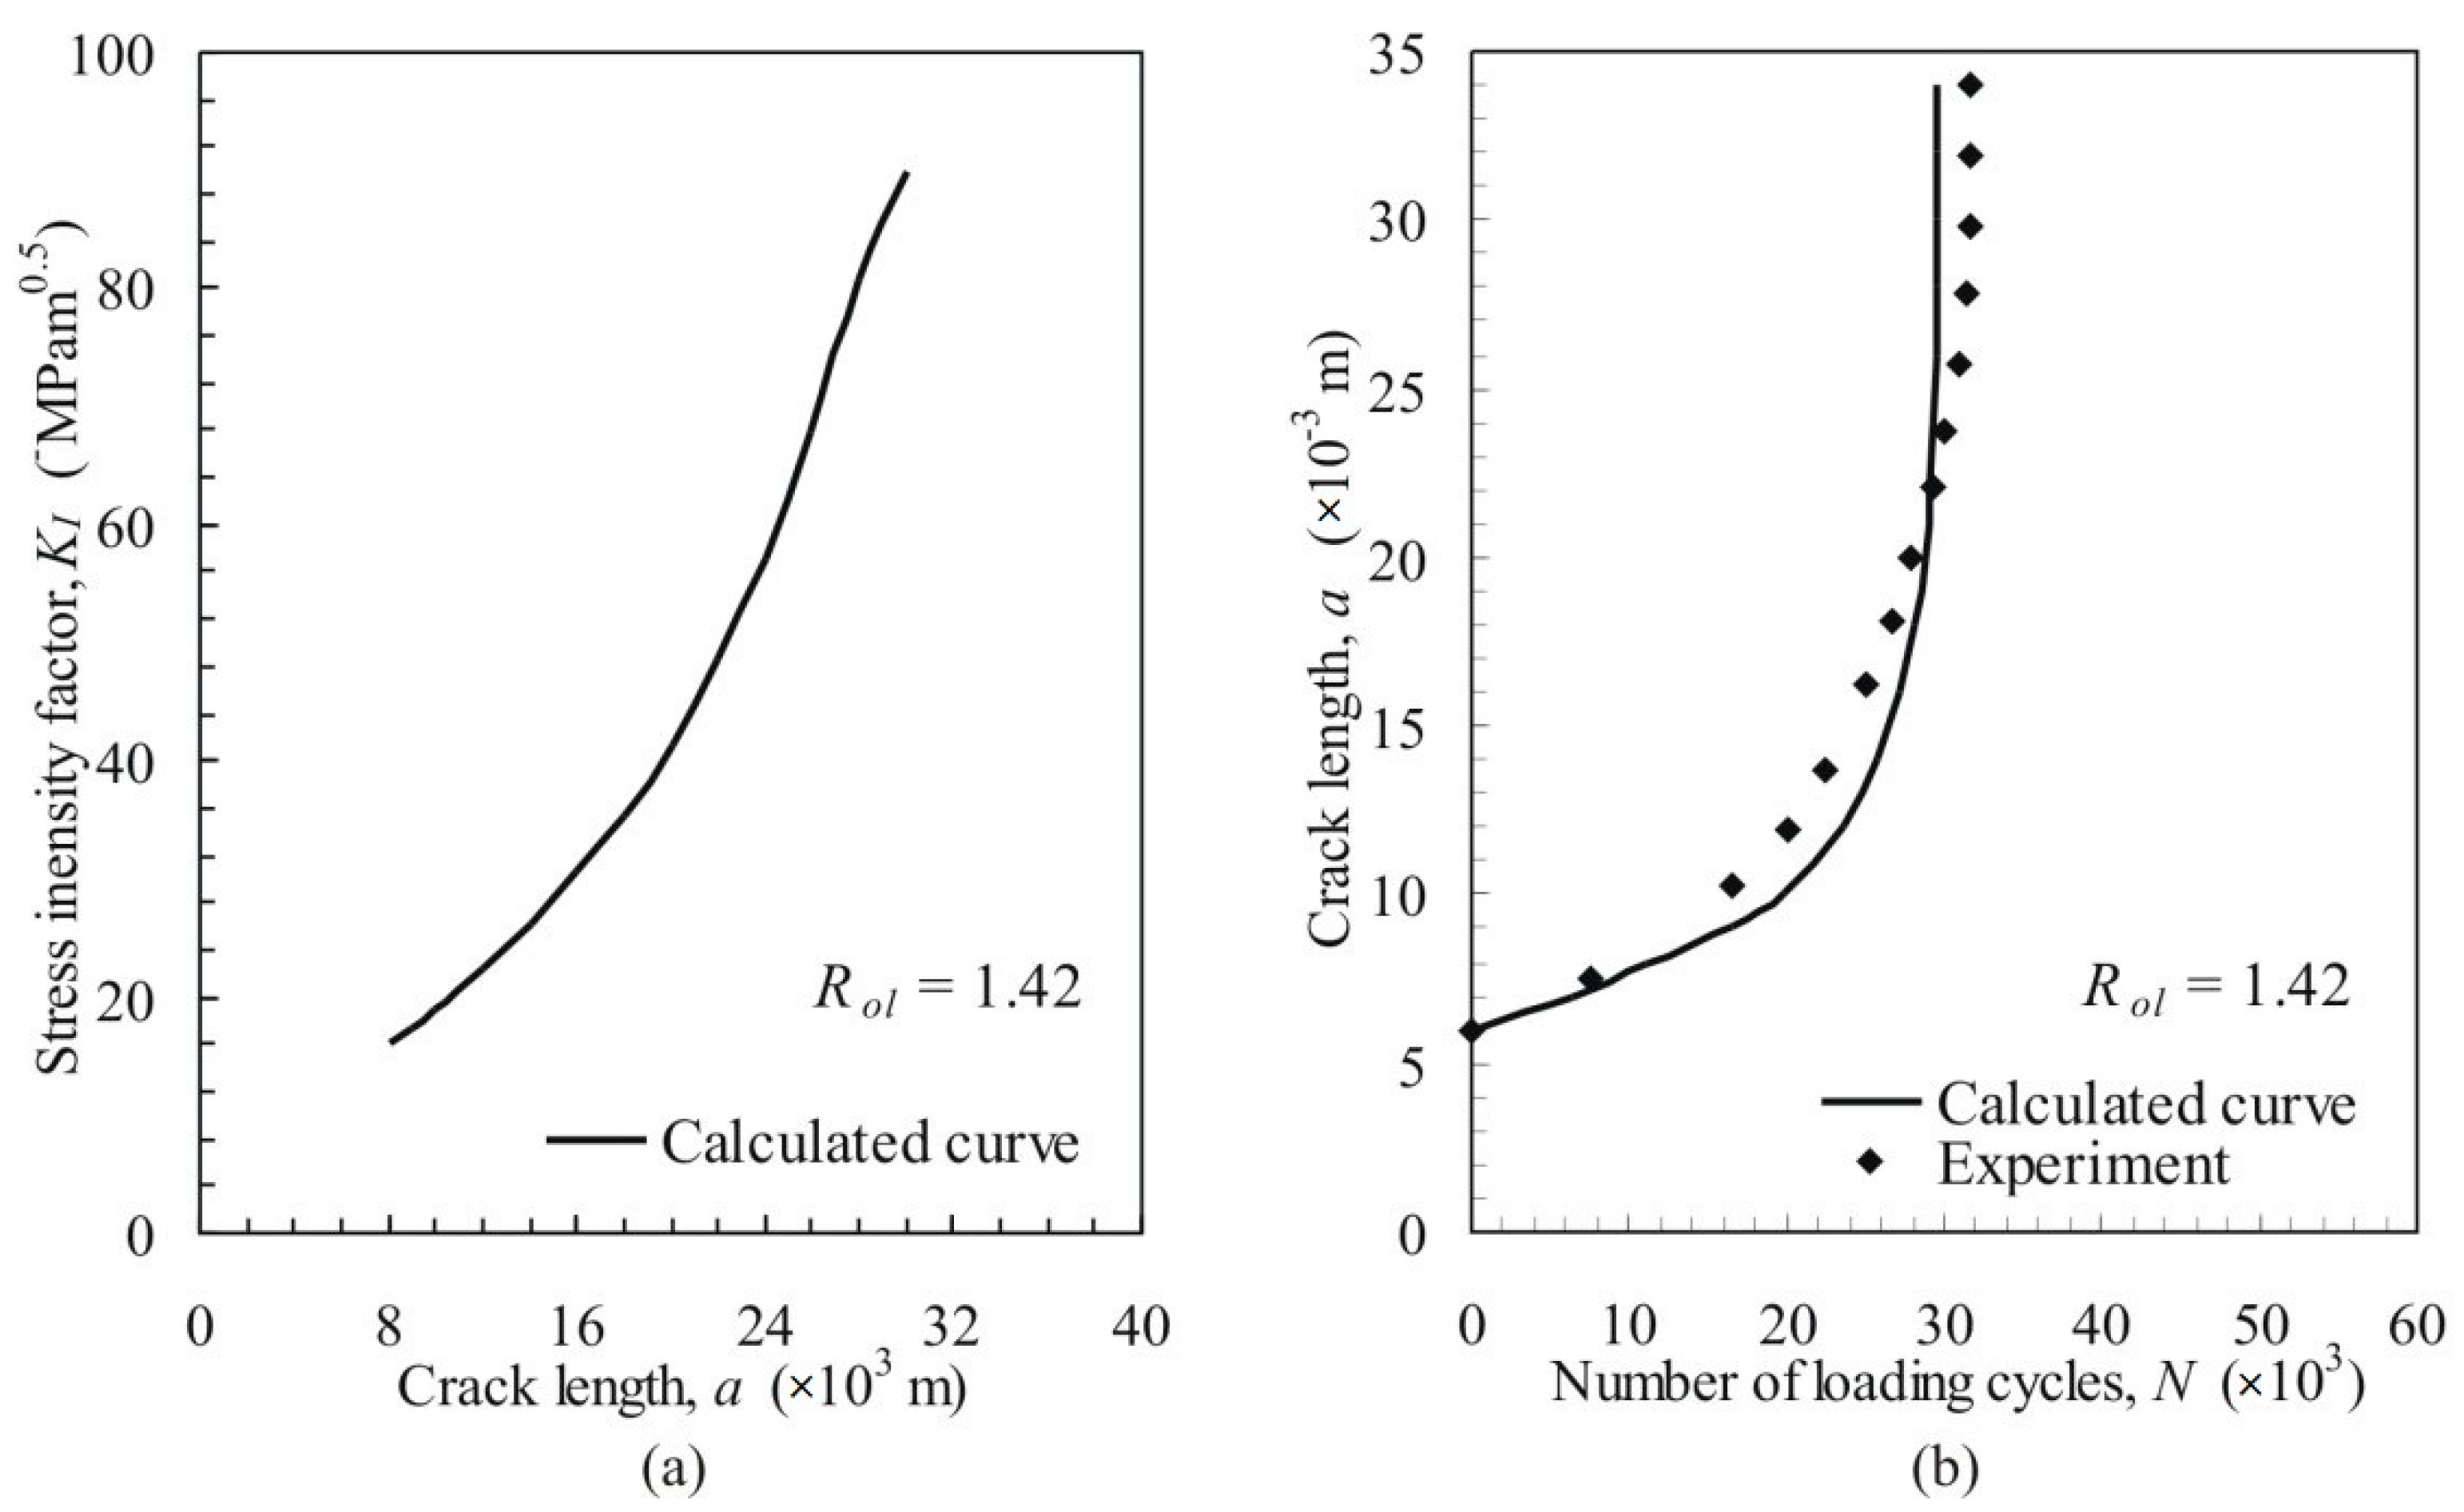
Figure 3.
Fatigue resistance analysis: (a) a versus N, Rol = 1.67 and (b) a versus N, Rol = 1.88, calculated curves from the present work, experiments reported by Kumar [32].
Figure 3.
Fatigue resistance analysis: (a) a versus N, Rol = 1.67 and (b) a versus N, Rol = 1.88, calculated curves from the present work, experiments reported by Kumar [32].

Figure 4.
Fatigue resistance analysis: (a) a versus N (1 − aol = 8.5 mm, 2 − aol = 14.5 mm, 3 − aol = 24.5 mm) and (b) a versus N (1 − R = 0.1, 2 − R= 0.3, 3 − R = 0.5), calculated curves from the present work.
Figure 4.
Fatigue resistance analysis: (a) a versus N (1 − aol = 8.5 mm, 2 − aol = 14.5 mm, 3 − aol = 24.5 mm) and (b) a versus N (1 − R = 0.1, 2 − R= 0.3, 3 − R = 0.5), calculated curves from the present work.
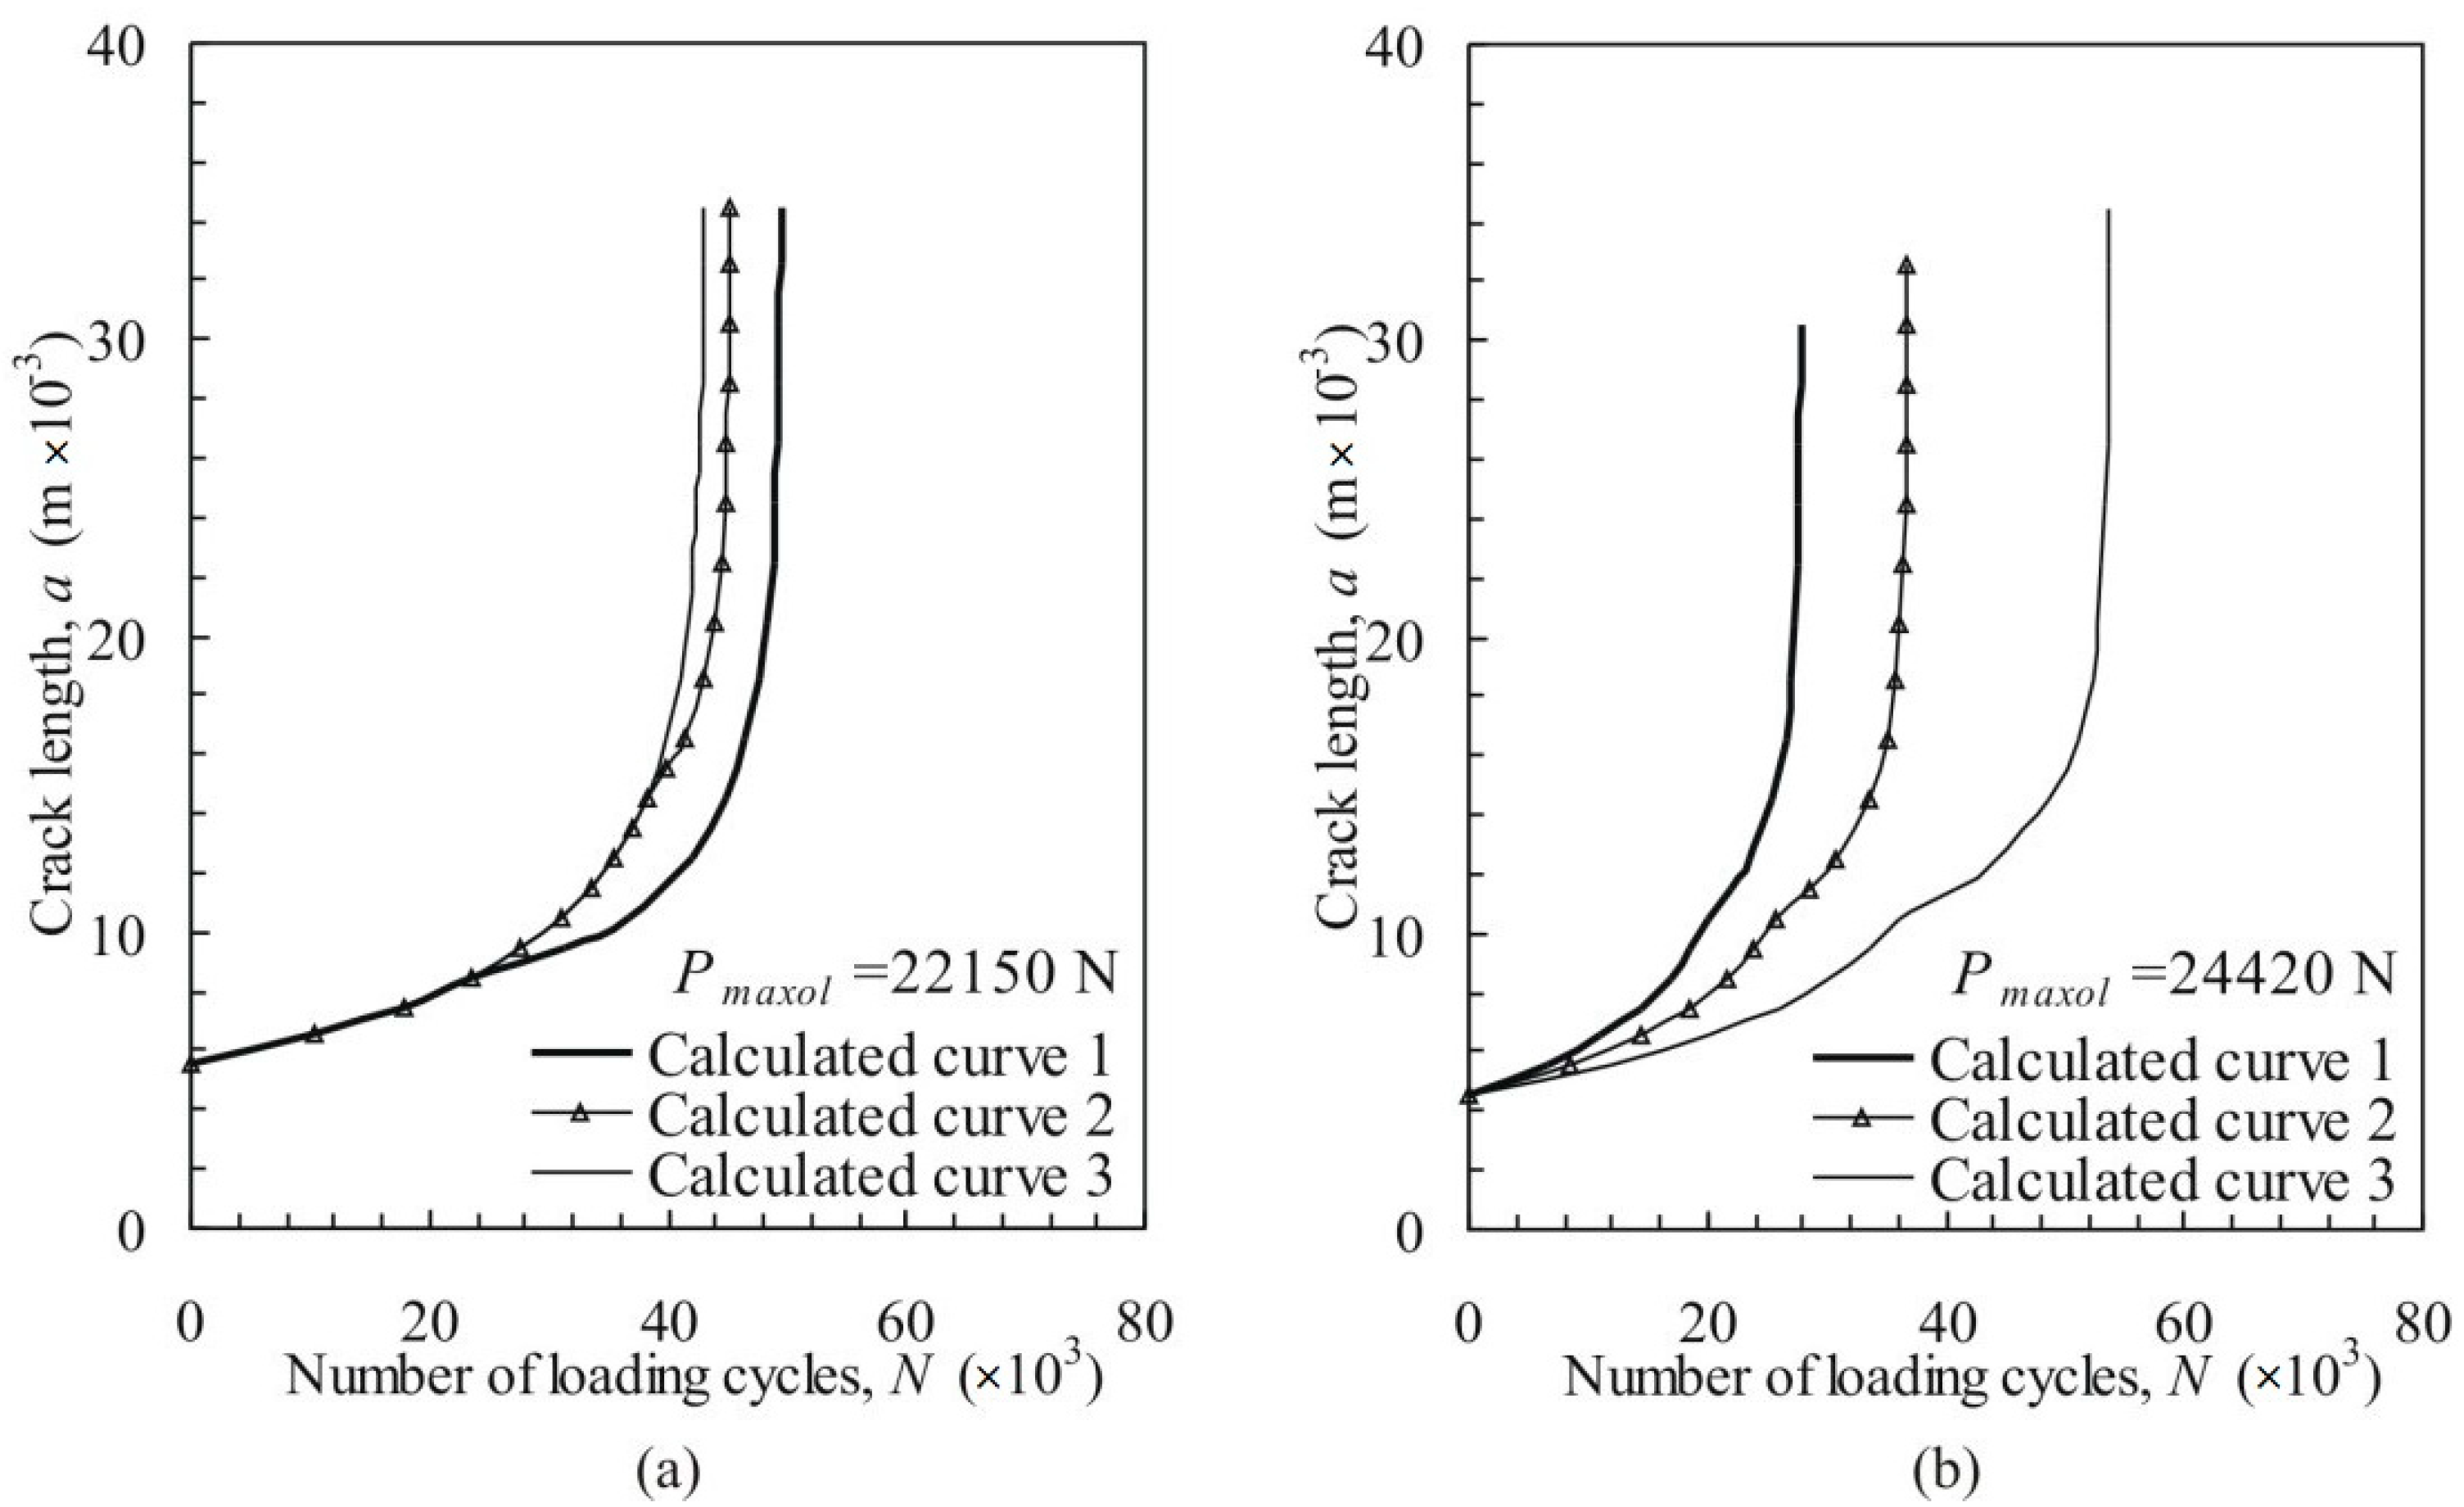
Figure 5.
Geometry of the plate with edge crack-like flaw subjected to mixed-mode loading with overload. All dimensions are in millimeters.
Figure 5.
Geometry of the plate with edge crack-like flaw subjected to mixed-mode loading with overload. All dimensions are in millimeters.
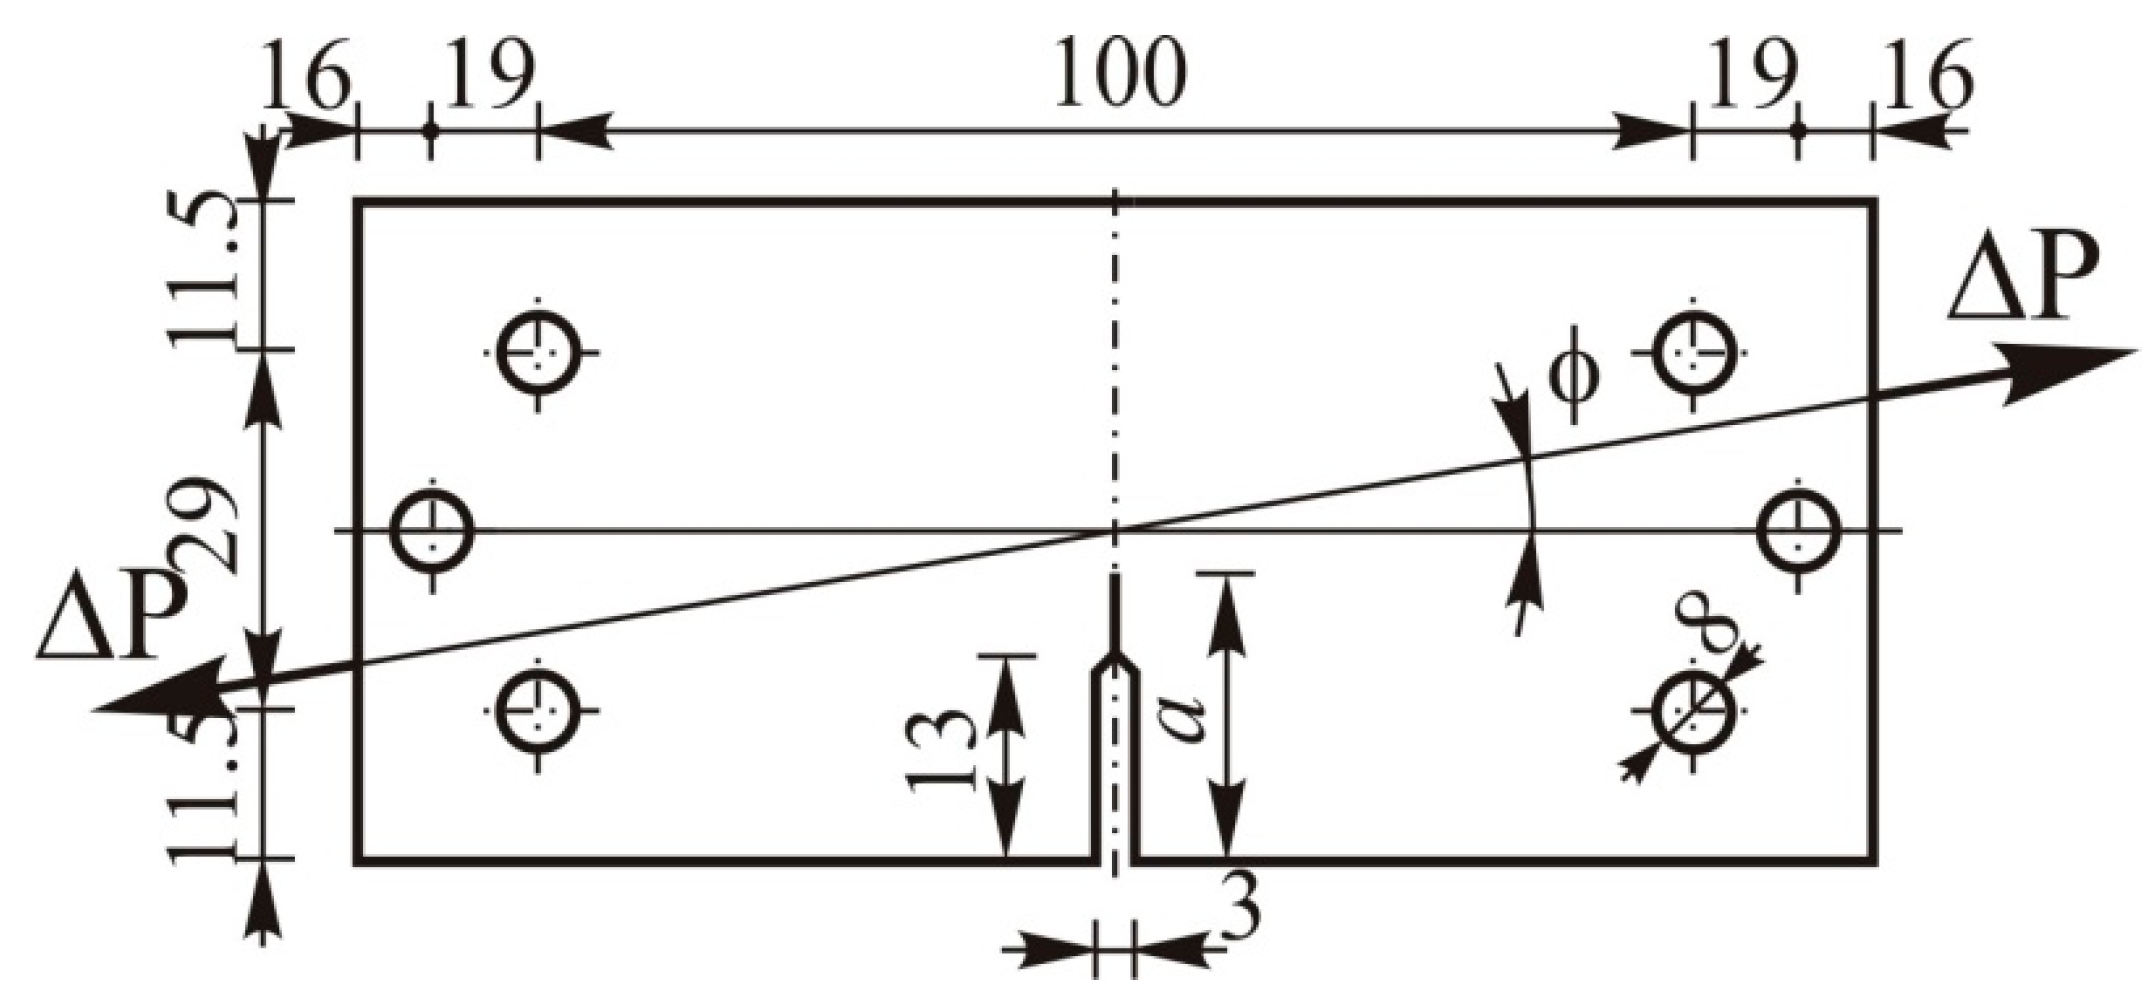
Figure 6.
Fatigue resistance analysis: (a) Keq versus a (1 − ϕ = 18°, 2 − ϕ = 36°, 3 − ϕ = 54°), calculated curves from the present work, and (b) a versus N (ϕ = 18°), 1—calculated curve from the present work, 2—calculated curve reported by Mohanty et al. [19].
Figure 6.
Fatigue resistance analysis: (a) Keq versus a (1 − ϕ = 18°, 2 − ϕ = 36°, 3 − ϕ = 54°), calculated curves from the present work, and (b) a versus N (ϕ = 18°), 1—calculated curve from the present work, 2—calculated curve reported by Mohanty et al. [19].

Figure 7.
Fatigue resistance analysis: (a) a versus N (ϕ = 36°), 1—calculated curve from the present work, 2—calculated curve from Reference [19] and (b) a versus N (ϕ = 54°), calculated curve from the present work, experiments reported by Mohanty et al. [19].


Table 1.
Evaluated number of loading cycles and applied force ranges with corresponding stress ratios under overloading.
Table 1.
Evaluated number of loading cycles and applied force ranges with corresponding stress ratios under overloading.
| Rol | ∆Pol (N) | N exp. (Cycles) [32] | N cal. (Cycles) |
|---|---|---|---|
| 1.42 | 16,677 | 31,250 | 29,620 |
| 1.67 | 19,620 | 38,513 | 32,600 |
| 1.88 | 22,072 | 57,140 | 50,340 |
Publisher’s Note: MDPI stays neutral with regard to jurisdictional claims in published maps and institutional affiliations. |
© 2021 by the authors. Licensee MDPI, Basel, Switzerland. This article is an open access article distributed under the terms and conditions of the Creative Commons Attribution (CC BY) license (https://creativecommons.org/licenses/by/4.0/).
Share and Cite
MDPI and ACS Style
Boljanović, S.; Carpinteri, A. Computational Failure Analysis under Overloading. Metals 2021, 11, 1509. https://doi.org/10.3390/met11101509
AMA Style
Boljanović S, Carpinteri A. Computational Failure Analysis under Overloading. Metals. 2021; 11(10):1509. https://doi.org/10.3390/met11101509
Chicago/Turabian StyleBoljanović, Slobodanka, and Andrea Carpinteri. 2021. "Computational Failure Analysis under Overloading" Metals 11, no. 10: 1509. https://doi.org/10.3390/met11101509
Note that from the first issue of 2016, this journal uses article numbers instead of page numbers. See further details here.