Article

Influence of Cold Rolling Process and Chemical Composition on the Mechanical Properties and Corrosion Behavior of Zr-Based Metallic Glasses

by
Ali Akbarpour
1,*,
Daria A. Milkova
1,
Erzhena N. Zanaeva
1,
Mark S. Parkhomenko
1,
Vladimir V. Cheverikin
1,
Alexander Lubenchenko
2 and
Andrey I. Bazlov
1,3
1
Department of Physical Metallurgy of Non-Ferrous Metals, National University of Science and Technology “MISiS”, 119049 Moscow, Russia
2
Department of General Physics and Nuclear Fusion, National Research University “MPEI”, Krasnokazarmennaya 14, 111250 Moscow, Russia
3
The Research Laboratory for Mechanics of Advanced Bulk Nanomaterials for Innovative Engineering Applications, St. Petersburg State University, 199034 St. Petersburg, Russia
*
Author to whom correspondence should be addressed.
Metals 2021, 11(10), 1514; https://doi.org/10.3390/met11101514
Submission received: 18 August 2021 / Revised: 15 September 2021 / Accepted: 20 September 2021 / Published: 24 September 2021
(This article belongs to the Special Issue Forming Ability and Properties of Bulk Metallic Glasses)

Abstract

:
Cold rolling (CR) with thickness reduction of 10%, 30%, and 50% was applied to Zr50Cu44Al6 and Zr49.5Cu44Al6Nb0.5 metallic glassy ribbon samples. The XRD patterns showed the amorphousness of all samples after casting and CR processes. The SEM images indicated the formation of multiple shear bands (SBs) owing to plastic deformation during CR. However, the addition of 0.5 at% Nb to the alloy changed the SBs’ density and spacing characteristics. The characterization of free volume changes caused by CR was carried out by measuring the density of Archimedes. The micro-hardness of samples was studied by investigating SBs and free volume during plastic deformation. Alloy softening occurred due to the formation of free volume during CR. X-ray photoelectron spectroscopy (XPS) confirmed the presence of oxides ZrO2, CuOx, and AlOx on the surface of the ribbons. The anodic polarization curves of the cast and R50 samples in solutions of NaCl and Na2SO4 (0.5 M) were obtained using potentiodynamic polarization measurements. Compared to CR ribbons, melt-spun ribbons after casting showed better corrosion resistance with lower anodic current densities in Na2SO4 solution.

1. Introduction

Metallic glass can be produced in the form of fast solidifying ribbons (usually about 30-μm thick) and bulk metallic glass (BMG) (thickness > 1 mm) [1]. Over the decades, many attempts have been made to develop strategies to overcome failure instability that limits metallic glass to low tensile and compressive ductility or low corrosion resistance. In essence, increasing the number of shear bands through improving the capacity for shear band formation is the main purpose of increasing deformability [2,3,4,5]. According to Spaepen’s and Argon’s research [6,7], plastic flow is the net balance between shear-induced atomic rearrangements that produce free volume (FV) and processes such as diffusion that remove FV. Shear band formation is typically referred to as the results of strain softening due to FV accumulation [3].
To understand the deformation mechanism and to analyze the relationship between the shear band of metallic glass and mechanical properties, it is necessary to understand some parameters of SBs, including the density of SBs, mean distance between SBs, and the intersection between SBs during severe plastic deformation [8]. It has been experimentally confirmed that a decrease in FV (due to structural relaxation) causes the material to become brittle. This increases hardness and modulus, reduces shear band formation capacity, and reduces fracture toughness [2].
Free volume is strongly related to the structural and mechanical properties of metallic glasses. For instance, as FV increases, Zr56Co28Al16 BMG may become less dense and have a higher Poisson’s ratio. Higher FV raises the plasticity of Cu45Zr48Al7 BMG [8]. As mentioned above, Spaepen proposed a model where the plastic deformation results from a large amount of the stress-driven creation of free volume by atomic jumps. The local distribution of free volume is thought to control the deformation, and the fertile sites with a higher free volume content can easily accommodate local shear strain that influences the structural and mechanical properties of the metallic glasses [9]. Free volume in the metallic glass is determined by positron annihilation spectroscopy (PAS), density measurements, and differential scanning calorimetry (DSC). Song et al. [10] showed that, for the reason of structural heterogeneities, micro-hardness of the as-cast and as-rolled specimens with a thickness reduction of 2.9% is 545 HV and 600 HV, respectively, after grinding and polishing the surface of the specimens. Meanwhile, Liu et al. [3] found that there was not any change in the surface hardness due to deformation, probably due to low shear band density.
Industrial use of new ZrCu-based BMG requires addressing the corrosion behavior of the BMG under a variety of environmental conditions. A ZrCu-based BMG corrosion study [11] found that BMG alloys show high corrosion resistance in H2SO4 solution, but weak corrosion resistance in 3% NaCl and 1 N HCl. Deformation also can affect the corrosion behavior of BMGs by producing SBs, stress fields, or other defects [12]. To know the mechanism of pitting corrosion, it is of researchers’ interest to enhance the corrosion resistance of BMG alloys in chloride solutions [11,12,13].
Various techniques have been found to boost the corrosion resistance of BMGs [11]: (1) changing the composition or structure of the surface by micro-arc oxidation, ion implantation, or other surface treatment techniques; (2) the corrosion resistance of Zr-based alloys is often increased by the reduction of FV; (3) the formation of a glass-matrix composite with the second phase by annealing; and (4) to add elements with strong passivation ability into the base alloy system.
To enhance the industrial application, the corrosion resistance of Zr-based BMG has received a great deal of attention in recent years. Zr-based BMGs have generally been found to exhibit better corrosion resistance than their crystalline counterparts in most aqueous solutions. On the other hand, some valve elements such as Nb and Ti can increase the corrosion resistance of the base glassy alloys [14].
Nb is a valve metal and, due to its strong passivation ability, forms a thin barrier surface film [14,15,16,17]. It increases the diffusion of Zr to the surface and suppresses the diffusion of Cu [18,19,20,21]. In the presence of Nb, a significant improvement of pitting resistance was found in the polarization test of a 3% NaCl and PBS solution. On the other hand, the addition of Nb shifted the corrosion potential in the positive direction at 1 N HCl. Qin et al. [11] reported that Nb addition to Cu–Hf–Ti BMG could enrich the passivation film not only in Nb but also in Hf and Ti while depleting the Cu.
For this work, the Zr50Cu44Al6 alloy was selected due to some excellent properties: (1) high glass-forming ability (GFA) up to 25 mm [11]; (2) excellent mechanical properties of yield strength ~1800 MPa and fracture strength ~2100 MPa; (3) good compressive plastic deformation of up to 15%; (4) relatively cheap raw materials (no expensive Pd and Pt elements); (5) it does not contain toxic elements (e.g., Be); and (6) suitable potential biocompatibility [11]. The justification for selecting Nb as an additional element was as follows: (1) Nb has a strong passivation ability and (2) refractory metals like Nb and Ta can increase the plasticity of Zr-based BMGs by micro-alloying [11].
In this study, the effects of cold rolling deformation and the presence of Nb on changes in free volume (FV), shear band density and spacing, hardness, and corrosion resistance of Zr50Cu44Al6 and Zr49.5Cu44Al6Nb0.5 ribbon samples were investigated. This showed an important role of the cold-rolling process and the composition within the basic research and technical application of MGs.

2. Materials and Methods

Ingots of the Zr50Cu44Al6 (hereafter A1) and Zr49.5Cu44Al6Nb0.5 (hereafter A2) BMG-forming alloys were selected for the sake of above mentioned reasons and were produced from high-purity elements (Zr (99.8%), Cu (99.99%), Nb (99.5%), and Al (99.99%)) in an Arc Melter ARC200 (ARCAST Company, Oxford, USA) under a high-purity Ti-gettered Argon atmosphere. Each alloy was turned upside down and remelted at least five times to ensure chemical uniformity. Ribbon samples with a thickness 30 µm were prepared using a Vacuum Melt Spinner DX-II (Dexing Magnet Tech. Co., Wuhua, China) with a silica nozzle and a Cu single roll.
The as-cast ribbon sample was sandwiched and sealed between the outer steel plates at the top and bottom with a thickness of 1.6 mm. A one-dimensional cold rolling process without changing the direction was applied in three thickness reductions (10%, 30%, and 50%) by multi-pass gradual reduction (0.02 mm per pass on steel plates) until the required degree of thickness reduction was reached. Then, the plates were cut and the exact degree of plastic strain and true plastic strain were determined by measurement of the thickness of the cold-rolled ribbons. The working roll diameter and roll speed were 80 mm and 13 rpm, respectively, (tangential speed of 0.055 m/s).
X-ray diffraction (XRD) with a monochromatic Cu Kα source was used to determine if crystallization occurred in the as-cast and CR samples. Measurements were performed in a 20° to 90° theta-theta configuration. A scanning electron microscope (SEM) was used to monitor the evolution of shear bands during cold rolling. FV changes were determined based on Archimedes density measurements to evaluate the structural changes associated with each amount of deformation. Density measurements were performed after ultrasonic cleaning of the ribbons by ViBRA AF analytical balance (Shinko Denshi Co., Tokyo, Japan) with diethyl phthalate as a working fluid. Each measurement was performed 10 times on each sample to reach a higher accuracy of density measurement. Vickers hardness was tested on the rolling surface of the sample using the Wolfert Wilson 402MVD Micro Hardness Tester 10 gf–2 kgf (WOLPERT Group, Bretzfeld-Schwabbach, Germany). Each reported hardness value was statistically processed from at least 10 indents.
Corrosion tests of the metallic glasses were conducted by potentiodynamic polarization measurements in two different solutions for comparison at 298 K open to the air. Na2SO4 and NaCl electrolytes were prepared as aqueous 0.5 M solutions from chemicals and distilled water. Electrochemical measurements were performed by Professional One-channel Potentiostats-Galvanostats P-40X (Electrochemical Instruments, Chernogolovka, Russia) in a three-electrode cell using a graphite counter electrode and a standard saturated Ag/AgCl reference electrode Potentiodynamic polarization curves were recorded at a scanning range from −200 mV to 500 mV relative to the open circuit potentials (OCP) and a potential sweep rate of 1 mV/s after immersing the specimens for approximately 30 min when OCP became nearly steady.
Surface X-ray photoelectron spectroscopy (XPS) analysis of cast and cold-rolled Zr50Cu44Al6 ribbon samples was conducted to investigate the oxidation status of the constituent elements of the oxide layer by the electron-ion spectroscopy module based on the Nano fab 25 (NT-MDT) platform (NT-MDT Co., Moscow, Russia) The analysis chamber used an ultra-high oil-free vacuum of approximately 10−6 Pa and a SPECS XR 50 X-ray source (SPECSGROUP, Berlin, Germany) without a monochromator in an Mg anode (1253.6 eV photons energy). All survey spectra scans were recorded at pass energy of 80 eV, and information on the chemical and phase composition of the layers was obtained by the analysis of peaks generated by elastically scattered electrons. The surface XPS spectrum over a wide binding energy region showed an XPS pattern containing Zr 3d, Cu 3p, Al 2p, O 1s, and C 1s. This indicated that the surface oxide film was composed of multiple chemical substances. Non-destructive chemical and phase depth profiling of nano-sized films during this study was performed based on Ref. [22].

3. Results

3.1. Structural Evolution by Cold Rolling

The formation of amorphous phases of the as-cast and cold-rolled samples was confirmed by the X-ray diffraction pattern (Figure 1). XRD patterns represent broad diffraction peaks from 30° to 50° 2θ angle, demonstrating the amorphousness of all the ribbons after the casting and rolling processes without crystalline phase.

3.2. Shear Band Formation

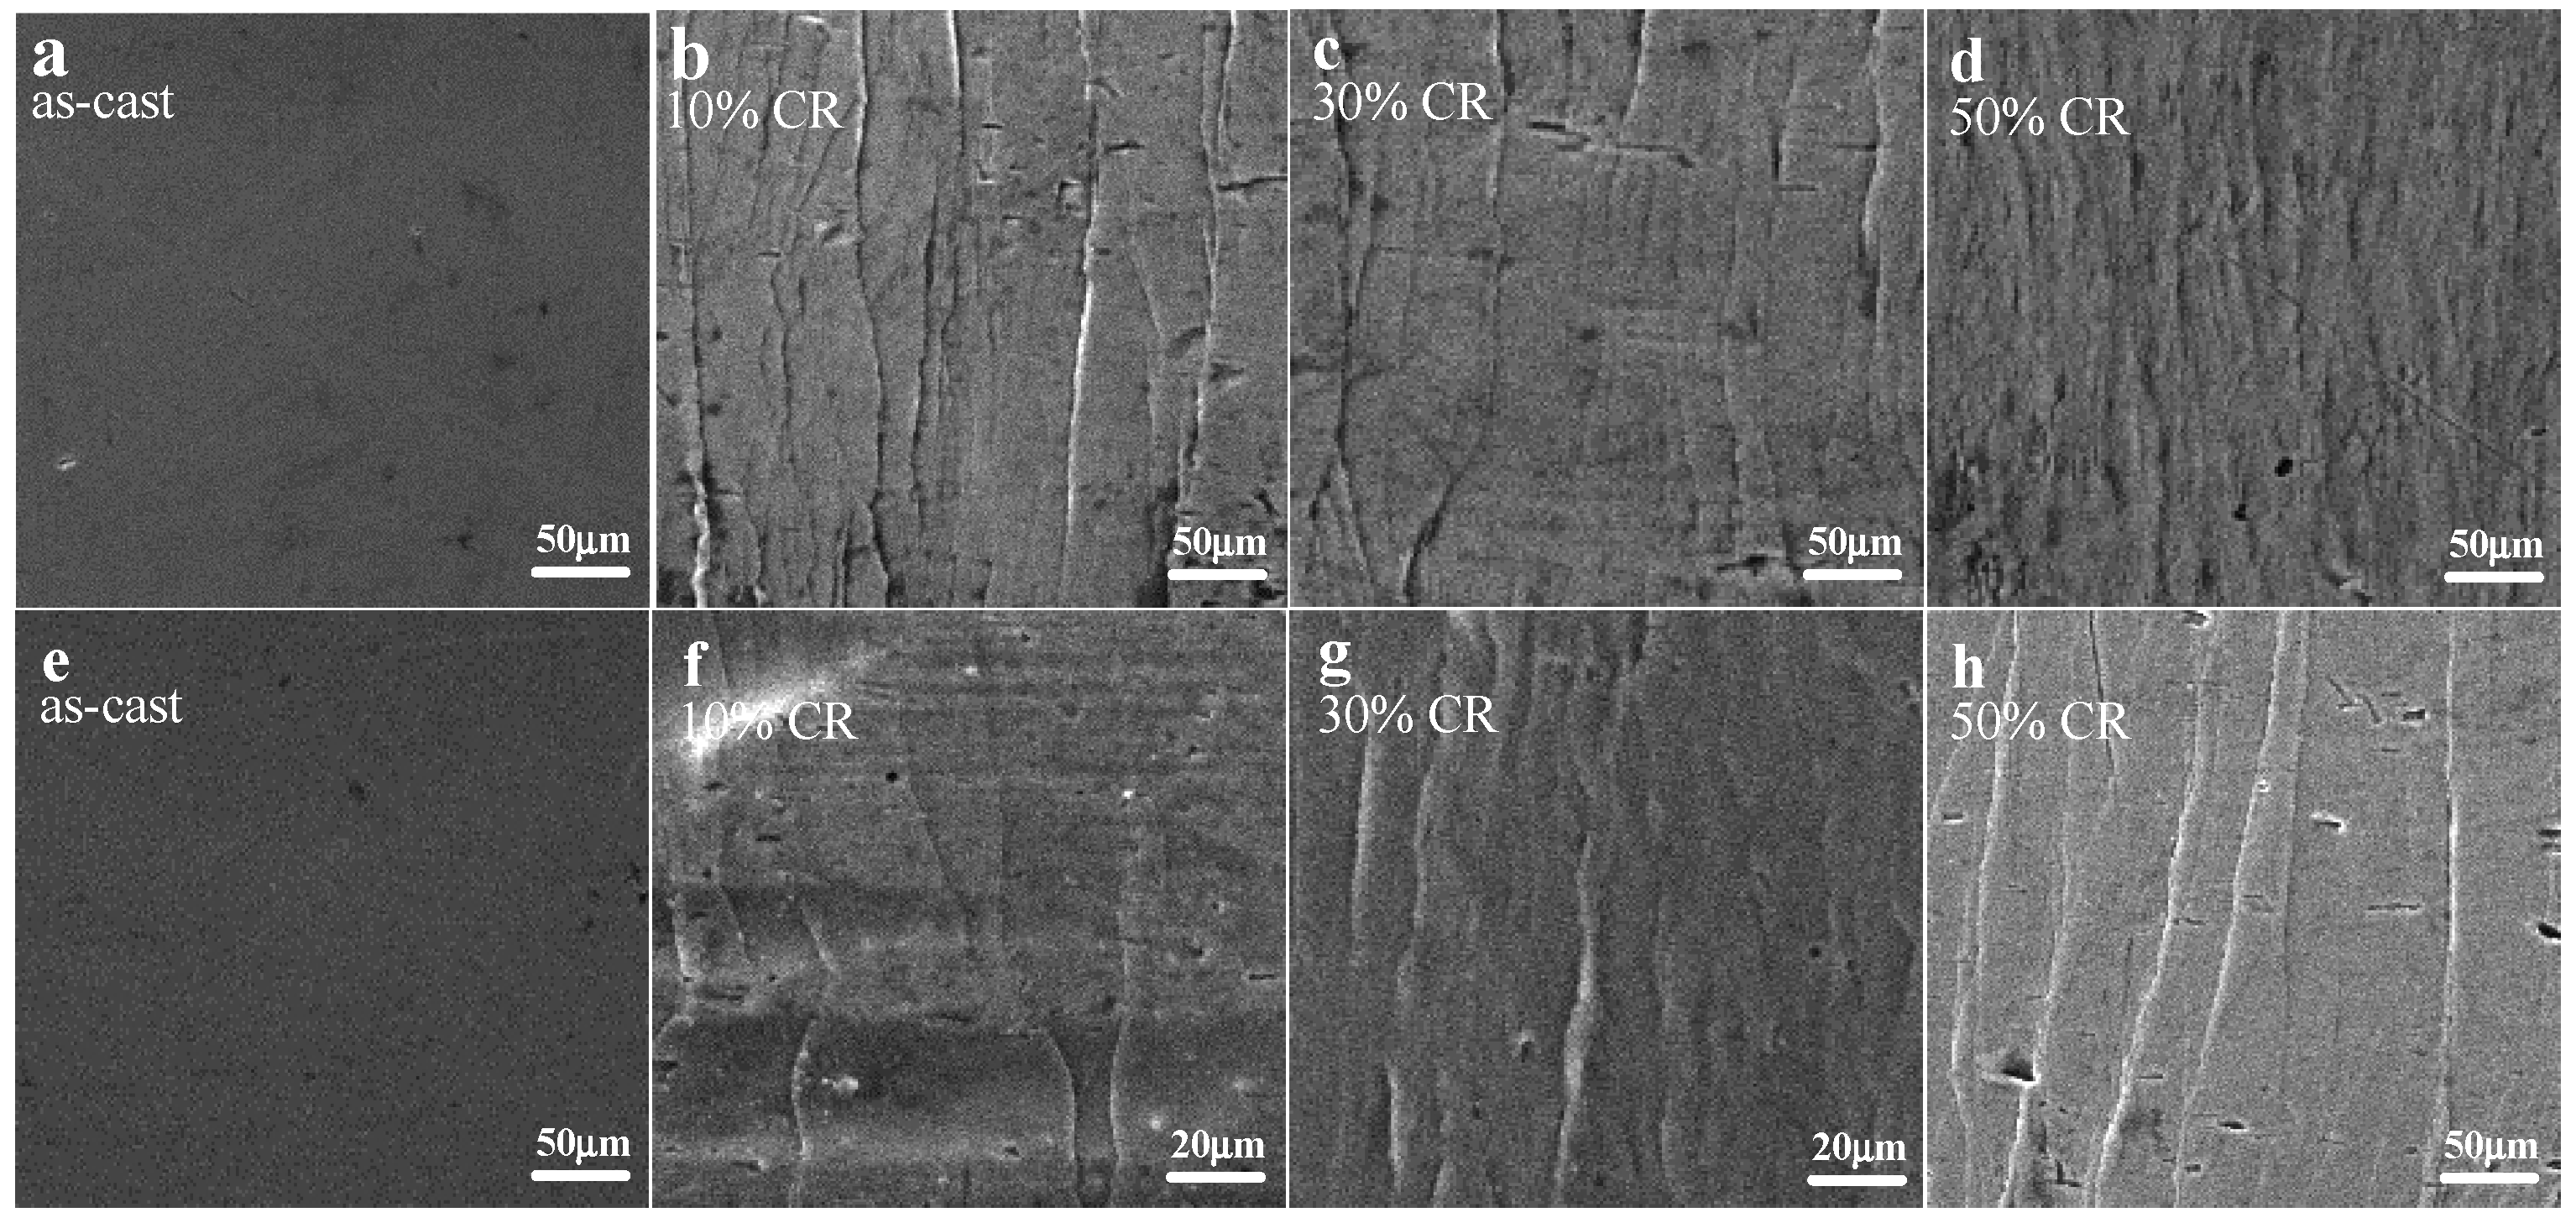
Plastic deformation during rolling caused the formation of multiple shear bands (SBs) [23]. Figure 2 shows the formation of the SBs on RT rolled ribbons with different thickness reductions.
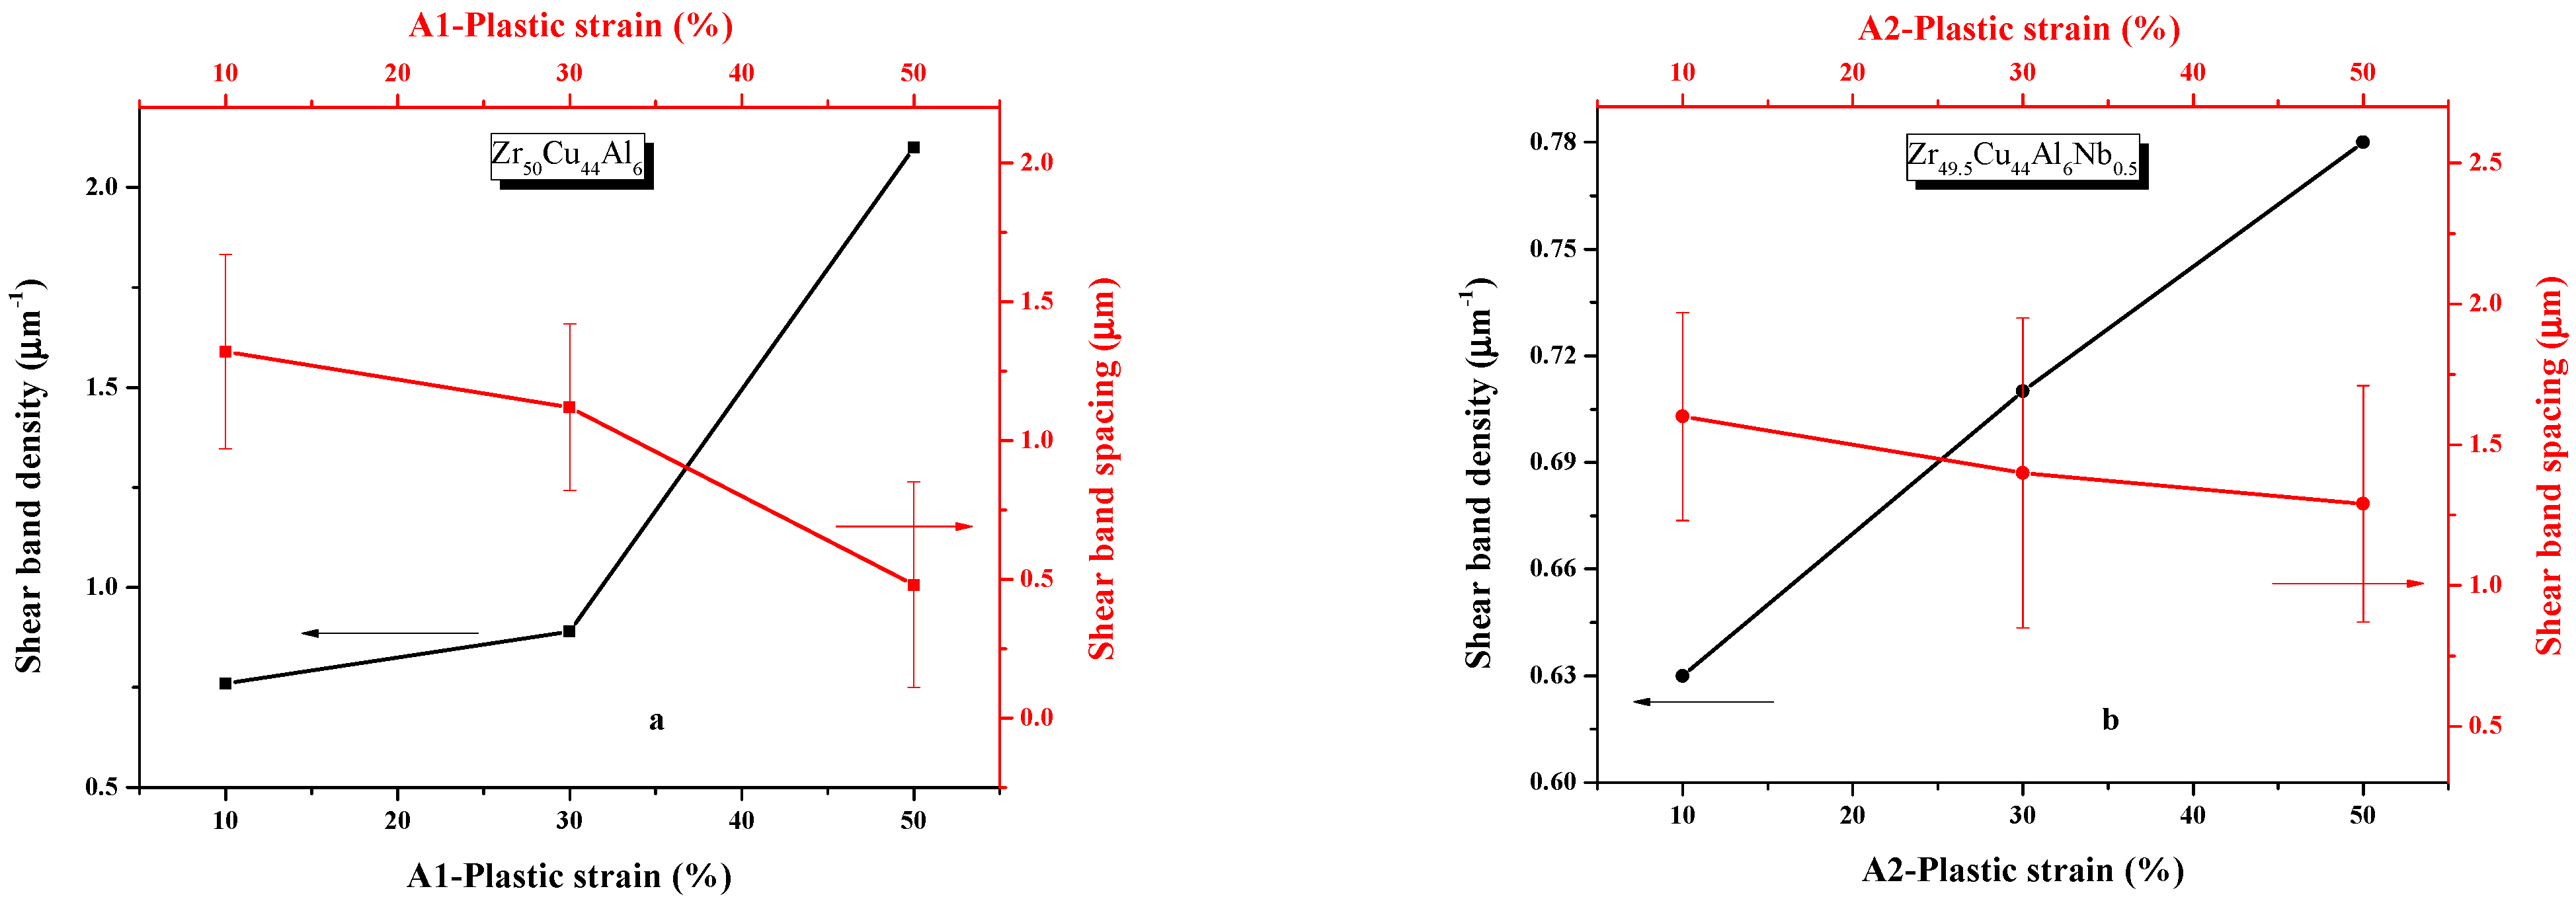
Additionally, the mean shear band spacing ( λ SB ) was calculated from at least 35 micrographs taken at different positions along the surface of samples at every thickness reduction. The average SB’s density ( ρ SB ) was considered as an inverse of the measured average SB’s spacing, according to Refs. [2,24]. Figure 3 shows the changes in SBs’ density and average SBs’ spacing with increasing plastic strain in order to achieve their comparison in two alloys. SBs’ density increased with increasing strain [25]. As can be distinguished in Figure 3, the SBs’ density trend of all ribbons was on the increase, as opposed to the SBs’ spacing.
As the plastic strain of the A1 and A2 alloys increased from 10% to 50%, the SBs’ density increased and the SBs’ spacing decreased. The SBs’ density and SBs’ spacing of A1 increased slightly with plastic strains within the range of 10% to 30%. However, after a strain of 30%, the change was sharp. However, the addition of 0.5 at% Nb changed the characteristic of SBs’ density/SBs’ spacing, which resulted in a nearly monotonic ascending/descending slope. Moreover, Nb reduced the maximum and minimum SBs’ density of A2 compared to A1 but increased the SBs’ spacing.

3.3. Characterization of the FV by Density Measurements

The change in material density was considered to be due to the change in FV. Therefore, the change in free volume per atomic volume Δ V f of the sample i was calculated as [26,27,28]:
( Δ V f ) i = ρ 0 ρ i ρ 0
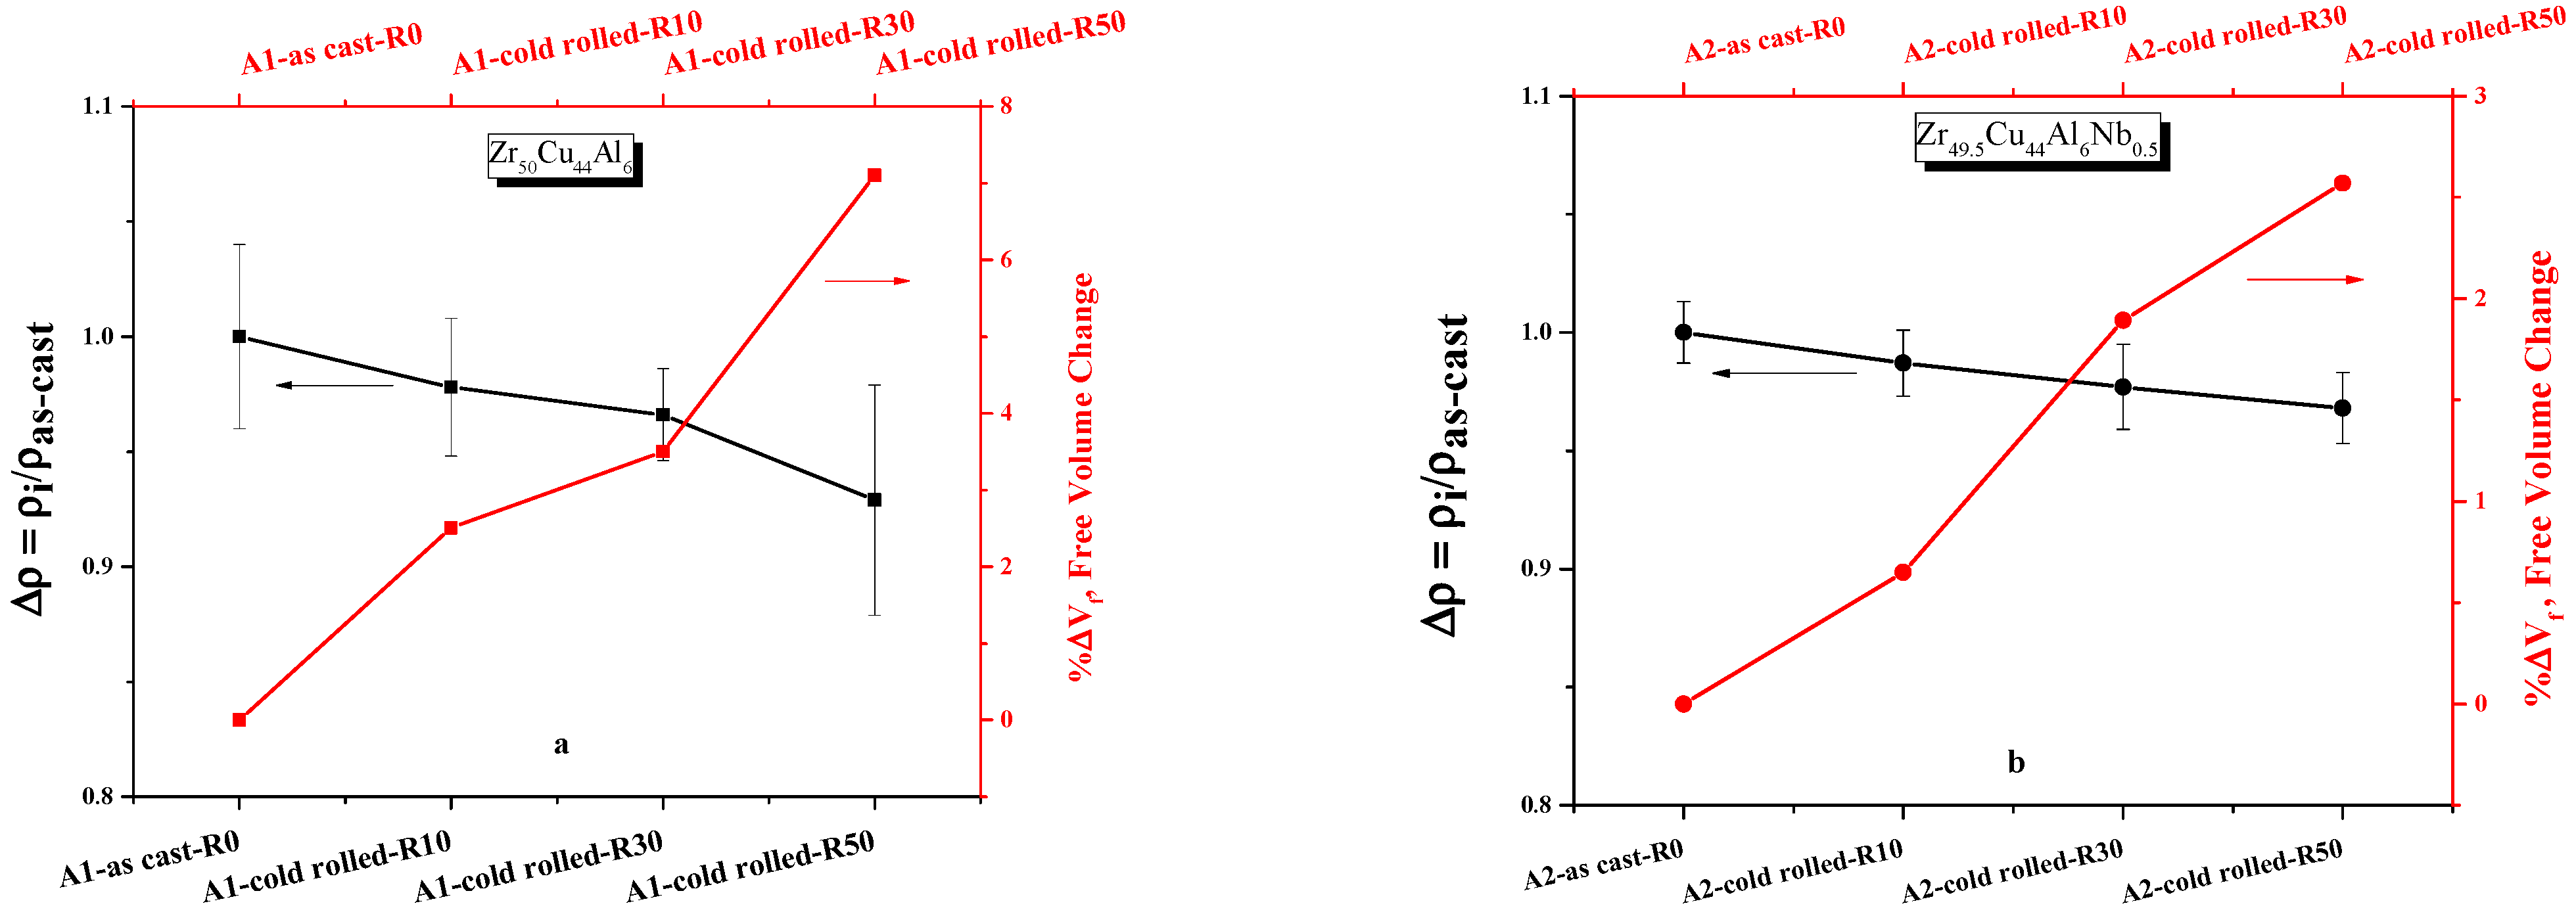
where ρ 0 is the density of the as-cast sample and ρ i is the density of the cold-rolled one. The temperature, pressure, and humidity requirements for measuring density by Archimedes’ principle are described in the Refs. [29,30]. Figure 4 shows the relation between Archimedes density and FV change in the cast and RT-rolled A1 and A2 ribbons and plastic strain. It is obvious that the densities of A1 and A2 over the entire range of plastic strain show a downward trend in both samples on the contrary FV changes.
The density of the A1 and A2 ribbons decreased as the plastic strain increased from 0% to 50%, whereas the change in FV increased in both samples. However, because of the presence of Nb, A2 showed a monotonous up/downslope of FV and density, respectively, together with strain, compared to A1. Nb reduced the maximum and minimum amount of FV change in A2 compared to A1. Comparing Figure 3 and Figure 4, one is able to see that the SBs’ density and FV change increased with plastic strain over the entire range in A1 and A2, but these values were lower for ribbons A2 than A1. This implies that the lower the SBs’ density, the less the FV change.

3.4. Change in Hardness Due to Cold Rolling

Figure 5 shows the micro-hardness of the as-cast and rolled pieces plotted against the plastic strain. The Vickers hardness of alloy A1 (black line) decreased from 426 HV (R0) to 362 HV (R50). The Vickers hardness number of alloy A2 (red line) decreased from 433 HV (R0) to a minimum of 377 HV at R50, corresponding to a relative decrease of about 12.9%.
The hardness difference between R0 and R10 samples was lower than that between the R30 and R50 ones. The main reason for this behavior is the work softening due to the creation of a large amount of free volume. This issue is addressed in the Section 4.
Figure 6 shows the measured hardness as a function of the average SB’s density, SB’s spacing, and free volume change (%ΔVf) measured in this study. Since the deformation mechanism of the rolled sample was the formation and propagation of SBs, the hardness of the rolled sample was greatly affected by the presence and properties of the shear bands [2].
The measured micro-hardness decreased with increasing SBs’ density and plastic deformation in both samples, as opposed to SBs’ spacing. As shown in Figure 6a,b, the hardness values of A1 and A2 changed from 431 HV to 362 HV and from 429 HV to 377 HV, respectively, as the SBs’ density and plastic strain increased. The SBs’ spacing showed a decreasing trend.
Figure 6c indicates the hardness of all ribbons decreased with FV change at different plastic strains. It is clear that when the plastic strain increased to 50%, more FV was introduced in sample A1, which was about 2.5 times that of A2.

3.5. Corrosion Measurements

Figure 7 shows the anodic polarization curves of the as-cast and R50 of A1 and A2 alloy samples, which were obtained in 0.5 M NaCl and 0.5 M Na2SO4 solutions open to air at 298 K.
As is clear from Figure 7a, the anodic current density of cold-rolled ribbons in 0.5 M NaCl solution increased rapidly with slight anodic polarization due to general corrosion. However, as-cast samples showed lower anodic current densities, resulting in improved corrosion resistance. Furthermore, the presence of Nb in the as-cast A2 alloy was effective in reducing the anodic current density. It is worth noting that cold-rolled alloys showed a slight nobler corrosion potential. Several corrosion-related parameters including corrosion potential (Ecorr) and corrosion current density (icorr) were identified and are summarized in Table 1.
Similar to the curve in Figure 7a, the as-cast samples (R0) of curves in Figure 7b in 0.5 M Na2SO4 solution showed a lower anodic current density, leading to improved corrosion resistance. A2-R0 samples within the presence of Nb showed low passive current densities. The anodic current density of the cold-rolled samples showed a higher value and an interesting shift of potential to the right, i.e., nobler corrosion potential. Generally, all as-cast ribbons showed lower anodic current densities compared to cold-rolled ribbons. Table 1 shows that the Na2SO4 solution had a less corrosive effect on these alloys. XPS was performed to explain the shift of the curves to a nobler corrosion potential.
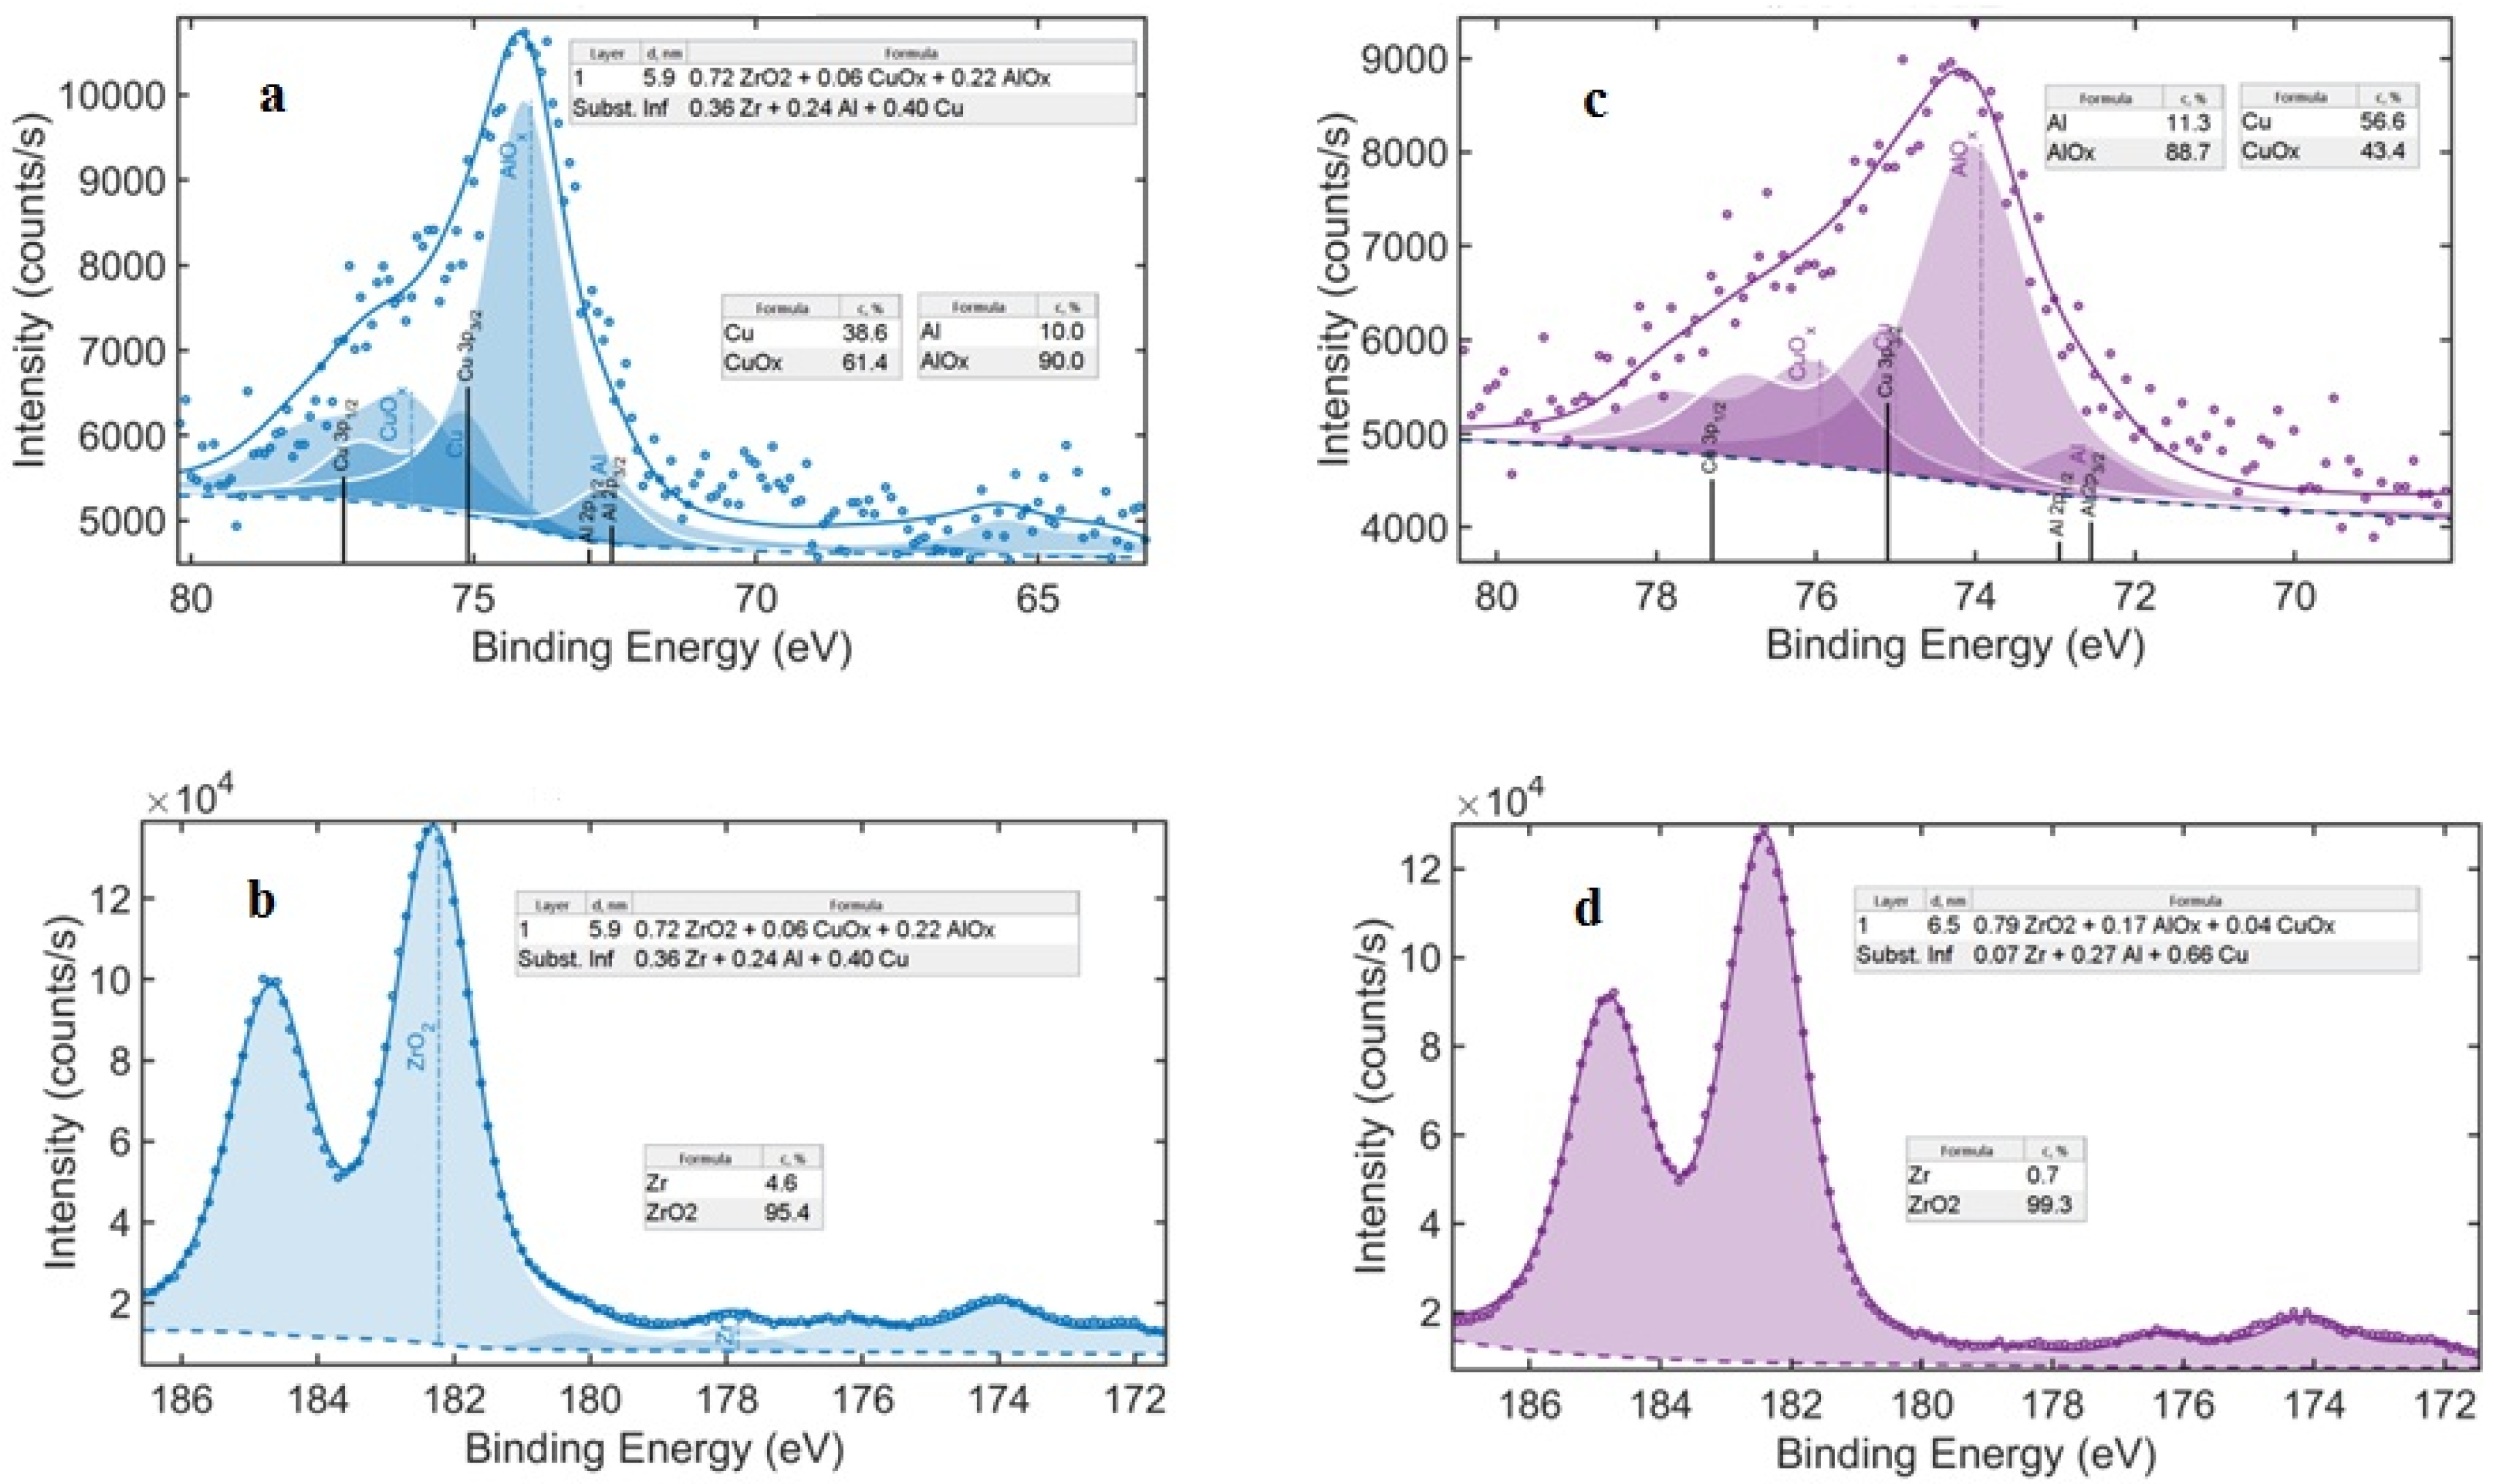
As can be distinguished from the XPS results in Figure 8 and Table 2, the surface XPS spectrum over a wide binding energy region indicated that the surface oxide film formed on the metallic glasses at the corrosive environment was composed of multiple chemical substances. The thickness of these surface films was 5.9 nm and 6.5 nm for A1-R0 and A1-R50, respectively. Quantitative analysis of the Zr 3d spectrum demonstrated that the Zr element content of the native oxide layer of A1-R50 MGs was 7 at%, which was much lower than the as-cast MGs of about 36 at%. This tendency was the opposite for Cu. In other words, the total content of Cu elements in the oxide layer increased from 40 at% at A1-R0 to 66 at% at R50. The formation of full oxide Zr4+ in the stoichiometric ZrO2 was found in both alloys.
Table 2 summarizes the chemical and phase depth profiling of the nano-sized oxide films, formed on the surface of the corroded A1 ribbon with thickness reductions of 0 and 50.

4. Discussion

4.1. Shear Band Evolution

To study the formation of the shear bands within the plastic deformation of A1 and A2 ribbon samples, a cold-rolling process was applied to the samples. Shear band evolution during different plastic strains was studied by SEM observations (Figure 2). According to Figure 3, the shear band density increased continuously with the thickness reduction. It is interesting to notice that the shear band densities measured during this study agreed well with the values reported by Liu et al. [3], who performed one-dimensional cold rolling of Zr-based BMGs of varied compositions. Additionally, the present results are consistent with the values published by Bei et al. [31], who measured the density of the shear bands as a function of the true plastic strain of Zr-based BMG. In addition to the previously formed shear bands, some secondary fine shear bands with narrow spaces were seen, especially within the deformed A1 sample above R30. When intersections between the primary and secondary shear bands were strengthened, very high plastic strain resulted in strain hardening [8,32]. A few secondary fine shear bands reduced the downward hardness slope of A1 in the range of 30% to 50% in comparison to A2. That is why the slope of hardness change of A1 was a smaller amount than A2 from 30% to 50%.

4.2. Free Volume Changes

Since it is not easy to determine the absolute amount of FV, the density change due to structural rearrangement was used to evaluate the difference in FV of the glassy structure. The relevance between density and excess FV stored in the material was first proposed in the Ref. [2] and lately experimentally justified by others [26]. As shown in Figure 4, a decrease in Archimedes density and a continuous increase in FV from R10 to R50 was observed.
Based on the FV model, the formation of SBs always involves the creation of FV. Shear localization of metallic glass was the result of the accumulation of FV in the shear band, which reduced viscosity and ultimately led to strain/thermal softening [23]. Theoretical and experimental results, including the results of atomic simulations, TEM investigations, DSC analysis, and in-situ acoustic emission spectroscopy, showed that the shear bands had more FV compared to the undeformed metallic glass matrix [8]. Therefore, regular studies of FV changes due to plastic strain and quantification of absolute FV content are important to understand the structure and properties of deformed BMG [8]. O. Haruyama et al. [33] measured changes in density and specific volume of as-cast/cold-rolled Zr55Cu30Ni5Al10. As the thickness reduction increased throughout the range, the volume increased. They pointed out that this increase in volume was similar to the increase in the shear band density observed on the lateral surface of cold-rolled specimens. The similarity between the change in the shear band density and the increase in volume showed that the amount of FV generated during cold rolling was closely related to the density of the shear bands in the structure [33]. Therefore, the FV content of the deformed metallic glasses increased with increasing density of the shear band, further affecting the structure and properties of the deformed metallic glasses [8,25,33].

4.3. Changes in Hardness Due to Plastic Strain

Figure 5 shows that the hardness of the A1 and A2 samples decreased with plastic strain. The main reason for this behavior was the work-softening due to the creation of a large amount of free volume [34]. As shown in Figure 6, the micro-hardness of the A1 and A2 ribbons decreased with increasing SBs’ density. The deformation mechanism of the rolled samples was the formation and propagation of the shear bands. The presence of the shear bands reduced the strength of metallic glasses by creating places for more plastic flow [35]. Spaepen et al. first introduced the FV model to elucidate the deformation mechanism of metallic glass. They pointed out that the generation and annihilation of FV may be competing processes during plastic flow [6]. Because shear bands have more FV than the undeformed matrix, the mechanical properties of BMG are closely associated with the FV content, and, therefore, the hardness of BMG is inversely related to the FV content [6,34]. Tang et al. [36] also noted that the decrease in hardness is mainly due to excessive FV within the shear bands. It is known that increasing FV can reduce the flow stress and hardness of metallic glasses [8]. The increase in FV reduces the barrier to atomic mobility within metallic glasses by providing SBs’ nucleation sites. This may result in a reduction in the resistance to further plastic deformation and cause low flow stress of a metallic glass. Therefore, a large amount of FV around the atom is expected to soften the modulus of elasticity of the amorphous alloy by increasing the internal atomic distance and reducing the atomic bonding force [5]. In other words, the higher the FV, the higher the plasticity of these BMGs [10,37]. The results in Figure 6 are in good agreement with the above considerations.

4.4. Corrosion Investigation

The corrosion resistance of metallic glasses is often associated with the formation of passivation films on reactive alloy substrates [38]. Zr, as an example of valve metals, forms a thin, passive, barrier-type layer with low ionic and electrical conductivity. Compared to other metastable (quasi-crystal, nano-crystal) and stable crystalline alloys, Zr-based amorphous alloys show the most effective anodic passivity [38,39]. However, for different Zr-based BMGs, susceptibility to pits caused by chloride and a low re-passivation ability was detected, e.g., in Zr55Al10Cu30Ni5, Zr65Al7.5Ni10Cu17.5, Zr59Ti3Cu20Al10Ni8, and Zr52Ti5Cu17.9Ni14.6Al10 and for various Nb-containing alloys [39]. The crystalline inclusions of physical defects in cast BMG samples, which act as preferred surface sites with higher energy for chloride attack, are the most probable explanation for the low pitting resistance [39].
Adding Nb to the glassy alloys increased corrosion potential and decreased anodic current density in both corrosion solutions (Figure 7a,b) and improved corrosion resistance. Within the electrochemical force series, the standard reduction potentials of Zr, Cu, and Al were −1.553 V, +0.521 V, and −1.662 V, respectively [40], indicating that Cu is nobler than Zr and Al. The pit growth mechanism involved the selective dissolution of Zr and Al, resulting in local Cu enrichment within the pit region. Next, Cu interacted locally with chloride ions to form CuCl, which then hydrolyzed to form Cu2O. The effect of galvanic coupling with the local presence of Cu-rich species caused local dissolution of the glassy phase, thus leading to the low passivation ability of Zr-based BMG. This could be understood as follows. In the Zr-Cu-Al ternary system, Zr, Cu, and Al had a large negative enthalpy of mixing and strong interatomic bonding ability [40]. The enthalpy of mixing of Nb–Zr, Nb–Cu, and Nb–Al atomic pairs were +4, +3, and −18 kJ/mol [11,41], respectively. These indicated that Nb with a standard reduction potential −1.1 V [40] bonded more easily to Al than Cu and Zr and tended to replace Zr in the Zr-based MGs [42]. Nb is a valve-metal and forms barrier surface films due to its strong passivity [11,14,16,17], facilitating the diffusion of Zr onto the surface and suppresses diffusion of Cu [19,21]. As a result, the as-cast A2 ribbon samples exhibited better corrosion resistance.
As mentioned earlier, no phase transformation occurred in the studied specimens during the rolling process. Therefore, the possibility of Nano-crystallization due to deformation or the structure heterogeneity, which led to a decrease in corrosion resistance, was ruled out. So, what are the factors that make the corrosion resistance of samples worse? Deformation-induced FV as a structural defect not only affects mechanical and physical properties but also influences corrosion behavior [43]. Here, density measurement was used to determine the FV content in the ribbons. In this work, by increasing the plastic strain from 10% to 50%, more FV was applied to the rolled specimens. The entry of FV into the shear bands increased the mean atomic distance, enhanced the atomic mobility and chemical activity, and made it more susceptible to chemical attack. As a result, the shear band was the active site of pitting corrosion, which has been observed in Zr-based systems [43].
To investigate the oxidation states of the constituent elements within the native oxide layer, surface XPS analysis of the as-cast and cold-rolled Zr-based MGs was performed. As shown in Table 2, the Zr content in the native oxide layer A1-R50 MGs was less than A1-R0. This phenomenon is well related to the formation of a Cu-depleted zone at the interface of the oxide–metallic glassy matrix. Cu moved to the oxide, and Zr, as an example of valve metals that has to form a thin passive and barrier-type layer, diffused towards the metallic glass phase. As a result, the corrosion current density (icorr) of the R50-ribbons increased, and, therefore, the corrosion curves moved up.
On the opposite hand, Table 2 shows that the presence of Zr within the native oxide layer of R50 MGs had the highest oxidation state and formed ZrO2 (99.3 at%), which was more than R0 (ZrO2 95.4 at%). In the authors’ best knowledge, this can be the explanation for the interesting shift of corrosion curves of R50-ribbons in Figure 7 to the right, i.e., the more noble corrosion potential. To clarify this phenomenon, during cold rolling, the deformation created many shear band offsets (steps), which added new, excessive, bare surfaces to the whole areas. It seems that they had a high potential to take part in the corrosion process and formation of new protective oxide. According to the XPS results, ZrO2- and AlOx-enriched oxide film existed on the top surface of the oxidized sample. This may have been due to the preferential oxidation of Zr and Al. It was obvious that Zr and Al had lower electronegativity (1.33 and 1.5, respectively) compared to Cu (1.9), which implies the higher reactivity of Al and Zr. Therefore, it was more favorable for Zr and Al to form bonds with other elements [44]. Additionally, the heat of formation of ZrO2 and Al2O3 was −1095 and −1675 kJ/mol, respectively, which was much higher than the heat of formation of copper oxide (−154 kJ/mol). Therefore, Zr and Al had a higher chemical affinity for oxygen than Cu, and the formation of ZrO2 and Al2O3 was energetically preferable [44,45]. On the other hand, a local increase in free volume and significant shear-induced atomic rearrangements of local structures in cold-rolled samples also may explain the accelerated movement of chemical elements. This enabled other elements such as Zr and oxygen to easily move in the loose free volume region. These results represent an important advancement within the knowledge of surface oxides and open relation between newly formed, thin oxides and changes in ribbon surface morphology due to the shear bands.

5. Conclusions

In this study, the authors investigated the shear band evolution, free volume, micro-hardness, and corrosion behavior of the as-cast and RT cold-rolled Zr50Cu44Al6 and Zr49.5Cu44Al6Nb0.5 MGs alloys. Plastic deformation during rolling caused the formation of SBs. In the deformed Zr50Cu44Al6 sample, in addition to the previously formed shear bands, there were some fine shear bands with narrow spacing, especially when the plastic strain exceeded 30%. This increased the possibility of the shear bands to intersect. On the other hand, 0.5 at% of Nb reduced the free volume change in Zr49.5Cu44Al6Nb0.5. The decrease in Archimedes density and, therefore, the continuous increase in FV changes were the results of plastic strain from 10% to 50%. The number of SBs’ density and FV change increased over the whole range of plastic strain of both alloys. On the opposite hand, these values were low within the presence of Nb. The presented results indicate a decrease in hardness because of FV increase at various plastic strains. This implies that the rise in FV reduced the atomic mobility barrier of metallic glasses by providing SBs’ nucleation sites. It reduced resistance to further plastic deformation, leading to low flow stress and hardness of MGs. The addition of Nb to the as-cast glassy alloys showed nobler corrosion potential and lower anodic current density and improved corrosion resistance as well. According to thermodynamics, Zr has a high chemical affinity for oxygen, and also the formation of ZrO2 is preferable from the viewpoint of energy. Therefore, the formation of new ZrO2 partial oxides on the surfaces due to the offset of shear bands can shift the corrosion curves of ribbons R50 to the nobler corrosion potential.

Author Contributions

Conceptualization, methodology, investigation, writing—original draft, A.A.; investigation, D.A.M., E.N.Z., M.S.P., V.V.C. and A.L.; writing—review and editing, supervision, A.I.B. All authors have read and agreed to the published version of the manuscript.

Funding

This research was funded by the Ministry of Education and Science of the Russian Federation within the framework of the Increase Competitiveness Programs of MISiS, the Center for Collective Use “Materials Science and Metallurgy” with the financial support of the Russian Federation represented by the Ministry of Education and Science (13.CKP.21.0033) and Andrey Bazlov supported from the RFBR, project number 19-33-60078.

Data Availability Statement

Not applicable.

Acknowledgments

The authors are sincerely grateful to D.V. Louzguine-Luzgin (WPI Advanced Institute for Materials Research, Tohoku University, Sendai 980-8577, Japan) for assistance in scientific discussion.

Conflicts of Interest

The authors declare no conflict of interest.

References

  1. Vishwanadh, B.; Abraham, G.J.; Neogy, S.; Dutta, R.S.; Dey, G.K. Effect of structural defects, surface irregularities, and quenched-in defects on corrosion of Zr-based metallic glasses. Metall. Mater. Trans. A 2009, 40, 1131–1141. [Google Scholar] [CrossRef]
  2. Stolpe, M.; Kruzic, J.J.; Busch, R. Evolution of shear bands, free volume and hardness during cold rolling of a Zr-based bulk metallic glass. Acta Mater. 2014, 64, 231–240. [Google Scholar] [CrossRef]
  3. Liu, J.W.; Cao, Q.P.; Chen, L.Y.; Wang, X.D.; Jiang, J.Z. Shear band evolution and hardness change in cold-rolled bulk metallic glasses. Acta Mater. 2010, 58, 4827–4840. [Google Scholar] [CrossRef]
  4. Hubek, R.; Hilke, S.; Davani, F.A.; Golkia, M.; Shrivastav, G.P.; Divinski, S.V.; Rösner, H.; Horbach, J.; Wilde, G. Shear bands in monolithic metallic glasses: Experiment, theory, and modeling. Front. Mater. 2010, 7, 1–13. [Google Scholar] [CrossRef]
  5. Tan, J.; Zhang, Y.; Sun, B.A.; Stoica, M.; Li, C.J.; Song, K.K.; Kühn, U.; Pan, F.S.; Eckert, J. Correlation between internal states and plasticity in bulk metallic glass. Appl. Phys. Lett. 2011, 98, 151906. [Google Scholar] [CrossRef]
  6. Spaepen, F. A microscopic mechanism for steady state inhomogeneous flow in metallic glasses. Acta Metall. 1977, 25, 407–415. [Google Scholar] [CrossRef]
  7. Argon, A.S. Plastic deformation in metallic glasses. Acta Metall. 1978, 27, 47–58. [Google Scholar] [CrossRef]
  8. Shi, B.; Xu, Y.; Li, C.; Jia, W.; Li, Z.; Li, J. Evolution of free volume and shear band intersections and its effect on hardness of deformed Zr64.13Cu15.75Ni10.12Al10 bulk metallic glass. J. Alloys Compd. 2016, 669, 167–176. [Google Scholar] [CrossRef]
  9. Brechtl, J.; Xie, X.; Wang, Z.; Qiao, J.; Liaw, P.K. Complexity analysis of serrated flows in a bulk metallic glass under constrained and unconstrained conditions. Mater. Sci. Eng. A 2020, 771, 138585. [Google Scholar] [CrossRef]
  10. Song, K.K.; Pauly, S.; Zhang, Y.; Scudino, S.; Gargarella, P.; Surreddi, K.B.; Kühn, U.; Eckert, J. Significant tensile ductility induced by cold rolling in Cu 47.5Zr47.5Al5 bulk metallic glass. Intermetallics 2011, 19, 1394–1398. [Google Scholar] [CrossRef]
  11. Nie, X.P.; Xu, X.M.; Jiang, Q.K.; Chen, L.Y.; Xu, Y.; Fang, Y.Z.; Xie, G.Q.; Luo, M.F.; Wu, F.M.; Wang, X.D.; et al. Effect of microalloying of Nb on corrosion resistance and thermal stability of ZrCu-based bulk metallic glasses. J. Non Cryst. Solids 2009, 355, 203–207. [Google Scholar] [CrossRef]
  12. Nie, X.P.; Cao, Q.P.; Wu, Z.F.; Ma, Y.; Wang, X.D.; Ding, S.Q.; Jiang, J.Z. The pitting corrosion behavior of shear bands in a Zr-based bulk metallic glass. Scr. Mater. 2012, 67, 376–379. [Google Scholar] [CrossRef]
  13. Jiang, W.H.; Jiang, F.; Green, B.A.; Liu, F.X.; Liaw, P.K.; Choo, H.; Qiu, K.Q. Electrochemical corrosion behavior of a Zr-based bulk-metallic glass. Appl. Phys. Lett. 2007, 91, 041904. [Google Scholar] [CrossRef]
  14. Liu, L.; Qiu, C.L.; Zou, H.; Chan, K.C. The effect of the microalloying of Hf on the corrosion behavior of ZrCuNiAl bulk metallic glass. J. Alloys Compd. 2005, 399, 144–148. [Google Scholar] [CrossRef]
  15. Raju, V.R.; Kühn, U.; Wolff, U.; Schneider, F.; Eckert, J.; Reiche, R.; Gebert, A. Corrosion behaviour of Zr-based bulk glass-forming alloys containing Nb or Ti. Mater. Lett. 2002, 57, 173–177. [Google Scholar] [CrossRef]
  16. Gebert, A.; Gostin, P.F.; Uhlemann, M.; Eckert, J.; Schultz, L. Interactions between mechanically generated defects and corrosion phenomena of Zr-based bulk metallic glasses. Acta Mater. 2012, 60, 2300–2309. [Google Scholar] [CrossRef]
  17. Gebert, A.; Concustell, A.; Greer, A.L.; Schultz, L.; Eckert, J. Effect of shot-peening on the corrosion resistance of a Zr-based bulk metallic glass. Scr. Mater. 2010, 62, 635–638. [Google Scholar] [CrossRef]
  18. Qin, C.; Asami, K.; Zhang, T.; Zhang, W.; Inoue, A. Corrosion behavior of Cu-Zr-Ti-Nb bulk glassy alloys. Mater. Trans. 2003, 44, 749–753. [Google Scholar] [CrossRef] [Green Version]
  19. Mudali, U.K.; Baunack, S.; Eckert, J.; Schultz, L.; Gebert, A. Pitting corrosion of bulk glass-forming zirconium-based alloys. J. Alloys Compd. 2004, 377, 290–297. [Google Scholar] [CrossRef]
  20. Baunack, S.; Mudali, U.K.; Gebert, A. Characterization of oxide layers on amorphous Zr-based alloys by Auger electron spectroscopy with sputter depth profiling. Appl. Surf. Sci. 2005, 252, 162–166. [Google Scholar] [CrossRef]
  21. Qin, C.L.; Zhang, W.; Zhang, Q.S.; Asami, K.; Inoue, A. Electrochemical properties and surface analysis of Cu-Zr-Ag-Al-Nb bulk metallic glasses. J. Alloys Compd. 2009, 483, 317–320. [Google Scholar] [CrossRef]
  22. Lubenchenko, A.V.; Batrakov, A.A.; Pavolotsky, A.B.; Lubenchenko, O.I.; Ivanov, D.A. XPS study of multilayer multicomponent films. Appl. Surf. Sci. 2018, 427, 711–721. [Google Scholar] [CrossRef] [Green Version]
  23. Scudino, S.; Surreddi, K.B.; Eckert, J. Mechanical properties of cold-rolled Zr 60Ti 5Ag 5Cu 12.5Ni 10Al 7.5 metallic glass. Phys. Status Solidi 2010, 207, 1118–1121. [Google Scholar] [CrossRef]
  24. Song, S.X.; Nieh, T.G. Direct measurements of shear band propagation in metallic glasses—An overview. Intermetallics 2011, 19, 1968–1977. [Google Scholar] [CrossRef]
  25. Xu, Y.; Shi, B.; Ma, Z.; Li, J. Evolution of shear bands, free volume, and structure in room temperature rolled Pd40Ni40P20 bulk metallic glass. Mater. Sci. Eng. A 2015, 623, 145–152. [Google Scholar] [CrossRef]
  26. Slipenyuk, A.; Eckert, J. Correlation between enthalpy change and free volume reduction during structural relaxation of Zr55Cu30Al10Ni 5 metallic glass. Scr. Mater. 2004, 50, 39–44. [Google Scholar] [CrossRef]
  27. Suryanarayana, C.; Inoue, A. Bulk Metallic Glasses; Taylor and Francis Group: Boca Raton, FL, USA, 2011; pp. 265–273. [Google Scholar]
  28. Zhang, Y.; Hahn, H. Characterization of the free volume in a Zr45.0Cu 39.3Al7.0Ag8.7 bulk metallic glass by reverse Monte Carlo simulation and density measurements. J. Non Cryst. Solids 2011, 357, 1420–1425. [Google Scholar] [CrossRef]
  29. Lee, K.S.; Lee, J.-H.; Eckert, J. On the structural relaxation of bulk metallic glass under warm deformation. Intermetallics 2009, 17, 222–226. [Google Scholar] [CrossRef]
  30. Nowosielski, R.; Januszka, A. Structure and density of Fe 36 Co 36 B 19.2 Si 4.8 Nb 4 bulk glassy alloy. J. Achiev. Mater. Manuf. Eng. 2012, 52, 67–74. [Google Scholar]
  31. Bei, H.; Xie, S.; George, E.P. Softening caused by profuse shear banding in a bulk metallic glass. Phys. Rev. Lett. 2006, 96, 105503. [Google Scholar] [CrossRef]
  32. Gonzaález, S.; Chen, N.; Zhang, Q.S.; Louzguine-Luzgin, D.V.; Perepezko, J.H.; Inoue, A. Effect of shear bands initiated in the pre-yield region on the deformation behaviour of Zr-based metallic glasses. Scr. Mater. 2011, 64, 713–716. [Google Scholar] [CrossRef]
  33. Haruyama, O.; Kisara, K.; Yamashita, A.; Kogure, K.; Yokoyama, Y.; Sugiyama, K. Characterization of free volume in cold-rolled Zr55Cu 30Ni5Al10 bulk metallic glasses. Acta Mater. 2013, 61, 3224–3232. [Google Scholar] [CrossRef]
  34. Zheng, Q.; Chen, D.; Zhang, L.K.; Zhao, X.Y.; Zhang, A.L. Effect of ceramic rolling on the mechanical properties of Zr54Cu38Al8 bulk metallic glass. Mater. Sci. Eng. A 2014, 592, 64–69. [Google Scholar] [CrossRef]
  35. Zhang, P.N.; Li, J.F.; Hu, Y.; Zhou, Y.H. Effect of rolling on the microstructure and mechanical property of Zr52.5Cu17.9Ni14.6Al10Ti5 bulk metallic glass. J. Alloys Compd. 2008, 462, 88–93. [Google Scholar] [CrossRef]
  36. Tang, C.; Li, Y.; Zeng, K. Characterization of mechanical properties of a Zr-based metallic glass by indentation techniques. Mater. Sci. Eng. A 2004, 384, 215–223. [Google Scholar] [CrossRef]
  37. Wang, T.; Wu, Y.; Si, J.; Liu, Y.; Hui, X. Plasticizing and work hardening in phase separated Cu-Zr-Al-Nb bulk metallic glasses by deformation induced nanocrystallization. Mater. Des. 2018, 142, 74–82. [Google Scholar] [CrossRef]
  38. Scully, J.R.; Gebert, A.; Payer, J.H. Corrosion and related mechanical properties of bulk metallic glasses. J. Mater. Res. 2007, 22, 302–313. [Google Scholar] [CrossRef]
  39. Gebert, A.; Gostin, F.; Kühn, U.; Schultz, L. Corrosion of a Zr-based bulk metallic glass with different surface finishing states. ECS Trans. 2009, 16, 1–7. [Google Scholar] [CrossRef]
  40. Guo, S.F.; Zhang, H.J.; Liu, Z.; Chen, W.; Xie, S.F. Corrosion resistances of amorphous and crystalline Zr-based alloys in simulated seawater. Electrochem. Commun. 2012, 24, 39–42. [Google Scholar] [CrossRef]
  41. Cao, G.; Liu, K.; Liu, G.; Zong, H.; Bala, H.; Zhang, B. Improving the glass-forming ability and the plasticity of Zr-Cu-Al bulk metallic glass by addition of Nb. J. Non Cryst. Solids. 2019, 513, 105–110. [Google Scholar] [CrossRef]
  42. Takeuchi, A.; Inoue, A. Classification of bulk metallic glasses by atomic size difference, heat of mixing and period of constituent elements and its application to characterization of the main alloying element. Mater. Trans. 2005, 46, 2817–2829. [Google Scholar] [CrossRef] [Green Version]
  43. Zhou, W.; Hou, J.X.; Sheng, M.Q. Microstructural change and corrosion behavior during rolling of Zr-based bulk metallic glass. Int. J. Electrochem. Sci. 2016, 11, 7163–7172. [Google Scholar] [CrossRef] [Green Version]
  44. Nie, X.P.; Yang, X.H.; Chen, L.Y.; Yeap, K.B.; Zeng, K.Y.; Li, D.; Pan, J.S.; Wang, X.D.; Cao, Q.P.; Ding, S.Q.; et al. The effect of oxidation on the corrosion resistance and mechanical properties of a Zr-based metallic glass. Corros. Sci. 2011, 53, 3557–3565. [Google Scholar] [CrossRef]
  45. Louzguine-Luzgin, D.V.; Chen, C.L.; Lin, L.Y.; Wang, Z.C.; Ketov, S.V.; Miyama, M.J.; Trifonov, A.S.; Lubenchenko, A.V.; Ikuhara, Y. Bulk metallic glassy surface native oxide: Its atomic structure, growth rate and electrical properties. Acta Mater. 2015, 97, 282–290. [Google Scholar] [CrossRef]
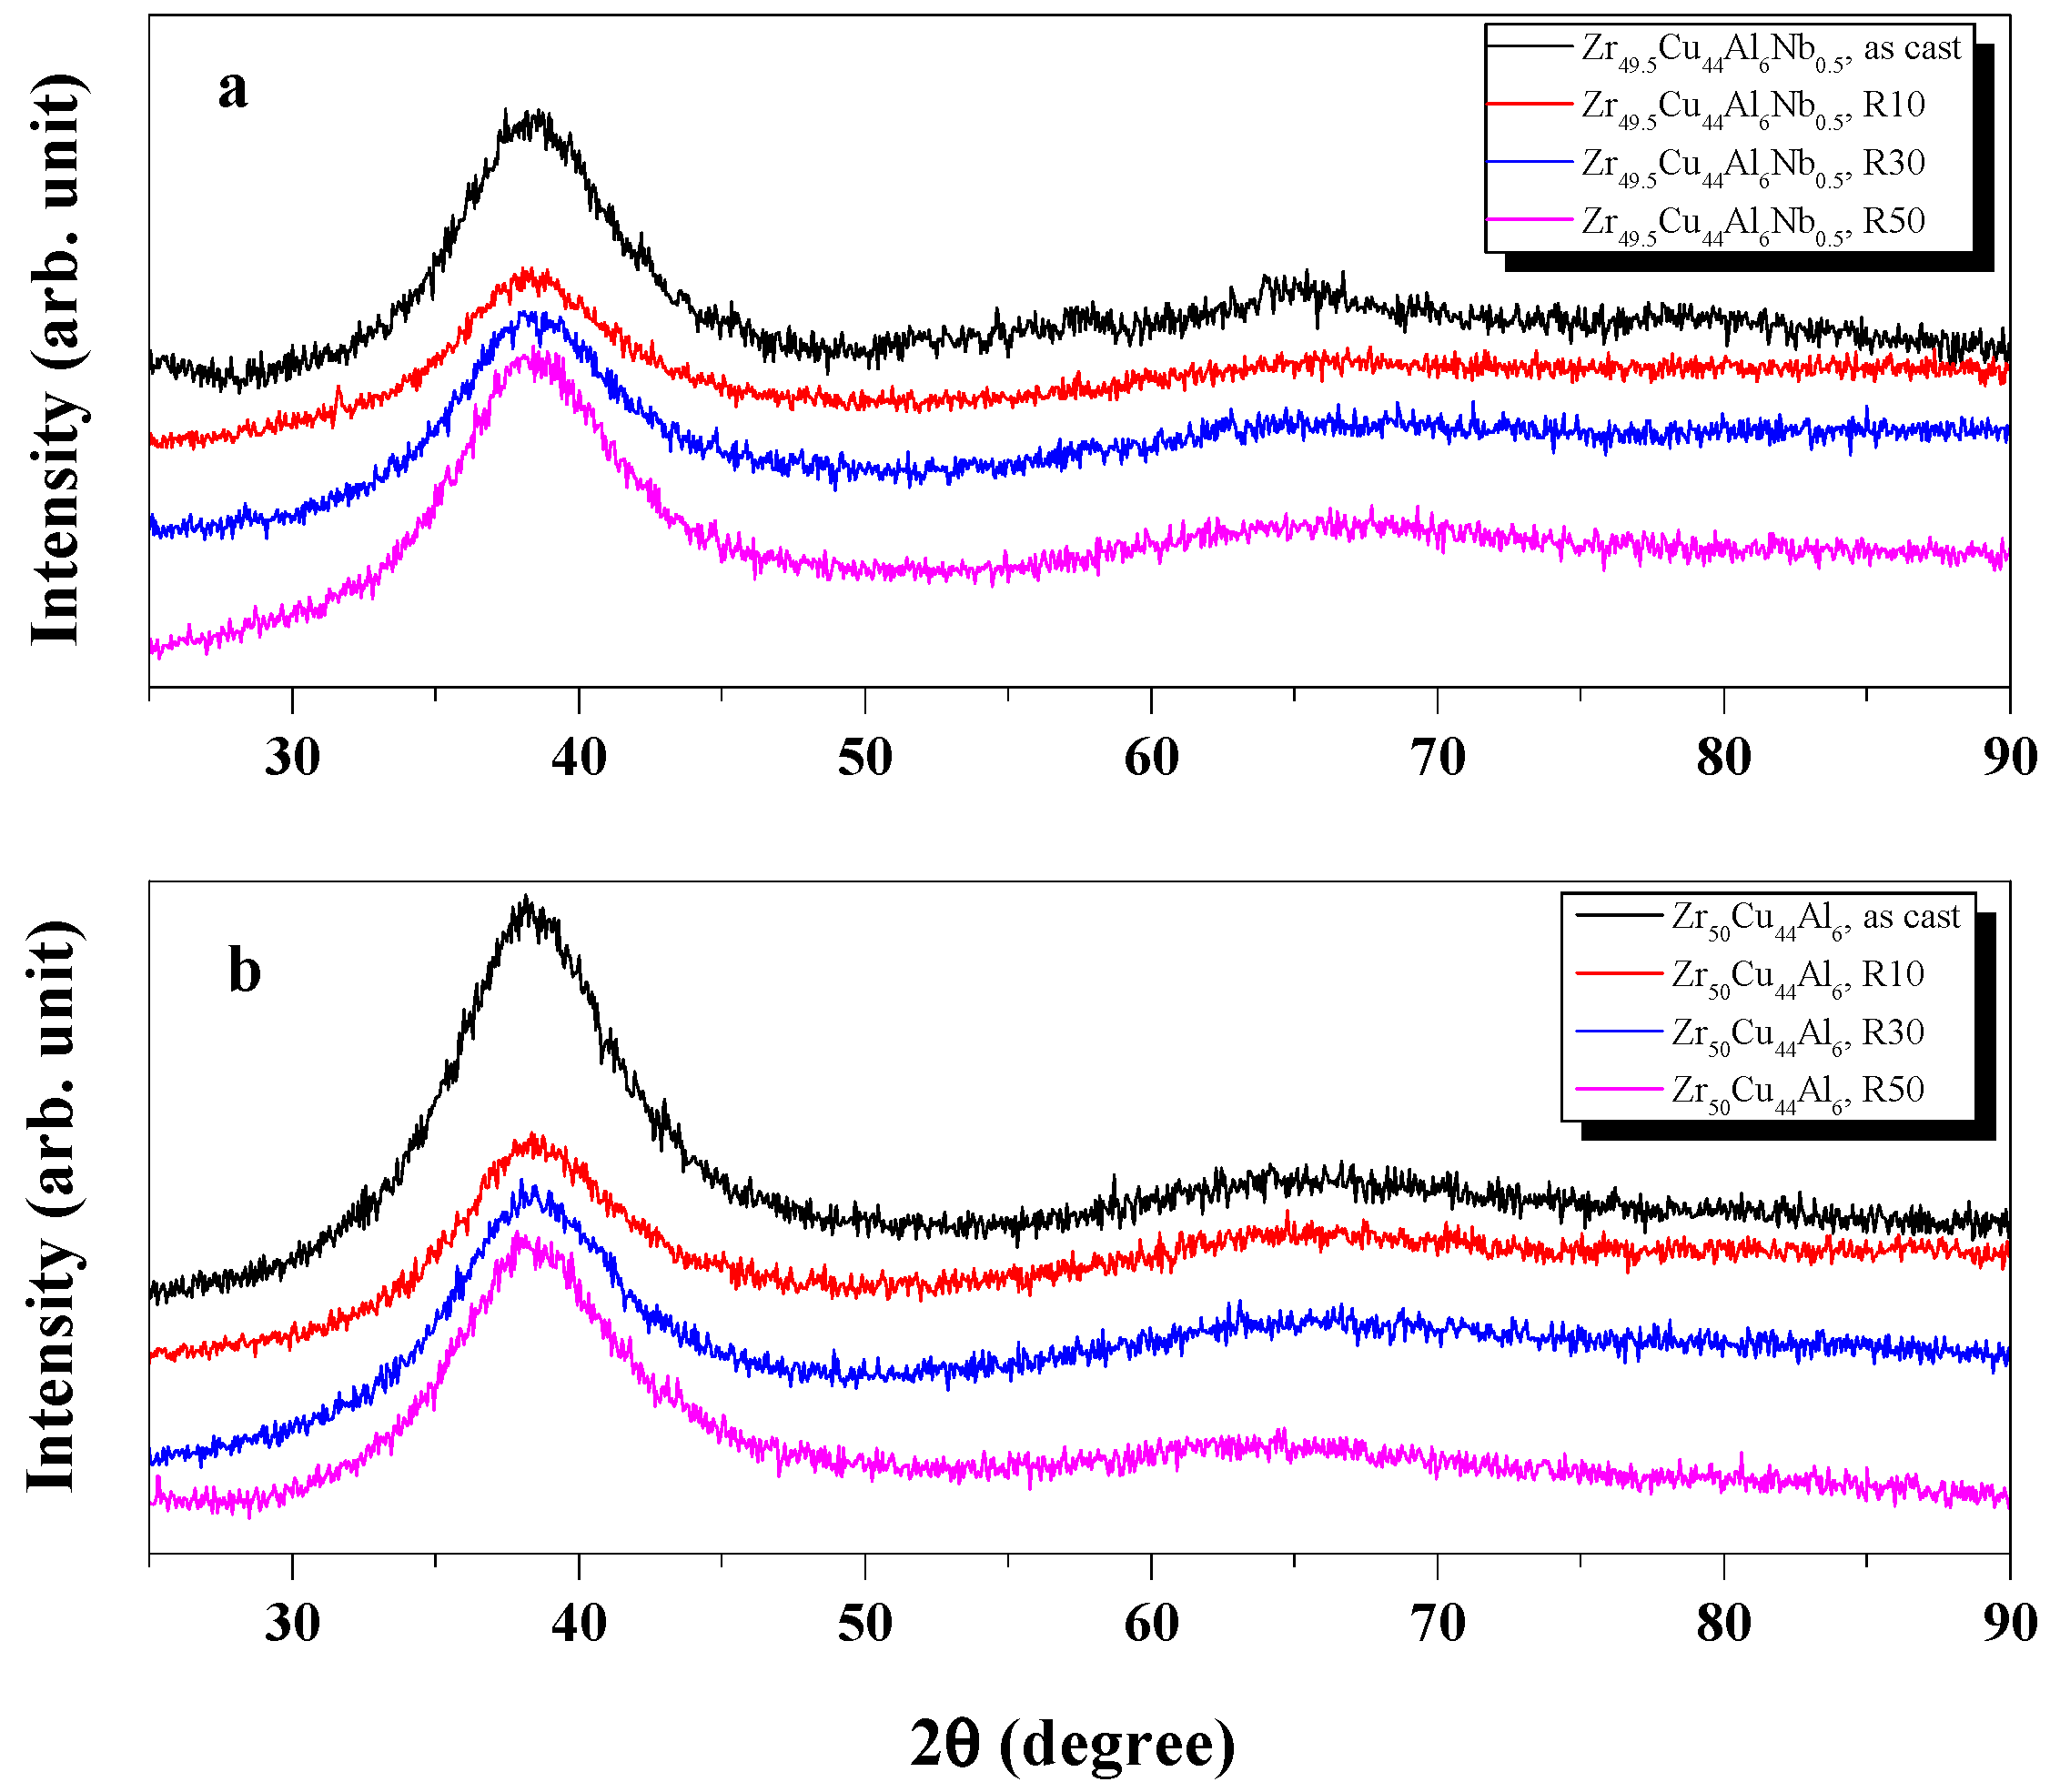
Figure 1. XRD patterns of (a) Zr49.5Cu44Al6Nb0.5 and (b) Zr50Cu44Al6 ribbons.
Metals 11 01514 g001
Figure 2. The SEM images for as-cast (a,e) and deformed A1 and A2 ribbons with 10% (b,f), 30% (c,g), and 50% (d,h) plastic strains.
Metals 11 01514 g002
Figure 3. The density and spacing of SBs as a function of the plastic strain of (a) A1 and (b) A2 RT rolled ribbons. Using black lines to present the trend of SBs’ density and red lines to present the trend of SBs’ spacing.
Metals 11 01514 g003
Figure 4. Archimedes density and free volume change induced by cold rolling of (a) A1 and (b) A2 ribbons as a function of plastic strain (R0–R50). Using the black lines to present the trend of density and the red lines to present the trend of FV change.
Metals 11 01514 g004
Figure 5. Micro-hardness of samples at different plastic strains.
Metals 11 01514 g005
Figure 6. Changes in micro-hardness due to 1-D cold rolling plotted against mean shear band density/shear band spacing and free volume change as a function of 10%, 30%, and 50% plastic strain of (a) A1, (b) A2, and (c) A1 and A2 deformed ribbons.
Metals 11 01514 g006
Figure 7. Anodic polarization curves of R0 and R50 of A1 and A2 ribbons in (a) 0.5 M NaCl and (b) 0.5 M Na2SO4 solutions at 298 K open to the air.
Metals 11 01514 g007
Figure 8. XPS spectra obtained from the surface native oxide layer for Zr50Cu44Al6 as-cast ribbon (a) 3p Cu, 2p Al, and (b) 3d Zr peaks, and for Zr50Cu44Al6 R50-ribbon (c) 3p Cu, 2p Al, and (d) 3d Zr peaks fitted as indicated. The results indicated that in the oxide layer, Al mainly formed the AlOx compound, Zr mainly formed the ZrO2 compound, and Cu was partially metallic and partially the CuOx compound.
Metals 11 01514 g008
Table 1. Corrosion parameters of A1 (Zr50Cu44Al6) and A2 (Zr49.5Cu44Al6Nb0.5) ribbons at R0 and R50 in 0.5 M NaCl and 0.5 M Na2SO4 solutions.
AlloysPlastic Strain, (%)Ecorr, (V)icorr, (Am−2)
0.5 M NaCl
Zr50Cu44Al6
Zr49.5Cu44Al6Nb0.5
Zr50Cu44Al6
Zr49.5Cu44Al6Nb0.5
0
0
50
50
−0.4
−0.375
−0.375
−0.374
2.8 × 10⁻⁵
2.1 × 10⁻⁵
2.0 × 10⁻³
1.8 × 10⁻³
0.5 M Na2SO4
Zr50Cu44Al6
Zr49.5Cu44Al6Nb0.5
Zr50Cu44Al6
Zr49.5Cu44Al6Nb0.5
0
0
50
50
−0.397
−0.368
−0.164
−0.152
2.6 × 10⁻⁵
1.9 × 10⁻⁵
5.1 × 10⁻⁵
5.0 × 10⁻⁵
Table 2. Chemical composition of the native oxide layer on the surface of A1 ribbons, including R0 and R50 in at% measured by XPS. Ct indicates the total element content of the native oxide layer; Cp denotes the partial content of different compounds.
Zr50Cu44Al6 (As-Cast)Zr50Cu44Al6 (50% Thickness Reduction)
Ct,
%
Oxide Formula
0.72 ZrO2 + 0.06 CuOx + 0.22 AlOx
Cp,
%
Ct,
%
Oxide Formula
0.79 ZrO2 + 0.04 CuOx + 0.17 AlOx
Cp,
%
Zr36ZrO2
Zr
95.4
4.6
7ZrO2
Zr
99.3
0.7
Cu40CuOx
Cu
61.4
38.6
66CuOx
Cu
43.4
56.6
Al24AlOx
Al
90.0
10.0
27AlOx
Al
88.7
11.3
Publisher’s Note: MDPI stays neutral with regard to jurisdictional claims in published maps and institutional affiliations.