Abstract
This work deals with numerical investigations of the functional and structural fatigue on shape memory alloys (SMAs). A thermodynamically consistent, three-dimensional constitutive model is employed, adopting a continuum damage perspective. Fatigue life is predicted by considering a macroscopic model. Numerical simulations are compared with experimental data taken from the literature to demonstrate the model’s ability to capture the general thermomechanical behavior of SMAs subjected to different loading conditions. Uniaxial and torsion tests are discussed; thermal loads are also analyzed considering the influence of the maximum temperature on the fatigue life of SMAs. Cyclic degradation of the shape memory effect is investigated in the sequence. Results show that numerical simulations are in good agreement with the experimental data, including the fatigue life estimation.
1. Introduction
Shape memory alloys belong to the class of smart materials and have a series of complex thermomechanical behaviors including one-way shape memory effect, two-way shape memory effect, pseudoelasticity, and phase transformation due to temperature variation. These phenomena are due to solid-solid martensitic phase transformations that can be induced either by stress or by temperature [1,2,3]. In recent years, shape memory alloys, especially nickel-titanium (NiTi) alloys, were used in a large variety of applications considering different fields including biomedical, automotive, aerospace, civil engineering, and robotics, due to unique characteristics such as good mechanical properties, biocompatibility, and corrosion resistance [4,5,6,7,8,9,10]. Devices developed from these materials are often subjected to cyclic loading processes and therefore, fatigue is an essential issue responsible to the loss of functionality, and eventually, to failure. In this regard, fatigue of shape memory alloys is an important issue to be analyzed with scientific and technological relevance.
Fatigue is a kind of localized damage process associated with cyclic loadings, being related to the initiation and growth of cracks [11,12]. Fatigue is usually classified into low cycle fatigue when the material accumulates plastic strains during the cyclic loading and high cycle fatigue when the material undergoes only elastic strains. According to Eggeler et al. [13], the definition of SMA fatigue can be split into structural fatigue, associated with the material failure due to the growth and propagation of microcracks, and functional fatigue, related to the reduction of functional properties.
SMA fatigue was explored by many researchers employing different approaches. From the experimental point of view, different phenomena related to shape memory alloys were explored to quantify the influence of structural and functional fatigue. For instance, Tyc et al. [14] investigated the functional and structural fatigue of superelastic NiTi wires subjected to tensile fatigue tests at various temperatures. Results showed that unrecovered strains increase when the test temperature grows. On the other hand, the number of cycles to failure decreases with the increase of test temperature and transformation stress. Dornelas et al. [15] proposed an experimental investigation to identify the main characteristics of the macroscopic thermomechanical behavior of NiTi alloys observing functional and structural fatigue subjected to different situations related to phase transformations and plastic behavior. Qin et al. [16] conducted an experimental study to investigate the effect of maximum temperature on the fatigue life of NiTi wires subjected to thermal loads. It was observed that the increase of temperature promotes a significant reduction of the fatigue life. Predki et al. [17] investigated the functional and structural fatigue of NiTi alloys subjected to torsion loads under different conditions, emphasizing the reduction of the hysteresis loop due to the evolution of functional fatigue and the failure due to structural fatigue that occurs in a similar way as observed for axial loads. Zhao et al. [18] carried out uniaxial thermomechanical coupling fatigue tests with different stress levels and stress rates to evaluate the cyclic degradation of the one-way shape memory effect and fatigue failure of NiTi alloys. Results present a cyclic degradation of the one-way shape memory effect, being dependent on stress level and stress rate, becoming more accentuated with the increase of the stress level and the decrease of the stress rate. The literature presents other interesting works dealing with experimental approaches to study fatigue on shape memory alloys, such as Tobushi et al. [19], Figueiredo et al. [20], Ramos et al. [21], Jaureguizahar et al. [22], and Qiu et al. [23].
Several investigations were performed to review the main aspects of functional and structural fatigue on SMAs [24]. Mahtabi et al. [25] proposed a review of the NiTi fatigue behavior considering the main factors that can influence the fatigue strength. Moumni et al. [26] provided a global approach to investigate the structural fatigue of SMAs considering low cycle and high cycle fatigue.
The constitutive modeling of SMAs is an essential subject that helps obtain a proper understanding of fatigue phenomena, being the objective of several research efforts available in the literature. Paiva and Savi [27], Lagoudas [2], and Cisse et al. [28,29] presented general reviews of the main efforts, discussing the general macroscopic thermomechanical behavior of SMAs. Yu et al. [30] developed a constitutive model based on micromechanics in order to describe the cyclic deformation of polycrystalline NiTi alloys under different thermomechanical cyclic loading conditions.
Concerning fatigue modeling, Auricchio et al. [31] investigated the cyclic response of SMAs under elastic shakedown and proposed a multiaxial failure criterion based on the formalism developed for Generalized Standard Materials. Similarly, Gu et al. [32] developed a high cycle fatigue criterion for shape memory alloys based on a shakedown analysis using a multiscale approach.
Liu et al. [33] proposed a cumulative damage model for shape memory alloys under low cycle fatigue based on the theory of continuum damage mechanics. The proposed model allows the prediction of the threshold value of the damage initiation, the stress–strain curves, and the number of cycles until rupture. In addition, Liu et al. [34] developed a constitutive model by introducing a damage variable to simulate the cyclic deformation behavior of SMAs subjected to constant uniaxial tension stress and thermal cyclic loadings.
Mohammadzadeh et al. [35] developed a one-dimensional constitutive model to investigate the torsional low-cycle fatigue of superelastic shape memory alloys taking into account high loading frequencies. Petrini and Bertine [36] proposed a three-dimensional phenomenological model to describe the accumulation of inelastic strains due to fatigue and plasticity exploiting pseudoelasticity and shape memory effect behavior.
Dornelas et al. [37] presented a three-dimensional macroscopic model to describe functional fatigue in shape memory alloys considering the continuous damage perspective. Dornelas et al. [15] incorporated structural damage to the previous model. This three-dimensional model considers several phenomena as classical plasticity, transformation induced plasticity, phase transformation plasticity coupling, tension-compression asymmetry, allowing the representation of functional and structural fatigue of shape memory alloys. Fatigue life is predicted by a macroscopic model. These articles are based on research efforts developed to describe several SMA thermomechanical phenomena considering one-dimensional [38,39,40,41,42,43] and three-dimensional [44,45,46] media. Other constitutive models for the description of fatigue on SMAs are available in the literature, such as Barrera et al. [47], Hartl et al. [48], Chemisky et al. [49], and Phillips et al. [50].
The present work deals with numerical investigations of SMA fatigue, considering different thermomechanical loads. The three-dimensional model proposed by Dornelas et al. [15] is employed to perform numerical simulations establishing comparisons with experimental data available in the literature. The main goal is to show the model’s ability to represent different behaviors associated with SMA thermomechanical fatigue, either functional or structural types, predicting the fatigue life. Numerical simulations allow one to have a proper comprehension of fatigue phenomena, being a useful tool for the design of SMA systems and structures. Although the model is general for different kinds of SMAs, simulations are treated considering NiTi (Nitinol) samples. Initially, uniaxial tests are carried out, and, afterward, cyclic torsion tests are discussed; thermal loads are analyzed considering the influence of the maximum temperature on the fatigue life of SMAs. Finally, the cyclic degradation of the shape memory effect is treated. Results show that numerical simulations are in good agreement with the experimental data, including the fatigue life estimation.
After this introduction, this paper is organized as follows. Section 2 presents the constitutive model to describe the general aspects of functional and structural fatigue on shape memory alloys. Section 3 presents numerical simulations and their comparison with experimental data considering different load conditions. The conclusions are presented in Section 4. Appendix A introduces details about the constitutive model including a brief discussion about constitutive model parameters. Appendix B presents the list of symbols used in the constitutive model.
2. Constitutive Model
This section briefly summarizes the three-dimensional constitutive model proposed by Dornelas et al. [15,37]. The model is built through the formalism of Generalized Standard Materials as proposed by Halphen and Nguyen [51] and Lemaitre and Chaboche [52]. In this regard, the thermodynamic state of the material can be fully determined by the Helmholtz free energy density, , and the pseudo-potential of dissipation, . Under these assumptions, thermodynamic forces are obtained from the Helmholtz free energy density, and complementary laws can be found through the pseudo-potential of dissipation. The procedure for obtaining the constitutive equations is discussed in more detail by Dornelas et al. [37].
An approach based on local continuum damage is employed to describe functional and structural fatigue on shape memory alloys, using internal variables. In this regard, functional damage is represented by the loss of functional performance, ; and structural damage is described by the degree of deterioration of the material, . Based on that, consider that is the stress tensor, is the elastic strain tensor, and is the temperature. In addition, four macroscopic phases are of concern, represented by their volume fraction: and are associated with detwinned martensitic variants; is associated with twinned martensite, and is related to austenitic phase. Since , only three volume fractions are enough to describe the phase transformations. The description of classical plasticity is made through the plastic strain tensor, , isotropic hardening, , and kinematic hardening . On the other hand, transformation induced plasticity (TRIP) is described considering the TRIP strain, , and saturation variables for each phase, , and . Under these assumptions, the constitutive relations for the description of the SMA thermomechanical behavior are presented in the sequence [15,37].
Stress–strain–temperature relation:
Evolution equations for the volume fractions:
Evolution equations for plasticity:
Evolution equations for TRIP:
Evolution equation for functional damage:
Evolution equation for structural damage:
Yield surface and its conditions:
In the previous equations, is the equivalent strain field that combines volumetric, , and deviatoric, , effects; and are related to phase transformation constraints being defined from sub-differential of indications functions. In addition, is a parameter that controls the height of the stress–strain hysteresis loop; is a fourth-order tensor that controls the stress–strain hysteresis loop; is a second-order tensor related to the loading history; and and are temperature functions that define the critical stress value for the phase transformation. The internal dissipation during the phase transformation is represented by the parameters .
In addition, is the elastic tensor; is related to the thermal expansion coefficient; and is a reference temperature in a stress-free state. Moreover, is the plastic modulus; is the kinematic hardening modulus; defines the coupling between phase transformation and kinematic hardening; is the deviatoric stress tensor; is the yield stress; is the plastic multiplier; defines the coupling between phase transformation and isotropic hardening; and and are parameters associated with the TRIP effect. Finally, and are auxiliary variables. More details on the development of the constitutive equations as well as the definition of each variable can be found in Appendix A.
Damage description is made in a similar way to the classical theory of continuous damage developed by Lemaitre and Chaboche [52]. The function is proposed to determine the relationship between accumulated phase transformation and functional damage. Likewise, the functions and are defined to represent the elastic and elasto-plastic fatigue, respectively. These functions consider the parameters to control the evolution of functional damage and to control the evolution of structural damage. Furthermore, is the equivalent stress field; its definition is similar to the one employed for the equivalent strain field.
The fatigue life of SMAs is estimated by the constitutive model through the definition of the equivalent critical damage, , that takes into account the effects caused by the functional and structural damage.
where , and are parameters employed to represent the austenite and martensite structural fatigue strength. In this way, the failure occurs when the equivalent critical damage reaches a critical value, , which can be estimated through experimental tests.
3. Numerical Simulations
This section aims to analyze the influence of functional and structural fatigue on the thermomechanical behavior of shape memory alloys through numerical simulations considering model parameters calibrated from experimental results available in the literature. Four different loading conditions are analyzed to explore the potentialities of the three-dimensional constitutive model: axial loading test, torsion test, thermal loads, and one-way shape memory effect. All simulations are performed with a time step of s.
3.1. Axial Loading Test
SMA fatigue related to axial tests is now in focus. Dornelas et al. [15] proposed an experimental program considering axial cyclic tests of an austenitic NiTi SMA wire for several conditions. Figure 1a shows a test where the pseudoelastic NiTi SMA wire is subjected to cyclic tension with peak stress of 750 MPa (within the yield surface), and a frequency of 0.25 Hz. Figure 1b presents numerical simulations of the same test using parameters presented in Table 1. It is noted that numerical and experimental results show a good agreement, specifically the characteristics of the hysteresis loop such as the stabilization of TRIP strain, and the reduction of functional properties due to the evolution of functional damage.
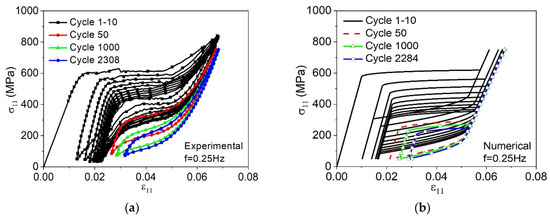
Figure 1.
Pseudoelastic behavior for NiTi wires during fatigue tests performed by Dornelas et al. [15], MPa, 0.25 Hz. (a) experimental result; (b) numerical result.

Table 1.
Parameters identified from experimental results performed by Dornelas et al. [15].
Figure 2 shows the numerical-experimental comparison considering four cycles: 1, 10, 50, the last cycle before failure obtained experimentally (2308), and the last cycle predicted by the model (2284). Note that the transformation induced plasticity and the accumulation of functional and structural damage causes a loss of performance with the increase of the number of cycles. Figure 3 shows the evolution of volume fractions for the same cycles. Observe that the material has 100% of its performance capacity during the first cycle, as shown in Figure 3a, and this percentage progressively decreases due to the evolution of the damage, until reaching approximately 60% in the last cycle before the failure as shown in Figure 3d. In addition, the evolution of TRIP and functional damage inhibit the beginning of the reverse transformation, as observed in Figure 3a,d.
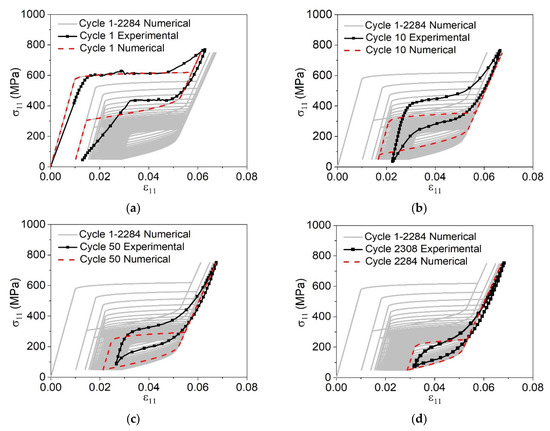
Figure 2.
Pseudoelastic behavior for NiTi wires during fatigue tests obtained by Dornelas et al. [15], MPa, 0.25 Hz. Numerical-experimental comparative for different cycles: (a) cycle 1; (b) cycle 10; (c) cycle 50; (d) cycles 2308 (experimental) and 2284 (numerical).
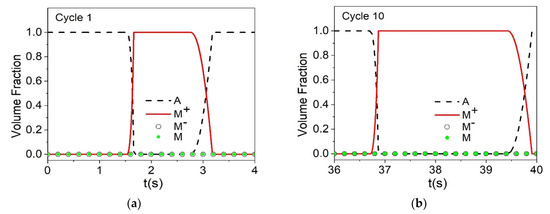
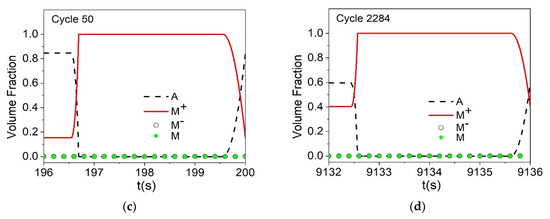
Figure 3.
Evolution of volume fractions through different cycles to evaluate functional and structural fatigue. (a) cycle 1; (b) cycle 10; (c) cycle 50; (d) cycle 2284.
Figure 4a presents the evolution of TRIP showing that the material undergoes a rapid stabilization, around 10 cycles. Figure 4b presents the evolution of functional and structural damage. After 2284 cycles, the functional damage reaches a value of approximately 12%, causing the loss of actuation performance. Concerning structural damage, it is possible to observe a trend of linear evolution reaching approximately 2% in the last cycle before the rupture. Finally, Figure 4c shows the evolution of over the cycles until reaching .
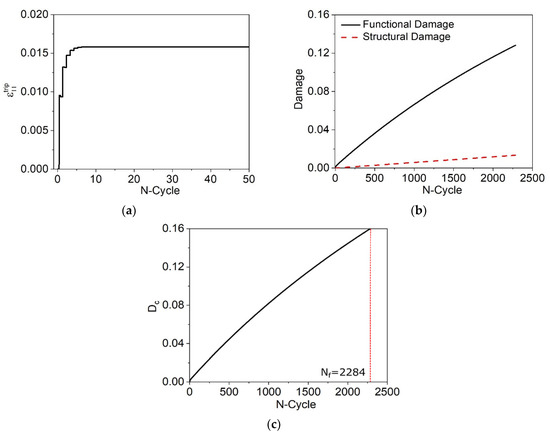
Figure 4.
TRIP strain and damage evolution during cyclic tests. (a) TRIP evolution; (b) functional and structural damage evolution; (c) evolution.
Table 2 presents the comparison of experimental fatigue lifetime and that predicted by the model [15]. It should be pointed out that there was a good fatigue life prediction with a variation of 1% between experimental tests and results predicted by the model.
Table 2.
Number of cycles to failure (Nf) during axial loads. Comparison between experimental results obtained by Dornelas et al. [15] and those predicted by the model.
3.2. Torsional Loading Test
The mechanical response of a pseudoelastic NiTi cylindrical rod (50.8 at % Ni) subjected to torsional loads is now of concern. The experiment proposed by Predki et al. [17] consists of applying a torsion cyclic loading that varies linearly from zero to 346 MPa and then back to zero, at room temperature and a frequency of 0.1 Hz. Figure 5a shows the evolution of the experimental stress–strain curves considering cycles 1, 10, 100, 1000, and 10,549 (last cycle before rupture). Figure 5b presents numerical simulations of the same conditions employing parameters listed in Table 3. The last cycle before rupture, 10,263, is highlighted; it represents a variation of approximately 3% compared with the experimental data.
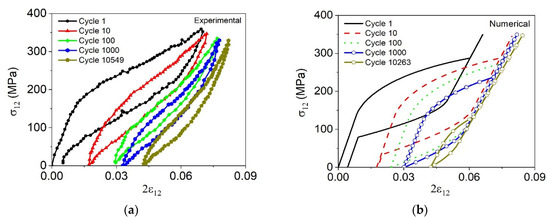
Figure 5.
Pseudoelastic behavior for the NiTi alloys during torsional loads, test proposed by Predki et al. [17], MPa, 0.1 Hz. (a) experimental result; (b) numerical result.
Table 3.
Parameters identified from experimental results performed by Predki et al. [17].
Figure 6 shows the numerical-experimental comparison considering different cycles: 1, 10, 100, 1000, 10,549 (last cycle before failure obtained experimentally) and 10,263 (last cycle predicted by the model). In general, a progressive decrease of the functional properties of the material can be observed during torsional fatigue tests in a similar way as presented in the tensile fatigue tests. Figure 7 shows the evolution of volume fractions considering cycles 1, 100, 1000, and 10,263. Damage evolution promotes a reduction of the phase transformation capacity, causing the loss of functionality, as can be seen by comparing cycle 1 (Figure 7a) with cycle 10,263 (Figure 7d), where the material loses approximately 80% of its phase transformation capacity.
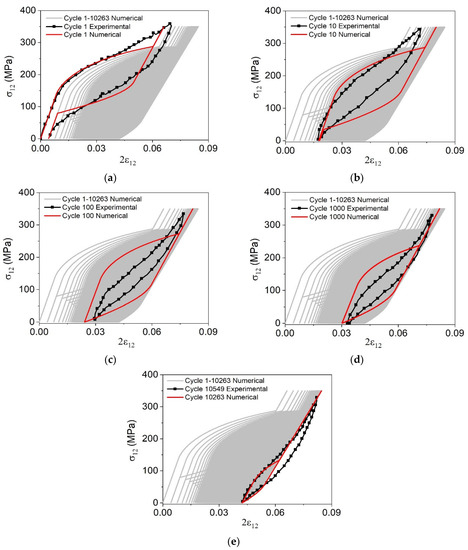
Figure 6.
Pseudoelastic behavior for the NiTi alloys during torsional loads, test proposed by Predki et al. [17], MPa, 0.1 Hz. Numerical-experimental comparative results for different cycles. (a) cycle 1; (b) cycle 10; (c) cycle 100; (d) cycle 1000; (e) cycles 10,549 (experimental) and 10,263 (numerical).
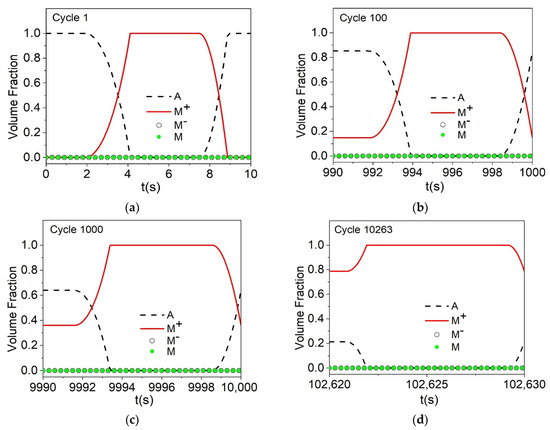
Figure 7.
Evolution of volume fractions through different cycles to evaluate functional and structural fatigue. (a) cycle 1; (b) cycle 100; (c) cycle 1000; (d) cycle 10,263.
After the numerical-experimental comparison, numerical simulations are carried out considering three different loads in order to verify the influence of maximum shear stress, , on the fatigue life of the material. The maximum shear stress employed by Predki et al. [17] during loading-unloading torsion experiments is used as a reference. Figure 8 shows the stress–strain curves for different cycles: 1, 100, 1000, and the last cycles predicted by the model. The increase of the maximum applied stress causes an increase of the maximum strain (maximum strain value during the loading process) and the residual strain (strain observed after the finish of the loading process). In addition, there is a progressive reduction of the area of the hysteresis loop due to the evolution of functional and structural damage, similar to the axial load cases.
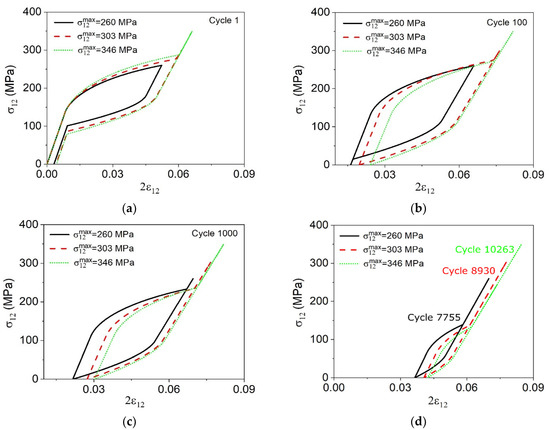
Figure 8.
Pseudoelastic behavior for the NiTi alloys during torsional loads. Numerical comparative results for different cycles and different load conditions. (a) cycle 1; (b) cycle 100; (c) cycle 1000; (d) last predicted cycles.
Figure 9 presents the evolution of volume fractions for austenite (A) and detwinned martensite (). Initially, it is observed in Figure 9a that for = 260 MPa a complete phase transformation does not occur, whereas, for the other two load levels, the material has 100% of its transformation. Figure 9c shows cycle 1000, where it is possible to correlate the maximum shear stress with the loss of functionality due to the evolution of the functional damage. In this regard, by increasing from 260 to 346 MPa, the material exhibits a significant reduction of the volume fractions of approximately 20%.
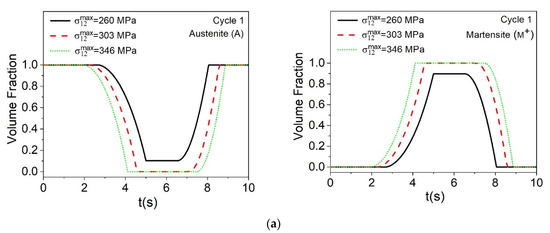
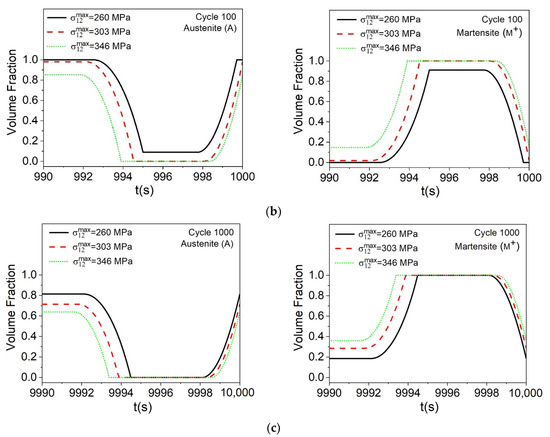
Figure 9.
Evolution of volume fractions through different cycles to evaluate functional and structural fatigue. Comparative results for different load conditions: (a) cycle 1; (b) cycle 100; (c) cycle 1000.
Figure 10a shows the TRIP strain evolution during the first 50 cycles as a function of maximum shear stress. Note that the material undergoes a stabilization, where the TRIP strain reaches a constant value, around 10 cycles for the three load levels. Figure 10b presents the evolution of functional damage. Similar to that observed for axial tests, larger shear stress causes a greater accumulation of functional damage after the initial cycles, promoting a significant loss of actuation performance. Therefore, after a certain number of cycles, the material subjected to larger levels of shear stress has lost a larger portion of its functionality and accumulates less functional damage than those under smaller shear stress. Figure 10c shows the evolution of structural damage, where it is possible to observe that a larger shear stress level induces a greater accumulation of structural damage. Figure 10d shows the evolution of over the cycles until reaching .
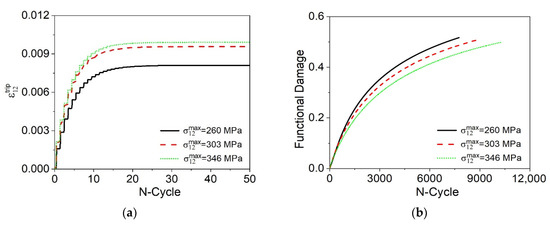
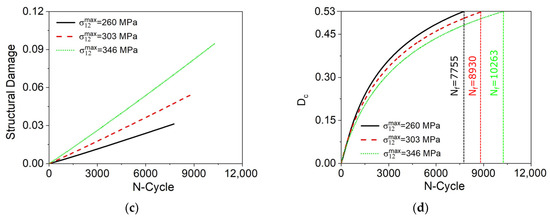
Figure 10.
TRIP strain and damage evolution during torsional loads. (a) TRIP evolution; (b) functional damage evolution; (c) structural damage evolution; (d) evolution.
Table 4 presents the comparison of numerical-experimental fatigue lifetime considering MPa and MPa, where it should be pointed out that the model is able to estimate the fatigue life prediction with good accuracy.
Table 4.
Number of cycles to failure (Nf) during torsional loads. Comparison between experimental results obtained by Predki et al. [17] and results predicted by the model.
3.3. Thermal Loading Test
Functional and structural fatigue due to thermal loadings is now of concern. Initially, a numerical-experimental comparison was conducted to obtain the mechanical properties of the material. On this basis, experimental tests proposed by Xu et al. [53] considering 100 thermal cycles at a constant stress of 200 MPa, were used as a reference. A NiTi wire initially in the austenitic phase at a temperature of 438 K was cooled to 303 K. During the cooling process, an austenite–martensite phase transformation was observed. By heating the sample, an inverse transformation was verified and the sample returns to the initial phase. Table 5 presents model parameters employed for numerical simulations together with critical damage parameters presented in Section 3.2. The thermal loading process is illustrated in Figure 11a. Figure 11b shows the experimental strain–temperature curves performed by Xu et al. [53] for cycles 1–4 and 100, while Figure 11c shows the numerical results for the same cycles. Figure 12 shows the numerical-experimental comparison for cycles 1 and 100 of the test. A good agreement between the results is observed, showing the model’s capability to represent the general behavior of the material.
Table 5.
Parameters identified from experimental results performed by Xu et al. [53].
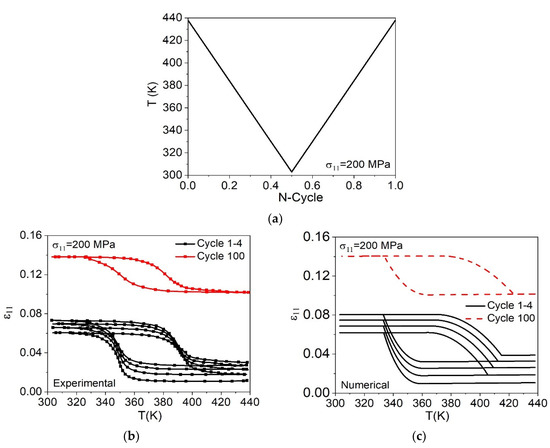
Figure 11.
Thermal cyclic test under a constant uniaxial load based on experimental result developed by Xu et al. [53]. (a) thermal loading related to the first cycle; (b) experimental data (c) numerical simulations.
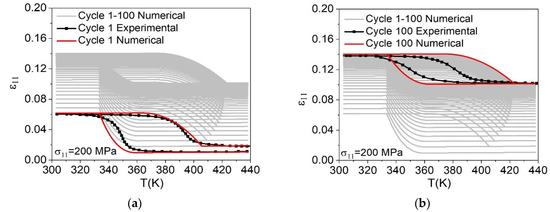
Figure 12.
Thermal cyclic test, under a constant uniaxial load, based on experimental tests developed by Xu et al. [53]. Numerical-experimental comparative results for different cycles: (a) cycle 1; (b) cycle 100.
After this comparison, numerical simulations are conducted to verify the influence of the temperature loadings on the fatigue life of the SMAs. It is important to notice that thermomechanical couplings imply that the loading rate can influence the SMA response. Additionally, phenomena such as transformation induced plasticity and thermal strain have temperature dependent behavior. On this basis, it is expected that the temperature loading process changes the SMA response. In this regard, different tests are performed considering distinct thermal loadings defined by a maximum temperature. Figure 13 shows different thermal loading curves indicating a minimum temperature of 303 K and three maximum temperatures (). A constant stress of 200 MPa is applied.
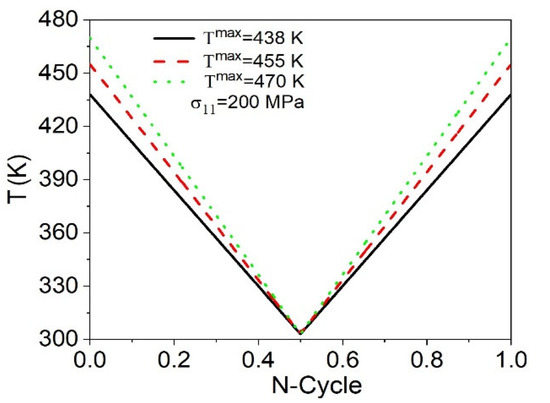
Figure 13.
Thermal loading curves considering three maximum temperatures under a constant uniaxial load.
Figure 14 shows the strain–temperature curves considering different cycles: 1, 100, 1000, 1800, and the last cycle until failure, predicted by the model. Initially, the material presents a similar behavior for the three temperatures analyzed, as can be seen in Figure 14a. After a few cycles, an increase in the maximum temperature promotes a reduction of the maximum and residual strain experienced by the material. In addition, an increase in of 32 K, associated with the effects caused by the evolution of functional and structural damage, promotes a reduction of the number of cycles to failure (Nf) of approximately 59%, as shown in Figure 14e.
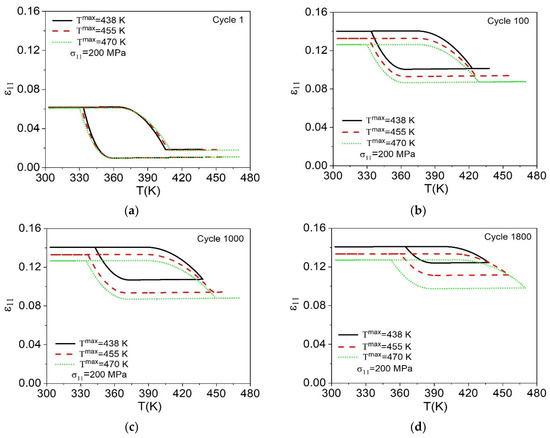
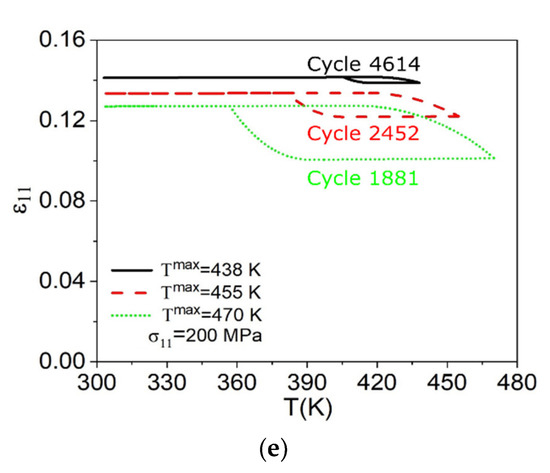
Figure 14.
Thermal cyclic test under a constant uniaxial load and different maximum heating temperatures. Numerical comparative results for different cycles: (a) cycle 1; (b) cycle 100; (c) cycle 1000; (d) cycle 1800; (e) last predicted cycles.
Figure 15 shows the evolution of volume fractions for cycles 1, 1000, and 1881. Initially, the samples have 100% of their phase transformation capacity, as shown in Figure 15a. The maximum temperature directly influences the loss of material performance over the cycles, as can be seen in Figure 15b,c for cycles 1000 and 1881, respectively. For cycle 1000, the material has 100% of its actuation capacity for , whereas for a loss of performance of approximately 30% is observed. Finally, for cycle 1881 the material has a loss of actuation of 60%, 50% and 30%, respectively, for .
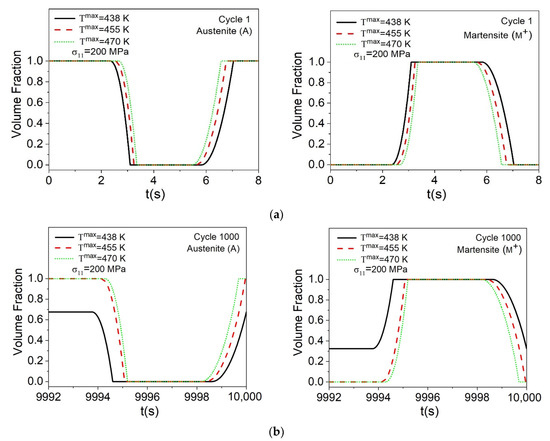
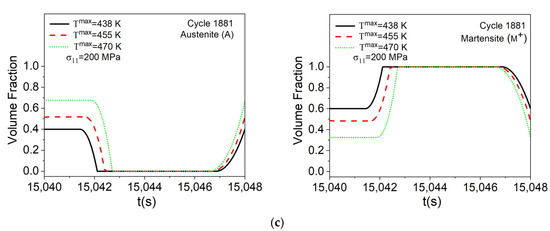
Figure 15.
Evolution of volume fractions through different cycles to evaluate functional and structural fatigue. (a) cycle 1; (b) cycle 1000; (c) cycle 1881.
Fatigue of shape memory alloys subjected to thermal loads arises from an internal stress state in the region where martensite forms during the cooling process [54], and this local formed martensite does not take part in the reverse transformation in the following cycles [16]. According to Qin et al. [16], the increase of promotes an irreversible martensite accumulation in the vicinity of the defects due to the increase of the dislocation movement (thermal activated), promoting a greater accumulation of damage for higher temperatures. On the other hand, at a higher , the martensitic phase can accumulate more energy to overcome the restrain of local stress to transform in austenite. Therefore, there is more volume fraction of the martensitic phase taking part during the reverse transformation.
The evolution of TRIP strain for the first 100 cycles is shown in Figure 16a. With the increase of there is a decrease in the maximum TRIP strain. On the other hand, the number of cycles for the stabilization does not vary significantly with , staying around fifty cycles. Figure 16b shows the evolution of the functional damage for the three maximum temperatures analyzed. It is observed that until approximately cycle 1000, the functional damage for the three temperatures has the same rate of evolution. After that point, a higher value of induces a higher rate of accumulation of functional damage due to the amount of irreversible martensite present in the material. Figure 16c presents the evolution of the structural damage confirming the same characteristics previously discussed. Higher values of induce a higher rate of evolution of structural damage from the first loading cycles. Finally, Figure 16d shows the evolution of over the cycles until reaching . As previously observed, a higher value of induces a higher rate of accumulation of functional and structural damage, promoting a reduction in the number of cycles until failure.
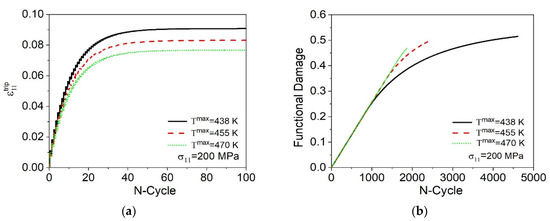
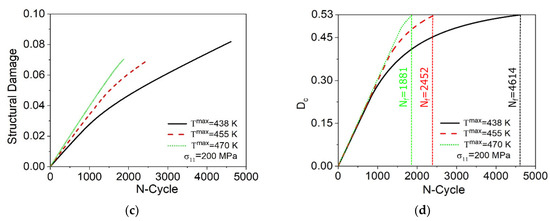
Figure 16.
TRIP strain and damage evolution during thermal cyclic loads. (a) TRIP evolution; (b) functional damage evolution; (c) structural damage evolution; (d) evolution.
Figure 17 presents the estimative of the number of cycles to failure (Nf) under various maximum temperature values, showing a reduction of Nf with the increase of . This result is qualitatively similar to the one presented by Qin et al. [16] considering different experimental maximum temperature values.
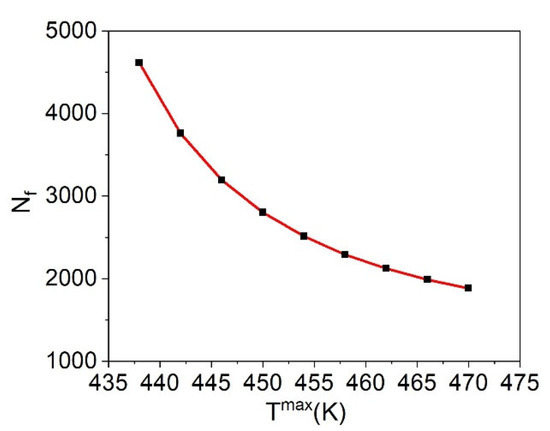
Figure 17.
Cycles to failure (Nf) as a function of the maximum heating temperature ().
3.4. Shape Memory Effect
The fatigue of NiTi alloys considering the shape memory effect is now concerned. An SMA exhibits the one-way shape memory effect or simply the shape memory effect (SME) when a sample, initially in the twinned martensite phase , is subjected to mechanical loading followed by unloading. During the loading process a reorientation of the twinned martensite phase to a detwinned martensite variant occurs. After unloading, a residual recoverable strain is observed. The initial state of the sample can be recovered by heating the sample to a temperature higher than Af (temperature when the martensite → austenite transformation finishes) and then cooling it to the initial temperature. The loading sequence described is illustrated in Figure 18a. Figure 18b shows the stress–strain–temperature response. After cooling, a residual permanent strain (TRIP) is observed, which is in agreement with the experimental observations proposed by Zhao et al. [18,55].
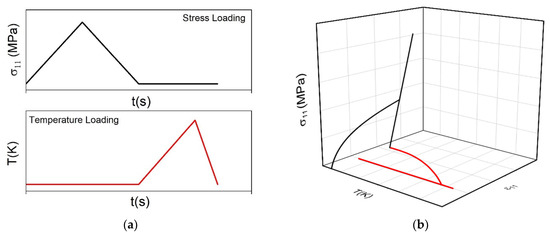
Figure 18.
One-way shape memory effect. (a) loading process; (b) stress–strain–temperature response.
Many engineering applications use SMA devices exploring the one-way shape memory effect, such as in-space deployable antennas and fighter aircraft tube joints [55]. In many of these applications, devices are subjected to cyclic loading and the study of fatigue should be considered. In order to analyze the effects caused by fatigue in SMAs considering SME, the experimental tests proposed by Zhao et al. [18] are used as a reference. NiTi micro-tubes are subjected to a thermomechanical loading process with tensile mechanical loads followed by thermal loads. As-received specimens are adopted and therefore, results are not restricted to stabilized cycles. Parameters presented in Table 6 are employed for the simulations. Figure 19a shows the experimental stress–strain curve obtained for different cycles considering a peak stress of 1000 MPa and a stress rate of 40 MPa/s. For the cyclic thermal loading stage, the minimum and maximum temperatures are set as 295 K and 343 K, respectively. In addition, a linear heating time of 25 s and a linear cooling time of 10 s is used. The numerical-experimental comparison is carried out showing only the mechanical part of the load since the experimental results do not show the thermal part. Figure 19b shows the numerical result for the same test. Figure 19c presents the simulation of stress–strain–temperature evolution over the cycles until failure.
Table 6.
Parameters identified from experimental results performed by Zhao et al. [18].
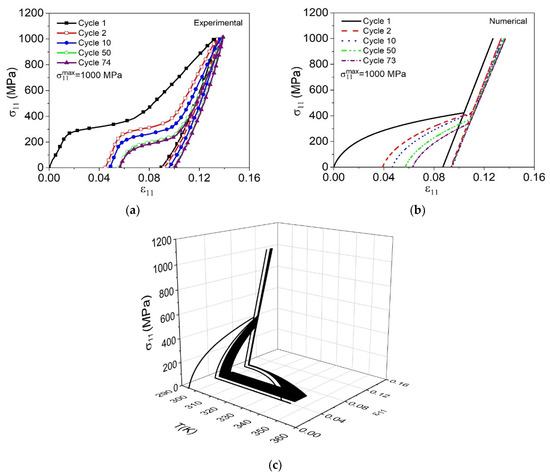
Figure 19.
One-way shape memory effect, test proposed by Zhao et al. [18]. (a) experimental stress–strain curve; (b) numerical stress–strain curve; (c) numerical stress–strain–temperature evolution.
Figure 20 presents the numerical-experimental comparison considering five different cycles: 1, 2, 10, 50, and the last cycle before failure obtained experimentally (cycle 74) and the last cycle predicted by the model (cycle 73). Similar to the previous tests, it is observed that the material undergoes a loss of actuation performance over the cycles due to functional and structural fatigue, with an increase of the residual strain.
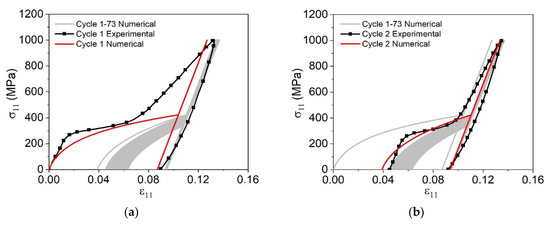
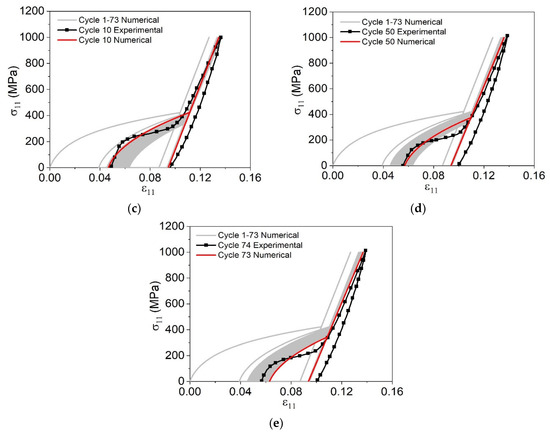
Figure 20.
One-way shape memory effect, test proposed by Zhao et al. [18]. Numerical-experimental comparative for different cycles. (a) cycle 1; (b) cycle 2; (c) cycle 10; (d) cycle 50; (e) cycles 74 (experimental) and 73 (numerical).
Figure 21 shows the evolution of the volume fractions for the analyzed cycles. During the mechanical loading, a reorientation from the twinned martensite () to the detwinned martensite variant () occurs, as shown in Figure 21a. When applying a thermal load, the phase transformation → is observed. Finally, when cooling the sample to its initial temperature an → phase transformation takes place and the material returns to its initial configuration. By observing the volume fraction evolution in the first cycles, it is noticeable that the material has 100% of the phase transformation capacity. After 50 cycles, due to the evolution of functional and structural damage, the material loses approximately 20% of its phase transformation capacity, and finally, in the last cycle, this loss of actuation reaches a value of approximately 30%.
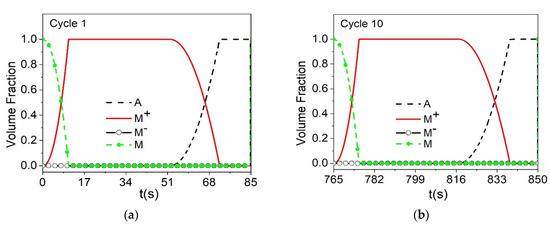
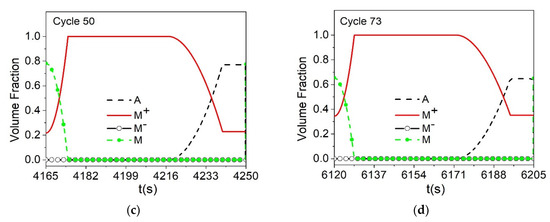
Figure 21.
Evolution of volume fractions through different cycles to evaluate functional and structural fatigue. (a) cycle 1; (b) cycle 10; (c) cycle 50; (d) cycle 73.
The evolution of TRIP strain and damage is presented in Figure 22. The first 50 cycles of TRIP strain are shown in Figure 22a. It is observed that the material undergoes a rapid stabilization, where TRIP strain reaches a constant value, around 5 cycles. Figure 22b shows the evolution of functional and structural damage. After 73 cycles, the functional damage reaches a value of approximately 17.5%, promoting the reduction of the functional properties of the material. On the other hand, the structural damage follows a trend of linear evolution reaching approximately 7.5% in the last cycle before the failure. Figure 22c shows the evolution of over the cycles until reaching .
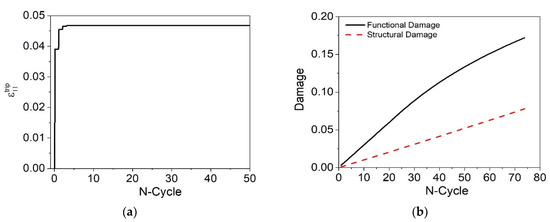
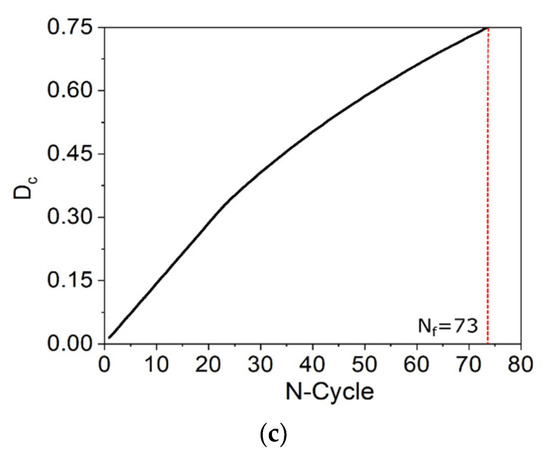
Figure 22.
TRIP strain and damage evolution. (a) TRIP evolution; (b) functional and structural damage evolution; (c) evolution.
Finally, Table 7 shows the comparison of experimental fatigue lifetime performed by Zhao et al. [18] and that predicted by the model. It is possible to observe that by increasing the level of the applied peak stress, a greater accumulation of functional and structural damage occurs, promoting a reduction in the fatigue life of the material. It should be pointed out that predictions present discrepancies less than 11% except for the case with , where the discrepancy is around 30%. Since fatigue experimental tests have large dispersion associated with several aspects such as micro-defects and surface conditions, these results can be considered as a good fatigue life prediction. On this basis, these results attest to the model’s capability to describe different thermomechanical behaviors associated with SMAs including NiTi alloys subjected to one-way shape memory effect.
Table 7.
Number of cycles to failure (Nf). Comparison between experimental results obtained by Zhao et al. [18] and predicted by the model.
4. Conclusions
This work presents a numerical investigation of the influence of functional and structural fatigue of shape memory alloys under different loading conditions. Numerical-experimental comparisons are performed using experimental results available in the literature and the constitutive model proposed by Dornelas et al. [15]. Four different loading conditions are analyzed: axial loading test, torsion test, thermal load tests, and one-way shape memory effect. In the case of the axial loading test, it is observed that the TRIP strain associated with the functional and structural damage promotes a loss of actuation performance with the increase of the number of cycles. A similar result is observed for the torsion test. Considering the thermal loading test, the temperature dependent behavior of SMAs promotes a significant reduction of the number of cycles until failure is observed with the increase of the maximum temperature. This is due to several phenomena including transformation induced plasticity and thermal strains. The case of one-way shape memory effect shows that a loss of actuation occurs over the cycles due to the evolution of functional and structural fatigue. The fatigue life of NiTi alloys subjected to the shape memory effect is also dependent on the applied stress. In this regard, by increasing the applied peak stress, a reduction of the fatigue life is observed. In general, the proposed simulations allow one to have a proper comprehension of functional and structural fatigue, showing different phenomenological mechanisms behind the main effects. Structural and functional fatigue are represented in close agreement with experimental tests, allowing proper predictions of fatigue life and loss of performance.
Author Contributions
Conceptualization, V.M.D., S.A.O. and M.A.S.; methodology, V.M.D., S.A.O. and M.A.S.; software, V.M.D., S.A.O. and M.A.S.; validation, V.M.D., S.A.O., M.A.S. and P.M.C.L.P.; formal analysis, V.M.D., S.A.O., M.A.S. and P.M.C.L.P.; investigation, V.M.D., S.A.O. and M.A.S.; resources, M.A.S. and P.M.C.L.P.; data curation, V.M.D., S.A.O. and M.A.S.; writing—original draft preparation, V.M.D., S.A.O. and M.A.S.; writing—review and editing, M.A.S. and P.M.C.L.P.; visualization, V.M.D., S.A.O. and M.A.S.; supervision, M.A.S.; project administration, M.A.S.; funding acquisition, M.A.S. All authors have read and agreed to the published version of the manuscript.
Funding
This research was supported by the Brazilian Research Agencies CNPq, FAPERJ and CAPES.
Institutional Review Board Statement
Not applicable.
Informed Consent Statement
Not applicable.
Data Availability Statement
Not applicable.
Conflicts of Interest
The authors declared no potential conflict of interest with respect to the research, authorship, and/or publication of this article.
Appendix A
This appendix presents a brief discussion about constitutive model parameters, the formulation of the auxiliary variables, and phase transformation constraints. More details about the formulation can be found in Paiva et al. [40], Oliveira et al. [38,44,45] and Dornelas et al. [15,37].
To take into account a three-dimensional description of SMAs, the equivalent strain field, , is defined to represent a phase transformation inductor responsible for the definition of the induced martensitic variant:
where, and represent the volumetric and deviatoric terms, respectively, that are given by:
The deviatoric elastic strain is given by:
and
where is the Kronecker delta and is the elastic strain.
Auxiliary variables considered in the formulation of thermodynamic forces can be written as follows:
Internal constraints are defined to establish the appropriate conditions for the phase transformation. They are described through sub-differentials of the indicator functions or by Lagrange multipliers which represent internal constraints, and can be geometrically interpreted by the tetrahedron of volume fraction variables [45], where represents the phase coexistence constraints associated with the convex set .
Another constraint is defined by ; it establishes the conditions for internal sub-loops due to incomplete phase transformations related to the convex set defined for mechanical loadings and thermal loadings from its subsets, as follows:
Phase transformations governed by mechanical loadings, :
Phase transformations governed by thermal loadings, (subsets , , ):
where and are the values of and , respectively, when the phase transformation begins.
Temperature functions, and , define the critical stress value for the phase transformation level.
where TM is the temperature below which the martensitic phase becomes stable for a stress-free state; and are the stress phase transformation values for martensite and austenite, respectively.
In addition, is a fourth-order tensor that controls the stress–strain hysteresis loop width represented by a matrix (assuming the hypothesis of symmetry), considering the parameters and , related to normal and shear behaviors, respectively, similar to the isotropic elastic tensor.
Moreover, is a symmetric second-order tensor related to the loading history:
In addition, for mechanical loadings obtained through non-simultaneous, multiaxial loadings, the parameter is calculated for the subsequent loadings (assuming stress driving cases), as written below:
where is the maximum value of the mechanical loading that can be a stress or a strain. Additionally, note that if .
Considering the thermoelastic parameters, is the elastic tensor and is related to the thermal expansion coefficient, and can be represented by the same general form: ; .
Concerning classical plasticity parameters, is the plastic modulus; is the kinematic hardening modulus. These parameters can be defined considering a rule of mixture: and . Additionally, determines the coupling between phase transformation and isotropic hardening. The coupling between phase transformation and kinematic hardening is defined by the second-order tensor, .
The yield surface is defined by the yield stress that has different values for austenitic and martensitic phases.
where is the temperature above which the austenitic phase is stable; is a reference temperature for the determination of the yield stress for high temperatures; is yield stress of the martensitic phase; and define the thermal variation of the yield stress of the austenitic phase.
The internal dissipation during the phase transformation is represented by the parameters , and as follows:
The parameters , , , , and are obtained taking into account fourth-order tensors, assuming the isotropy of the material. In this sense, consider a general formulation defined from the symbol that represents each of the previous parameters, as follows:
where is given by:
where and represent normal and shear components of the specific parameter, respectively.
The TRIP effect is described by the parameters and , defined by , where is a saturation parameter. To control the amount of TRIP strain at different temperatures, the following expressions are written:
where is a reference value of at and is a temperature below which TRIP should not occur.
In addition, other parameters , , , , , , , also present a saturation characteristic as follows:
where is used to obtain an appropriate adjustment, and is a saturation parameter.
Appendix B
List of Symbols:
| Austenite phase | |
| Parameters to control the evolution of functional damage | |
| Parameters to control the evolution of structural damage | |
| Equivalent critical damage | |
| State at which reaches a critical value | |
| Internal variable associated with structural damage | |
| Internal variable associated with functional damage | |
| Elastic moduli for austenite and martensite phases | |
| Elastic tensor | |
| Elastic tensor of austenite and martensite phases | |
| Yield surface | |
| Kinematic hardening modulus | |
| Kinematic hardening modulus of austenite and martensite phases | |
| Plastic modulus | |
| Plastic modulus of austenite and martensite phases | |
| Parameters related to the critical stress due to positive (+) and negative (−) detwinned martensite phase | |
| Parameters related to the critical stress due to the austenitic phase | |
| Twinned martensite | |
| Positive (+) and negative (−) detwinned martensite | |
| Parameters associated with the TRIP effect | |
| The reference value of the parameter | |
| Parameters related to the saturation effect | |
| Number of cycles until failure | |
| General formulation of the parameters , , , , e | |
| Auxiliary variables | |
| Second-order tensor defined from the loading history | |
| The maximum value of the mechanical loading | |
| Temperature | |
| Reference temperature in a stress-free state | |
| Temperature above which the austenitic phase is stable | |
| Reference temperature for the determination of the yield stress for high temperatures | |
| Temperature below which the martensitic phase is stable | |
| Temperature below which the TRIP strain does not occur | |
| Parameter that controls the height of the stress–strain hysteresis loop | |
| Normal and shear components of the tensor | |
| Fourth-order tensor that controls the stress–strain hysteresis loop width | |
| Volume fraction associated with the martensitic variants, , and the austenite phase, A | |
| Volume fraction associated with the starting of the phase transformation process | |
| Plastic multiplier | |
| Equivalent strain field | |
| Equivalent strain field to the initial state | |
| Equivalent stress field | |
| Kronecker delta | |
| Elastic strain tensor | |
| Deviatoric strain tensor | |
| Plastic strain tensor | |
| TRIP strain tensor | |
| Parameters employed to represent the martensite and austenite structural fatigue strength | |
| Parameters associated with the internal dissipation | |
| Parameters associated with the internal dissipation | |
| Parameters associated with the internal dissipation | |
| Parameter that defines the coupling between the phase transformation and isotropic hardening | |
| Parameter that defines the coupling between the phase transformation and kinematic hardening | |
| Parameter related to the tensor | |
| Sub-differential of the convex set | |
| Sub-differential of the convex set | |
| Temperature functions that define the critical stress value for the phase transformation | |
| Phase transformation values for austenite and martensite phases | |
| Internal variable associated with isotropic hardening | |
| Saturation variables for each phase | |
| Yield stress | |
| Yield stress of the martensitic phase | |
| Yield stress of the austenitic phase at temperatures and | |
| Stress tensor | |
| Deviatoric stress tensor | |
| Internal variable associated with kinematic hardening | |
| Pseudo-potential of dissipation | |
| Helmholtz free energy density | |
| Auxiliary variable | |
| Thermal expansion coefficients for austenite and martensite phases | |
| Tensor related to the thermal expansion coefficients | |
| Tensor related to the thermal expansion coefficients of the austenite and martensite |
References
- Otsuka, K.; Ren, X. Physical metallurgy of TiNi based shape memory alloys. Prog. Mater. Sci. 2005, 50, 511–678. [Google Scholar] [CrossRef]
- Lagoudas, D.C. Shape Memory Alloys, Modeling and Engineering Applications; Springer: Austin, TX, USA, 2008; ISBN 9780387476858. [Google Scholar]
- Yamauchi, K.; Ohkata, I.; Tsuchiya, K.; Miyazaki, S. Shape Memory and Superelastic Alloys: Applications and Technologies; Woodhead Publishing: Cambridge, UK, 2011; ISBN 9780857092625. [Google Scholar]
- Van Humbeeck, J. Non-medical applications of shape memory alloys. Mater. Sci. Eng. A 1999, 273, 134–148. [Google Scholar] [CrossRef]
- Janke, L.; Czaderski, C.; Motavalli, M.; Ruth, J. Applications of shape memory alloys in civil engineering structures—Overview, limits and new ideas. Mater. Struct. 2005, 38, 578–592. [Google Scholar] [CrossRef]
- Isalgue, A.; Lovey, F.C.; Terriault, P.; Martorell, F.; Torra, R.M.; Torra, V. SMA for dampers in civil engineering. Mater. Trans. 2006, 47, 682–690. [Google Scholar] [CrossRef]
- Lecce, L.; Concilio, A. Shape Memory Alloy Engineering for Aerospace, Structural and Biomedical Applications; Butterworth-Heinemann: Oxford, UK, 2015; ISBN 9780080999203. [Google Scholar]
- Jani, J.M.; Leary, M.; Subic, A.; Gibson, M.A. A review of shape memory alloy research, applications and opportunities. Mater. Des. 2013, 56, 1078–1113. [Google Scholar] [CrossRef]
- Chang, W.S.; Araki, Y. Use of shape-memory alloys in construction: A critical interview. Proc. Inst. Civ. Eng. 2016, 169, 87–95. [Google Scholar] [CrossRef]
- Nematollahi, M.; Baghbaderani, K.S.; Amerinatanzi, A.; Zamanian, H.; Elahinia, M. Application of NiTi in assistive and rehabilitation devices: A review. Bioengineering 2019, 6, 37. [Google Scholar] [CrossRef] [PubMed]
- Suresh, S. Fatigue of Materials, 2nd ed.; Cambridge University Press: Cambridge, UK, 1998; ISBN 9780511806575. [Google Scholar]
- Lee, Y.L.; Pan, J.; Hathaway, R.; Barkey, M. Fatigue Testing and Analysis: Theory and Practice; Butterworth-Heinemann: Oxford, UK, 2004; ISBN 0750677198. [Google Scholar]
- Eggeler, G.; Hornbogen, E.; Yawny, A.; Heckmann, A.; Wagner, M. Structural and functional fatigue of NiTi shape memory alloys. Mater. Sci. Eng. A 2004, 378, 24–33. [Google Scholar] [CrossRef]
- Tyc, O.; Heller, L.; Vronka, M.; Sittner, P. Effect of temperature on fatigue of superelastic NiTi wires. Int. J. Fatigue 2020, 134, 105470. [Google Scholar] [CrossRef]
- Dornelas, V.M.; Oliveira, S.A.; Savi, M.A.; Pacheco, P.M.C.L.; De Souza, L.F.G. Fatigue on shape memory alloys: Experimental observations and constitutive modeling. Int. J. Solids Struct. 2021, 213, 1–24. [Google Scholar] [CrossRef]
- Qin, X.; Zhang, X.; Yan, X.; Wang, S.; Zhang, S.; Guo, C.; Jiang, J.; Zhang, B.; Huang, D.; Qi, M. Structural and functional fatigue behavior of Ni49.8 Ti50.2 (at.%) wires under various maximum heating temperatures: Experimental and modeling study. Mater. Des. 2019, 178, 107842. [Google Scholar] [CrossRef]
- Predki, W.; Klönne, M.; Knopik, A. Cyclic torsional loading of pseudoelastic NiTi shape memory alloys: Damping and fatigue failure. Mater. Sci. Eng. A 2006, 417, 182–189. [Google Scholar] [CrossRef]
- Zhao, T.; Kang, G.; Yu, C.; Kan, Q. Experimental study on whole-life one-way shape memory cyclic degradation and fatigue failure of NiTi shape memory alloy. Mater. Today Commun. 2020, 25, 101621. [Google Scholar] [CrossRef]
- Tobushi, H.; Hachisuka, T.; Hashimoto, T.; Yamada, S. Cyclic deformation and fatigue of a TiNi shape-memory alloy wire subjected to rotating bending. ASME. J. Eng. Mater. Technol. 1998, 120, 64–70. [Google Scholar] [CrossRef]
- Figueiredo, A.M.; Modenesi, P.; Buono, V. Low-cycle fatigue life of superelastic NiTi wires. Int. J. Fatigue 2009, 31, 751–758. [Google Scholar] [CrossRef]
- Ramos, A.D.O.; De Araújo, C.J.; De Oliveira, H.M.R.; Macêdo, A.; Lima, A.G.B. An experimental investigation of the superelastic fatigue of NiTi SMA wires. J. Braz. Soc. Mech. Sci. Eng. 2018, 40, 206. [Google Scholar] [CrossRef]
- Jaureguizahar, S.M.; Chapetti, M.D.; Yawny, A. A novel experimental method to assess the fatigue behavior of pseudoelastic NiTi wires. Int. J. Fatigue 2018, 116, 300–305. [Google Scholar] [CrossRef]
- Qiu, B.; Kan, Q.; Kang, G.; Yu, C.; Xie, X. Rate-dependent transformation ratcheting-fatigue interaction of super-elastic NiTi alloy under uniaxial and torsional loadings: Experimental observation. Int. J. Fatigue 2019, 127, 470–478. [Google Scholar] [CrossRef]
- Frenzel, J. On the importance of structural and functional fatigue in shape memory technology. Shap. Mem. Superelast. 2020, 6, 213–222. [Google Scholar] [CrossRef]
- Mahtabi, M.J.; Shamsaei, N.; Mitchell, M.R. Fatigue of Nitinol: The state-of-the-art and ongoing challenges. J. Mech. Behav. Biomed. Mater. 2015, 50, 228–254. [Google Scholar] [CrossRef] [PubMed]
- Moumni, Z.; Zhang, Y.; Wang, J.; Gu, X. A global approach for the fatigue of shape memory alloys. Shap. Mem. Superelast. 2018, 4, 385–401. [Google Scholar] [CrossRef]
- Paiva, A.; Savi, M.A. An overview of constitutive models for shape memory alloys. Math. Probl. Eng. 2006, 2006, 1–30. [Google Scholar] [CrossRef]
- Cisse, C.; Zaki, W.; Zineb, T.B. A review of constitutive models and modeling techniques for shape memory alloys. Int. J. Plast. 2016, 76, 244–284. [Google Scholar] [CrossRef]
- Cisse, C.; Zaki, W.; Zineb, T.B. A review of modeling techniques for advanced effects in shape memory alloy behavior. Smart Mater. Struc. 2016, 25, 1–36. [Google Scholar] [CrossRef]
- Yu, C.; Kang, G.; Kan, Q.; Song, D. A micromechanical constitutive model based on crystal plasticity for thermo-mechanical cyclic deformation of NiTi shape memory alloys. Int. J. Plast. 2013, 44, 161–191. [Google Scholar] [CrossRef]
- Auricchio, F.; Constantinescu, A.; Menna, C.; Scalet, G. A shakedown analysis of high cycle fatigue of shape memory alloys. Int. J. Fatigue 2016, 87, 112–123. [Google Scholar] [CrossRef]
- Gu, X.; Moumni, Z.; Zaki, W.; Zhang, W. Shakedown based model for high-cycle fatigue of shape memory alloys. Smart Mater. Struct. 2016, 25, 115012. [Google Scholar] [CrossRef]
- Liu, B.; Chen, K.; Zhou, R. Damage evolution and fatigue life prediction of the shape memory alloy under low cycle fatigue. Mater. Today Commun. 2020, 26, 101636. [Google Scholar] [CrossRef]
- Liu, B.; Jin, S.; Li, X.; Zhou, R. Study on behaviors of shape memory alloy materials under temperature cycling considering the damage. J. Intell. Mater. Syst. Struct. 2020, 31, 990–997. [Google Scholar] [CrossRef]
- Mohammadzadeh, M.R.; Kadkhodaei, M.; Barati, M.; Chirani, S.A.; Saint-Sulpice, L. Modeling of torsion fatigue in shape memory alloys. J. Intell. Mater. Syst. Struct 2019, 30, 3146–3162. [Google Scholar] [CrossRef]
- Petrini, L.; Bertini, A. A three-dimensional phenomenological model describing cyclic behavior of shape memory alloys. Int. J. Plast. 2020, 125, 348–373. [Google Scholar] [CrossRef]
- Dornelas, V.M.; Oliveira, S.A.; Savi, M.A. A macroscopic description of shape memory alloy functional fatigue. Int. J. Mech. Sci. 2020, 170, 105345. [Google Scholar] [CrossRef]
- Oliveira, S.A.; Savi, M.A.; Santos, I.F. Uncertainty analysis of a one-dimensional constitutive model for shape memory alloy thermomechanical description. Int. J. Appl. Mech. 2014, 6, 1450067. [Google Scholar] [CrossRef]
- Monteiro, P.C.C.; Savi, M.A.; Netto, T.A.; Pacheco, P.M.C.L. A phenomenological description of the thermomechanical coupling and the rate-dependent behavior of shape memory alloys. J. Intell. Mater. Syst. Struct. 2009, 20, 1675–1687. [Google Scholar] [CrossRef]
- Paiva, A.; Savi, M.A.; Braga, A.M.B.; Pacheco, P.M.C.L. A constitutive model for shape memory alloys considering tensile-compressive asymmetry and plasticity. Int. J. Solids Struct. 2005, 42, 3439–3457. [Google Scholar] [CrossRef]
- Savi, M.A.; Paiva, A. Describing internal subloops due to incomplete phase transformations in shape memory alloys. Arch. Appl. Mech. 2005, 74, 637–647. [Google Scholar] [CrossRef]
- Baêta-Neves, A.P.; Savi, M.A.; Pacheco, P.M.C.L. On the Fremond’s constitutive model for shape memory alloys. Mech. Res. Commun. 2004, 31, 677–688. [Google Scholar] [CrossRef]
- Savi, M.A.; Paiva, A.; Baêta-Neves, A.P.; Pacheco, P.M.C.L. Phenomenological modeling and numerical simulation of shape memory: A thermo-plastic-phase transformation coupled model. J. Intell. Mater. Syst. Struct. 2002, 3, 261–273. [Google Scholar] [CrossRef]
- Oliveira, S.A.; Dornelas, V.M.; Savi, M.A.; Pacheco, P.M.C.L.; Paiva, A. A phenomenological description of shape memory alloy transformation induced plasticity. Meccanica 2018, 53, 2503–2523. [Google Scholar] [CrossRef]
- Oliveira, S.A.; Savi, M.A.; Zouain, N. A three dimensional description of shape memory alloy thermomechanical behavior including plasticity. J. Braz. Soc. Mech. Sci. Eng. 2016, 38, 1451–1472. [Google Scholar] [CrossRef]
- Oliveira, S.A.; Savi, M.A.; Kalamkarov, A.L. A three-dimensional constitutive model for shape memory alloys. Arch. Appl. Mech. 2010, 80, 1163–1175. [Google Scholar] [CrossRef]
- Barrera, N.; Biscari, P.; Urbano, M.F. Macroscopic modeling of functional fatigue in shape memory alloys. Eur. J. Mech. A Solids 2014, 45, 101–109. [Google Scholar] [CrossRef]
- Hartl, D.J.; Chemisky, Y.; Meraghni, F. Three-dimensional constitutive model considering transformation-induced damage and resulting fatigue failure in shape memory alloys. In SPIE Smart Structures and Materials + Nondestructive Evaluation and Health Monitoring; International Society for Optics and Photonics: San Diego, CA, USA, 2014; p. 905805. [Google Scholar] [CrossRef]
- Chemisky, Y.; Hartl, D.J.; Meraghni, F. Three-dimensional constitutive model for structural and functional fatigue of shape memory alloy actuators. Int. J. Fatigue 2018, 112, 263–278. [Google Scholar] [CrossRef]
- Phillips, F.R.; Wheeler, R.W.; Geltmacher, A.B.; Lagoudas, D.C. Evolution of internal damage during actuation fatigue in shape memory alloys. Int. J. Fatigue 2019, 124, 315–327. [Google Scholar] [CrossRef]
- Halphen, B.; Nguyen, Q.S. Sur les matériaux standard généralisés. J. Mécanique 1975, 14, 39–63. [Google Scholar]
- Lemaitre, J.; Chaboche, J.L. Mechanics of Solid Materials; Cambridge University Press: Cambridge, UK, 1990; ISBN 9780521328531. [Google Scholar]
- Xu, L.; Solomou, A.; Baxevanis, T.; Lagoudas, D.C. A three-dimensional constitutive modeling for shape memory alloys considering two-way shape memory effect and transformation-induced plasticity. In Proceedings of the AIAA Scitech 2019 Forum, San Diego, CA, USA, 7–11 January 2019; p. 1195. [Google Scholar] [CrossRef]
- Belyaev, S.; Resnina, N.; Sibirev, A. Peculiarities of residual strain accumulation during thermal cycling of TiNi alloy. J. Alloys Compd. 2012, 542, 37–42. [Google Scholar] [CrossRef]
- Zhao, T.; Kang, G.; Yu, C.; Kan, Q. Experimental investigation of the cyclic degradation of the one-way shape memory effect of NiTi alloys. Int. J. Miner. Metall. 2019, 26, 1539–1550. [Google Scholar] [CrossRef]


Publisher’s Note: MDPI stays neutral with regard to jurisdictional claims in published maps and institutional affiliations. |
© 2021 by the authors. Licensee MDPI, Basel, Switzerland. This article is an open access article distributed under the terms and conditions of the Creative Commons Attribution (CC BY) license (https://creativecommons.org/licenses/by/4.0/).