
Structural Parameter Optimization for Large Spacing Sublevel Caving in Chengchao Iron Mine


Abstract
:1. Introduction
2. Theoretical Calculation of Optimal Structural Parameters
3. PFC Numerical Simulation Study
3.1. Optimization of Sublevel Height and Production Drift Spacing
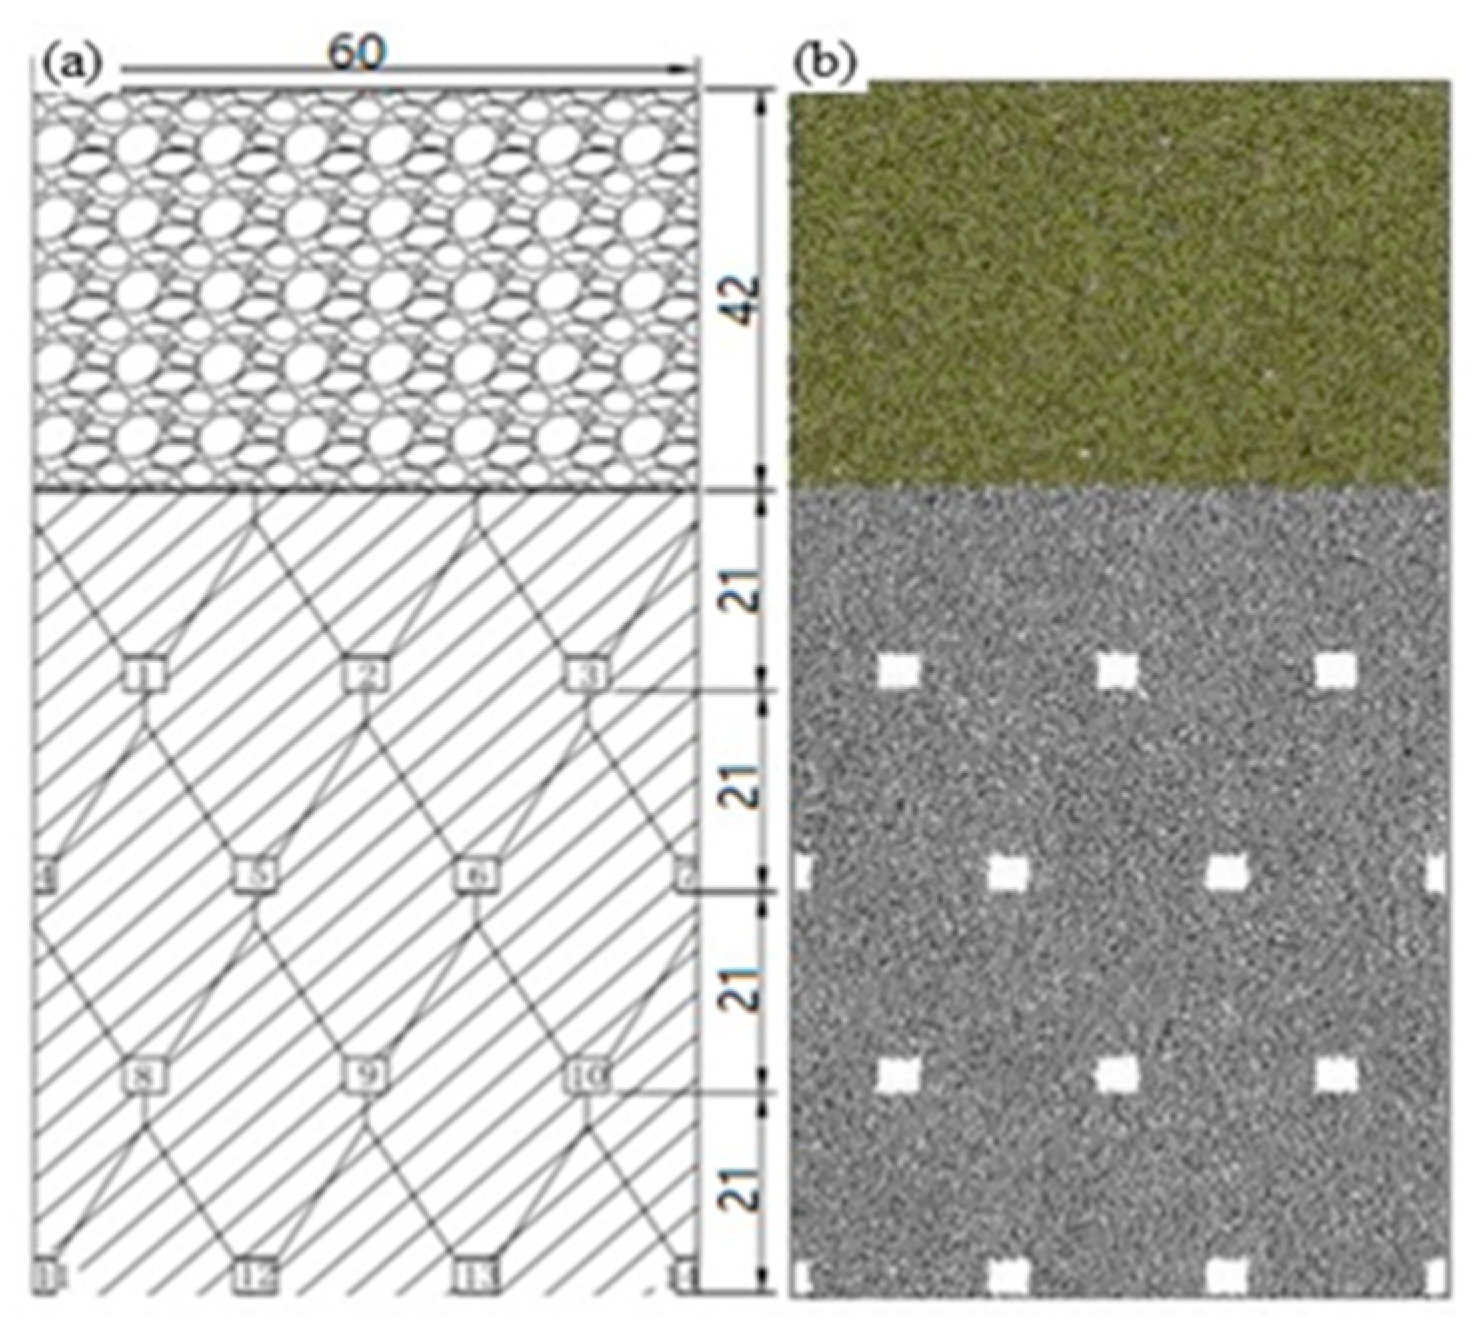
3.1.1. Simulation Scheme
3.1.2. Analysis of Simulation Results
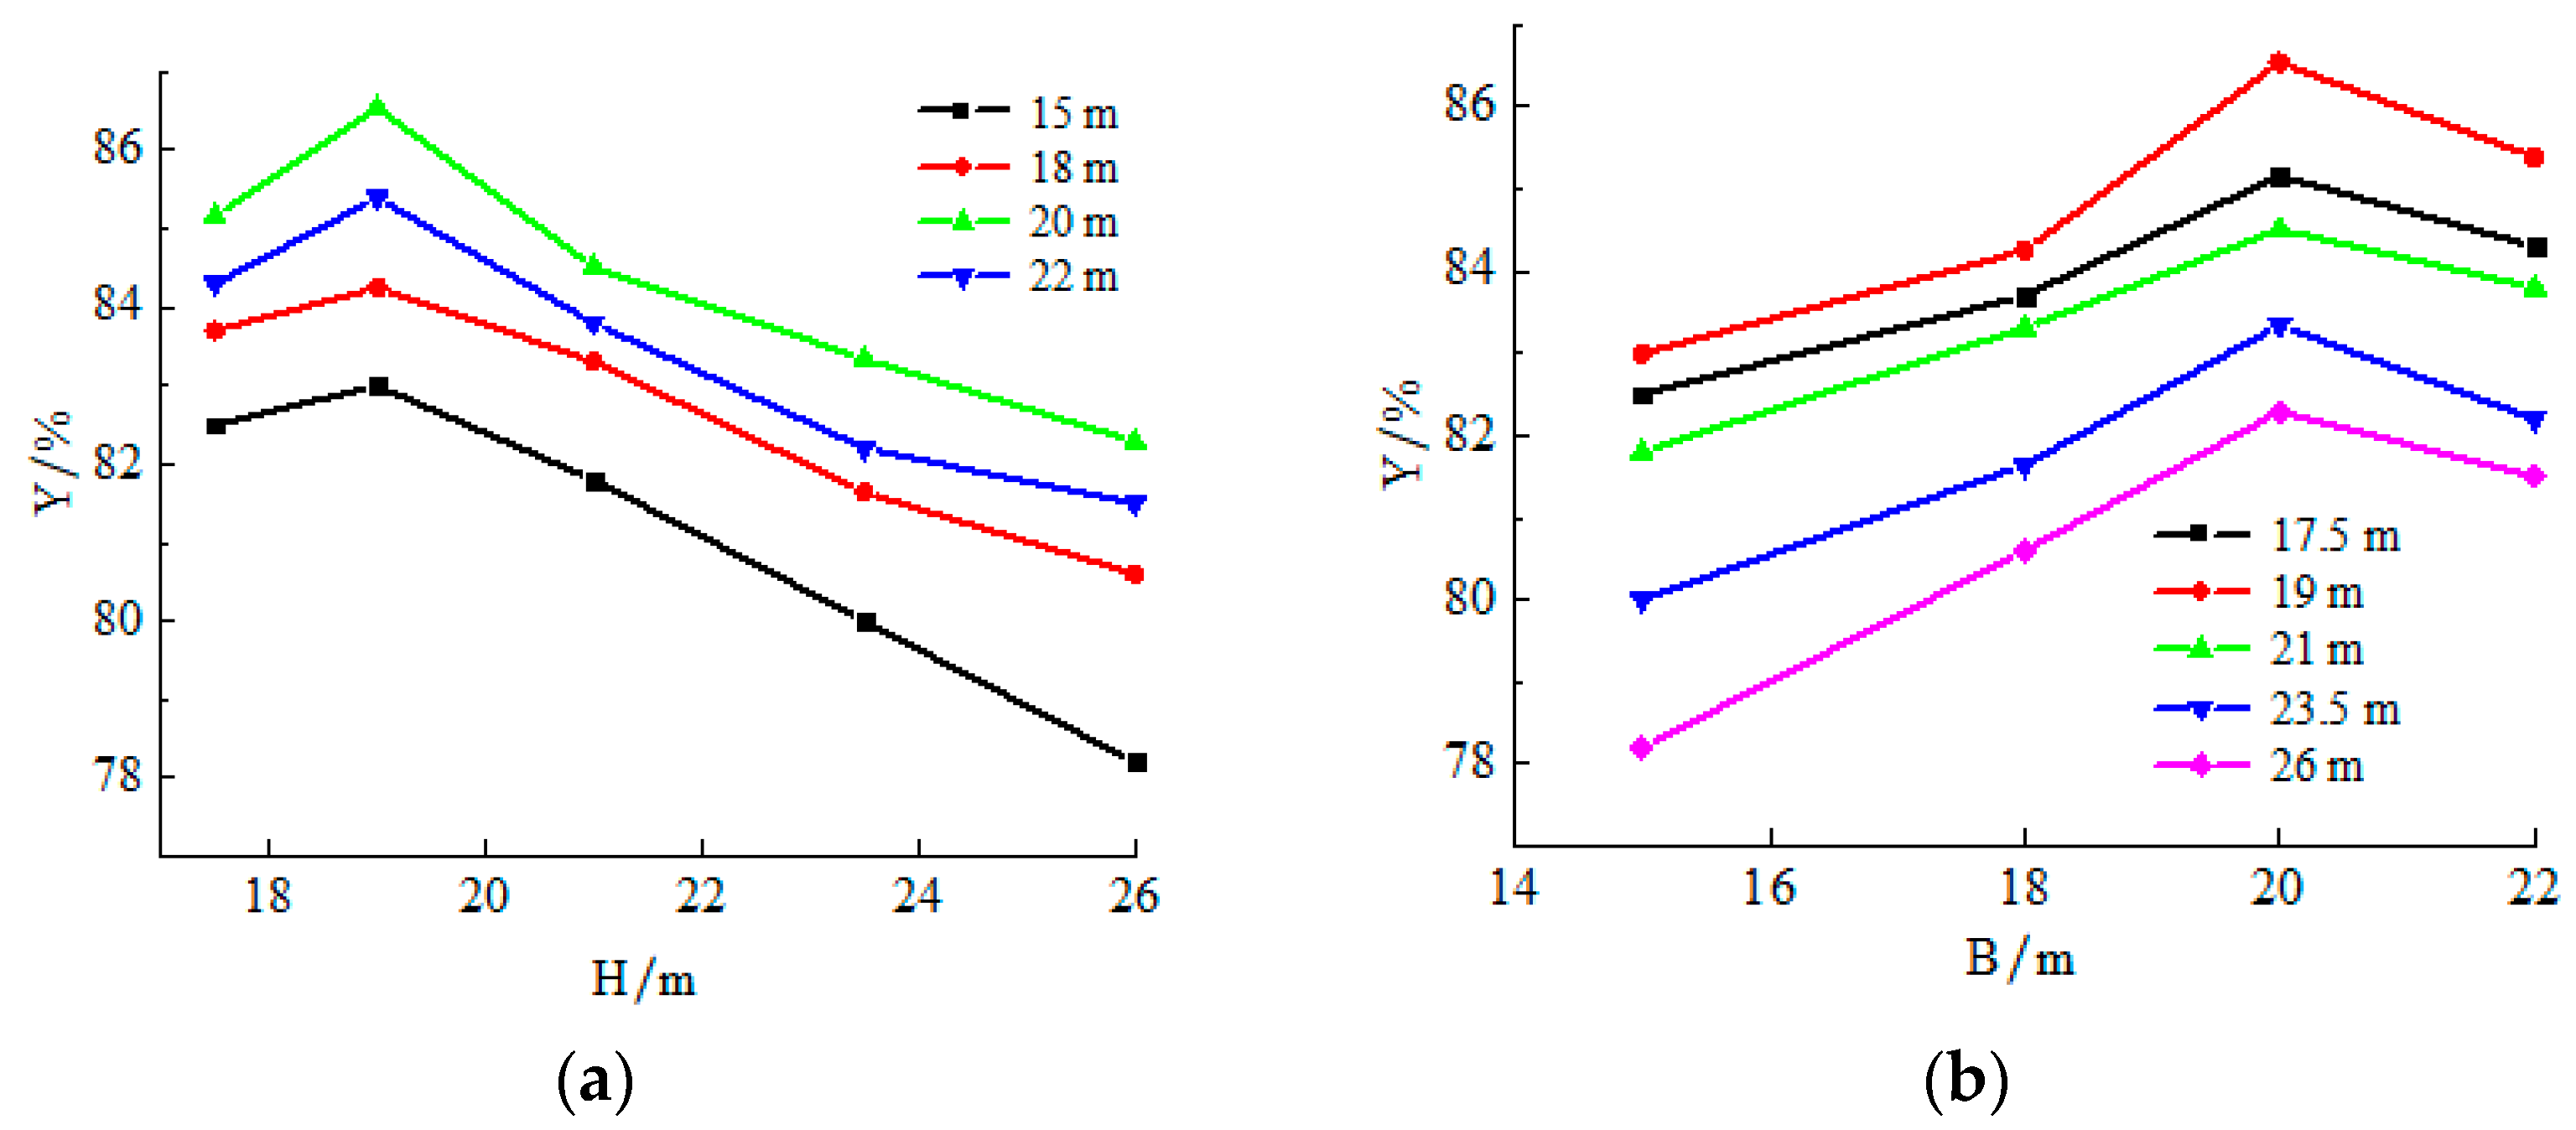
- (1)
- Single-factor analysis
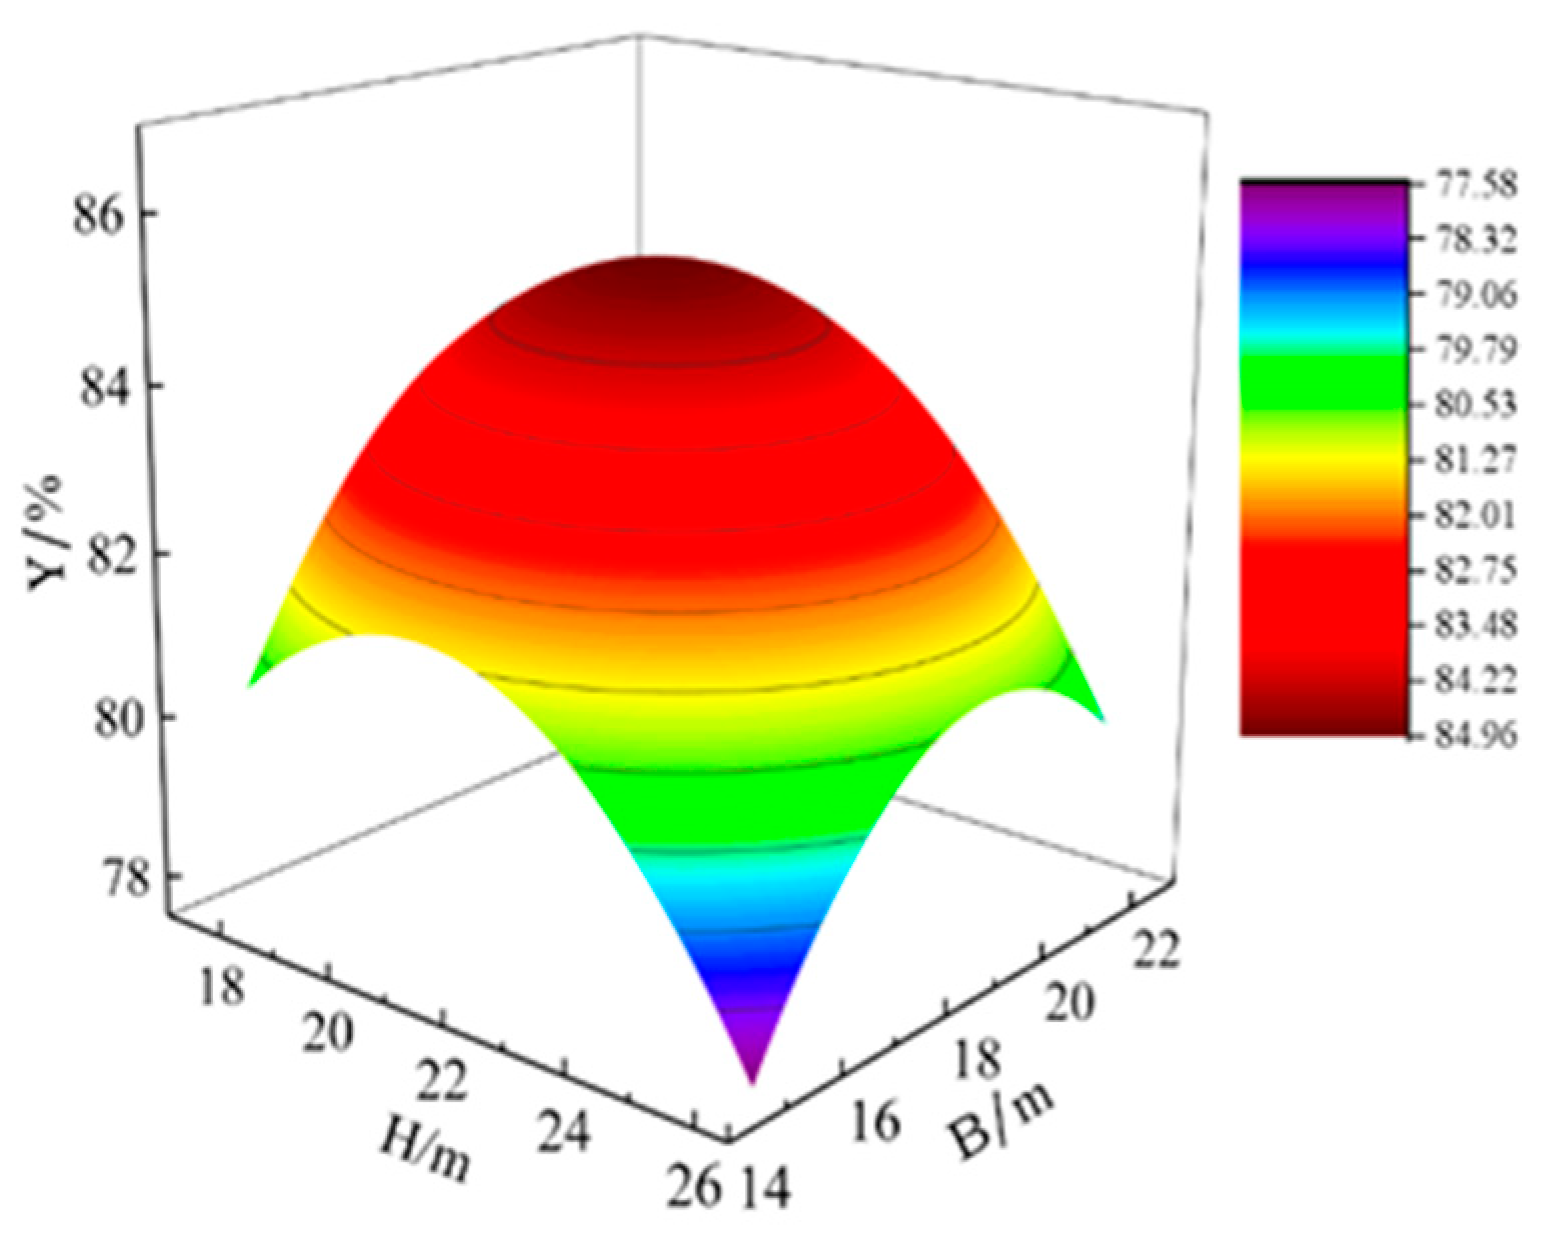
- (2)
- Comprehensive analysis
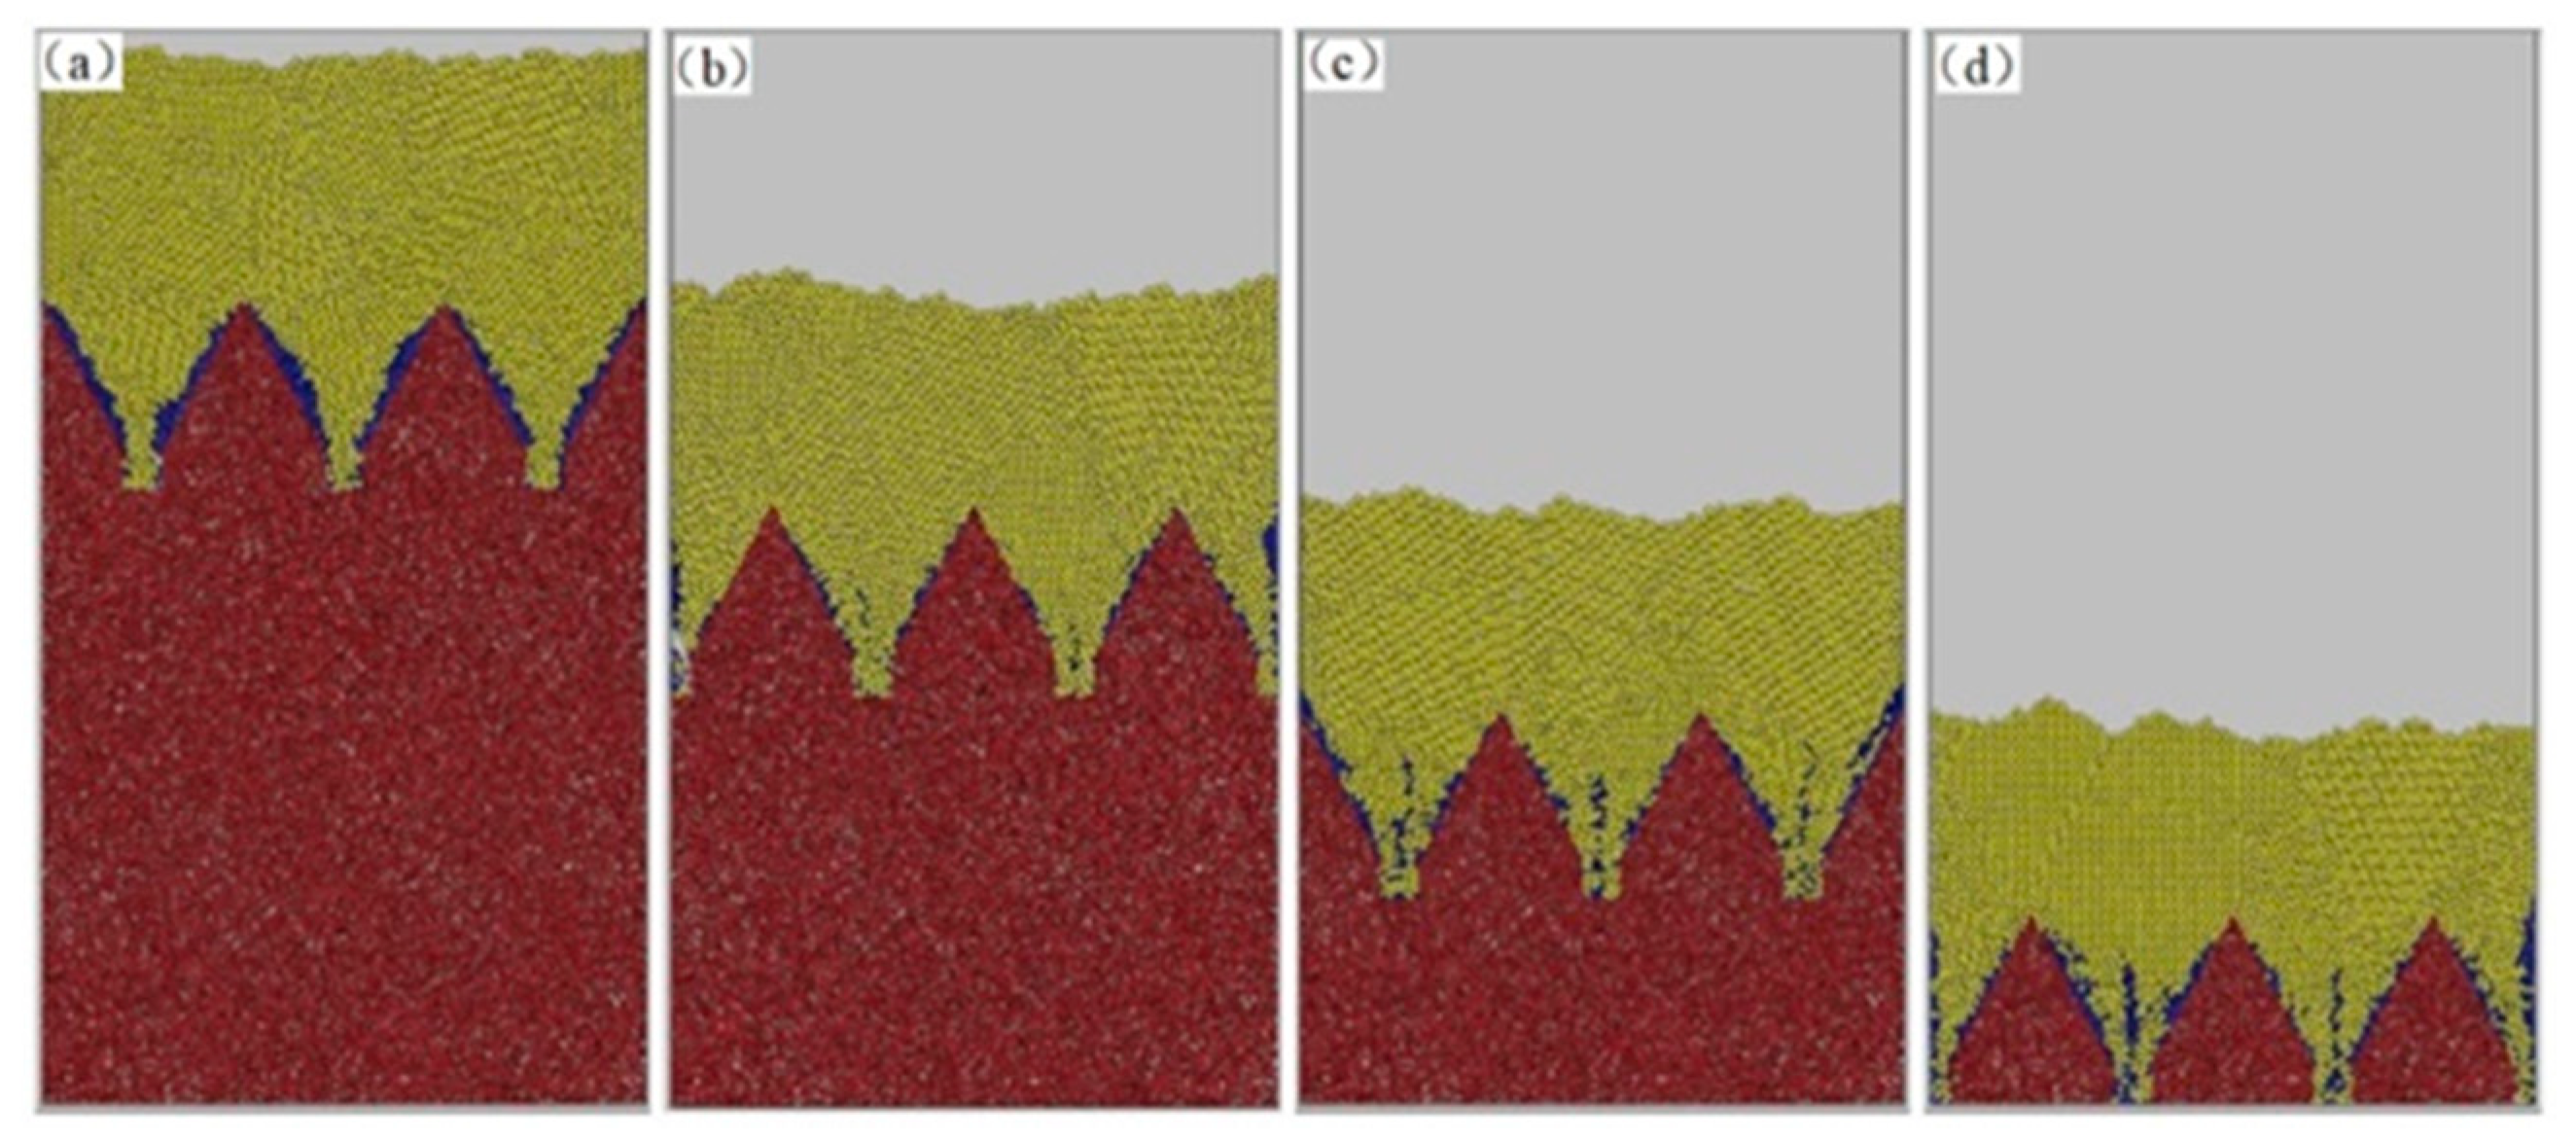
3.2. Optimization of the Caving Step
3.2.1. Simulation Scheme
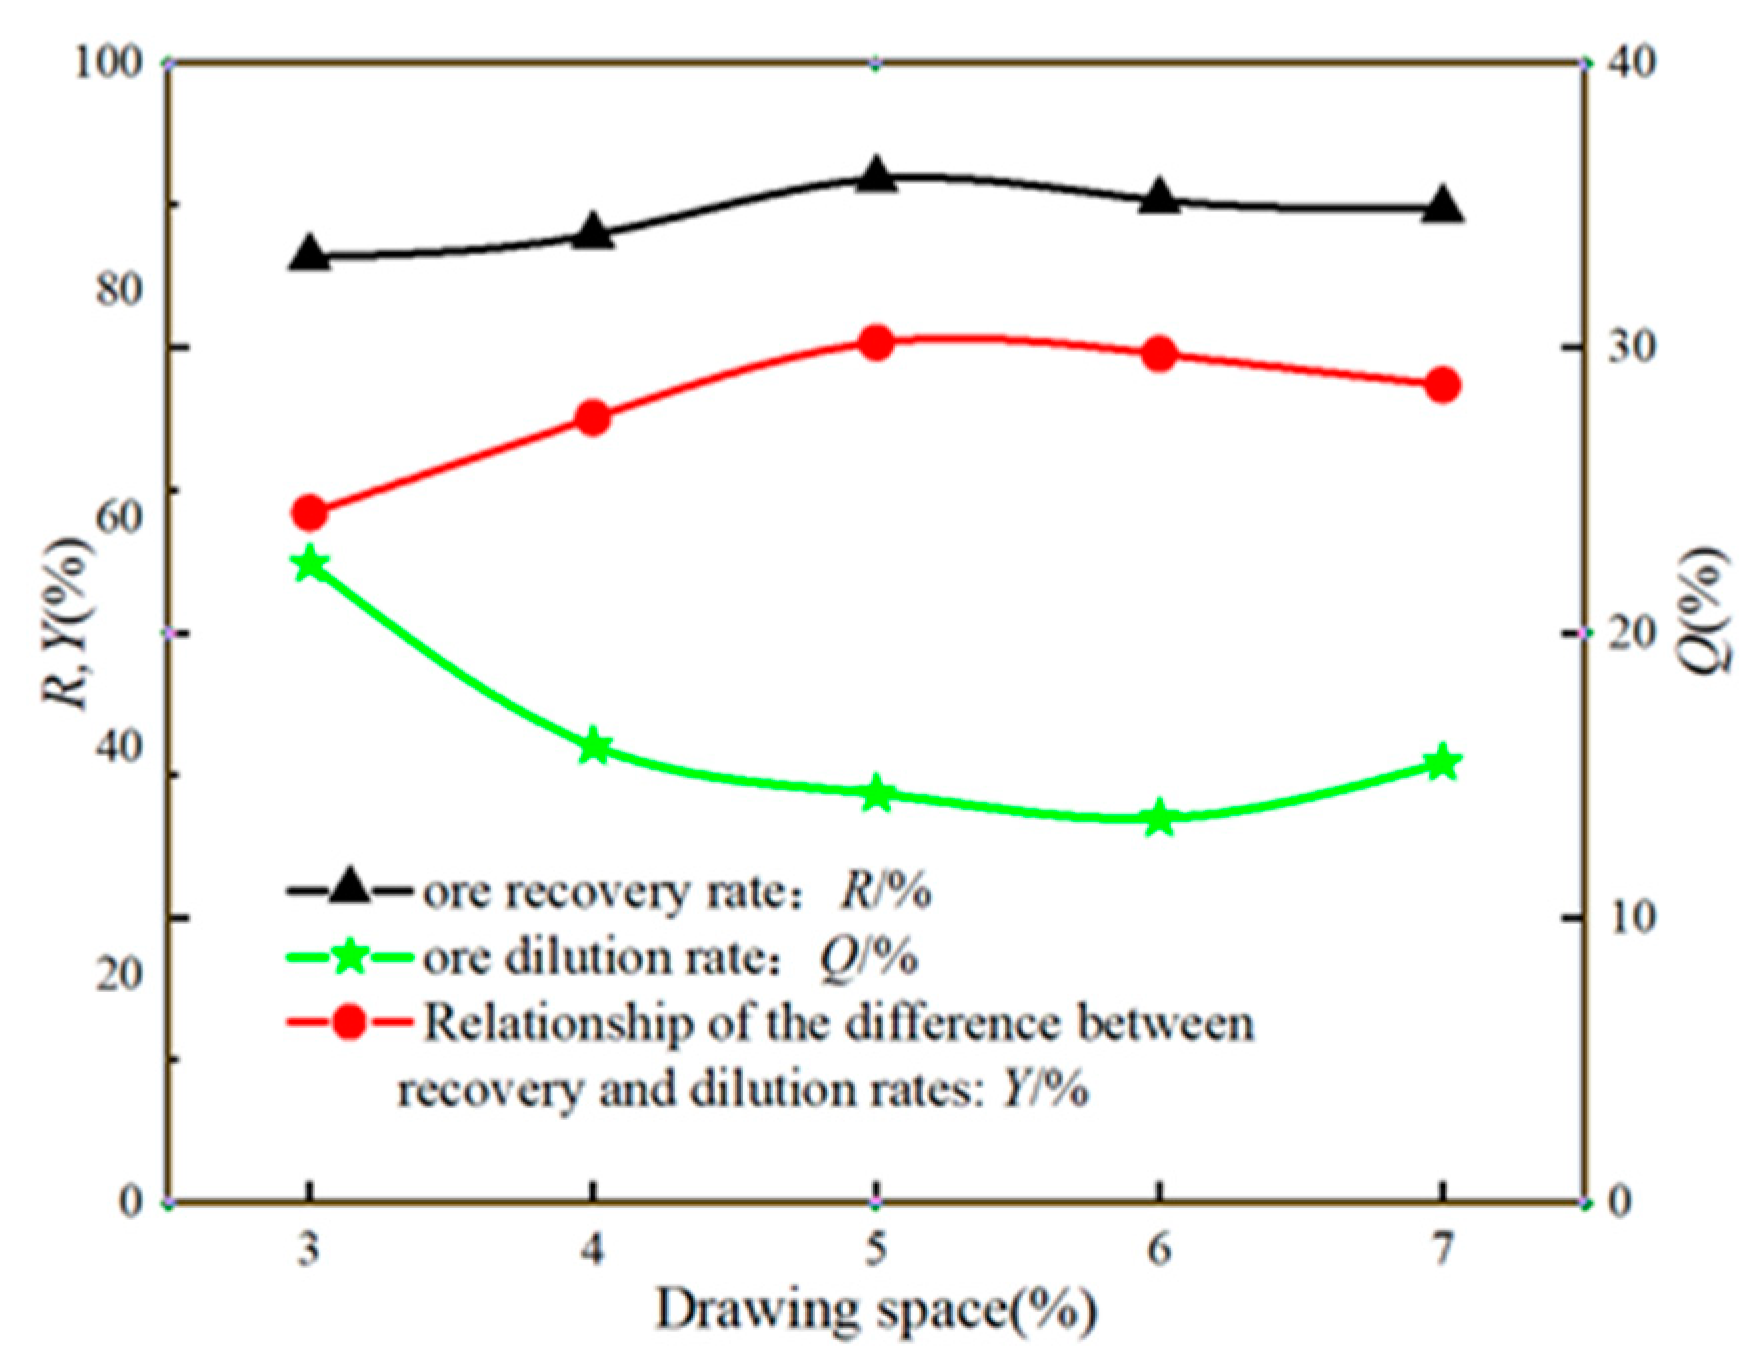
3.2.2. Analysis of Simulation Results
- (1)
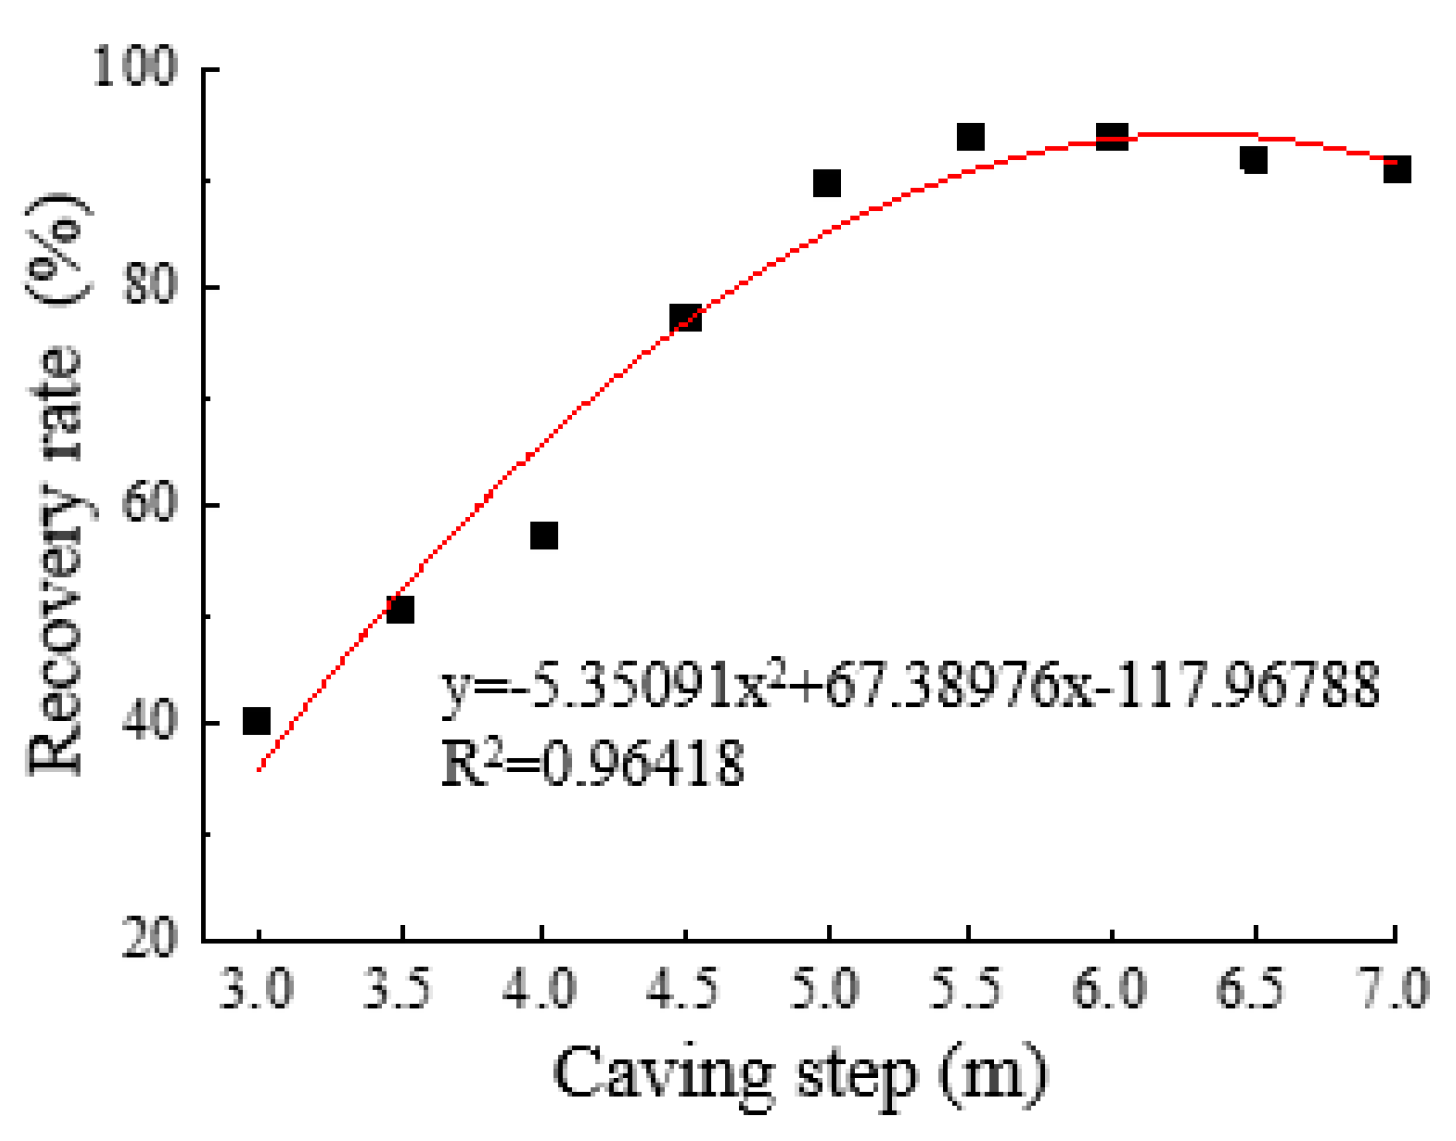
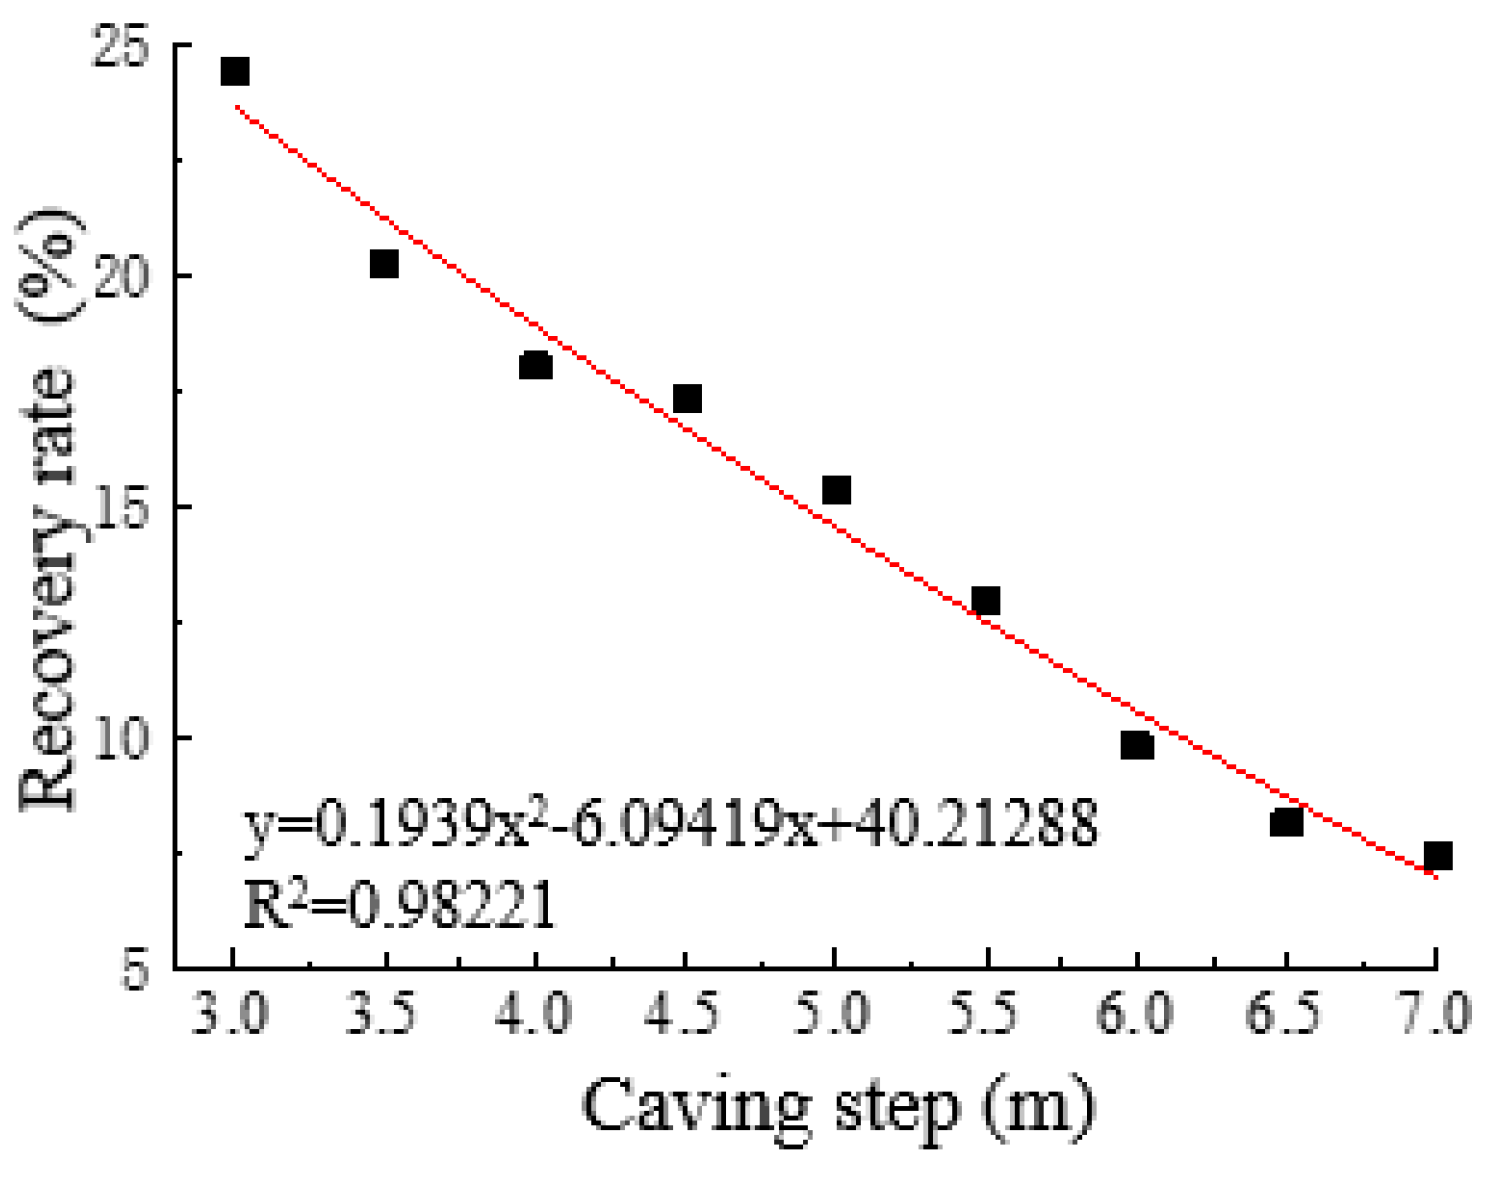
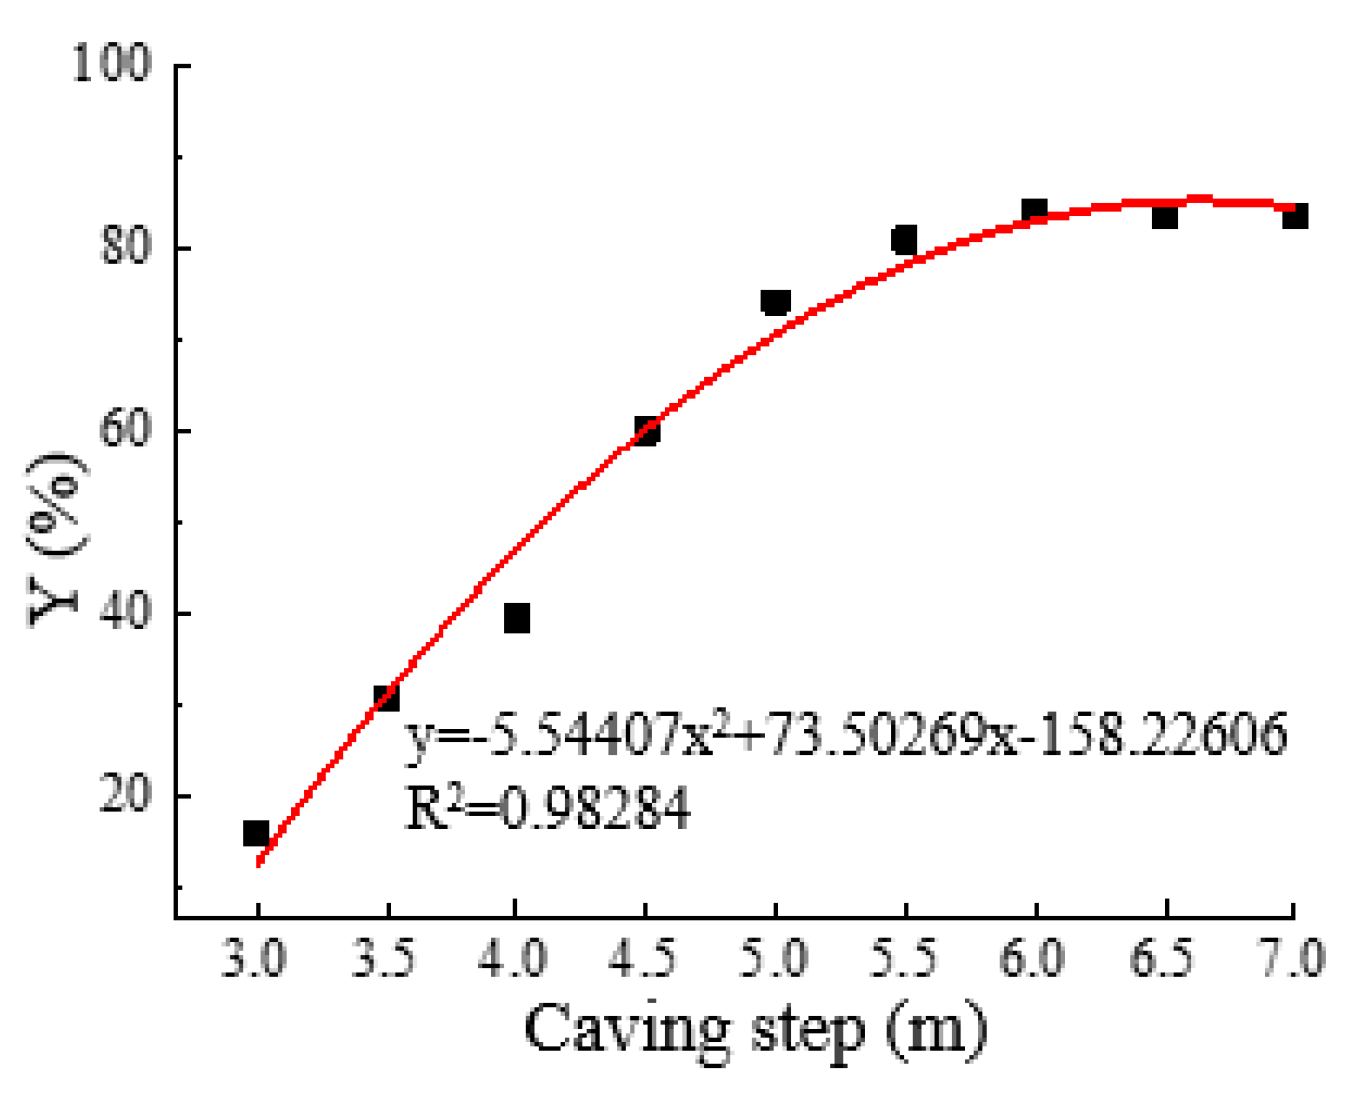
- Recovery ratio
- (2)
- Dilution ratio
- (3)
- Difference between recovery and dilution ratio
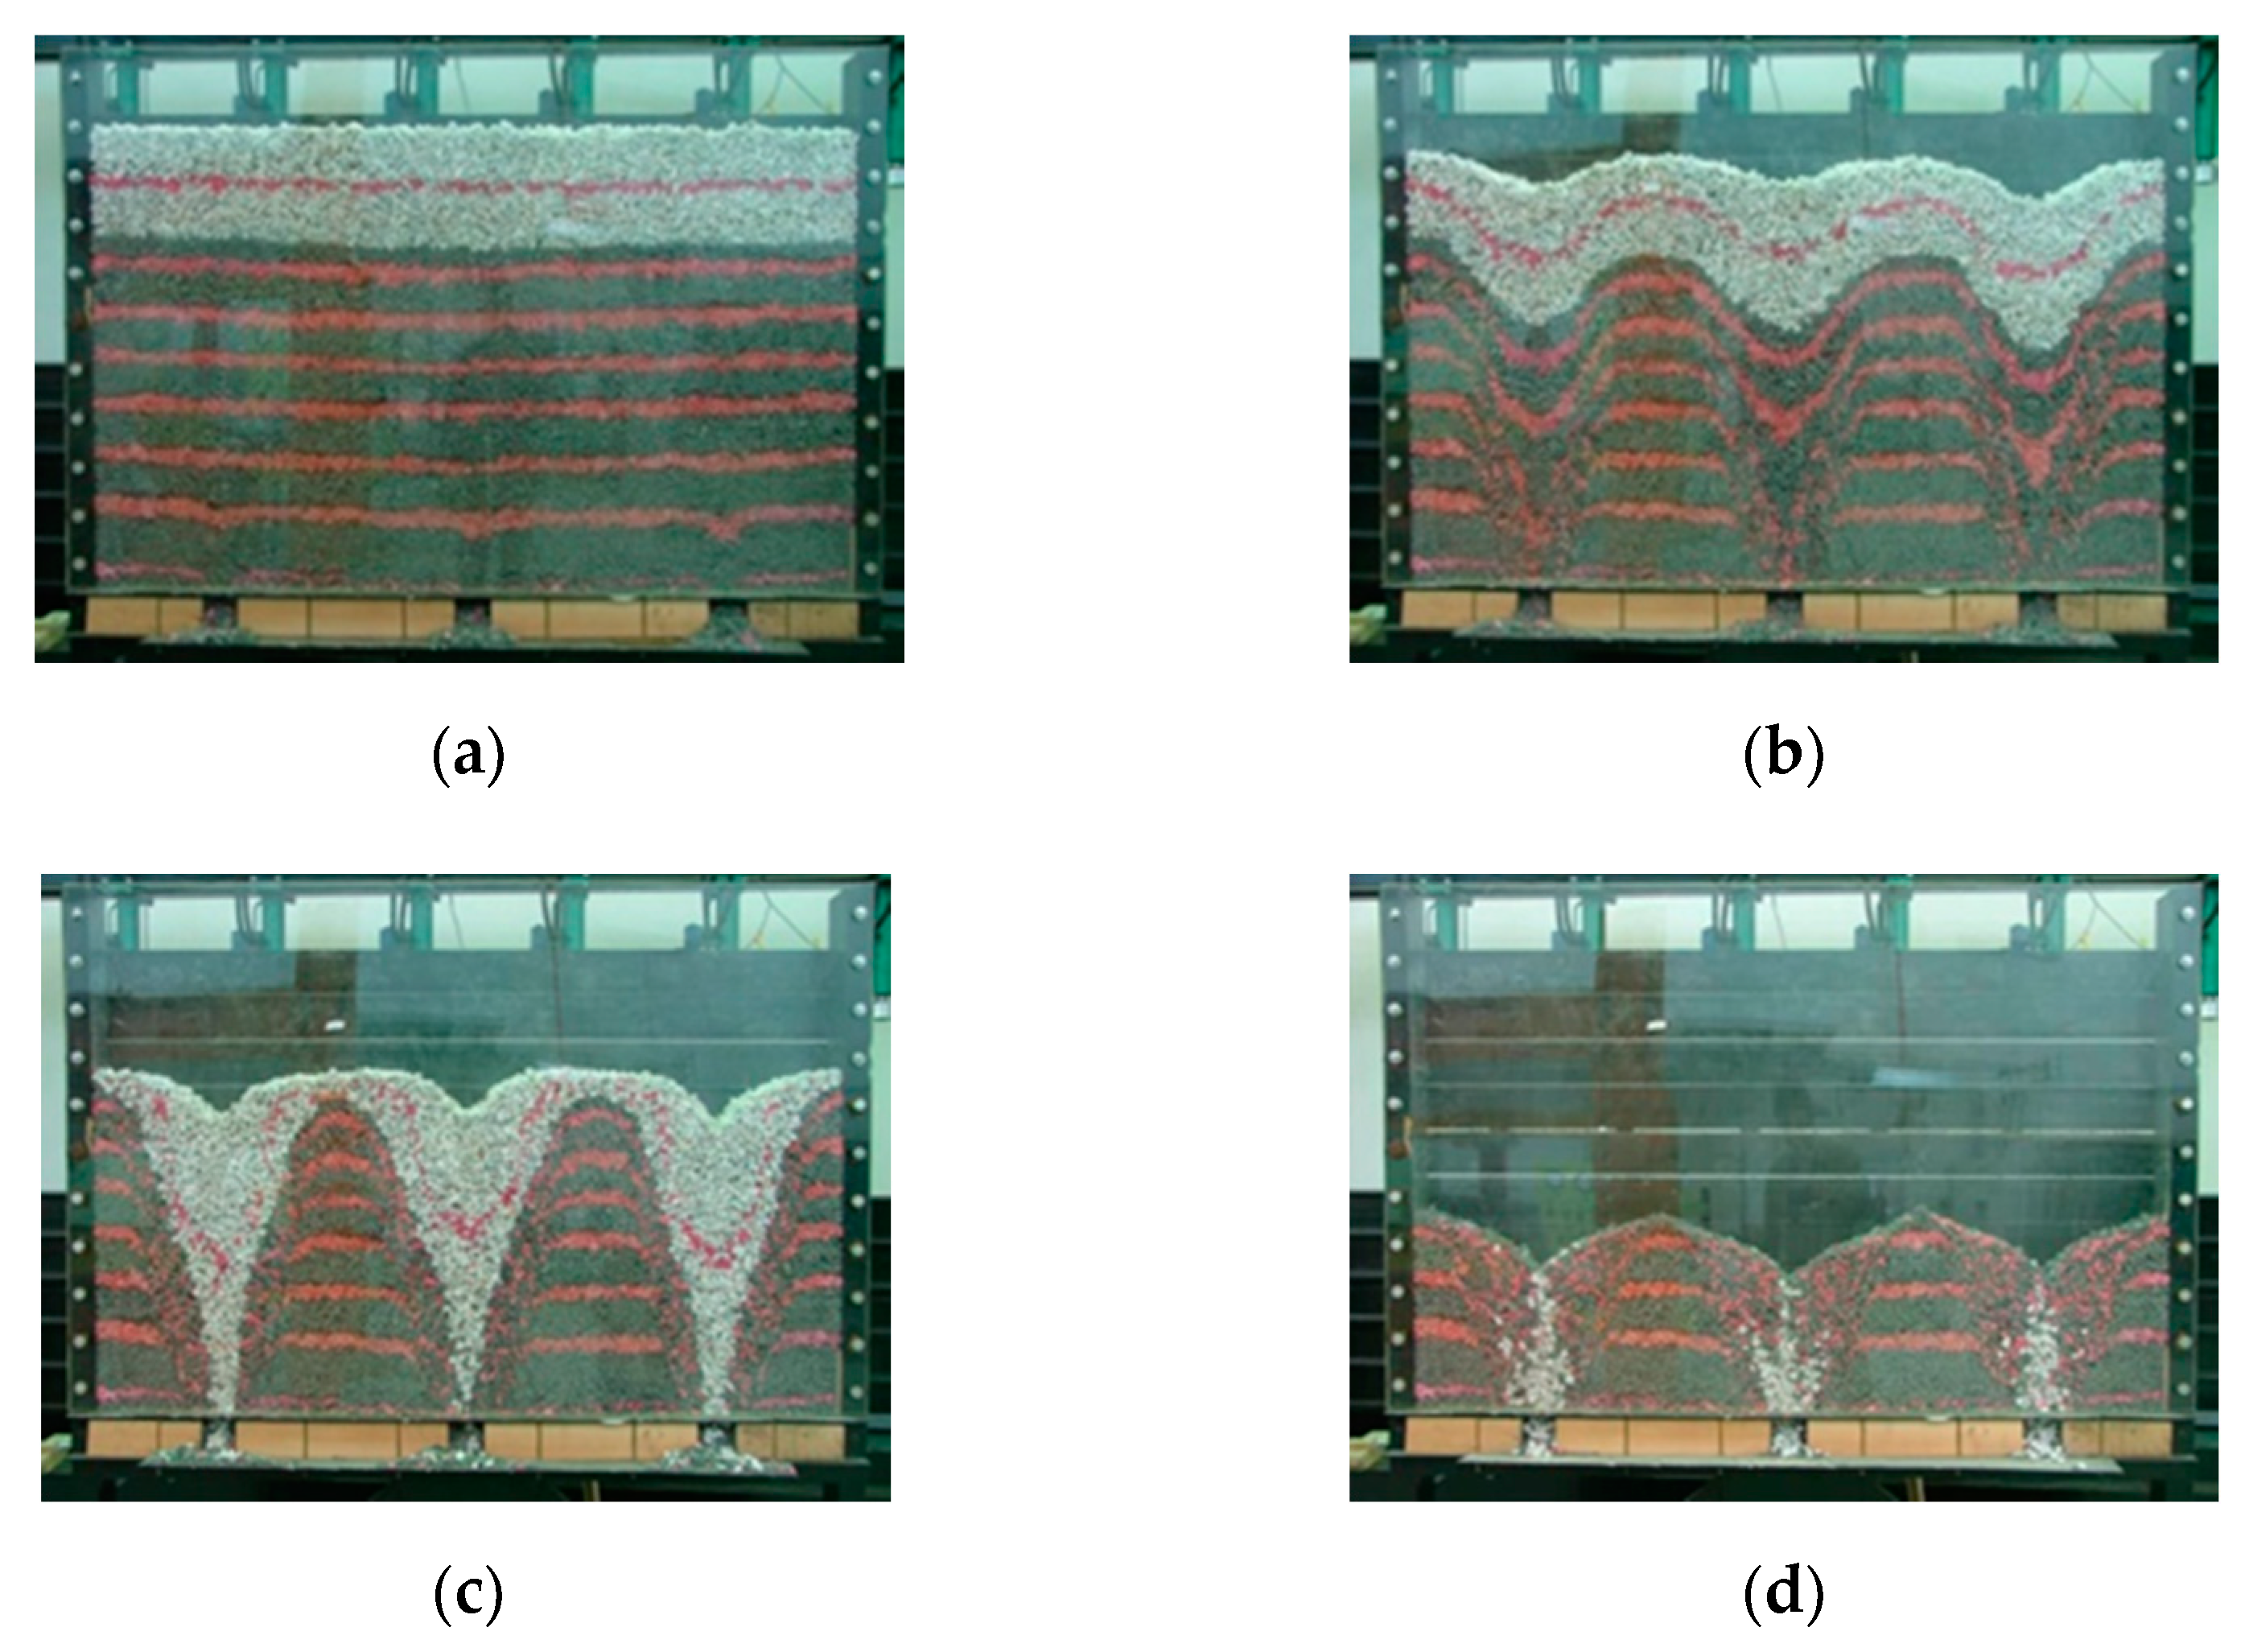
4. Experimental Study on Physical Ore Drawing
4.1. Experimental Scheme
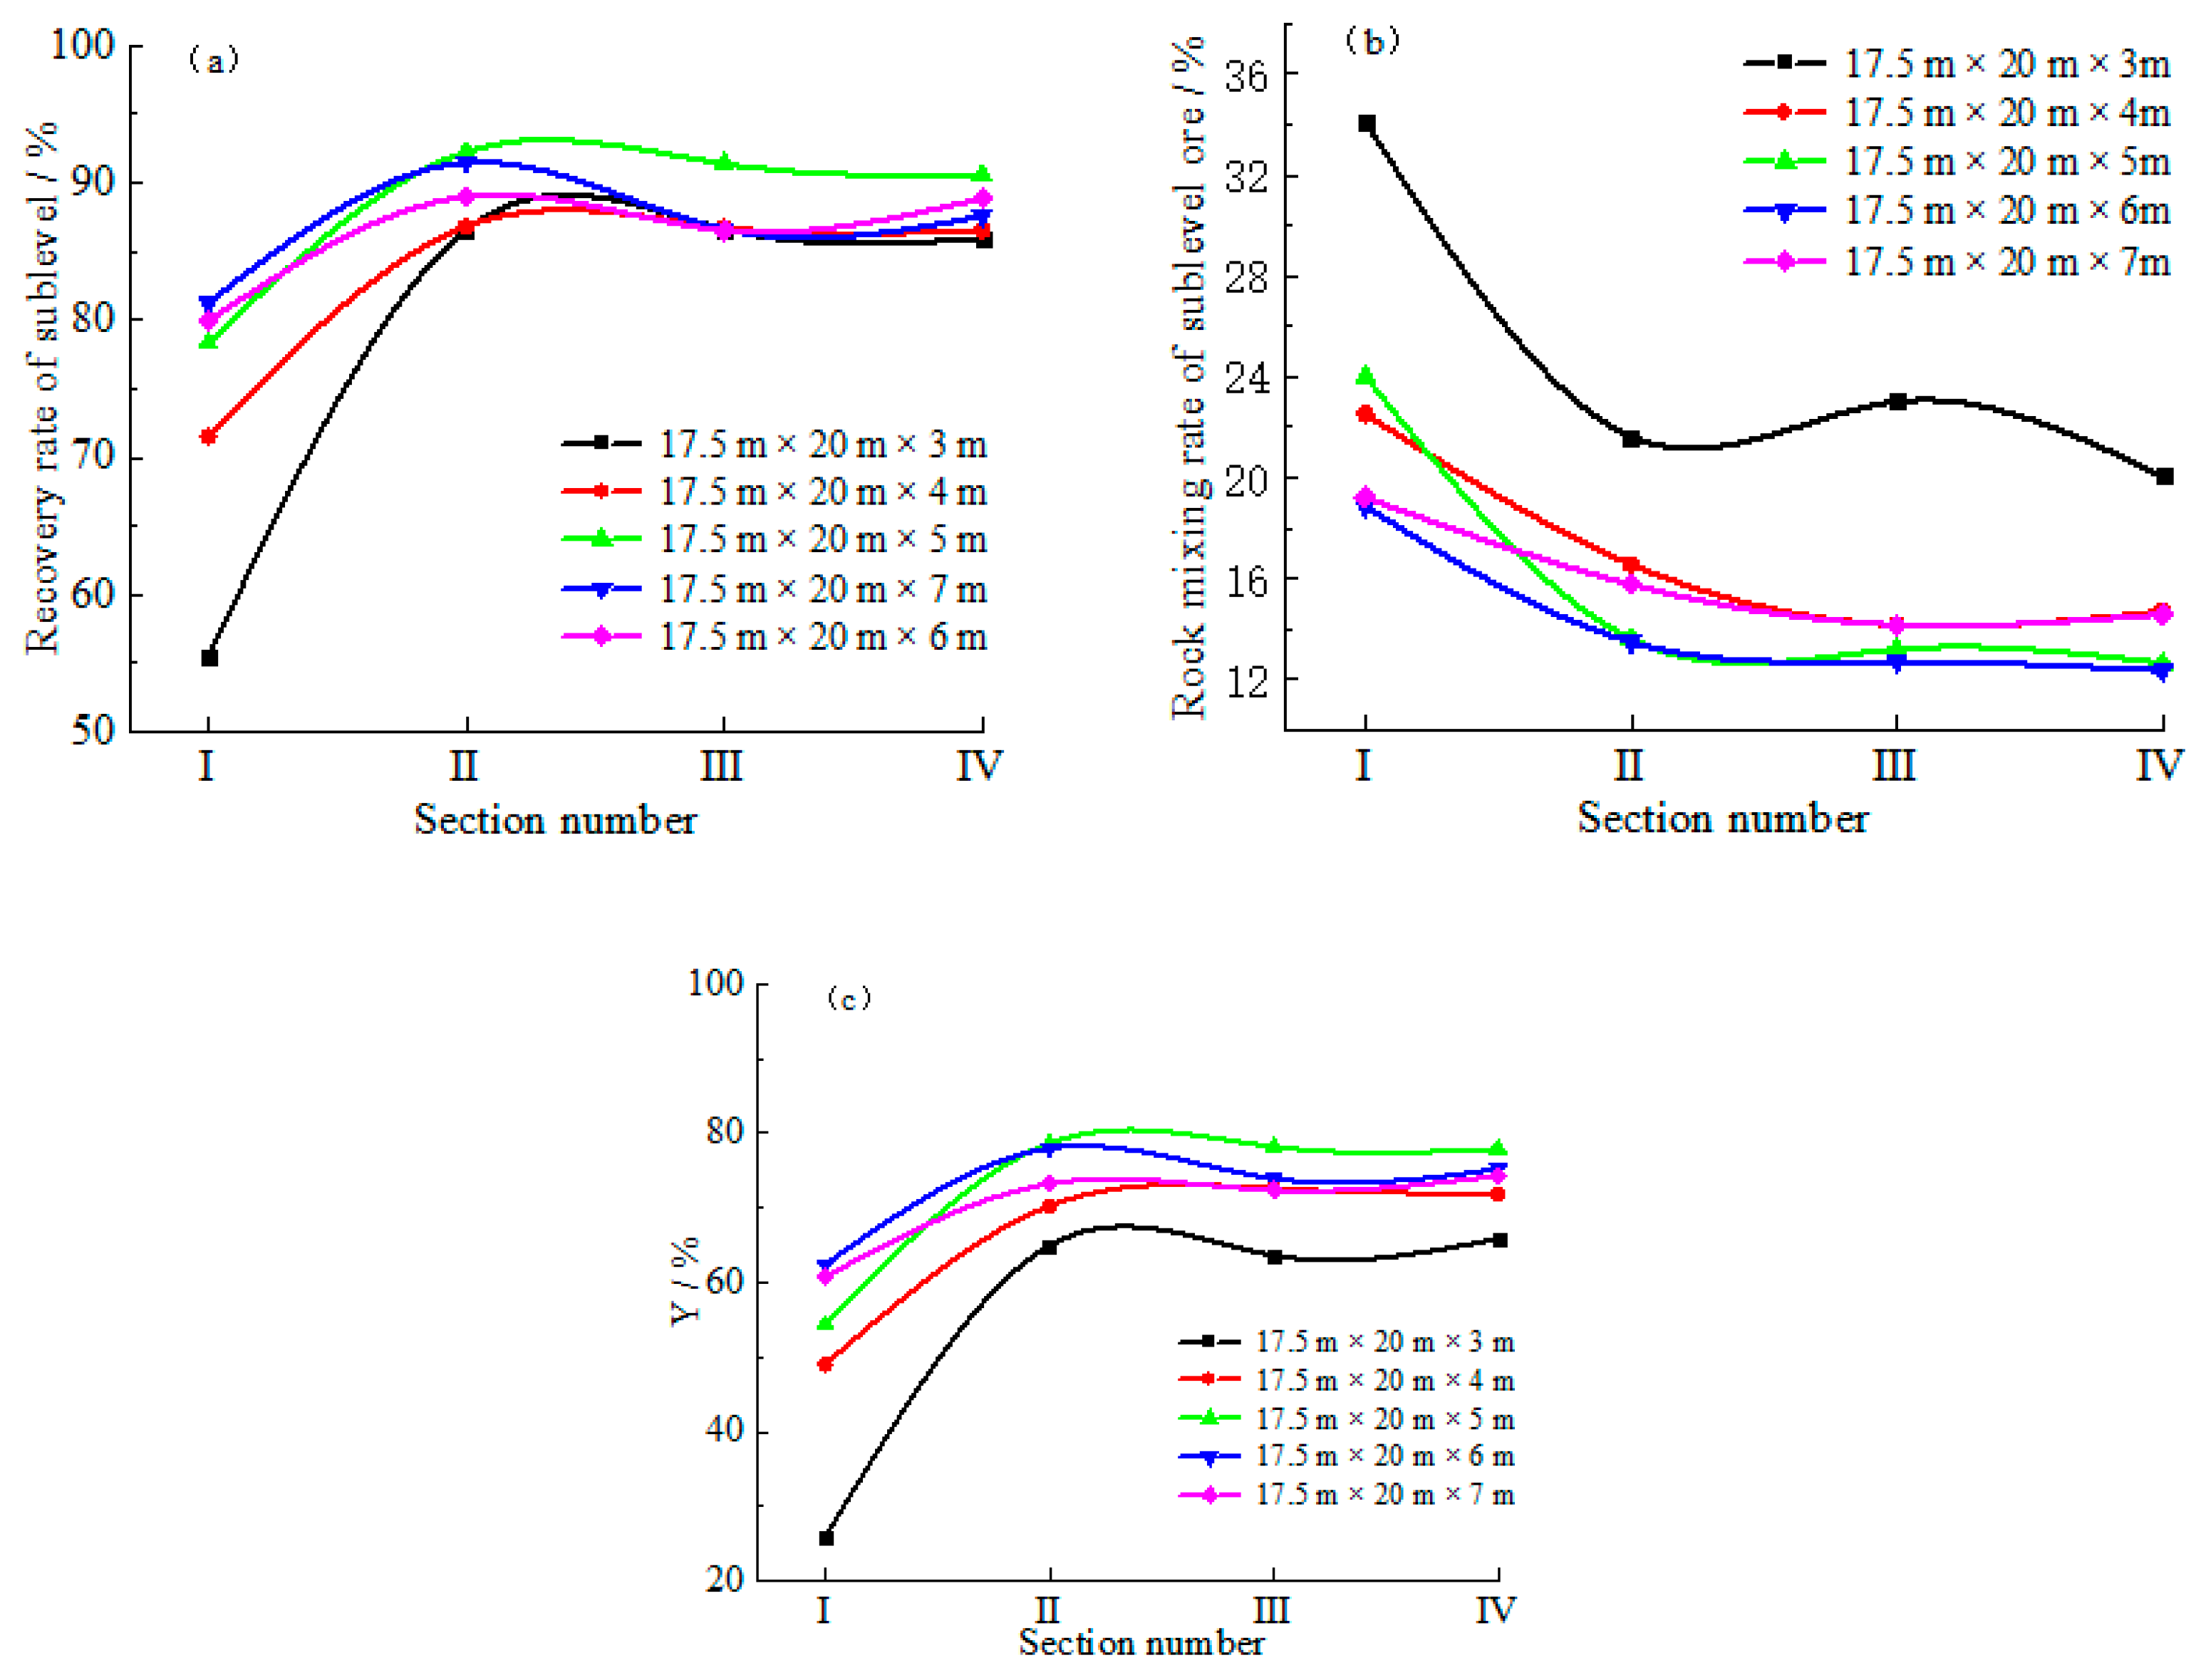
4.2. Results Analysis
4.3. Results Comparison between Numerical Simulation and Physical Experiment
5. Conclusions
- (1)
- The theoretical ranges of the optimal drift interval and caving step were calculated as 18.91~19.04 m and 4.46~6.07 m, respectively, based on the optimal arrangement and intersection degree of the discharged ellipsoid.
- (2)
- Twenty groups of structural parameters were designed for simulation research. The binary quadratic function relation with sublevel height and production drift pace was fitted with the difference between the recovery and the dilution ratio as the objective function, on PFC2D software (Itasca Consulting Group, Minneapolis, MN, USA). The sublevel height and drift interval were 17.5 m × 20 m, based on the theoretical calculation results and the actual situation on site.
- (3)
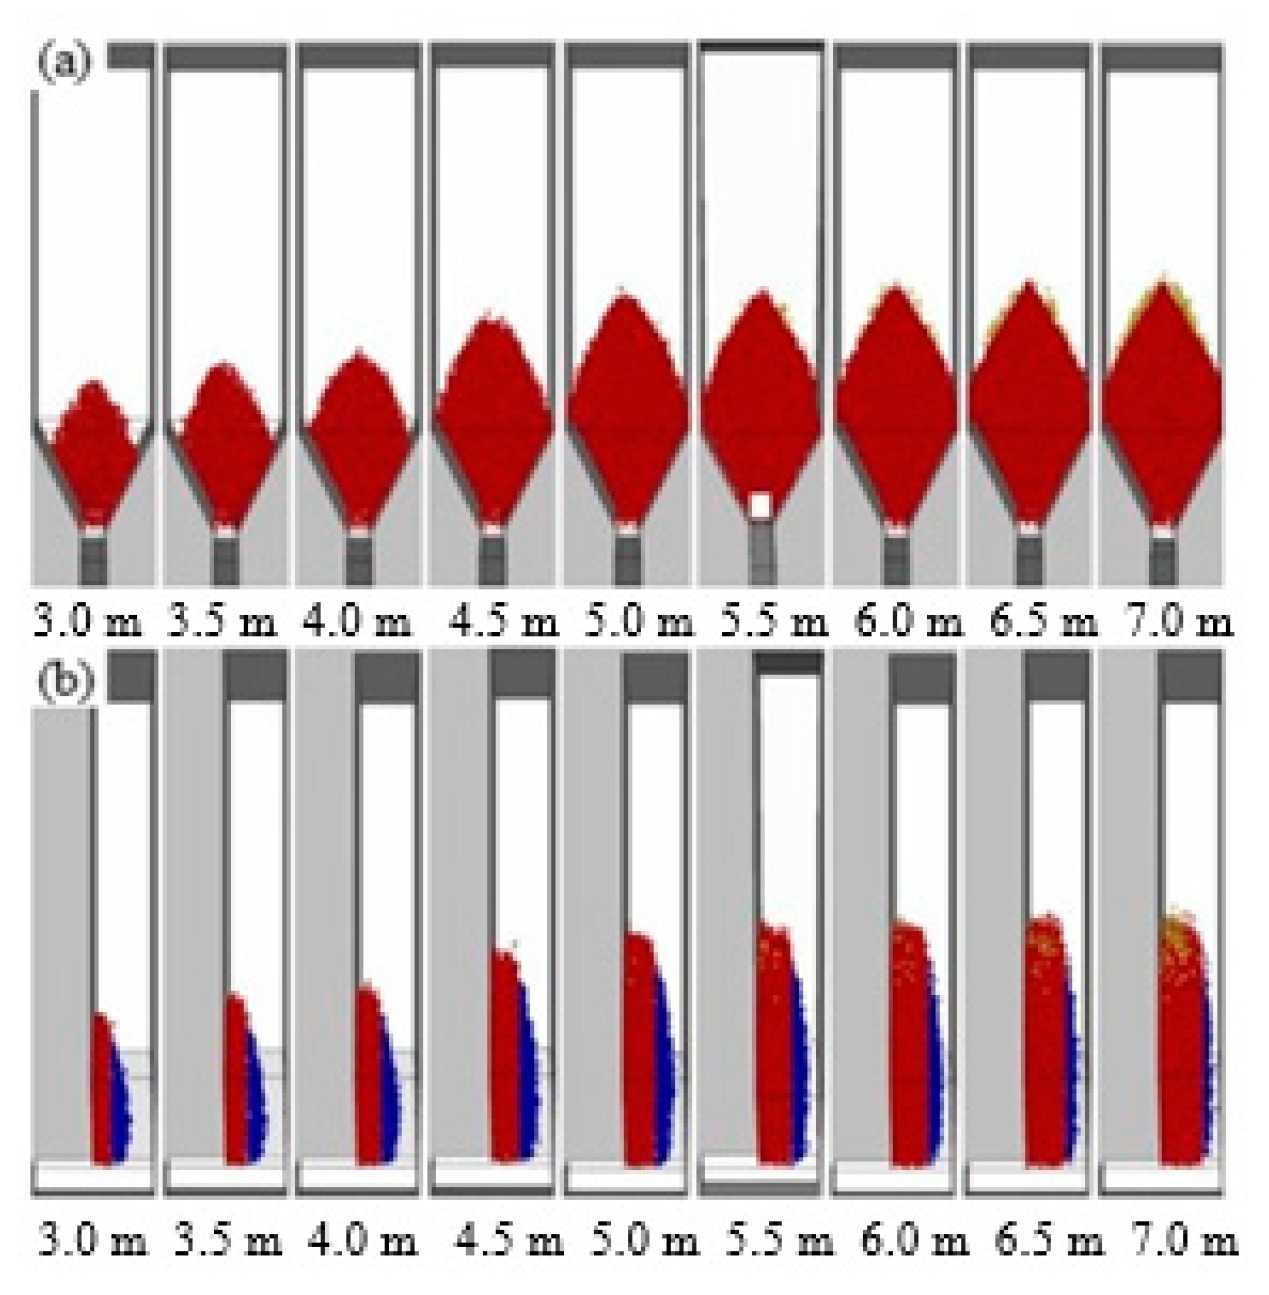
- The optimal caving step was investigated through a similar physical experiment and the theoretical calculation was performed on PFC3D software (Itasca Consulting Group, Minneapolis, MN, USA). The optimal caving step, 6 m, was determined through numerical simulation, physical experiment, and theoretical analysis.
- (4)
- Through the optimization of bottom structure parameters, the loss and dilution of stope are effectively controlled, and energy consumption is significantly reduced. It is an effective measure for green mining and improves the production efficiency of the pillarless sublevel caving method.
Author Contributions
Funding
Institutional Review Board Statement
Informed Consent Statement
Data Availability Statement
Acknowledgments
Conflicts of Interest
References
- An, L.; Xu, S.; Li, Y.H.; Peng, J. Optimization of rate of advance during ore breaking of caving method based on multi-method joint application. Chin. J. Rock Mech. Eng. 2013, 32, 754–759. [Google Scholar]
- Liu, X.G.; Zhang, Z.T. Basis of Ore-drawing without Dilution for Sublevel Caving Method (First Part). Metal Mine 1995, 11, 5–9. [Google Scholar]
- Wang, Y.P.; Yu, J. Optimization of breaking interval in non-pillar sublevel caving mining. J. Cent. South Univ. 2014, 45, 603–608. [Google Scholar]
- Kaicheng, D.; Guihai, P.; Dan, H. Transition sublevel drawing optimization for large structural parameters of pillarless sublevel caving method. China Min. Mag. 2020, 29, 356–371. [Google Scholar]
- Sun, G.; Lv, G. The development direction of no-pillar sublevel caving mining in China. J. Inst. Technol. 2007, 29, 4–6. [Google Scholar]
- Brunton, I.D.; Fraser, S.J.; Hodgkinson, J.H.; Stewart, P.C. Parameters influencing full scale sublevel caving material recovery at the Ridgeway gold mine. Int. J. Rock Mech. Min. Sci. 2010, 47, 647–656. [Google Scholar] [CrossRef]
- Jin, A.; Sun, H.; Wu, S.; Gao, Y. Confirmation of the upside-down drop shape theory in gravity flow and development of a new empirical equation to calculate the shape. Int. J. Rock Mech. Min. Sci. 2017, 92, 91–98. [Google Scholar] [CrossRef]
- Yu, J. Research on the Prediction of Ore Dilution and Loss Rate and the Optimization of Structural Parameters of High Sublevel Large Space Drive Interval Pillarless Sublevel Caving; Center South University: Changsha, China, 2007. [Google Scholar]
- Zhang, Z.G.; Liu, X.G.; Yu, G.L. Bottom-Free Sublevel Caving Method without Depleted Ore Deposit: Non-Depleted Ore-Concentration Theory and Its Practice in Mines; Northeastern University Press: Shenyang, China, 2007; pp. 6–7. [Google Scholar]
- Kvapil, R. Gravity flow of granular materials in hoppers and bins. Int. J. Rock Mech. Min. Sci. 1965, 2, 35–41. [Google Scholar] [CrossRef]
- Janelid, I.; Kvapil, R. Sublevel caving. Int. J. Rock Mech. Min. Sci. 1966, 3, 129–153. [Google Scholar] [CrossRef]
- David, J. Computer simulation of the movement of ore and waste inan underground mining pillar. Can. Min. Metall. Bull. 1968, 61, 854–859. [Google Scholar]
- Xu, S.; An, L.; Feng, X.T.; Dong, J.K.; Li, Y.H. Research on granular flow laws of caved ore and rock for steeply dipping thin vein. J. Min. Saf. Eng. 2013, 30, 512–517. [Google Scholar]
- Xu, S.; An, L.; Li, Y.H.; Dong, J.K.; Li, Y.H. Optimization of caving space for different angles of end-wall during pillarless sublevel caving. J. Northeast. Univ. Nat. Sci. 2012, 33, 120–123. [Google Scholar]
- Li, X.; Sheng, J.; Cheng, A.; Huang, Z. Study on structural parameter for non-pillar sublevel caving. Ind. Miner. Process. 2011, 40, 21–23. [Google Scholar]
- Guo, H.; He, Z.; Zhang, Z.; Su, H.; Zhu, Q. Influence analysis of stope structure parameters on the drift stability in non-pillar sublevel caving under backfill. Min. Res. Dev. 2020, 40, 12–18. [Google Scholar]
- Wu, A.; Wu, L.; Liu, X.; Sun, X.; Zhou, Y.; Yin, S. Study on structural parameters of sublevel caving. J. Cent. South Univ. 2012, 43, 1845–1850. [Google Scholar]
- Zhao, Y.; Chen, Y.; Li, C.; Chen, J. Research on structural parameter optimization of sub level caving method. Ind. Miner. Process. 2019, 48, 16–21. [Google Scholar]
- Jin, A.; Sun, H.; Meng, X.; Gao, Y.; Wu, Q.; Zhang, G. Study of best caving steps under different ore methods of sublevel caving. J. Cent. South Univ. 2017, 48, 3037–3043. [Google Scholar]
- Tao, G.; Lu, M.; Zhang, X.; Zhang, R.; Zhu, Z. A new diversion drawing technique for controlling ore loss and dilution during longitudinal sublevel caving. Int. J. Rock Mech. Min. Sci. 2019, 113, 163–171. [Google Scholar] [CrossRef]
- Li, T.; Fu, J.X.; Song, W.D. Study on law of surrounding rock movement induced by mining large and thick ore body. J. Min. Saf. Eng. 2018, 35, 978–983. [Google Scholar]
- Fu, J.X.; Du, J.H.; Tan, Y.Y. The falling process and mechanism of concealed gob roof during the caving mining of the gently inclined heavy ore. J. Min. Saf. Eng. 2017, 34, 891–898. [Google Scholar]
- Meng, Q.B.; Wang, C.K.; Han, L.J. Analysis on stope surrounding rock stability and mining entrance repair technology in sublevel caving method. J. Min. Saf. Eng. 2019, 36, 364–372. [Google Scholar]
- Jin, C.; Dong, Z.M.; Gong, S.G. Study on the enlarged-structure parameters of sublevel caving in Meishan Iron Mine. Metal Mine 2000, 4, 17–19. [Google Scholar]
- Huang, Z.; Sheng, J.L.; Li, X. Parametric analysis of high-segment and large-pitch structural parameters of sublevel caving without pillars. Min. Technol. 2011, 11, 11–12. [Google Scholar]
- Zhu, H.C. PFC and application case of caving study. Chin. J. Rock Mech. Eng. 2006, 25, 1927–1931. [Google Scholar]
- Zhou, C.B.; Yao, Y.K.; Guo, L.W.; Yin, X.P.; Fan, X.F.; Shang, Y. Numerical simulation of independent advance of ore breaking in the non-pillar sublevel caving method. J. China Univ. Min. Technol. 2007, 17, 295–300. [Google Scholar] [CrossRef]
- Itasca Consulting Group Inc. Particle Flow Code (Version 3.0); ICG: Minneapolis, MN, USA, 2004; pp. 22–26. [Google Scholar]
- Brady, B.H.G.; Brown, E.T. Rock Mechanics for Underground Mining; Allen & Unwin: London, France, 1985; pp. 334–339. [Google Scholar]
- Zhao, Y.L.; Cheng, Y.M.; Li, C.; Chen, J. Structural parameters optimization of sublevel caving method without pillars based on PFC3D. Nonferrous Met. (Min. Sect.) 2019, 71, 10–16. [Google Scholar]
- Wang, C.H. Theory of Ore Flow; Metallurgical Industry Press: Beijing, China, 1982; pp. 5–10. [Google Scholar]
- Zhang, H.F.; Chi, X.W. Application of particle flow method in structural parameter optimization of sublevel caving method without bottom column. Min. Technol. 2018, 18, 19–22. [Google Scholar]
- Tan, B.H.; Zhang, Z.G.; He, R.X.; Zhu, Q. Discussion on the rationality and experimental research of the ore-drawing ellipsoid arrangement theory. J. Northeast. Univ. Nat. Sci. 2019, 40, 1014–1019. [Google Scholar]


| Particle Type | Average Particle Size/m | Normal Stiffness/N·m−1 | Tangential Stiffness/N·m−1 | Friction Coefficient | Density/ kg·m−3 | Color |
|---|---|---|---|---|---|---|
| Ore | 0.2 | 1.2 × 10⁸ | 1.2 × 10⁸ | 0.1 | 4000 | Red |
| rock | 0.3 | 1.0 × 10⁸ | 1.0 × 10⁸ | 0.2 | 2700 | yellow |
| Analog Scheme | Segment Height/m | Approach Space/m | Difference between Recovery and Dilution Ratio/% |
|---|---|---|---|
| A 1 | 17.5 | 15 | 82.5 |
| A 2 | 18 | 83.7 | |
| A 3 | 20 | 85.16 | |
| A 4 | 22 | 84.3 | |
| A 5 | 19 | 15 | 83 |
| A 6 | 18 | 84.25 | |
| A 7 | 20 | 86.54 | |
| A 8 | 22 | 85.39 | |
| A 9 | 21 | 15 | 81.8 |
| A 10 | 18 | 83.31 | |
| A 11 | 20 | 84.51 | |
| A 12 | 22 | 83.8 | |
| A 13 | 23.5 | 15 | 80 |
| A 14 | 18 | 81.64 | |
| A 15 | 20 | 83.34 | |
| A 16 | 22 | 82.2 | |
| A 17 | 26 | 15 | 78.2 |
| A 18 | 18 | 80.6 | |
| A 19 | 20 | 82.29 | |
| A 20 | 22 | 81.5 |
| Discharge Section | Mine Release/ Mg | Total Release Ore /Mg | Total Release Ore /Mg | Recovery Ratio/% | Dilution Ratio/% |
|---|---|---|---|---|---|
| First segment | 120.62 | 23.91 | 144.53 | 78.47 | 16.54 |
| Second segment | 225.56 | 25.91 | 251.47 | 105.61 | 10.30 |
| Third segment | 276.25 | 24.07 | 300.32 | 96.19 | 8.01 |
| Fourth segment | 206.12 | 23.81 | 229.93 | 97.18 | 10.35 |
| Average | 207.14 | 22.90 | 231.56 | 96.43 | 9.89 |
| Bottom Structure | Theoretical Calculation | Numerical Simulation | Function Prediction |
|---|---|---|---|
| Segment height/m | 17.5 | 19 | 20.18 |
| Approach space/m | 18.91~19.04 | 20 | 19.61 |
| Analog Number | Ore Height/m | Width/m | Caving Step/m | Current Cutoff Grade/% |
|---|---|---|---|---|
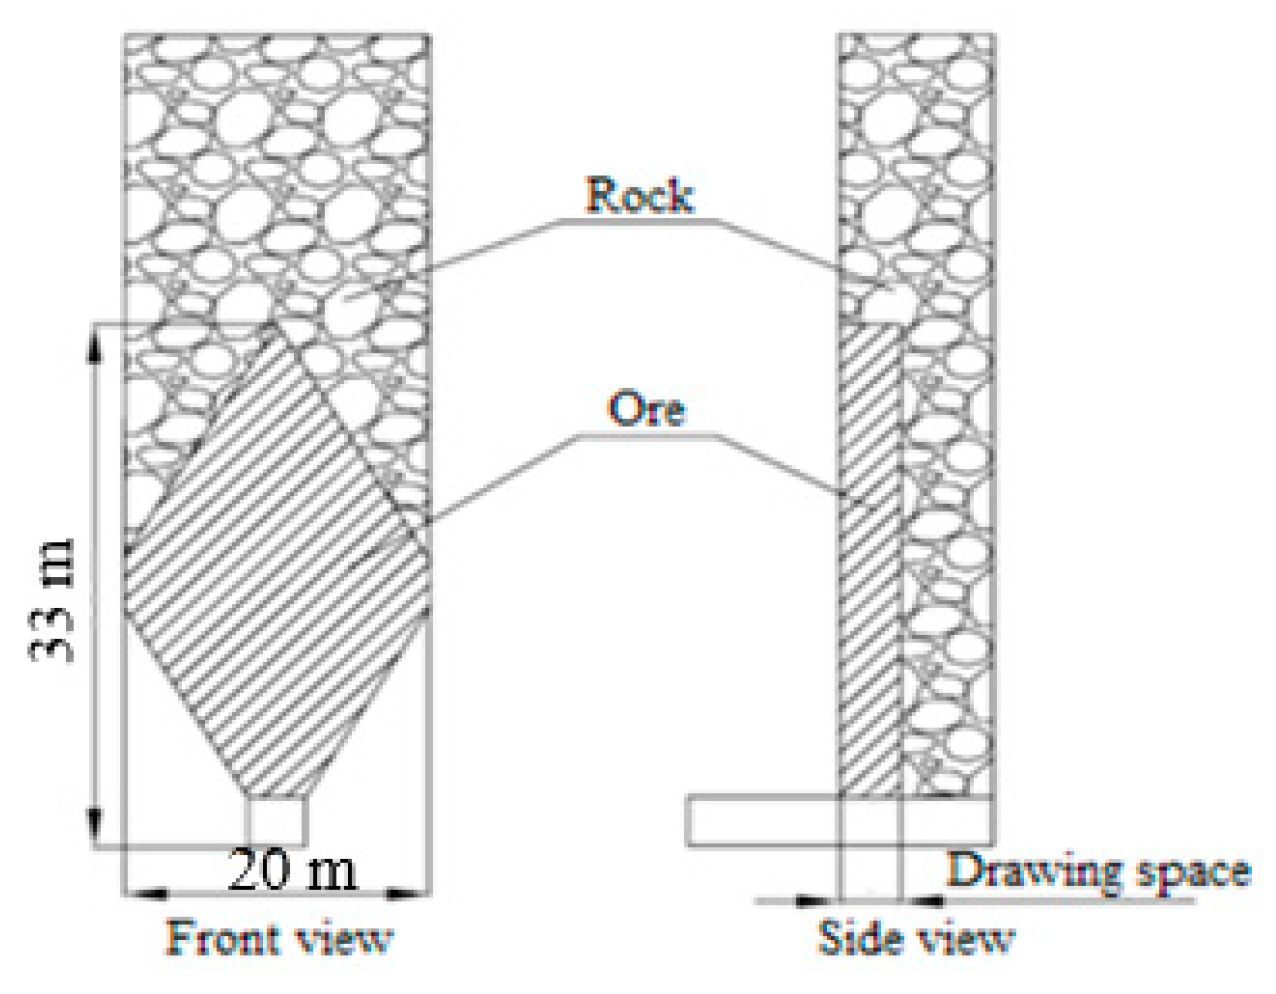
| B 1 | 33 | 20 | 3.0 | 18 |
| B 2 | 33 | 20 | 3.5 | 18 |
| B 3 | 33 | 20 | 4.0 | 18 |
| B 4 | 33 | 20 | 4.5 | 18 |
| B 5 | 33 | 20 | 5.0 | 18 |
| B 6 | 33 | 20 | 5.5 | 18 |
| B 7 | 33 | 20 | 6.0 | 18 |
| B 8 | 33 | 20 | 6.5 | 18 |
| B 9 | 33 | 20 | 7.0 | 18 |
| Analog Number | Caving Step/m | Recovery Ratio/% | Dilution Ratio/% | Difference between Recovery and Dilution Ratios/% |
|---|---|---|---|---|
| B 1 | 3 | 40.35 | 24.41 | 15.94 |
| B 2 | 3.5 | 50.78 | 20.25 | 30.52 |
| B 3 | 4 | 57.43 | 18.02 | 39.41 |
| B 4 | 4.5 | 77.36 | 17.35 | 60.02 |
| B 5 | 5 | 89.64 | 15.38 | 74.26 |
| B 6 | 5.5 | 93.94 | 12.91 | 81.04 |
| B 7 | 6 | 93.99 | 9.79 | 84.20 |
| B 8 | 6.5 | 92.02 | 8.12 | 83.90 |
| B 9 | 7 | 91.10 | 7.38 | 83.72 |
| Bottom Structure | Theoretical Calculation | Numerical Simulation Research | Physical Similarity Simulation Experiment |
|---|---|---|---|
| Optimal caving step/m | 4.46~6.07 | 6~6.3 | 5 |
Publisher’s Note: MDPI stays neutral with regard to jurisdictional claims in published maps and institutional affiliations. |
© 2021 by the authors. Licensee MDPI, Basel, Switzerland. This article is an open access article distributed under the terms and conditions of the Creative Commons Attribution (CC BY) license (https://creativecommons.org/licenses/by/4.0/).
Share and Cite
Tan, Y.; Guo, M.; Hao, Y.; Zhang, C.; Song, W. Structural Parameter Optimization for Large Spacing Sublevel Caving in Chengchao Iron Mine. Metals 2021, 11, 1619. https://doi.org/10.3390/met11101619
Tan Y, Guo M, Hao Y, Zhang C, Song W. Structural Parameter Optimization for Large Spacing Sublevel Caving in Chengchao Iron Mine. Metals. 2021; 11(10):1619. https://doi.org/10.3390/met11101619
Chicago/Turabian StyleTan, Yuye, Mochuan Guo, Yimin Hao, Chi Zhang, and Weidong Song. 2021. "Structural Parameter Optimization for Large Spacing Sublevel Caving in Chengchao Iron Mine" Metals 11, no. 10: 1619. https://doi.org/10.3390/met11101619
APA StyleTan, Y., Guo, M., Hao, Y., Zhang, C., & Song, W. (2021). Structural Parameter Optimization for Large Spacing Sublevel Caving in Chengchao Iron Mine. Metals, 11(10), 1619. https://doi.org/10.3390/met11101619