Article

A Novel Required Laser Energy Predicting Model for Laser Powder Bed Fusion

1
School of Mechanical and Power Engineering, Nanjing Tech University, Nanjing 211816, China
2
Jilin Design Institute of CNPC Northeast Refining Engineering Co., Ltd., Jilin 132000, China
*
Authors to whom correspondence should be addressed.
Metals 2021, 11(12), 1966; https://doi.org/10.3390/met11121966
Submission received: 28 October 2021 / Revised: 30 November 2021 / Accepted: 3 December 2021 / Published: 7 December 2021
(This article belongs to the Special Issue Special Materials for Shipbuilding)

Abstract

:
During the process of laser powder bed fusion (LPBF) printing, the energy of heat input have a great influence on the quality of fabricated specimens. In this paper, based on the heat transfer and metallurgical mechanism, a theoretical predicting model of the required laser energy to fabricate high-density LPBF components was established. The theoretical required laser energy density of AlSi10Mg, TC4 and 316L were calculated, which are 51.74 J/mm3, 104.48 J/mm3 and 69.28 J/mm3, respectively. By comparing with the experimental results in the references, it was found that the errors between them are within 10%. In addition, this article discussed the relationship between the VED and the specimen defects, and found that the changing in the VED will alter the types of specimen defects.

1. Introduction

Laser Powder Bed Fusion (LPBF) is a widely used additive manufacturing technology. During printing, the laser scans the metal powders according to the set path, and the layers are accumulated until the specimen is fabricated successfully. However, during the LPBF printing, the setting of LPBF printing parameters directly affects the printing quality of the specimens [1,2,3]. Improper printing parameters will reduce the relative density and other printing quality of printed components (such as surface roughness and tensile strength) [4,5,6,7]. This limits the further application of LPBF. Nguyen et al. [8] explored the effect of the layer thickness on the surface roughness and mechanical properties of Inconel 718 alloy specimens. Liu et al. [9] investigated the effect of the laser power on the metallographic structure of AlSi10Mg components. Ozsy et al. [10] explored the influence of hatch space and other parameters on the relative density of 17-4PH stainless steel. Liverani et al. [11] explored the influence of laser power, hatch space and printing direction on the quality of 316L components, respectively, and established the relationship between printing parameters and mechanical properties. Based on the research of the above scholars, it is found that the influence of printing parameters on the quality of printed components is not linear and monotonous. Therefore, controlling printing quality based on changing printing parameters is feasible [12,13,14].
In order to explore the relationship between printing parameters and printing quality of components much further, the research objects of scholars have also shifted from the macroscopic mechanical properties of the printed component to the internal micromorphology, especially the molten pools. Inside the LPBF printed component are a large number of molten pools. The formation and performance of the molten pool directly affect the quality of the printed components. Maria L et al. [15] found through experiments that when using high laser power, the width of the molten pool will increase significantly. Hanzl et al. [16] also found that the laser power and layer thickness will affect the characteristics of the molten pool. In addition, better printing quality and mechanical properties of components can be obtained by optimized printing parameters.
In addition to qualitative analysis, scholars established the relationship between printing parameters and the topography of the molten pool for further quantitative analysis. Liu et al. [17] systematically studied the influence of printing parameters and surface conditions on the formation of the molten pools through a series of single-track LPBF experiments. Based on the measured data, a Clear-cut relationship between the dimensions of the molten pools and the parameters were deduced, such as between the depth of the molten pools and the laser power. Zhang et al. [18] combined the energy required for metal melting with the cross-sectional area of the molten pool and printing parameters. In addition, the relationship between them was established. This relationship qualitatively analyzed the relationship between the printing parameters and the topography of the molten pool. Similar to the experimental results of previous scholars, the laser power and laser scanning speed will significantly affect the size of the molten pool. On the basis of this formula, the printing parameters were optimized and components with better relative density and mechanical properties were obtained.
As well, scholars have found there are 60–70 factors that can affect the printing quality [19]. There are also interaction effects between multiple parameters [20]. In order to further explore the influence of these parameters on LPBF printing, scholars proposed the concept of Volumetric Energy Density [21]. VED not only includes the laser parameter, but also includes the printing parameters that affect the three directions of printed components, namely layer thickness, laser scanning speed and hatch space. Based on this characteristic, VED is instructive in printing parameters optimization. A large number of scholars use VED to explore the influence of printing parameters on the forming of printed components [22,23,24]. Cherry et al. [25] analyzed the relative density and surface roughness of the specimens at different VEDs. The results illustrated that when the VED is 104.52 J/mm3, the 316L printed component has the highest relative density and the smallest surface roughness. In addition, based on plenty of experiments, Pal et al. [26] found that when the VED is 65 J/mm3, the best overall performance of the TC4 components was printed. In addition, from the research of the above scholars, it can be found that when the unit volume absorbs the energy provided by the laser is insufficient, defects such as lack of fusion will appear inside the component [27]; when the energy is too much, gas pores will be the main defect type inside the component [28]. All of these defects will affect the relative density of the components.
As mentioned above, the exploration of the parameters’ optimization is mainly based on experiments at present. Although the experiment method can directly obtain accurate printing parameters, it requires a large number of tests as the basis. Moreover, LPBF printing materials are currently developing rapidly, and various alloys and composite materials are emerging endlessly [29,30]. It is very difficult to optimize the printing parameters of those various materials by experimental methods. In order to simplify the experiment method, scholars began to solve this problem theoretically. Yap et al. [31] considered the transfer process of laser energy during printing. Based on this heat transfer process, Yap et al. established a theoretical model to predict the laser energy required by the material. However, this theoretical model used too many assumptions, such as the thermal physical properties of materials are independent of temperature and did not consider the heat loss during heat transfer. Therefore, there is a certain gap between the results obtained by this theoretical model and the experimental.
When investigating the required laser energy to obtain a high relative density printed component, scholars found that many required parameters are difficult to obtain directly through experimental measurement and theoretical derivation, such as the maximum temperature and the temperature gradient in the temperature field of the molten pool. Many scholars have begun to use numerical simulation methods to explore the LPBF thermal behavior. For example, Du et al. [32] and Zhuang et al. [33] established single-layer temperature field simulation models of AlSi10Mg and TC4 based on Finite Element Analysis (FEA). Zaeh et al. [34] realized the prediction of the size of the molten pool through FEA. They studied the influence of the temperature field on the molten pool morphology and obtained the optimal process parameters. Using numerical simulation to explore the temperature field during LPBF printing can provide necessary physical parameters for establishing the theoretical model to calculate the required laser energy.
In summary, the printing parameters can significantly affect the internal microstructure and morphology of the component. Inappropriate parameters will introduce a large number of defects inside the printed components, such as gas pores and keyholes. At present, scholars mostly obtain high relative density printing components by the experiments of optimizing printing parameters, and there is a lack of theoretical models to provide the theoretical value. The use of finite element (FE) makes the derivation of theoretical models possible. A reasonable theoretical model can effectively reduce the cost and time required for the experiments. Therefore, from the perspective of heat balance, this paper established a theoretical calculation model of the required laser energy based on the law of energy conservation and its accuracy and universality were verified. In addition, this paper further explored the influence of the VED on the internal morphology and defects of the printed component.

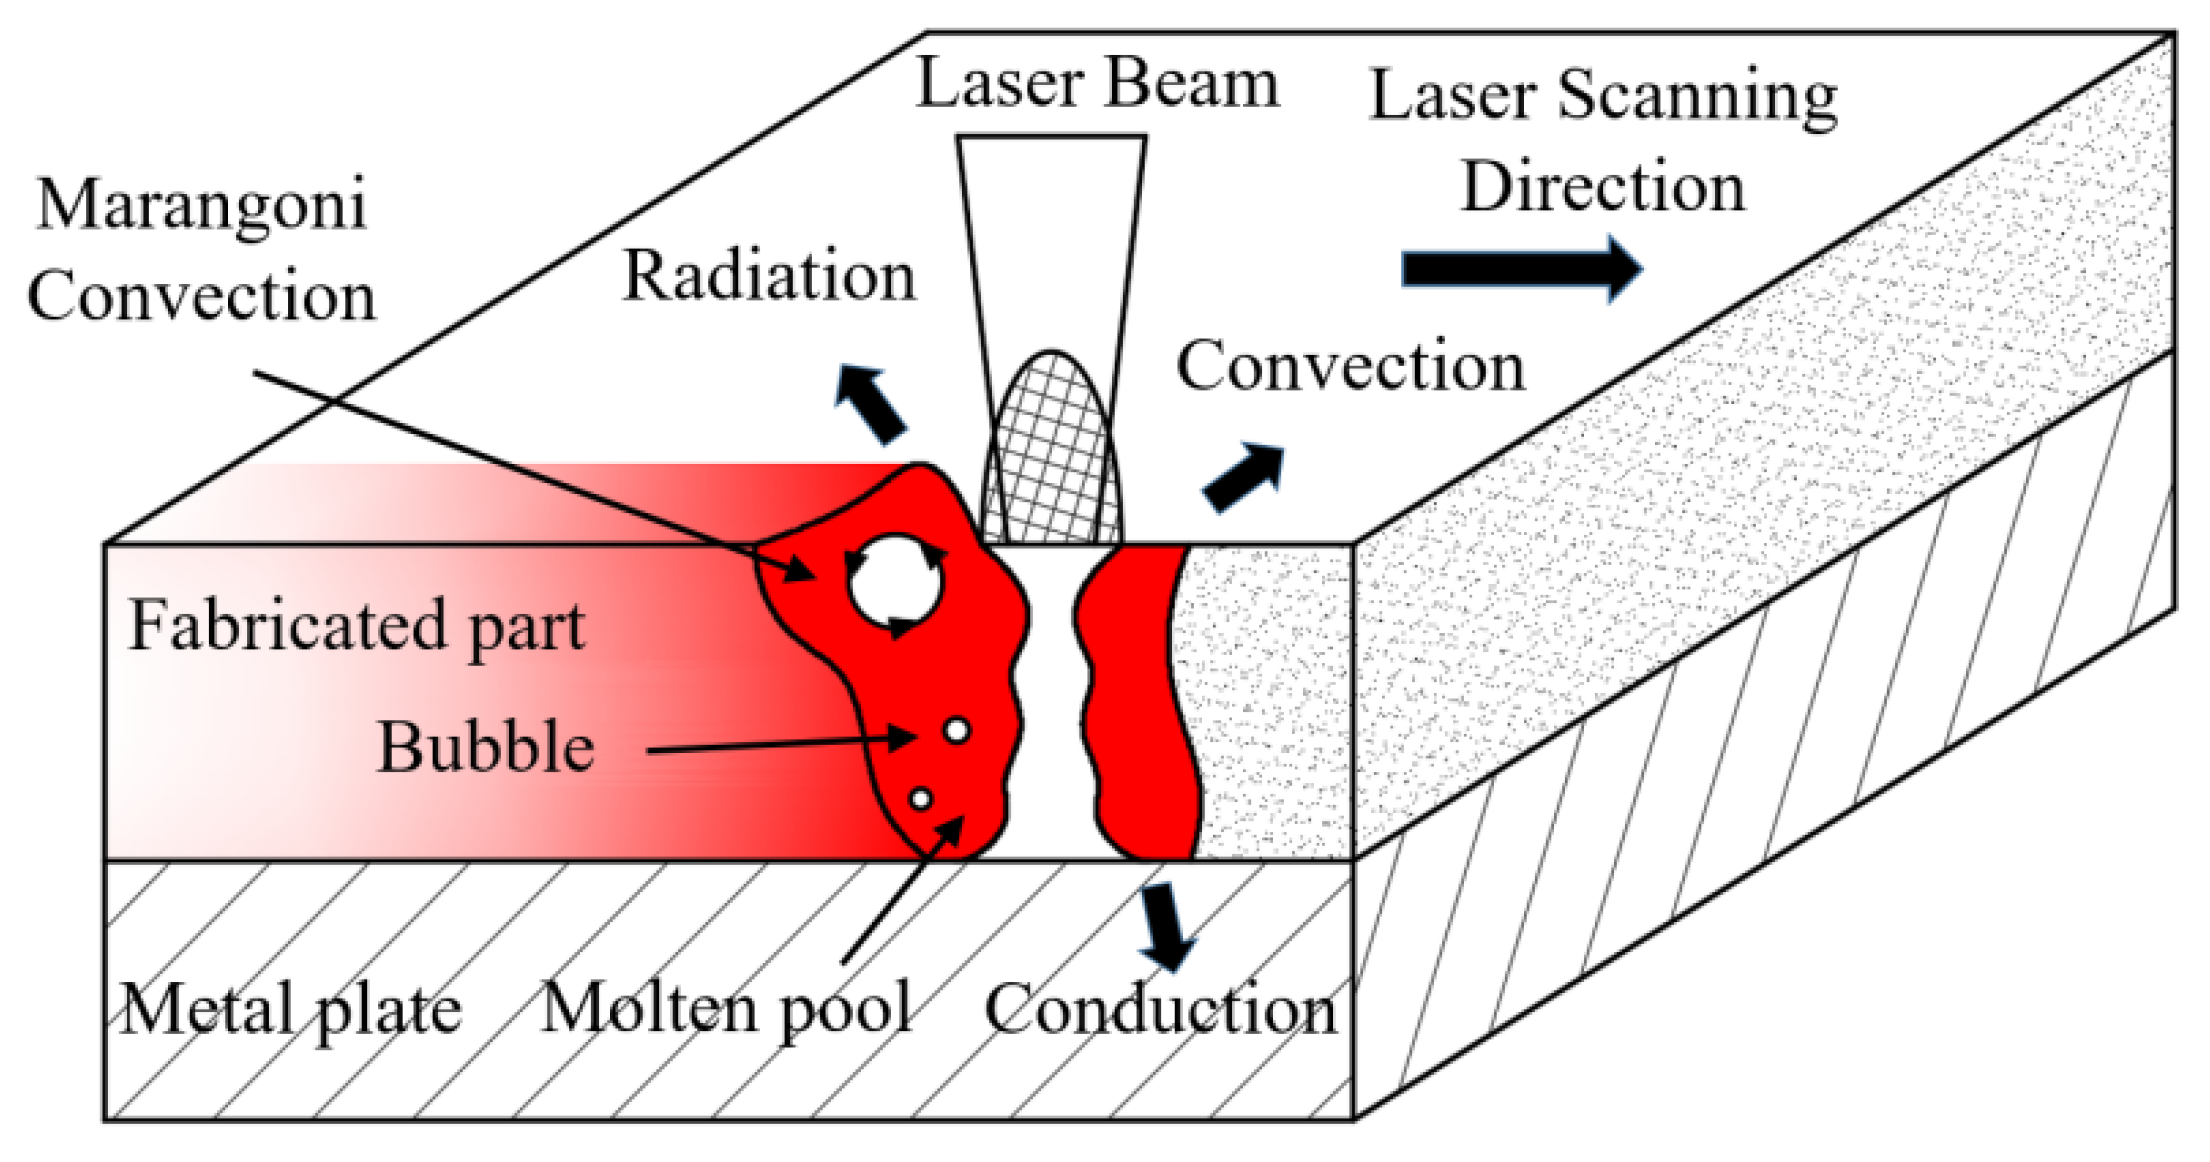
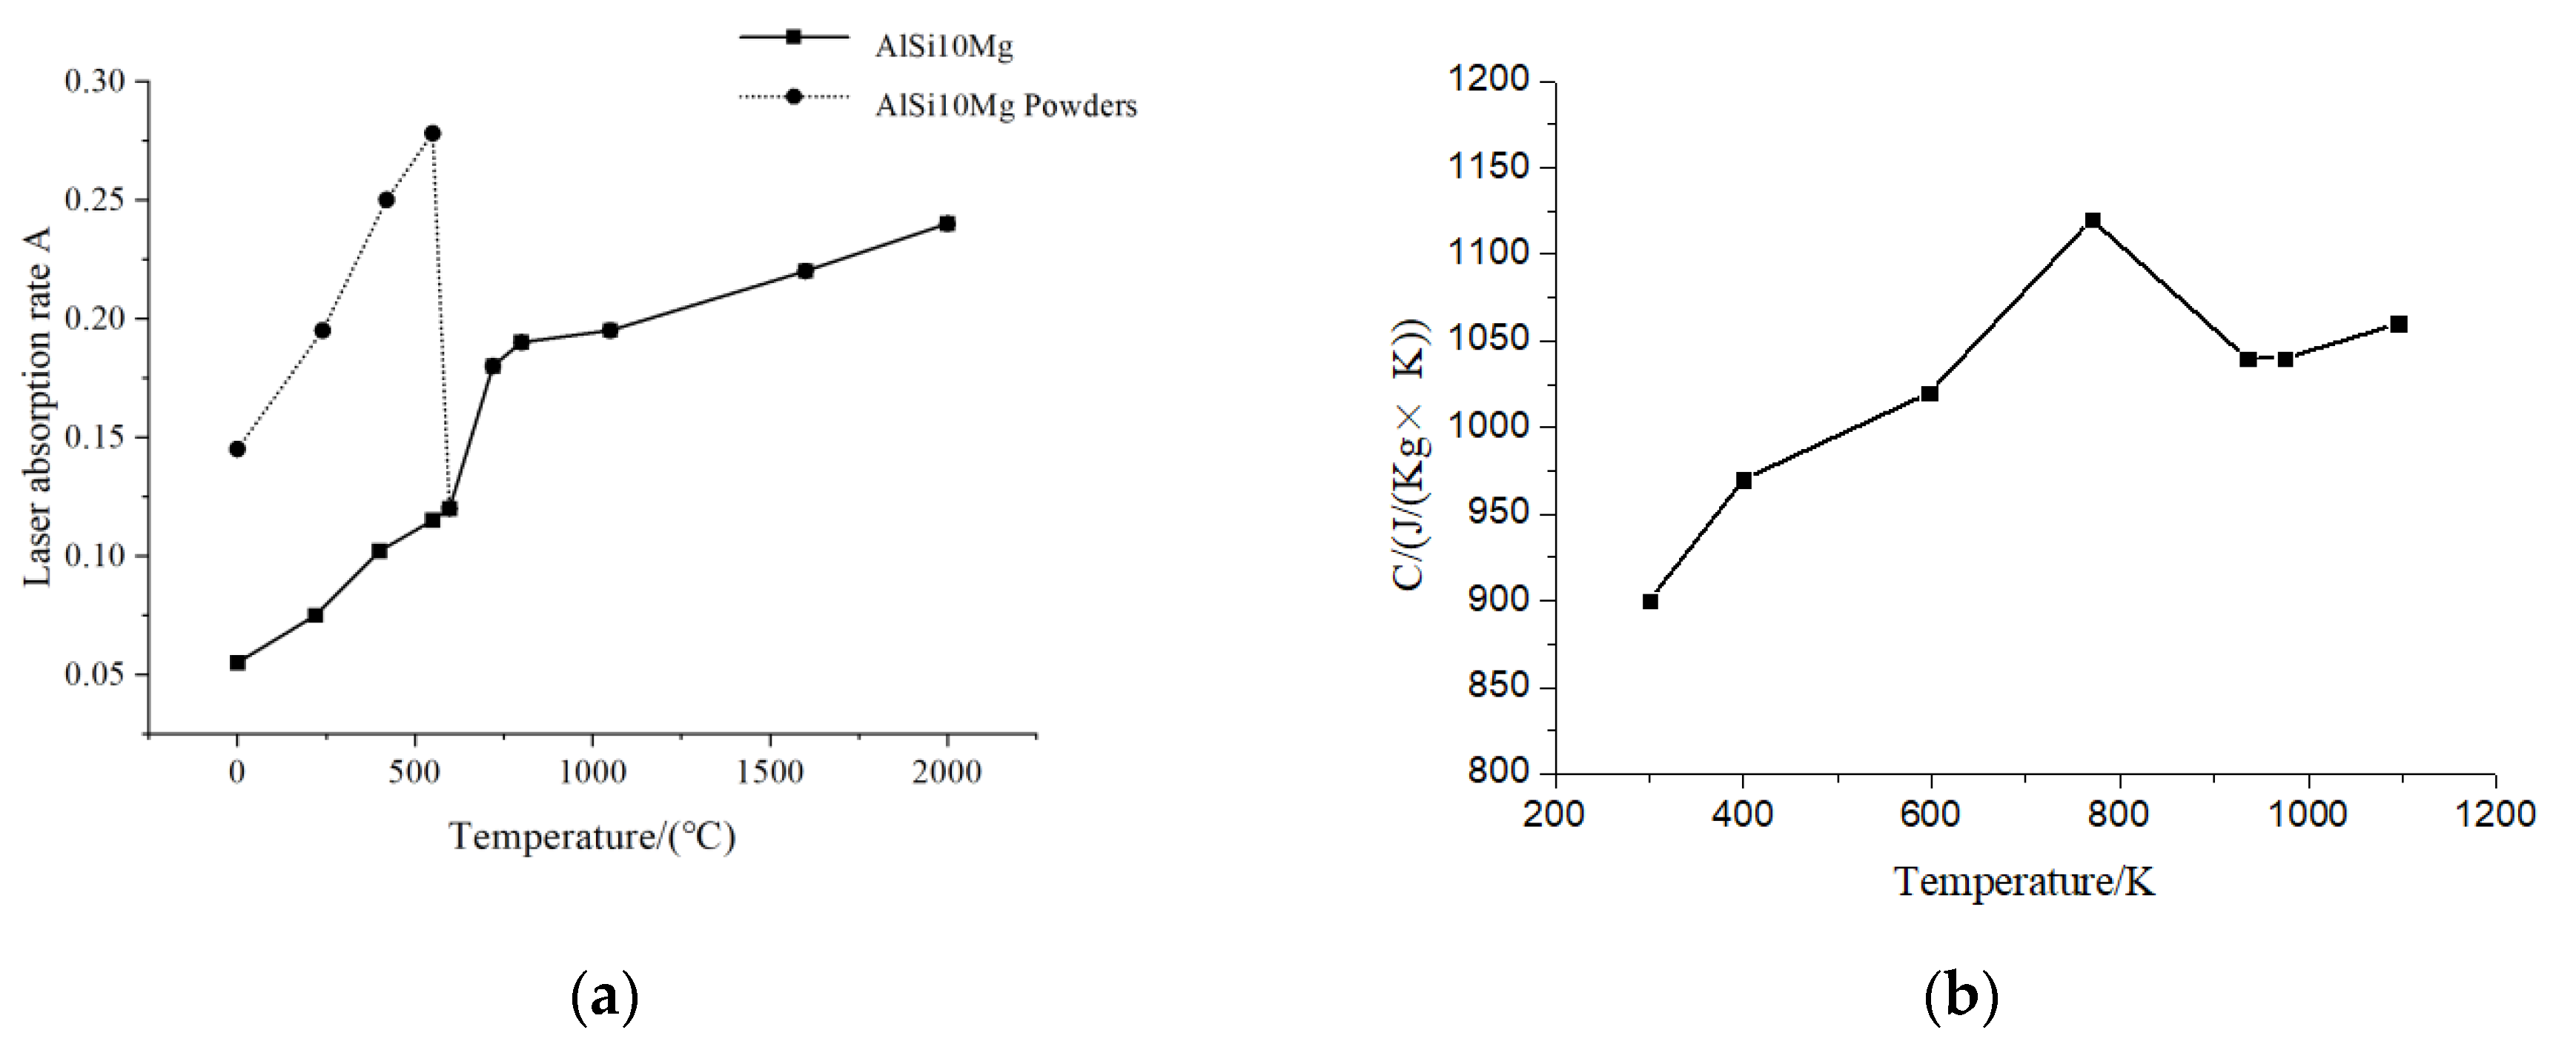
2. Derivation of the Calculation Method

The heat generated by the laser during the printing, firstly, is used to melt the metal powders to transform the phase of materials; secondly, it is reflected by the surface of the metal powders; finally, the metal in the molten state is thermally conductive with its adjacent powders and the fabricated part, and thermally radiated with the air in the printing chamber. Moreover, the phase transition of the material, the heat transfers and other complex physical phenomena would be appeared simultaneously in a short period of time, as shown in Figure 1. As mentioned above, only when the energy provided by the laser is the same as the energy required to melt all the powder on the path and related losses, high relative density printed component can be obtained.
The inside of the printed component is composed of a large number of molten pools. In order to obtain high relative density printed components, the arrangement of the molten pool must meet at least the following two conditions: 1. the depth of the molten pool should be greater than the layer thickness; 2. the width of the molten pool should be greater than the hatch space, as shown in Figure 2, W is the width of the molten pool, D is the depth of the molten pool, h is the hatch space, t is the layer thickness, and a is the diameter of the laser spot. In addition, the hatch space is usually greater than the diameter of laser spot. Therefore, not all powder in the scanning path of laser is directly irradiated by the laser. Correspondingly, the temperature of these two areas inside the molten pool is also very different. In order to further facilitate the theoretical derivation, the temperature field inside the molten pool of the same layer is simplified, as shown in Figure 3. The red area in Figure 3 is area A, and the width (a) of this area is the diameter of laser spot. The temperature in this area is high due to the direct laser irradiation, so it is simplified to the highest temperature in the simulated temperature field; the white area in Figure 3 is area B, this area is the interval between two scanning paths of laser. The temperature in this area is relatively low, so the temperature in this area is simplified to the melting point of the material used.
During LPBF printing, the laser scans along the set path and the local temperature changes dramatically in time and space. The process of the single laser scanning can be considered as an instantaneous moving heat source. In order to obtain the temperature field during the single laser scanning under this heat source, the following assumptions need to be made: (1) the two-dimensional or three-dimensional heat transfer is independent. The heat transfer in each way (heat conduction, heat convection and heat radiation) would not affect each other; (2) the heat source is concentrated on a point in the powder layer; (3) the metal powders are assumed as the continuous. That is, the thermal conductivity of the powders is a fixed value and has no relation with the distribution of powder particles. According to the simplified model of the temperature distribution during LPBF printing, taking a single layer thickness as the smallest unit in the printing direction, the micro-element is selected as shown in Figure 4. The equation of the heat balance in the micro-element is shown in Equation (1).
E L a s e r = E m a + E m b + E c + E r
where E L a s e r is the heat input to the micro-element; E m is the energy required for the metal powders to melt; superscripts a and b represent the region A and the region B, respectively; E c is the energy of heat conduction between the micro-element and the adjacent micro-element; E r is the energy of the thermal convection and thermal radiant of the micro-element.
When the laser scanning along the set path, part of the laser energy is absorbed by the metal powders, and the absorption of each metal powder is different. The remaining energy is reflected by the metal powders and dissipated into the air. Therefore, the energy absorbed by the metal powders is calculated by Equation (2).
E L a s e r = A T Q L a s e r
where A T is the absorption coefficient of the laser energy on the surface of the material; Q L a s e r is the required laser energy (kW).
When the metal powders begin to absorb the laser energy, the powder heat up rapidly. A part of the absorbed laser energy is utilized to melt the metal powder, named latent heat; another part is used to make the powder temperature rise up to the melting point. Therefore, the energy required to melt the metal powders is calculated by the Equations (3) and (5).
E m a = ρ ( T 0 T max C T d T + C e ) d V a
E m b = ρ ( T 0 T m e l t i n g C T d T + C e ) d V b
where ρ is the material density ( g / mm 3 ); C T is the material specific heat capacity ( J / ( kg · K ) ) ; T is the instantaneous temperature (K); C e is the latent heat of the material phase change ( J / kg ); d V is the volume of the micro-body (mm3).
There is a large temperature gradient between the metal powders within the scanning of the laser and the surrounding area, and the heat in the high-temperature region is transferred to the low-temperature region. Part of the laser energy absorbed by the metal powders is lost by the heat conduction, and this part of the energy is calculated by Equation (5).
E c = λ T n d t d S
where λ is the thermal conductivity ( J / mm · s · K ); T n is the temperature gradient (K/mm); d t is the time (s); d S is the superficial area of the micro-element ( mm 2 ).
During LPBF printing, in order to avoid the oxidation of components under high temperature, the shielding gas is continuously supplied to the entire printing chamber. Therefore, during the process of heat conduction, a part of the heat is lost in the form of heat convection. When the laser scanning, the instantaneous temperature of the molten pool is high, and the transference of the heat radiation cannot be ignored. The heat loss of the metal powders due to the heat convection and heat radiation is calculated by Equation (6).
E r = ( h ( T T 0 ) + σ ε ( T 4 T 0 4 ) ) d t d S
where h is the heat transfer coefficient ( J / mm 2 · s · K ); T 0 is the ambient temperature (K); σ is the Stephen-Boltzmann constant ( W / mm 2 · K 4 ); ε is the material blackness coefficient.
Substitute the Equations (2)–(6) into Equation (1), the result of calculating is following:
Q L a s e r = 1 A T ( ρ ( T 0 T max C T d T + C e ) d V a + ρ ( T 0 T max C T d T + C e ) d V b ) + ( λ T n + h ( T T 0 ) + σ ε ( T 4 T 0 4 ) d t d S )
Therefore, QLaser is the energy required to obtain nearly full-density printed components. The energy density of QLaser (DLaser) will be obtained when this energy is divided by the volume of the micro-element, as shown in Equation (8):
D L a s e r = 1 A T ( ρ ( T 0 T max C T d T + C e ) V a V + ρ ( T 0 T m e l t i n g C T d T + C e ) V b V ) + 1 V ( λ T n + h ( T T 0 ) + σ ε ( T 4 T 0 4 ) d t d S )

3. Experiment

The specimens investigated in this study were fabricated using the EOSINT M290 machine. The size of the investigated samples was 10 × 10 × 10   mm 3 , as shown in Figure 5. The printing material was AlSi10Mg produced by EOS Germany. The distribution of spherical particle size D50 was 47.38 μm and D90 was 72.85 μm. The chemical composition of AlSi10Mg (wt.%) is shown in Table 1. The phase distribution of the components was analyzed by Rigaku Smartlab (3 kW) X-ray diffraction (XRD) instrument. The XRD scan angle is 10°~90°, the voltage is 40 kV, and the current is 100 mA.
The density of the specimens was measured using the Archimedes method. The microstructure and defects of the 3D printed samples were observed by Olympus DSX510 optical microscope. The metallographic samples were performed using Keller reagent (nitric acid: hydrochloric acid: hydrofluoric acid: water = 2.5 mL:1.5 mL:1 mL: 95 mL).
In order to verify the accuracy of the theoretical formula and to explore the influence of the VED changing on types of specimen defects, components with different VEDs was printed. The formula of VED is shown in the following.
VED = P υ × h × t
where h is the hatch space (mm), t is the layer thickness (mm). The parameters of printed components are proposed, as shown in Table 2.

4. Analysis and Discussion of Results

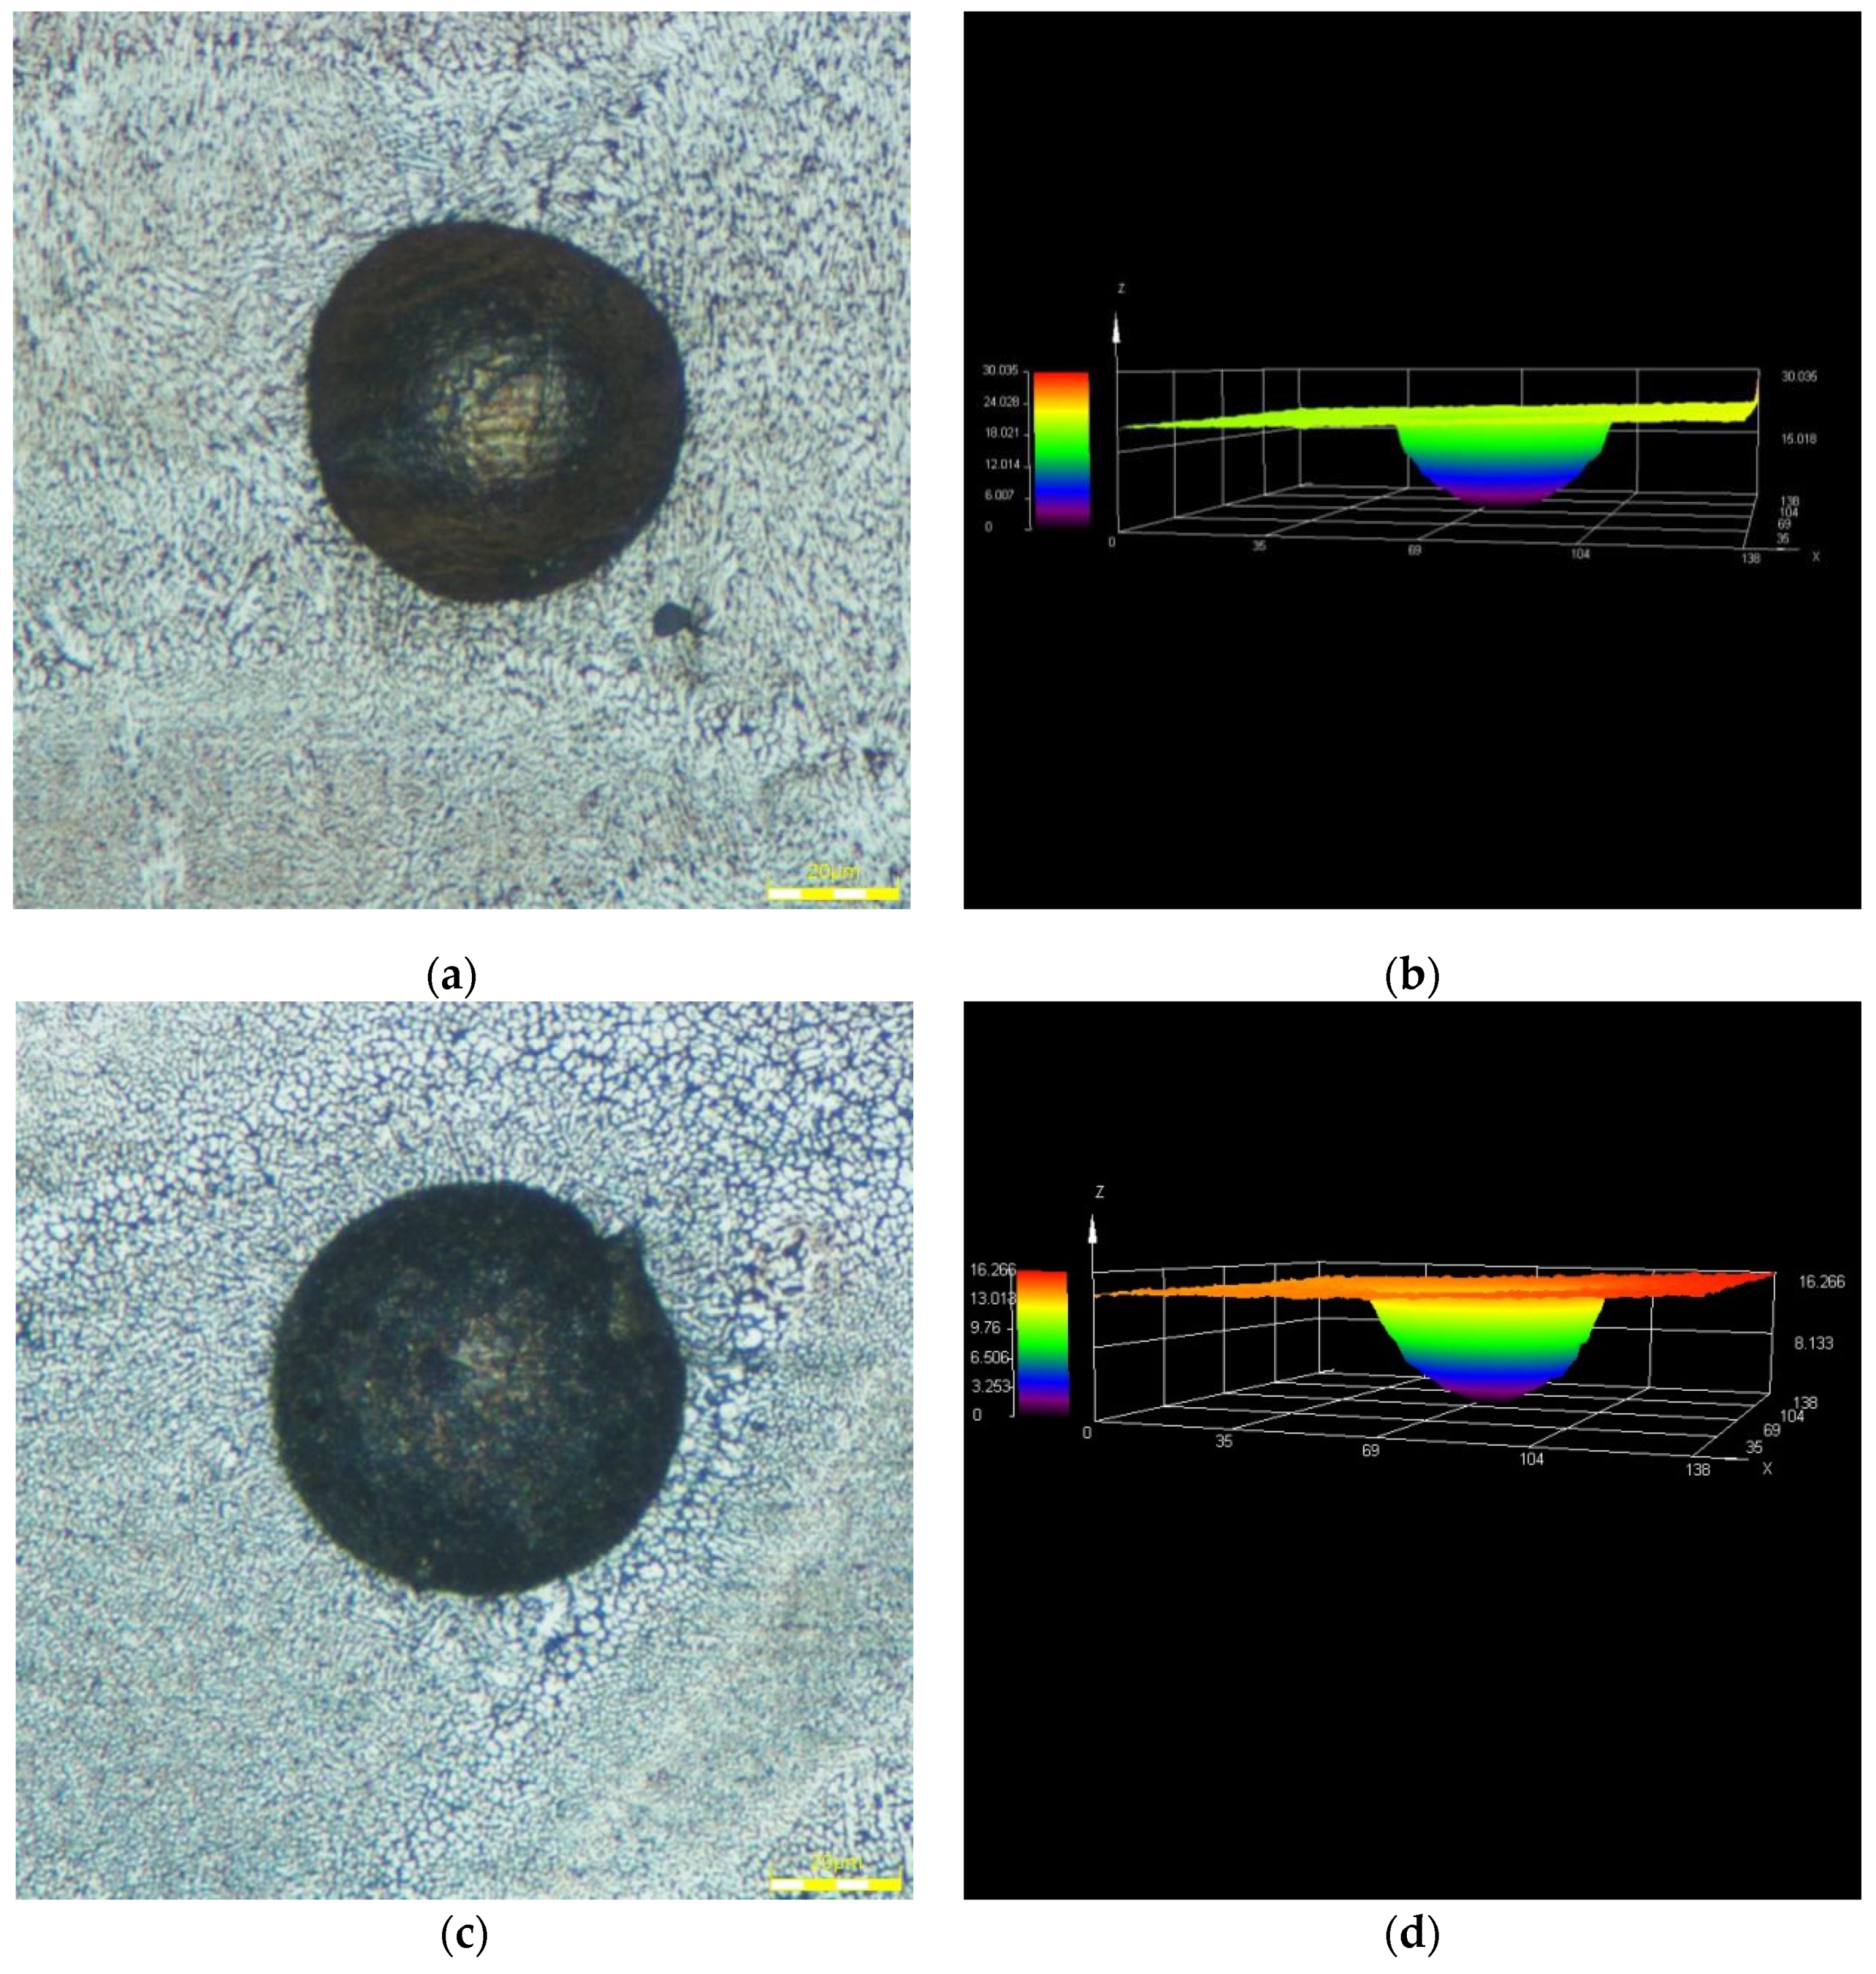
4.1. The Verification of Theoretical Model

Figure 6 shows the relative density of specimens fabricated by different energy of heat input. As shown in Figure 7, the relation density was increased first and decreased with the energy of heat input increasing. When the VED is 49.933 J/mm3, the relative density of the specimen reaches the maximum value of 99.58%. The relation density was greater than 99%, when VED was range between 41 J/mm3 and 86 J/mm3.
The DLaser of AlSi10Mg was calculated by the theoretical prediction model (Equation (8)) derived above. The thermophysical properties of AlSi10Mg are shown in Figure 7 and Table 3 [29].
In order to calculate the required energy for the metal particles melting during printing easily, the temperature field of the specimens (small cubes) is simplified as described in Section 2. The laser spot diameter is about 0.1mm, and the hatch space during printing is 0.19 mm. According to the simulation results of the temperature field by Du et al. [32], the maximum temperature of the molten pool during printing can reach about 2300 °C. This temperature will drop below the solidus of the material within 1ms. Therefore, the width of the red area in Figure 4 is the range of the laser spot (a = 0.1 mm), and the temperature is set as 2300 °C; the white area in Figure 4 is the interval between the two adjacent paths of the laser (h − a = 0.09 mm), and the temperature is set as 597 °C.
Equation (10) can be obtained when the material thermophysical property and the volume of the small cubes are substituted into Equation (8).
DLaser = 51.74 (J/mm3)
That is, the theoretical DLaser of the AlSi10Mg is 51.74 J/mm3. This is close to the experimental values in the previous section of this article. The error between them is about 3.6%. It is also close to the experimental result which is 48 J/mm3 experimented by Kempen et al. [3]. The error between the theoretical prediction and the experimental result is about 7.79%. These errors are due to assuming the metal powders as continuous. However, there are gaps between the powder particles. These gaps are filled with shielding gas. Therefore, errors are introduced in this simplification. It can also explain the errors of the experimental results among this article and other references. The particle size distribution and microstructure of metal powders used are slightly different. Wang et al. [35] explored the influence of metal particles microstructure on heat conduction. They found that the thermal conductivity is not only influenced by the porosity of particle powder but also by the 3D particle morphology.
In addition, the DLaser of the following two materials: 316L and TC4 are calculated. The calculation results are shown in the following table.
It can be seen from Equation (8) and Table 4 that the DLaser of the material calculated by the theoretical formula is close to the experimental value, and the error between them is within 10%. In general, this shows that the theoretical calculation method is accurate and universal.

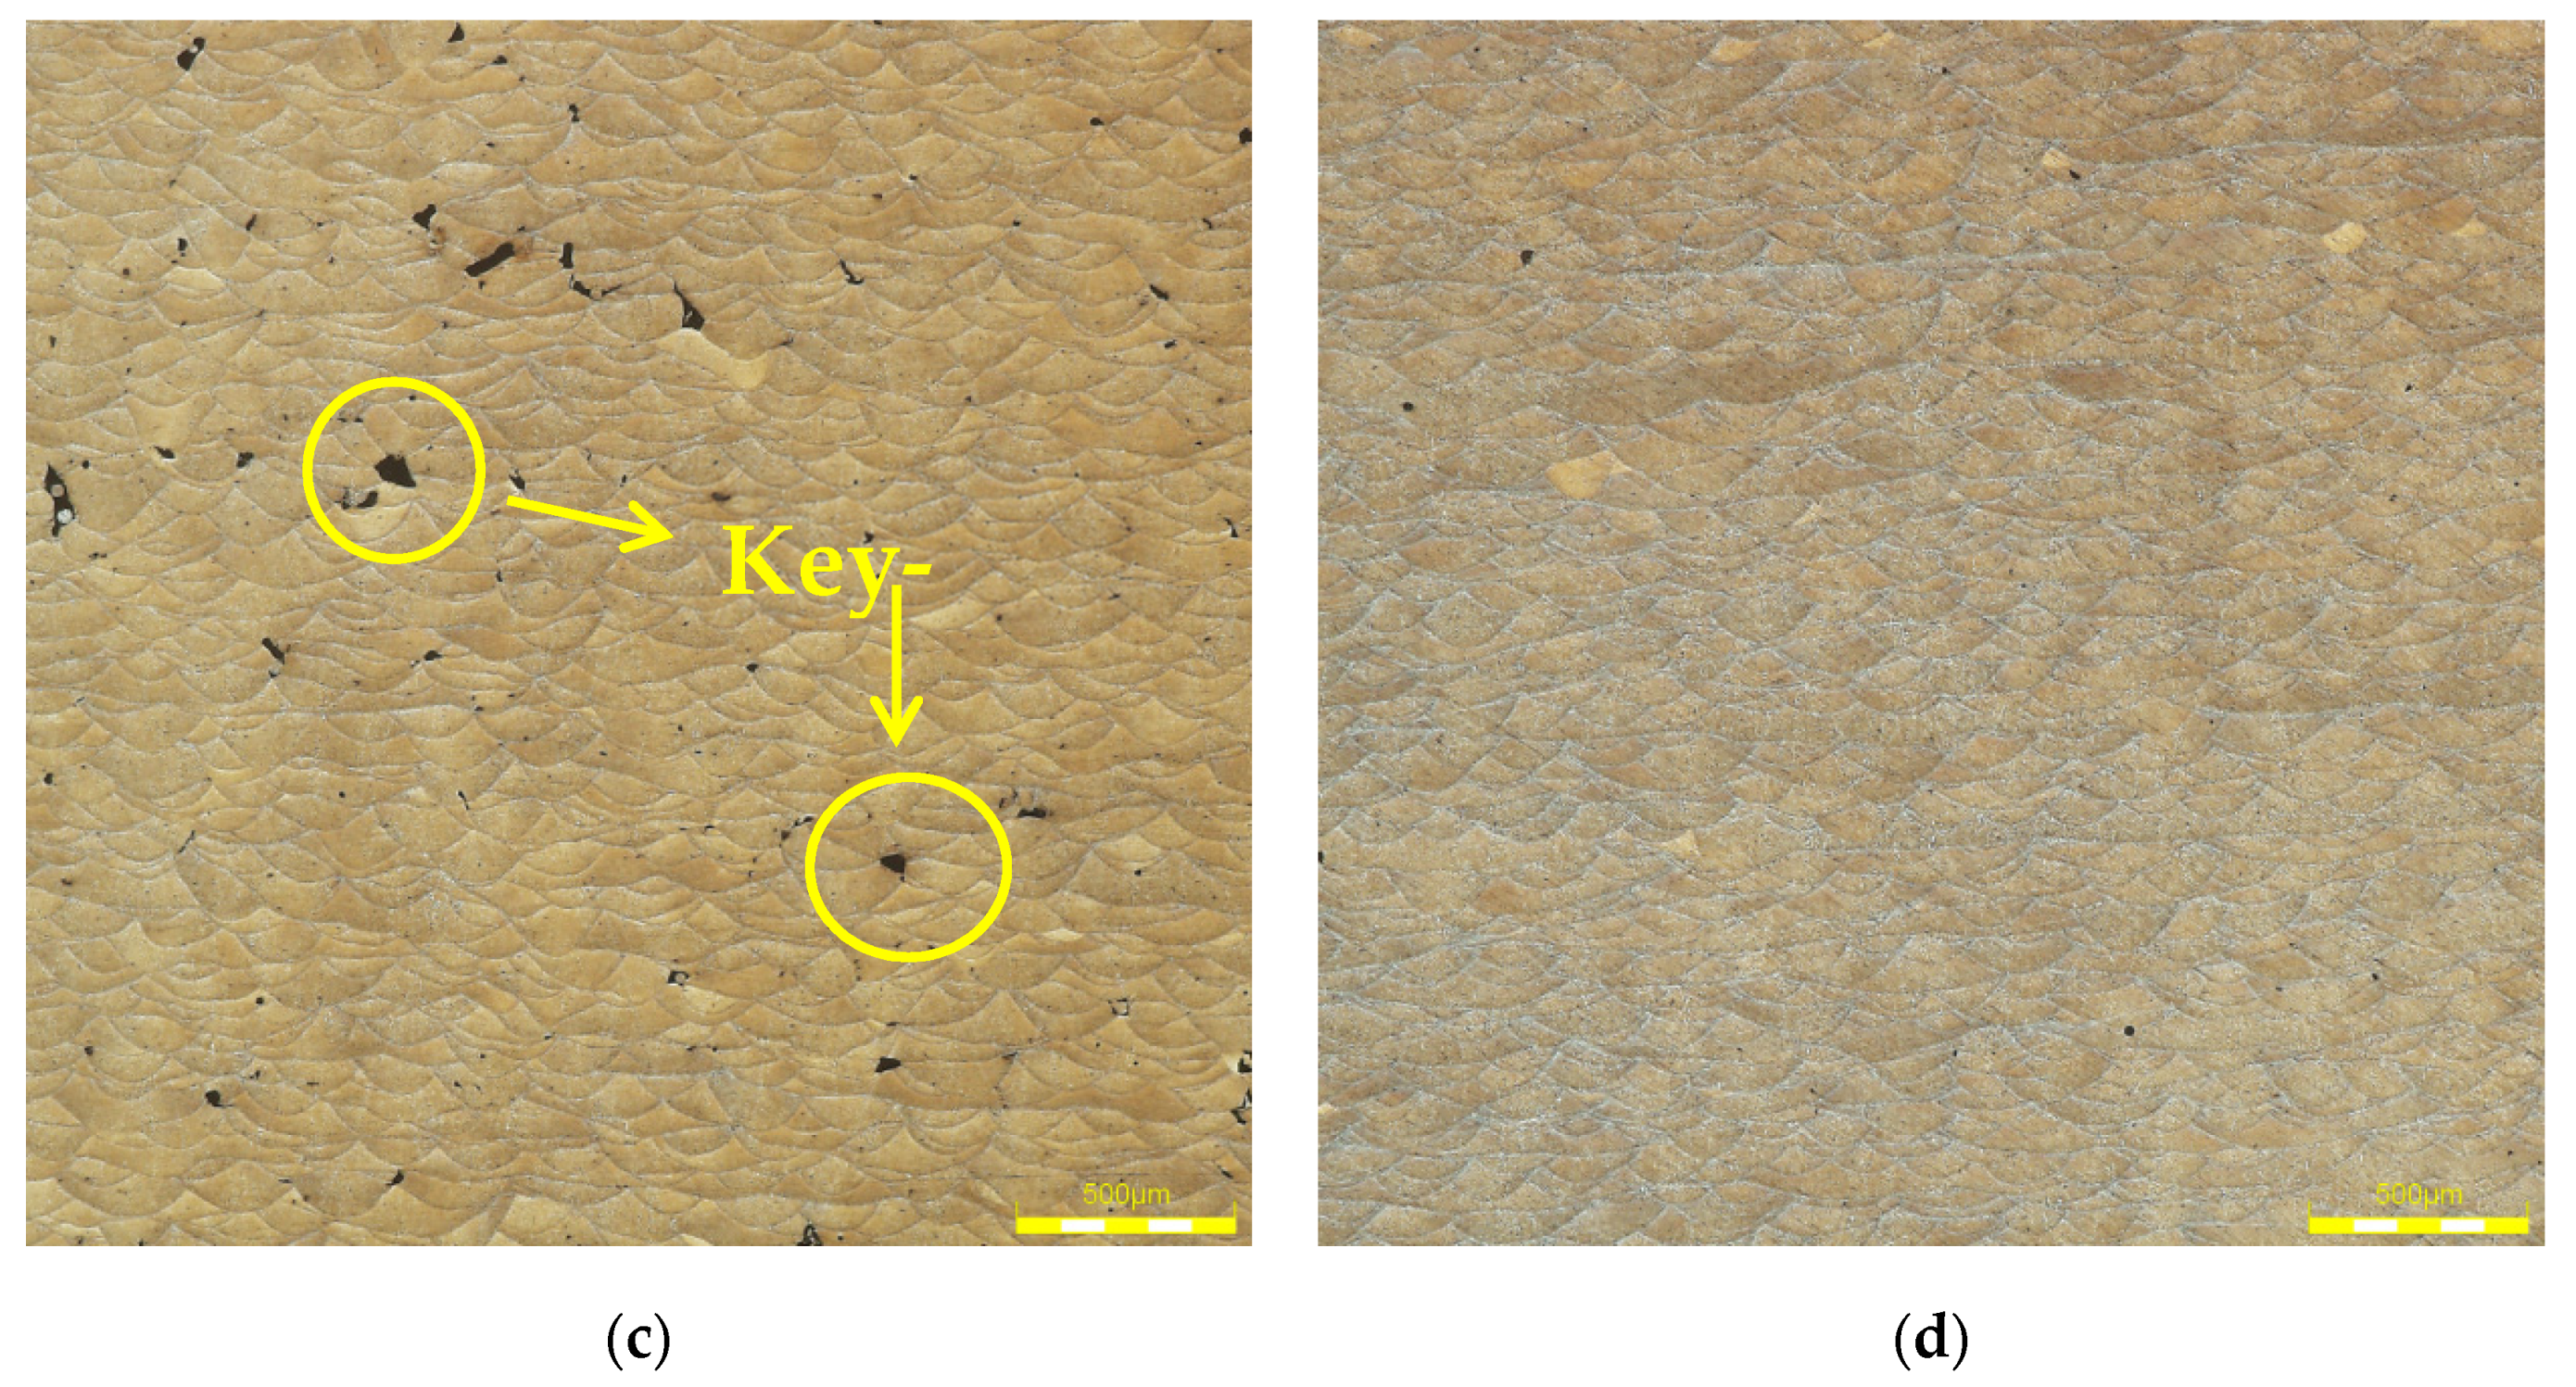
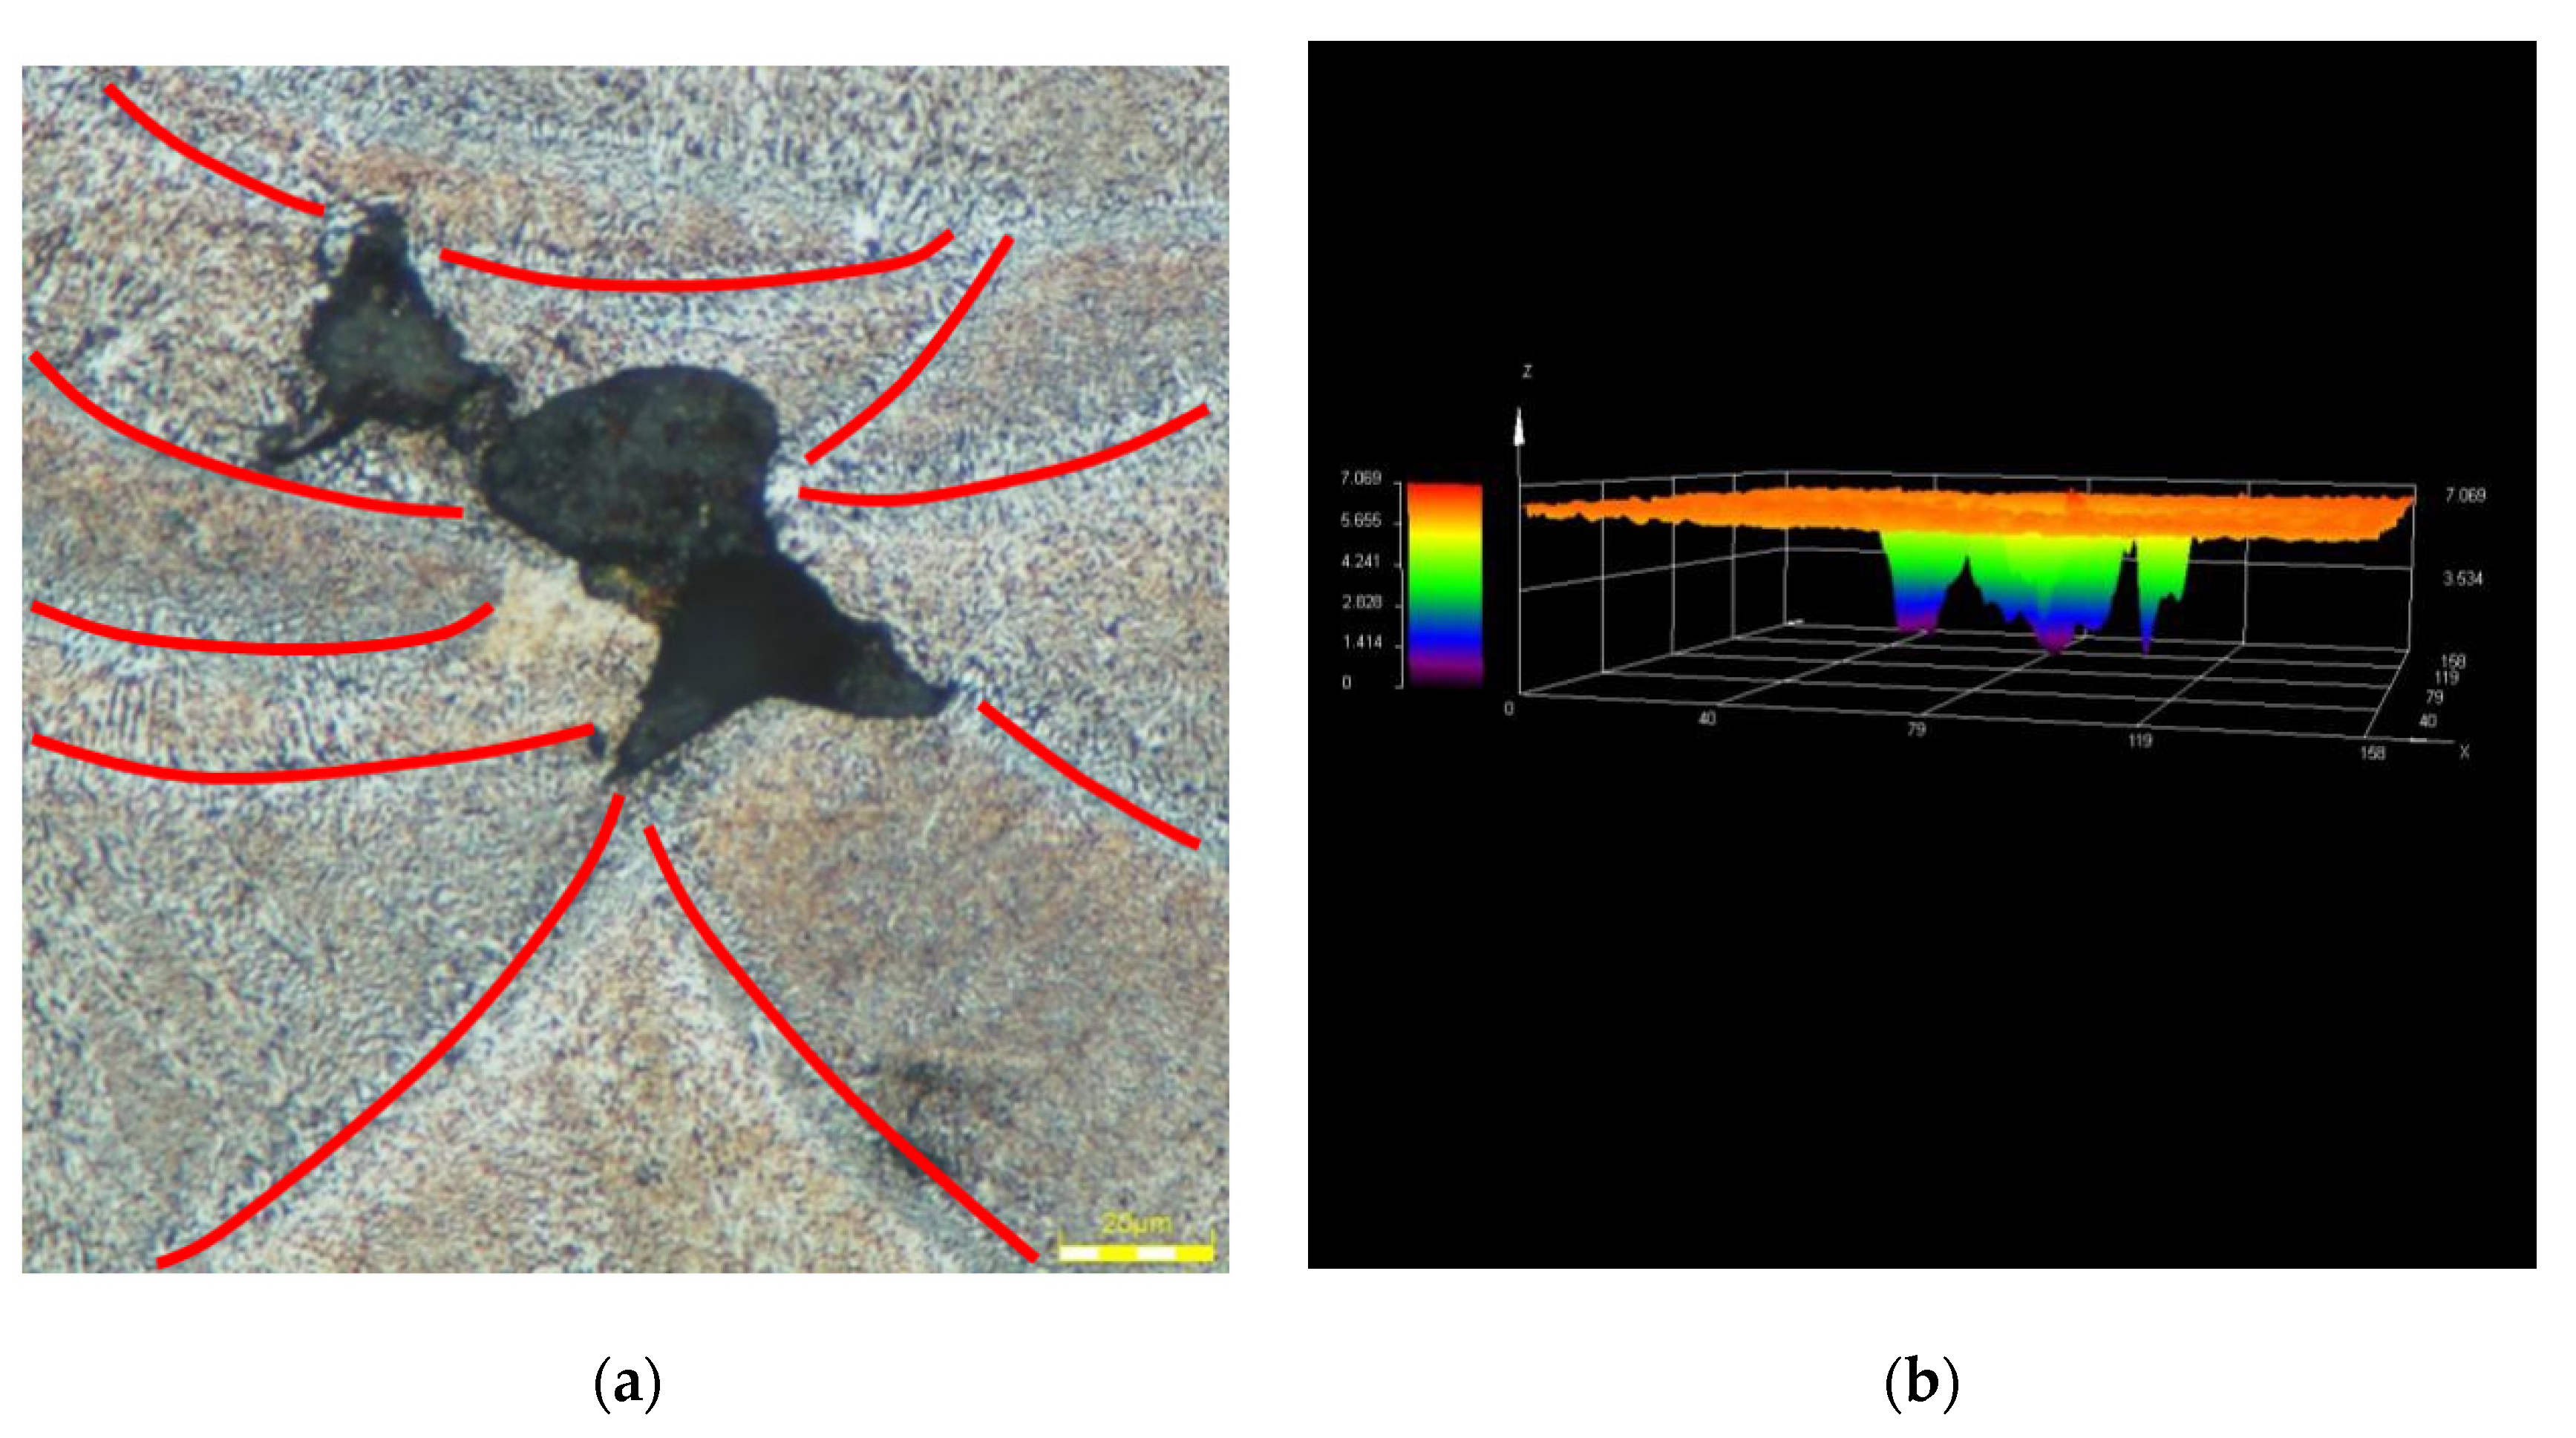
4.2. The Influence of VED on the Internal Morphology and Defects of Components

Figure 8a shows the XRD results of different VED components. It can be seen from Figure 8b that as the VED increased, the diffraction peak of Al shifted to the right continuously. The following Equation (11) is the Bragg equation, and the following Equation (12) is the relationship between the interplanar spacing (d) and the lattice constant (a) of the cubic crystal (α-Al is the face center cubic (FCC) structure).
2 d sin θ = n λ
d = a h 2 + k 2 + l 2
where θ is the diffraction angle, d is the interplanar spacing, n is the diffraction order, λ is the wavelength, and a is the lattice constant. It can be found from the above two equations that the diffraction angle θ is inversely proportional to the interplanar spacing d, and the interplanar spacing d is directly proportional to the lattice constant a. When the heat input of the laser was high, the diffraction angle of Al increased, so the lattice constant of α-Al decreased. This showed that the α-Al inside the component had lattice distortion. This is because, during LPBF printing, the melting-solidification process of the metal is very short. Before the Si element precipitated from the Al matrix and grew up, the molten pool had already solidified. From the Al-Si alloy binary phase diagram, it can be found that at 577 °C, the maximum solubility of Si in Al is only 1.65% (wt.%), while the content of Si in AlSi10Mg is about 10% (wt.%). Therefore, the supersaturated solid solution of Si in the Al matrix was formed inside the printed component. As the heat input increases, the temperature gradient during printing becomes larger, so the size of formed crystal grains is smaller.
Figure 9 below shows the microstructure morphology of the component with different VEDs. The amount of precipitated element Si is closely related to the cooling rate and temperature gradient of the molten pool [38]. The center of the molten pool directly absorbed the heat provided by the laser. Although the temperature in the center of the molten pool is the highest, the heat quickly spread around. Therefore, there is less precipitated element Si in the center of the molten pool. The overlapping area of adjacent molten pools is the remelting zone, and there is a certain heat accumulation effect. Therefore, the precipitation of element Si in the overlapping area is obvious. In addition, it can be found from Figure 9 that when the VED is 99.865 J/mm3, the precipitated element Si at the boundary of the molten pool is significantly less than the printed component when the VED is 16.644 J/mm3. The radius of Al atoms and Si atoms are 0.1431 nm and 0.1172 nm, respectively. The ratio of the atomic radius of the solute to the solvent is 0.819, which is greater than the limit radius ratio of the interstitial solid solution forming (0.59). Therefore, the Al matrix is the supersaturated substitutional solid solution. In the Al matrix, a large number of Al atoms are occupied by Si atoms, and Rsi < Ral. It means when the VED increases, the temperature gradient also increases and the element Si in the Al matrix is too late to precipitate. It results in more lattice distortion and the smaller lattice constant in the components so that the corresponding diffraction peak shifts to the right. This is consistent with the XRD results above.
As shown in Figure 6 above, the VED significantly affects the relative density of the component, and the change in the relative density of the component directly reflects the change of the internal defects. When the VED is small, the internal defects of the components are mainly keyholes; when the VED is high, the internal defects are mainly pores. The specific instructions are as follows:
Figure 10 shows the metallographic of different VED specimens when the VED is smaller than 41 J/mm3. In Figure 10, the defects within specimens are mainly keyholes, and there are also unmelted powders in them. This is because the laser provides insufficient energy to melt all of the metal powders. During the LPBF printing, the cross-section of the molten pool is generally semi-elliptical. When the energy of heat input is small, that is, the scanning speed is too fast or the hatch space is too large, the metal powders on the target path cannot be completely melted, especially at the junction of two adjacent molten pools, as shown in Figure 11a. Therefore, the shape of the keyhole is mostly irregular, and the nonmelted powders can also be found in the keyhole sometimes. The ultra-depth of field image of the keyhole was shown in Figure 11a–f. It can be seen from Figure 11 that the three-dimensional shape of the keyhole is irregular and the inside is rough.
Figure 12 shows the metallographic of different VED specimens when the VED is larger than 86   J / mm 3 . As shown in Figure 13, the defects within specimens are mainly gas pores. This is because when the energy of heat input is large, the metal particles absorb too much laser energy per unit volume per unit time. As a result, the shielding gas cannot escape from the molten pool in time. Ultra-depth images of the pores are shown in Figure 13a–d. It can be seen from them that the shape of the pores is relatively regular and is substantially ellipsoidal. In addition, the surface inside of the pores is relatively smooth.
Therefore, the VED of the printed specimens input through the laser is also changed accordingly when the printing parameters are changed. The metal powders absorbing too much or too little energy from the laser per unit volume per unit time will result in corresponding printing defects and ultimately affect the relative density of the specimens. Taking AlSi10Mg as an example, high relative density specimens can be fabricated with the VED in the range of 41 J/mm3 to 86 J/mm3.

5. Conclusions

This article explores the required laser energy to fabricate high-density LPBF components. A method that calculates the DLaser of different materials is provided by theoretical calculating. The data used to support these findings of this study are available from the corresponding author upon request. The following are the main research contents and results of this paper:
(1) The DLaser of three materials, AlS10Mg, 316L and TC4, were calculated by theoretical formula. By comparing with the experimental values, it is found that the errors between them are within 10%. This verifies the accuracy and universality of the theoretical calculation method in this paper.
(2) The effect of VED on the relative density and the types of defects and microstructure in the fabricated specimens was observed and analyzed. When the VED is small, the main kinds of specimen defects are keyholes and nonmelted powders; when the VED is large, the main kind of specimen defects is pores. In order to obtain higher density AlSi10Mg specimens (relative density is larger than 99%), the VED should be in the range of 41 J/mm3 to 86 J/mm3. In addition, and these two kinds of defects have obvious differences in two-dimensional and three-dimensional shapes. The morphology of pores is mostly regular ellipsoidal shapes, and the keyhole is most irregular.

Author Contributions

Conceptualization, Y.L.; methodology, Y.L.; software, M.L.; supervision, X.L.; validation, M.L.; visualization, P.L.; writing—original draft, Y.L.; writing—review and editing, X.Z. All authors have read and agreed to the published version of the manuscript.

Funding

This research was funded by the National Natural Science Foundations of China (No. 11772147), National Natural Science Foundation of China (No. 12027901), Major University Science Research Project of Jiangsu Province, China (No. 20KJA460001), and Natural Science Foundation of Jiangsu Province, China (No. BK20200706).

Institutional Review Board Statement

Not applicable.

Informed Consent Statement

Not applicable.

Data Availability Statement

It was followed according to MDPI Research Data Policies.

Conflicts of Interest

The authors declare no conflict of interest. The funders had no role in the design of the study; in the collection, analyses, or interpretation of data; in the writing of the manuscript, or in the decision to publish the results.

References

  1. Yadollahi, A.; Shamsaei, N.; Thompson, S.M.; Elwany, A.; Bian, L. Effects of building orientation and heat treatment on fatigue behavior of selective laser melted 17-4 PH stainless steel. Int. J. Fatigue 2017, 94, 218–235. [Google Scholar] [CrossRef]
  2. Khorasani, A.M.; Gibson, I.; Awan, U.S.; Ghaderi, A. The effect of SLM process parameters on density, hardness, tensile strength and surface quality of Ti-6Al-4V. Addit. Manuf. 2018, 25, 176–186. [Google Scholar] [CrossRef]
  3. Kempen, K.; Thijs, L.; Van Humbeeck, J.; Kruth, J.-P. Mechanical Properties of AlSi10Mg Produced by Selective Laser Melting. Phys. Procedia 2012, 39, 439–446. [Google Scholar] [CrossRef] [Green Version]
  4. Giganto, S.; Zapico, P.; Castro-Sastre, M.Á.; Martínez-Pellitero, S.; Leo, P.; Perulli, P. Influence of the scanning strategy parameters upon the quality of the SLM parts. Procedia Manuf. 2019, 41, 698–705. [Google Scholar] [CrossRef]
  5. Kaufmann, N.; Imran, M.; Wischeropp, T.M.; Emmelmann, C.; Siddique, S.; Walther, F. Influence of Process Parameters on the Quality of Aluminium Alloy EN AW 7075 Using Selective Laser Melting (SLM). Phys. Procedia 2016, 83, 918–926. [Google Scholar] [CrossRef] [Green Version]
  6. Yu, G.; Gu, D.; Dai, D.; Xia, M.; Ma, C.; Chang, K. Influence of processing parameters on laser penetration depth and melting/re-melting densification during selective laser melting of aluminum alloy. Appl. Phys. A Mater. Sci. Process. 2016, 122, 891. [Google Scholar] [CrossRef]
  7. Trevisan, F.; Calignano, F.; Lorusso, M.; Pakkanen, J.A.; Aversa, A.; Ambrosio, E.P.; Lombardi, M.; Fino, P.; Manfredi, D. On the Selective Laser Melting (SLM) of the AlSi10Mg Alloy: Process, Microstructure, and Mechanical Properties. Materials 2017, 10, 76. [Google Scholar] [CrossRef] [PubMed] [Green Version]
  8. Nguyen, Q.B.; Luu, D.N.; Nai, S.M.L.; Zhu, Z.; Chen, Z.; Wei, J. The role of powder layer thickness on the quality of SLM printed parts. Arch. Civ. Mech. Eng. 2018, 18, 948–955. [Google Scholar] [CrossRef]
  9. Liu, X.; Zhao, C.; Zhou, X.; Shen, Z.; Liu, W. Microstructure of selective laser melted AlSi10Mg alloy. Mater. Des. 2019, 168, 107677. [Google Scholar] [CrossRef]
  10. Ozsoy, A.; Yasa, E.; Keles, M.; Tureyen, E.B. Pulsed-mode Selective Laser Melting of 17-4 PH stainless steel: Effect of laser parameters on density and mechanical properties. J. Manuf. Process. 2021, 68, 910–922. [Google Scholar] [CrossRef]
  11. Liverani, E.; Toschi, S.; Ceschini, L.; Fortunato, A. Effect of selective laser melting (SLM) process parameters on microstructure and mechanical properties of 316L austenitic stainless steel. J. Mater. Process. Technol. 2017, 249, 255–263. [Google Scholar] [CrossRef]
  12. Aboulkhair, N.T.; Simonelli, M.; Parry, L.; Ashcroft, I.; Tuck, C.; Hague, R. 3D printing of Aluminium alloys: Additive Manufacturing of Aluminium alloys using selective laser melting. Prog. Mater. Sci. 2019, 106, 10058. [Google Scholar] [CrossRef]
  13. Shipley, H.; McDonnell, D.; Culleton, M.; Coull, R.; Lupoi, R.; O’Donnell, G.; Trimble, D. Optimisation of process parameters to address fundamental challenges during selective laser melting of Ti-6Al-4V: A review. Int. J. Mach. Tools Manuf. 2018, 128, 1–20. [Google Scholar] [CrossRef]
  14. Cai, C.; Wu, X.; Liu, W.; Zhu, W.; Chen, H.; Qiu, J.C.D.; Sun, C.-N.; Liu, J.; Wei, Q.; Shi, Y. Selective laser melting of near-α titanium alloy Ti-6Al-2Zr-1Mo-1V: Parameter optimization, heat treatment and mechanical performance. J. Mater. Sci. Technol. 2020, 57, 53–66. [Google Scholar] [CrossRef]
  15. Montero-Sistiaga, M.L.; Pourbabak, S.; van Humbeeck, J.; Schryvers, D.; Vanmeensel, K. Microstructure and mechanical properties of Hastelloy X produced by HP-SLM (high power selective laser melting). Mater. Des. 2019, 165, 107598. [Google Scholar] [CrossRef]
  16. Hanzl, P.; Zetek, M.; Bakša, T.; Kroupa, T. The Influence of Processing Parameters on the Mechanical Properties of SLM Parts. Procedia Eng. 2015, 100, 1405–1413. [Google Scholar] [CrossRef] [Green Version]
  17. Liu, B.; Fang, G.; Lei, L. An analytical model for rapid predicting molten pool geometry of selective laser melting (SLM). Appl. Math. Model. 2021, 92, 505–524. [Google Scholar] [CrossRef]
  18. Hao, Z. Process Optimization and Microstructure Analysis of Selective Laser Melting CoCrW Alloy. Master’s Thesis, North University of China, Taiyuan, China, 2018. [Google Scholar]
  19. Galy, C.; le Guen, E.; Lacoste, E.; Arvieu, C. Main defects observed in aluminum alloy parts produced by SLM: From causes to consequences. Addit. Manuf. 2018, 22, 165–175. [Google Scholar] [CrossRef]
  20. Olakanmi, E.O.; Cochrane, R.F.; Dalgarno, K.W. A review on selective laser sintering/melting (SLS/SLM) of aluminium alloy powders: Processing, microstructure, and properties. Prog. Mater. Sci. 2015, 74, 401–477. [Google Scholar] [CrossRef]
  21. Gunenthiram, V.; Peyre, P.; Schneider, M.; Dal, M.; Coste, F.; Koutiri, I.; Fabbro, R. Experimental analysis of spatter generation and melt-pool behavior during the powder bed laser beam melting process. J. Mater. Process. Technol. 2018, 251, 376–386. [Google Scholar] [CrossRef]
  22. Koutiri, I.; Pessard, E.; Peyre, P.; Amlou, O.; de Terris, T. Influence of SLM process parameters on the surface finish, porosity rate and fatigue behavior of as-built Inconel 625 parts. J. Mater. Process. Technol. 2018, 255, 536–546. [Google Scholar] [CrossRef]
  23. Niu, P.D.; Li, R.D.; Yuan, T.C.; Zhu, S.Y.; Chen, C.; Wang, M.B.; Huang, L. Microstructures and properties of an equimolar AlCoCrFeNi high entropy alloy printed by selective laser melting. Intermetallics 2019, 104, 24–32. [Google Scholar] [CrossRef]
  24. Zhou, Y.H.; Li, W.P.; Zhang, L.; Zhou, S.Y.; Jia, X.; Wang, D.W.; Yan, M. Selective laser melting of Ti-22Al-25Nb intermetallic: Significant effects of hatch distance on microstructural features and mechanical properties. J. Mater. Process. Technol. 2020, 276, 116398. [Google Scholar] [CrossRef]
  25. Cherry, J.A.; Davies, H.M.; Mehmood, S.; Lavery, N.P.; Brown, S.G.R.; Sienz, J. Investigation into the effect of process parameters on microstructural and physical properties of 316L stainless steel parts by selective laser melting. Int. J. Adv. Manuf. Technol. 2020, 76, 869–879. [Google Scholar] [CrossRef] [Green Version]
  26. Pal, S.; Gubeljak, N.; Hudak, R.; Lojen, G.; Rajtukova, V.; Predan, J.; Kokol, V.; Drstvensek, I. Tensile properties of selective laser melting products affected by building orientation and energy density. Mater. Sci. Eng. A 2019, 743, 637–647. [Google Scholar] [CrossRef]
  27. Bruna-Rosso, C.; Demir, A.G.; Previtali, B. Selective laser melting finite element modeling: Validation with high-speed imaging and lack of fusion defects prediction. Mater. Des. 2018, 156, 143–153. [Google Scholar] [CrossRef] [Green Version]
  28. Tonelli, L.; Fortunato, A.; Ceschini, L. CoCr alloy processed by Selective Laser Melting (SLM): Effect of Laser Energy Density on microstructure, surface morphology, and hardness. J. Manuf. Process. 2020, 52, 106–119. [Google Scholar] [CrossRef]
  29. Li, R.; Wang, M.; Yuan, T.; Song, B.; Chen, C.; Zhou, K.; Cao, P. Selective laser melting of a novel Sc and Zr modified Al-6.2 Mg alloy: Processing, microstructure, and properties. Powder Technol. 2017, 319, 117–128. [Google Scholar] [CrossRef]
  30. Tang, M.; Zhang, L.; Zhang, N. Microstructural evolution, mechanical and tribological properties of TiC/Ti6Al4V composites with unique microstructure prepared by SLM. Mater. Sci. Eng. A 2021, 814, 141187. [Google Scholar] [CrossRef]
  31. Yap, C.Y.; Chua, C.K.; Dong, Z.L. An effective analytical model of selective laser melting. Virtual Phys. Prototyp. 2016, 11, 21–26. [Google Scholar] [CrossRef]
  32. Du, Y.; You, X.; Qiao, F.; Guo, L.; Liu, Z. A model for predicting the temperature field during selective laser melting. Results Phys. 2019, 12, 52–60. [Google Scholar] [CrossRef]
  33. Zhuang, J.R.; Lee, Y.T.; Hsieh, W.H.; Yang, A.S. Determination of melt pool dimensions using DOE-FEM and RSM with process window during SLM of Ti6Al4V powder. Opt. Laser Technol. 2018, 103, 59–76. [Google Scholar] [CrossRef]
  34. Zaeh, M.F.; Ott, M. Investigations on heat regulation of additive manufacturing processes for metal structures. CIRP Ann. 2011, 60, 259–262. [Google Scholar] [CrossRef]
  35. Wang, P.; Lei, H.; Zhu, X.; Chen, H.; Fang, D. Influence of AlSi10Mg particles microstructure on heat conduction during additive manufacturing. Int. J. Heat Mass Transf. 2019, 144, 118632. [Google Scholar] [CrossRef]
  36. Liu, Y.; Zhang, J.; Pang, Z. Numerical and experimental investigation into the subsequent thermal cycling during selective laser melting of multi-layer 316L stainless steel. Opt. Laser Technol. 2018, 98, 23–32. [Google Scholar] [CrossRef]
  37. Shi, X.; Ma, S.; Liu, C.; Chen, C.; Wu, Q.; Chen, X.; Lu, J. Performance of high layer thickness in selective laser melting of Ti6Al4V. Materials 2016, 9, 975. [Google Scholar] [CrossRef] [PubMed] [Green Version]
  38. Zhou, L.; Mehta, A.; Schulz, E.; McWilliams, B.; Cho, K.; Sohn, Y. Microstructure, precipitates and hardness of selectively laser melted AlSi10Mg alloy before and after heat treatmenReadt. Mater. Charact. 2018, 143, 5–17. [Google Scholar] [CrossRef]
Figure 1. The thermal physical model of LPBF process.
Metals 11 01966 g001
Figure 2. The thermal physical model of LPBF process.
Metals 11 01966 g002
Figure 3. The model of simplified metal temperature field.
Metals 11 01966 g003
Figure 4. The micro-element in the temperature field.
Metals 11 01966 g004
Figure 5. 10 × 10 × 10 mm3 cubes.
Metals 11 01966 g005
Figure 6. The relative density of specimens fabricated by different VEDs.
Metals 11 01966 g006
Figure 7. The thermophysical properties of AlSi10Mg. (a) AlSi10Mg laser absorptivity A T ; (b) AlSi10Mg specific heat C T .
Metals 11 01966 g007
Figure 8. The XRD results. (a) XRD results of different VEDs components; (b) XRD results of different VEDs components.
Metals 11 01966 g008
Figure 9. The internal structure of the component under different VED. (a) The internal structure of the component when VED is 16.644 J/mm3 (×1000); (b) The internal structure of the component when VED is 99.865 J/mm3 (×1000).
Metals 11 01966 g009
Figure 10. The metallographic of samples when VED is smaller than 41.249 J/mm3. (a) the yOz cross-section metallographic of sample 1 × 100 (VED: 16.644 J / mm 3 ); (b) the yOz cross-section metallographic of sample 3 × 100 (VED: 24.966 J/mm3); (c) the yOz cross-section metallographic of sample 5 × 100 (VED: 33.288 J/mm3); (d) the yOz cross-section metallographic of sample 7 × 100 (VED: 41.249 J/mm3).
Metals 11 01966 g010aMetals 11 01966 g010b
Figure 11. The 2D and 3D morphology of LPBF printing defects(keyholes) (a) sample 1 × 1250 (the yOz cross-section); (b) the ultra-depth of field image of the keyhole; (c) sample 1 × 750 (the yOz cross-section); (d) the ultra-depth of field image of the keyhole; (e) sample 5 × 1000 (the yOz cross-section); (f) the ultra-depth of field image of the keyhole.
Metals 11 01966 g011aMetals 11 01966 g011b
Figure 12. The metallographic of samples when VED is larger than 86.247 J/mm3. (a) the xOy cross-section metallographic of sample 11 × 100 (VED: 86.247 J/mm3); (b) the yOz cross-section metallographic of sample 12 × 100 (VED: 99.865 J/mm3).
Metals 11 01966 g012
Figure 13. The 2D and 3D morphology of LPBF printing defects (gas pores) (a) sample 12 × 2000 (the yOz cross-section); (b) the ultra-depth of field image of the gas pores; (c) sample 12 × 2000 (the xOy cross-section); (d) the ultra-depth of field image of the gas pores.
Metals 11 01966 g013
Table 1. Chemical composition of AlSi10Mg spherical particles (wt.%).
SiFeCuMnMgZn
wt.%9.70.140.01<0.010.36<0.01
Table 2. The parameters of fabricating samples.
SamplesLaser Power(W)Printing Speed
(mm/s)
Hatch SPACE
(mm)
Layer Thickness
(mm)
VED
(Calculated by Equation (9))
(J/mm3)
137039000.190.0316.644
237032500.190.0319.973
337013000.190.0624.966
437019500.190.0333.288
537013000.270.0335.138
637013000.230.0341.249
737013000.190.0349.933
837013000.150.0363.248
937013000.190.0274.899
1037013000.110.0386.247
113706500.190.0399.865
Table 3. The thermophysical properties of AlSi10Mg.
Density ρ
(g/mm3)
Latent Heat of Fusion L
(J/Kg)
Liquidus TL
(K)
Solidus TS
(K)
2.67 3.98 × 10 5 869830
Table 4. Calculation results of DLaser for different materials.
MaterialsTheoretical Values (J/mm3)Experimental Values (J/mm3)Error (%)Sources of Material Thermophysical Property
316L104.48104.52 [26]0.03[36]
TC469.2865 [27]6.28[37]
Publisher’s Note: MDPI stays neutral with regard to jurisdictional claims in published maps and institutional affiliations.

