Article

Solid-Solid Phase Transformations and Their Kinetics in Ti-Al-Nb Alloys

1
Department Structure and Nano-/Micromechanics of Materials, Max-Planck-Institut für Eisenforschung GmbH, 40237 Düsseldorf, Germany
2
Institute of Materials Physics, Helmholtz-Zentrum Hereon, 21502 Geesthacht, Germany
*
Authors to whom correspondence should be addressed.
Metals 2021, 11(12), 1991; https://doi.org/10.3390/met11121991
Submission received: 18 October 2021 / Revised: 26 November 2021 / Accepted: 6 December 2021 / Published: 9 December 2021
(This article belongs to the Section Structural Integrity of Metals)

Abstract

:
The application of light-weight intermetallic materials to address the growing interest and necessity for reduction of CO2 emissions and environmental concerns has led to intensive research into TiAl-based alloy systems. However, the knowledge about phase relations and transformations is still very incomplete. Therefore, the results presented here from systematic thermal analyses of phase transformations in 12 ternary Ti-Al-Nb alloys and one binary Ti-Al measured with 4–5 different heating rates (0.8 to 10 °C/min) give insights in the kinetics of the second-order type reaction of ordered (βTi)o to disordered (βTi) as well as the three first-order type transformations from Ti3Al to (αTi), ωo (Ti4NbAl3) to (βTi)o, and O (Ti2NbAl) to (βTi)o. The sometimes-strong heating rate dependence of the transformation temperatures is found to vary systematically in dependence on the complexity of the transformations. The dependence on heating rate is nonlinear in all cases and can be well described by a model for solid-solid phase transformations reported in the literature, which allows the determination of the equilibrium transformation temperatures.

Graphical Abstract

1. Introduction

For future high-temperature structural applications, light-weight intermetallic materials based on TiAl alloy systems play an increasingly important role. These alloy systems have been investigated extensively in recent decades for their energy-saving and lightweight construction potential [1,2]. TiAl-base alloys have the advantage of lower densities compared to currently used Ni-based superalloys and possess good high-temperature properties such as specific strength, creep resistance, and oxidation and burn resistance for low-pressure turbine blades at application temperature of 700 to 850 °C [1,3]. Therefore, parts manufactured out of TiAl-based alloys have been introduced in aviation and car industries over the years [2,3,4]. To further improve their properties, it is essential to create a well-defined and stable microstructure at application temperature. Since the mechanical properties are controlled by the phases and microstructure present at application temperature, a lot of experimental and theoretical studies have been performed to determine the phases, phase transformations, resulting microstructure morphologies, and the influence of certain alloying elements on mechanical properties [4,5,6,7,8,9,10,11,12,13,14].
Most of the currently used alloys consist of the binary phases TiAl (tetragonal, tP4, P4/mmm) [15], Ti3Al (hexagonal, hP8, P63/mmc) [16], and (βTi) (cubic, cI2, Im-3m) [17]. The cubic (βTi) solid solution phase is disordered in the binary Ti-Al system, but B2-type ordering can occur by ternary alloying [18]. This ordered (βTi)o phase disorders on heating at a composition-dependent transition temperature [18,19]. The currently applied alloys are mainly based on the Ti-Al-Nb system. Therefore, the Ti-rich ternary Ti-Al-Nb phases ωo (Ti4NbAl3, hexagonal, hP6, P63/mmc) [20] and O (Ti2NbAl, orthorhombic, oC16, Cmcm) [21] are also of huge interest to better understand and further optimize alloys based on this system.
A particular complication in ternary Ti-Al-Nb alloys arises from the fact that the high-temperature microstructure and phase equilibria are significantly affected by the solid-solid decomposition of Ti3Al and the two ternary phases ωo and O. This is important especially for the two ternary phases ωo and O, which depending on composition both decompose on heating in the range of 700 °C to 950 °C, i.e., near to the range of desired application temperatures. For a targeted alloy development including also modelling-based approaches (e.g., CALPHAD modelling), it is, therefore, important to understand the solid-solid transformations and to know the true equilibrium phase transformation temperatures, which in turn is not possible without considering the kinetics of these transformations. However, this was never taken into account in former research, which mainly focused on the crystallographic transformation path [10,20,21,22,23].
The Ti-Al-Nb system is not only the system all commercially used alloys are based on, but it is also a perfect system to study the kinetics of different types of solid-solid phase transformations from the viewpoint of fundamental thermodynamics. In this system, classical order/disorder transformations such as the B2/A2 transition from the ordered (βTi)o to the disordered (βTi) phase take place, but there are also some significantly more complex solid-solid transformations, which involve the phases ωo, O, and Ti3Al.
Solid-solid transformations can behave very differently regarding their kinetics. On the one hand, there are transformations that proceed without any long-range diffusional processes such as, order/disorder reactions. On the other hand, there are transformations requiring diffusion because composition, crystal structure, and fraction of the involved phases are changing [24]. In case of the order/disorder reaction of (βTi) there is no change in composition and crystal lattice required. The only difference between ordered and disordered state is that the atoms of the different elements occupy specific lattice sites in the ordered state compared to their random occupation in the disordered variant. Therefore, no long-range diffusion is required for this transition. The transition temperature varies with composition and added alloying elements [18,19], but should be independent of heating or cooling rate.
Examples for the second type of transformations are reactions involving the two ternary phases ωo and O. Both phases were first found to form on cooling from the cubic (βTi) phase and result in a change of the crystal structure into either a hexagonal lattice (ωo phase) or an orthorhombic lattice (O phase) [20,21]. In addition, there is a change in composition requiring long-range diffusion. Stark et al. [25] could show via in situ high-energy X-ray diffraction (HEXRD) measurements that the formation of ωo consists of complex diffusion-controlled steps. Despite these extensive investigations on the various transformation paths and under which thermal conditions they form [6,10,22,25,26,27,28], there is not much known about the kinetics of these transformations. As long-range diffusional processes are needed, the observed transformation temperatures can be expected to depend on the heating or cooling rate meaning that values obtained from classical heating or cooling experiments will differ from the true equilibrium transformation temperatures.
In order to study the different kinds of solid-solid transformations, a series of ternary Ti-Al-Nb alloys was produced containing at least one of the phases (βTi)o, Ti3Al, ωo, or O. After heat-treatment and initial characterization by scanning electron microscopy (SEM) and HEXRD, the samples were investigated with various heating rates by differential thermal analysis (DTA) to determine and classify the kinetics of the mentioned phase transformations. The experimental procedures and results of this research are described and discussed in the following sections.

2. Materials and Methods

A series of Ti-Al-Nb alloys including one binary Ti-Al reference alloy were synthesized using an arc melting device with tiltable crucible. All compositions are listed in Table 1. The alloys were produced in an Ar inert gas atmosphere from high-purity elements Ti (99.995 wt.%), Al (99.999 wt.%) and Nb (99,9 wt.%) (HMW Hauner GmbH and Co. KG, Röttenbach, Germany). Several pieces were cut from the cylindrical alloy ingots and encapsulated in fused silica capsules backfilled with Ti-gettered Ar gas for heat treatments at 700 °C (1500 h), 800 °C (1000 h), 900 °C (650 h), and 1000 °C (400 h). For the DTA experiments, samples heat-treated at 700 °C were used (except for alloy A11 that was studied in the as-cast state, alloy A7, where the heat-treated state 1000 °C/400 h was used, and alloy A0, where the as-cast alloy was held at 1000 °C for 60 h in the DTA). In some cases, additional samples from heat treatments at 800, 900, and/or 1000 °C were measured to check the effect of different heat treatment states on the phase transformations.
The alloy compositions were determined by electron-probe micro-analysis (EPMA, JEOL JXA-8100, JEOL, Akishima, Japan). The impurity levels of O and N were checked by inert gas fusion (Fusion Master ONH, NCS Germany, Neuss, Germany) before and after heat treatment for a number of alloys yielding typical values of ~200 wt.ppm O and < 50 wt.ppm N. Metallographic cross sections of the heat-treated alloys were prepared afterwards to investigate the microstructure of these alloys by scanning electron microscopy (SEM, Zeiss Leo 1550 VP, Oberkochen, Germany).
Phases were identified by HEXRD at the High-Energy Materials Science (HEMS) beamline [29] at the synchrotron storage ring PETRA III, DESY, Hamburg, Germany, operated by Hereon. The samples with a thickness of ~10 mm were measured in transmission with a photon energy of 100 keV (λ = 0.0124 nm) and a beam size of 1 mm2. During the exposure time of 100 s, the samples were rotated by 20° or 180° to obtain a better grain statistics. Diffraction patterns were recorded with a 2D PerkinElmer (Waltham, MA, USA) flat panel detector XRD 1621. The data were integrated over 360° azimuthal angle using the program Fit2d [30].
To determine transition temperatures and investigate the kinetics of phase transformations, DTA was performed using a Netzsch DSC 404C Pegasus thermal analyzer (Selb, Germany). The device was calibrated with certified Al, Au, and Ni standards. Heating rates of 0.8, 1, 2, 5, and 10 °C/min were used for the measurements. The accuracy of the temperature measurements was regularly checked by melting Al (660 °C) and Au (1064 °C). The deviations were ≤1 °C in all cases, which is why an accuracy of ±1 °C is assumed for all temperature values reported in the following. Square-shaped samples with approximate dimensions of 3 × 3 × 2 mm were cut from the heat-treated alloys and cleaned with ethanol before the DTA experiments. The samples were placed into alumina crucibles and the measurements were performed in an Ar atmosphere.
The standard DTA experiment consisted of two heating and cooling cycles of heat-treated samples between room-temperature (RT) and 1300 °C. For low heating rates, the samples were first heated with 10 °C/min to a temperature about 40 °C below the expected reaction and only the temperature range including the transformation was measured with the low rate. For the transformation temperatures, only the values determined upon first heating were used. For the order/disorder transitions, the peak maximum marks the transition temperature. At this point, ordering is completely lost on heating and the signal returns to the baseline. Heating-rate-dependent transformations are associated with a change in enthalpy due to compositional and/or crystallographic changes. In this case, the onset temperature of the resulting peak on a DTA curve marks the starting of the transformation and was determined as extrapolated peak-onset temperature (for a definition, see, e.g., the recommendations given by the German society for thermal analysis GEFTA [31,32,33]).
To obtain the values of the equilibrium transformation temperature, the data were extrapolated to a heating rate of 0 °C/min. As the heating rate dependence is not linear, the model approach of Zhu et al. [34,35], which was specifically developed for sluggish solid-solid reactions, was used. The thermodynamic background and the application of this approach will be briefly explained in the results section.

3. Results

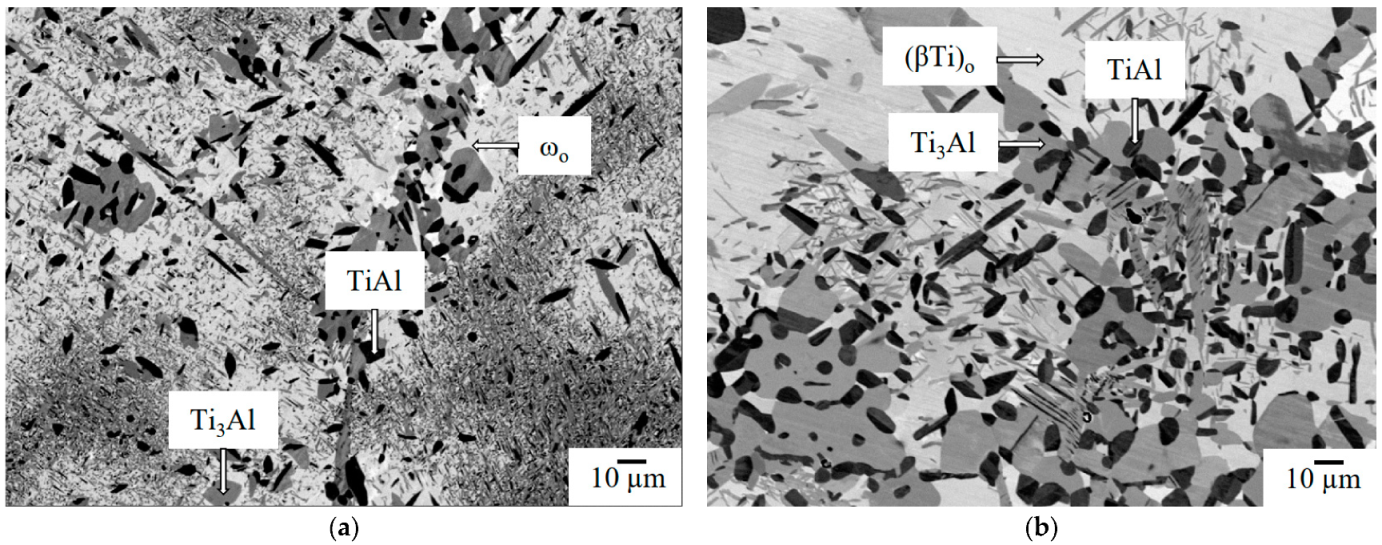
3.1. Alloy Characterisation

In case of order/disorder transitions such as the transformation from the B2-ordered solid solution (βTi)o to the disordered A2 variant (βTi), no transition-related changes in the microstructure are visible since phase fractions and compositions remain the same before and after the transition. However, in many solid-solid transformations a change in the microstructure is observed since these transformations require changes in phase fraction and composition which affect the microstructure. An example showing the transformation from the low-temperature ωo phase to (βTi)o is presented in Figure 1. On the left-hand side (Figure 1a), the microstructure of alloy Ti-36.4Al-9.7Nb (A4) (throughout the present article, alloy compositions are given in the form Ti-xAl-yNb with x and y in at.%) heat-treated at 900 °C for 650 h is shown with the ωo phase (composition: 34.3 at.% Al and 11.7 at.% Nb) as bright matrix phase and fine precipitates of Ti3Al (grey) and TiAl (dark). The microstructure on the right-hand side (Figure 1b) belongs to the transformed material after a heat treatment at 1000 °C. It also shows a bright matrix, which, however, now is the (βTi)o phase (composition: 35.8 at.% Al and 10.7 at.% Nb) with precipitates of Ti3Al (grey) and TiAl (dark) similar as at 900 °C. It is observed that the phase fractions (900 °C: 45 vol.% ωo; 1000 °C: 64 vol.% (βTi)o, values from HEXRD analysis) and morphology of the phases have changed significantly.
These observations agree with the HEXRD measurements, which are shown in Figure 2. Due to their common structural features, the strongest diffraction peaks of the ωo phase occur at nearly identical positions as for the (βTi)o phase. However, as can be seen from the 900 °C diffraction pattern, there are several smaller peaks such as the (100), (004), and (114) reflections, which are characteristic for the ωo phase and which are no longer present at 1000 °C. Instead, the (100) superstructure peak of the ordered (βTi)o phase occurs at 1000 °C. All other diffraction peaks can be assigned to Ti3Al and TiAl at both temperatures as indicated in Figure 2.
For the transformation of the O phase to (βTi)o, similar observations can be made regarding the microstructure. In alloy Ti-25.2Al-13.9Nb (A7) at 900 °C, the microstructure is composed of O phase (light-grey), Ti3Al (dark grey) and the bright (βTi)o phase (Figure 3a). At 1000 °C, the O phase has completely transformed resulting in a two-phase (βTi)o + Ti3Al microstructure (Figure 3b).
This observed change in microstructure is confirmed by HEXRD results (Figure 4). As can be seen in the 900 °C diffraction pattern, there are characteristic double peaks of the O phase, i.e., (110)/(020), (111)/(021), (200)/(120). These peaks are no longer visible at 1000 °C, which indicates that the O phase has fully decomposed into (βTi)o. This is supported by the fact that the phase fraction of Ti3Al only increases slightly from 30 vol.% to 38 vol%, whereas the amount of (βTi)o drastically increases from 4 vol.% at 900 °C to 62 vol.% at 1000 °C. Apart from that, the weak (100) and (111) superstructure reflections, which are characteristic of the ordered cubic (βTi)o phase, are clearly visible (Figure 4).

3.2. Thermal Analysis of Phase Transformations

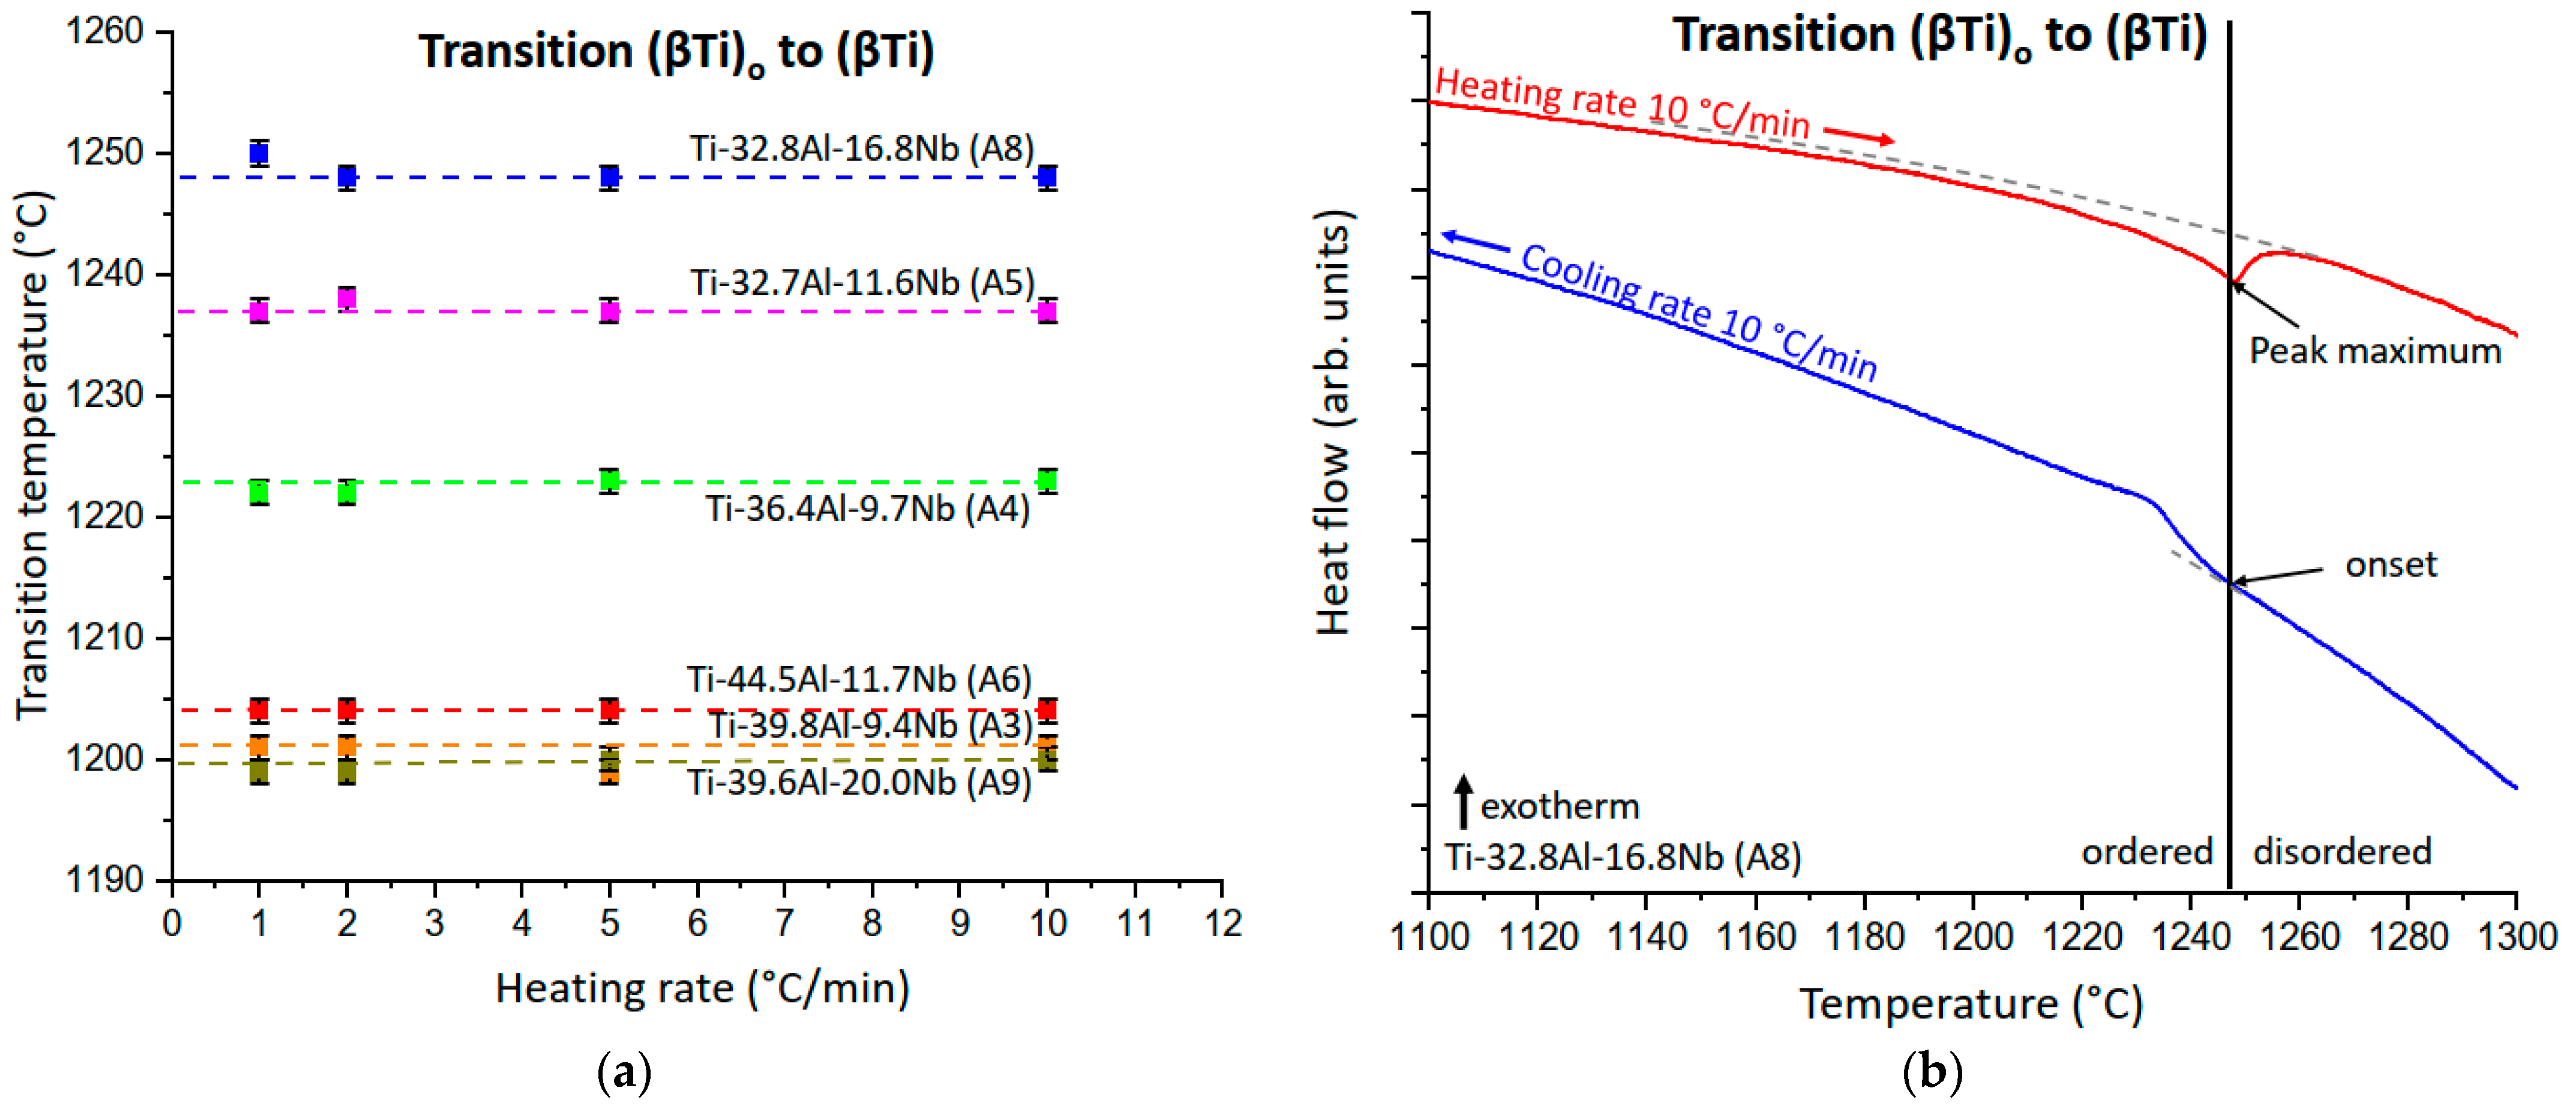
3.2.1. The (βTi)o to (βTi) Order/Disorder Transition

Except for alloys A0–A2, all alloys listed in Table 1 contain the ordered (βTi)o phase, which disorders at high temperatures. DTA measurements were performed with all these alloys with at least 4 different heating rates. For each heating rate, a new sample was used. As can be seen from Figure 5a, the temperature of the order/disorder transition (βTi)o to (βTi) shows no heating rate dependence. In nearly all cases, the deviation from the average value does not exceed 1 °C (only exceptions are the 1 °C/min measurement of Ti-32.8Al-16.8Nb (A8) and 5 °C/min measurement of Ti-39.8Al-9.4Nb (A3) showing a deviation of 2 °C).
The possible influence of different preceding heat treatments of the samples was also tested. Table 2 shows the disordering temperatures of samples of the alloys Ti-36.8Al-9.7Nb (A4) and Ti-44.5Al-11.7Nb (A6), which had been heat-treated at 700, 900, and 1000 °C before the DTA experiments. Obviously, there is no effect on the measured order/disorder temperature of (βTi)o. Moreover, comparisons were made of the reaction temperature on heating and cooling. As Figure 5b shows, the order/disorder temperature of alloy Ti-32.8Al-16.8Nb (A8) on heating coincides with the onset temperature of ordering on cooling. The same is true for all other alloys showing the order/disorder transition. The equilibrium disordering temperatures of all investigated alloys are summarized in Table 3.

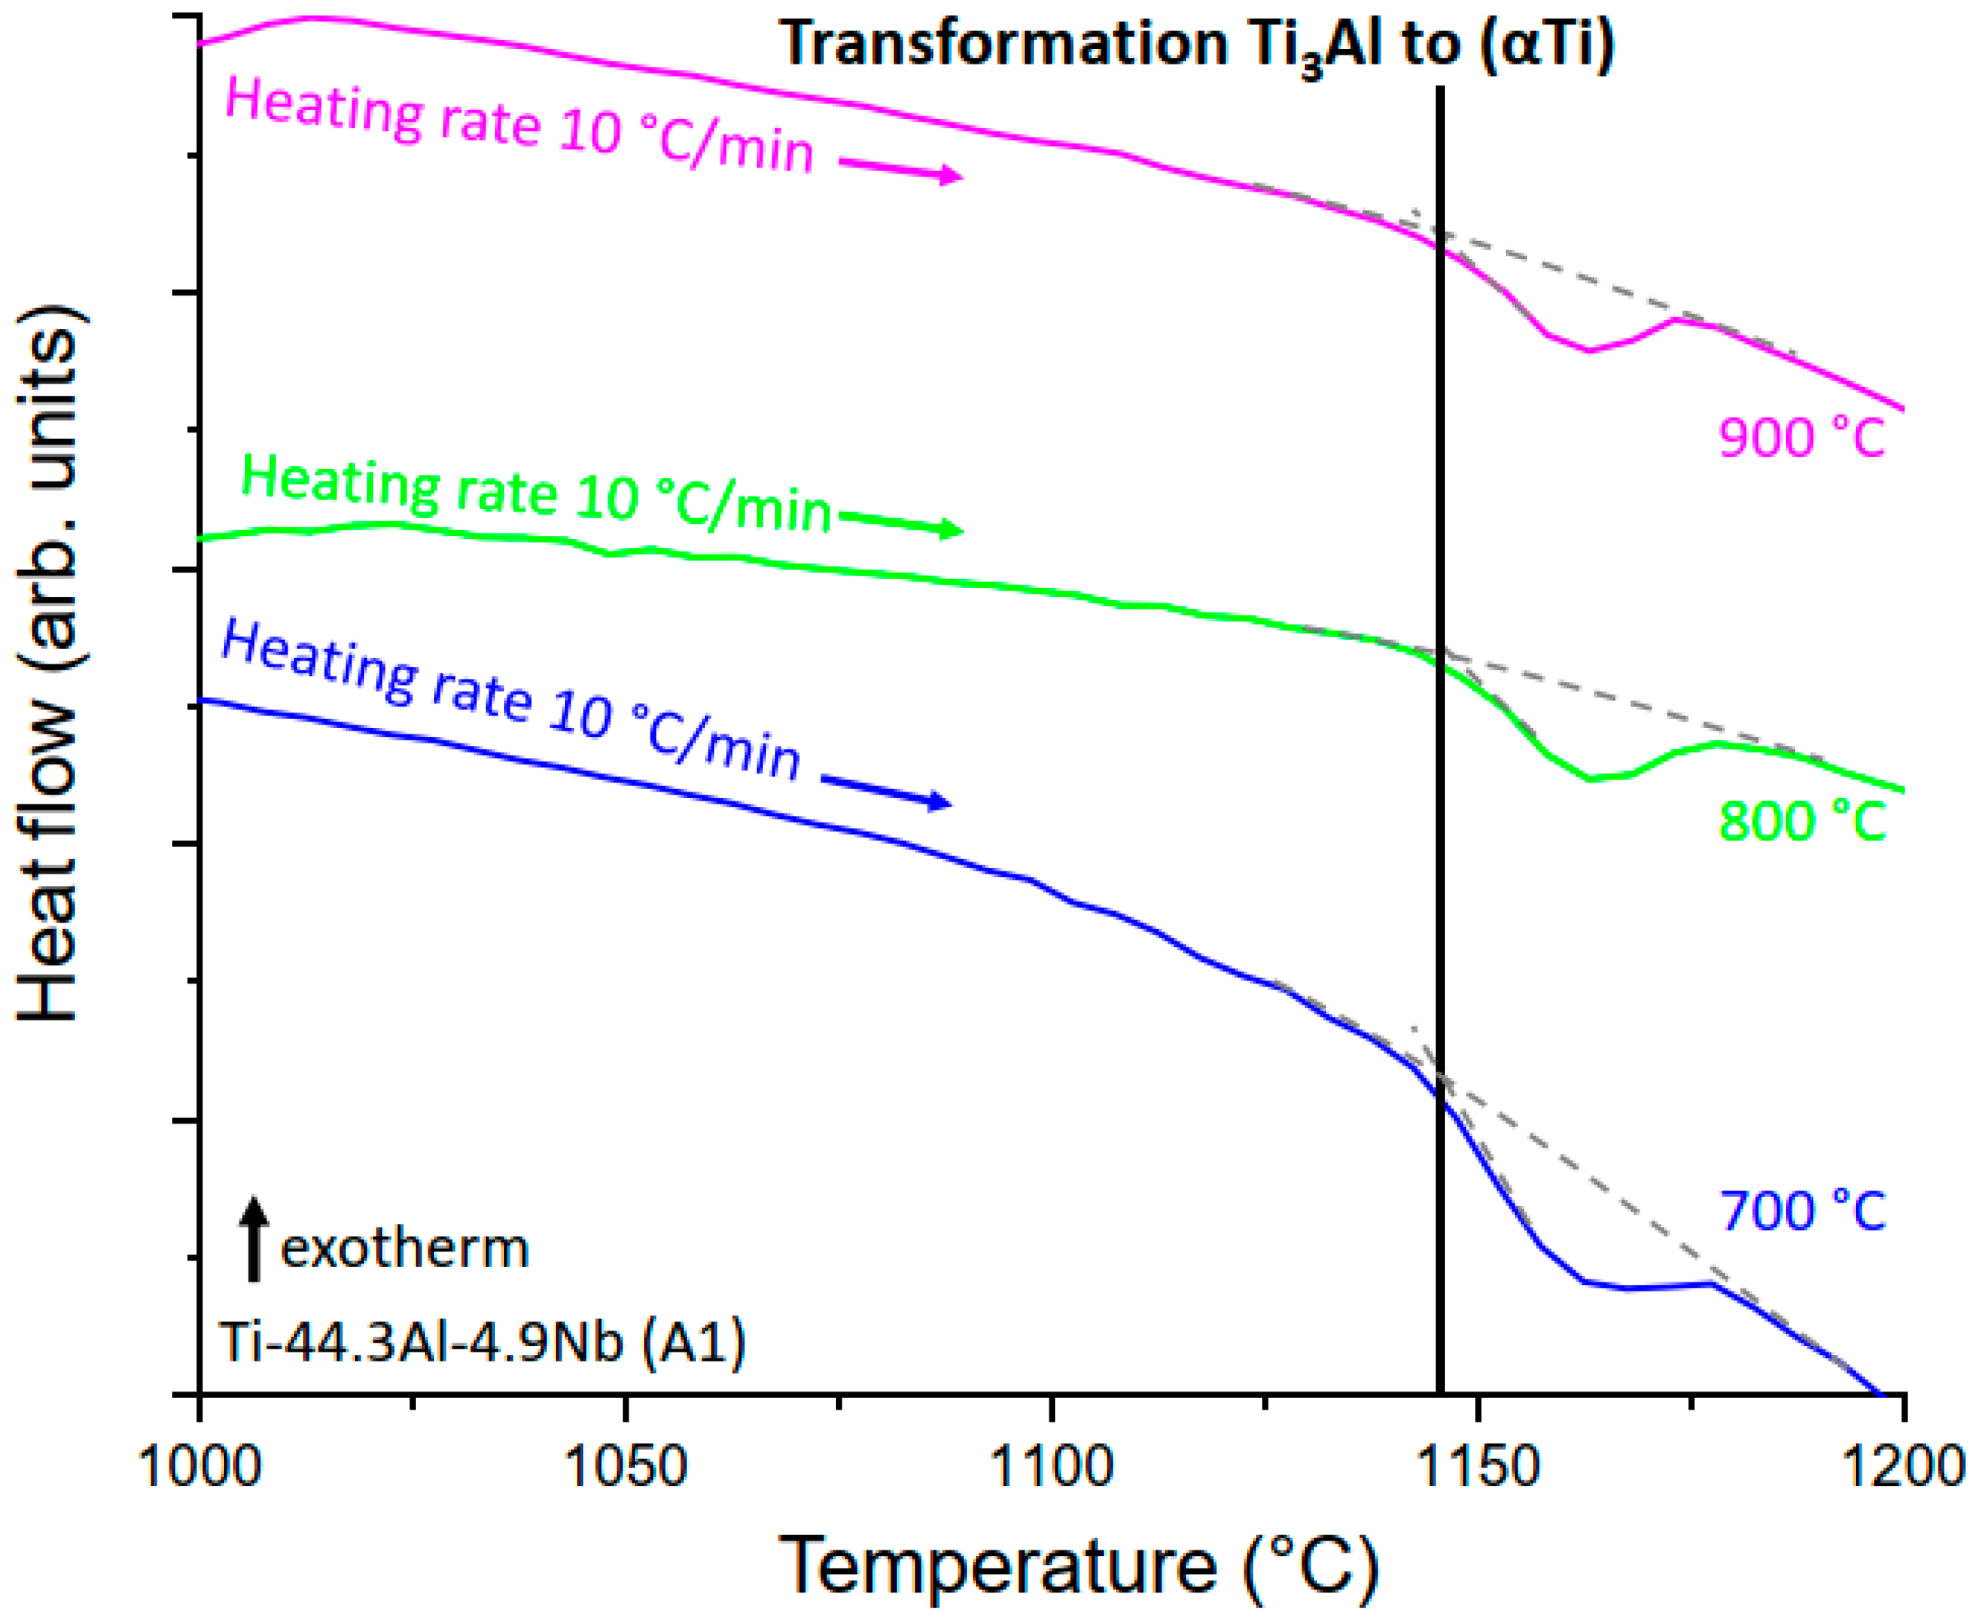
3.2.2. The Ti3Al to (αTi) Transformation

In the binary Ti-Al system, the hexagonal, D019-ordered Ti3Al phase transforms on heating into the simple hexagonal, disordered (αTi) phase. However, this transformation differs from the disordering transition of the (βTi)o phase in the ternary system as it involves a slight change in composition, i.e., in the binary phase diagram there is a small two-phase field Ti3Al + (αTi) and a eutectoid reaction involving additionally the TiAl phase [36]. Due to the small changes in composition and phase fractions, a weak heating rate dependence for this transformation is observed for alloy A0 (Table 4). This decomposition reaction of Ti3Al also occurs in the ternary system, but there is only limited information about the effect of the Nb additions on this phase transformation and its kinetics in literature. Three of the present alloys, Ti-44.3Al-4.9Nb (A1), Ti-45.8Al-5.2Nb (A2), and Ti-39.8Al-9.4Nb (A3) show the Ti3Al to (αTi) transformation. From the DTA results in Table 4 it can be seen that indeed there seems to be a weak trend to increased transformation temperatures with higher heating rates in both the binary and ternary alloys.
For diffusion-controlled solid-solid transformations showing a nonlinear heating rate dependence, Zhu et al. [34,35] developed a model to determine equilibrium transformation temperatures from continuous heating or cooling DTA experiments. Assuming that the formation of the new phase is initiated by heterogeneous nucleation at the grain boundaries, they derived a simplified expression for the incubation time of nucleation. For the non-isothermal situation of constant heating/cooling DTA experiments, the ‘concept of additivity’ described by Christian [37] is applied following a similar approach as is used for the calculation of continuous-cooling-transformation diagrams from time-temperature-transformation diagrams. The resulting integral can be solved by some approximations such as not too high heating/cooling rates (maximum in the range 10–20 °C/min) and not too high differences between equilibrium and measured transition temperatures. The final equation as derived by Zhu et al. [35] is of the form Tm = Tequ. + cS1/3, where Tm is the measured transition temperature, Tequ. is the equilibrium transition temperature, c is a temperature-independent constant, and S is the heating rate. Therefore, the equilibrium transition temperatures can be obtained by plotting the measured transition temperatures as a function of S1/3 and extrapolating these values to a rate of 0 °C/min. This simple approach is used in the present study to determine the equilibrium transition temperatures for all heating rate dependent phase transitions. For the transformation of Ti3Al to (αTi), all equilibrium transition temperatures are summarized in Table 4.
Similar as in case of the order/disorder transition of (βTi)o, the effect of preceding heat treatments at different temperatures on the transition temperatures was tested. Again, the results show that the onset temperature of the Ti3Al decomposition remains unaffected, see Figure 6.

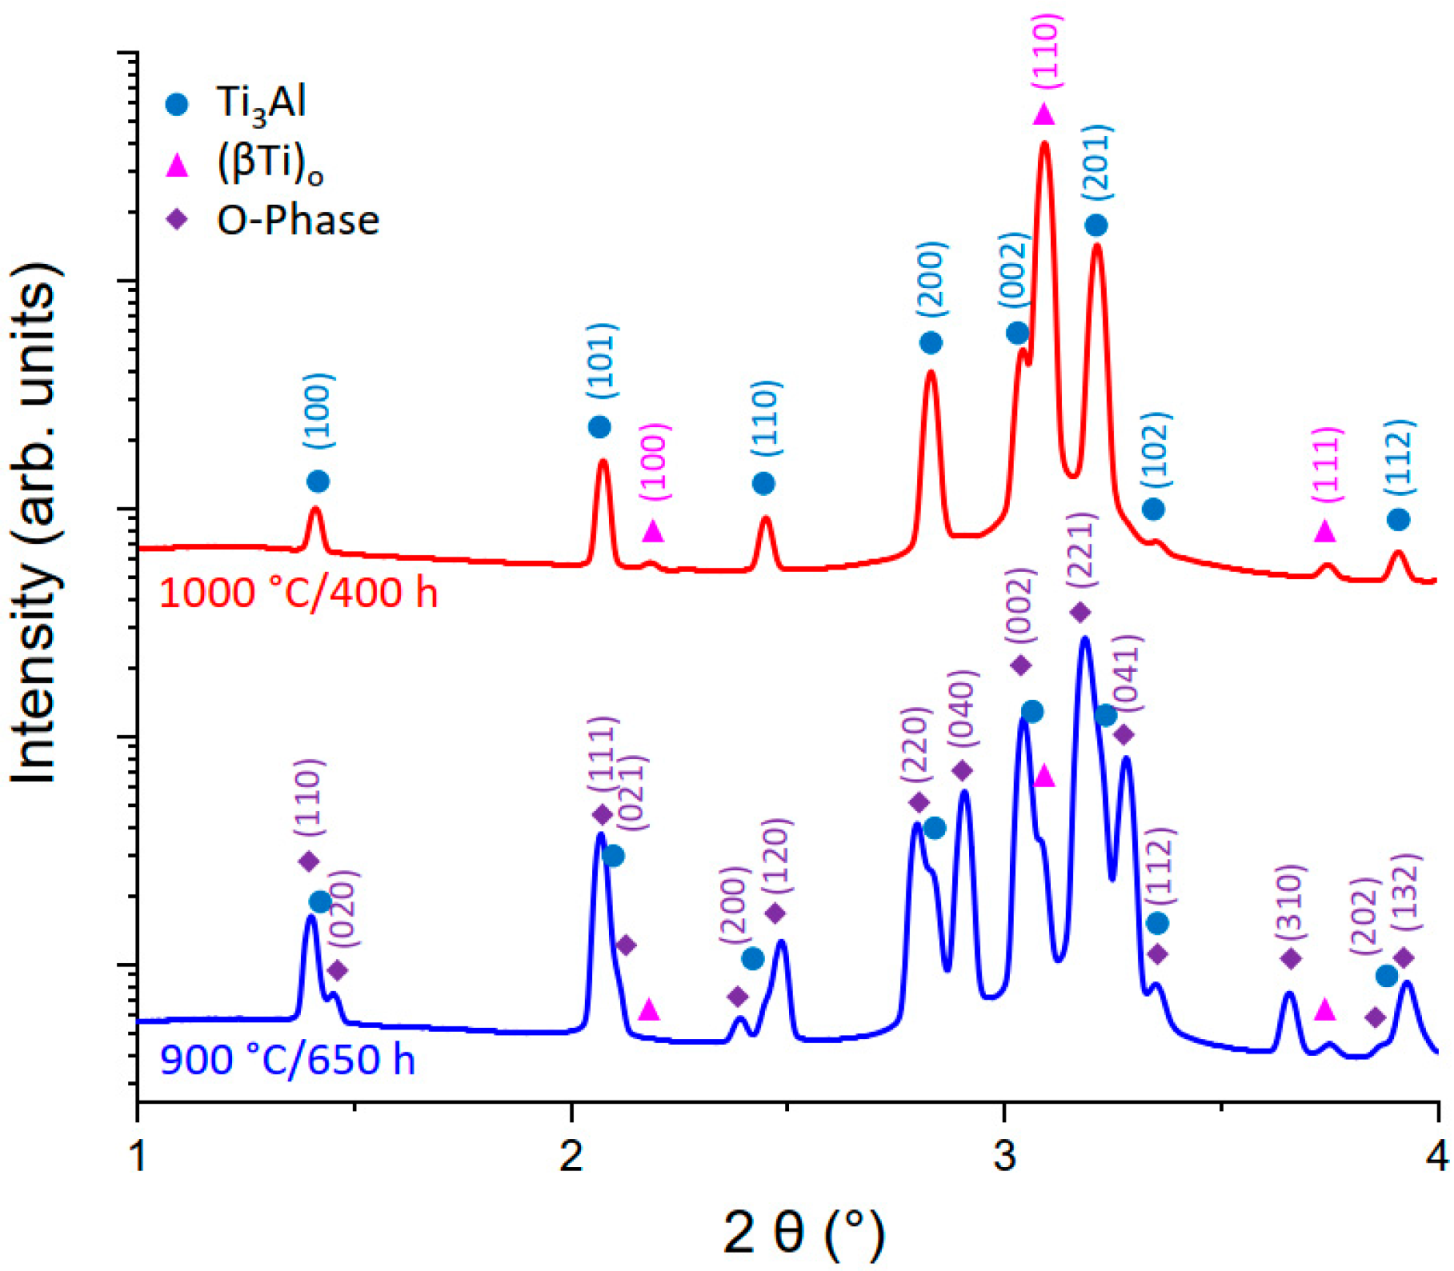
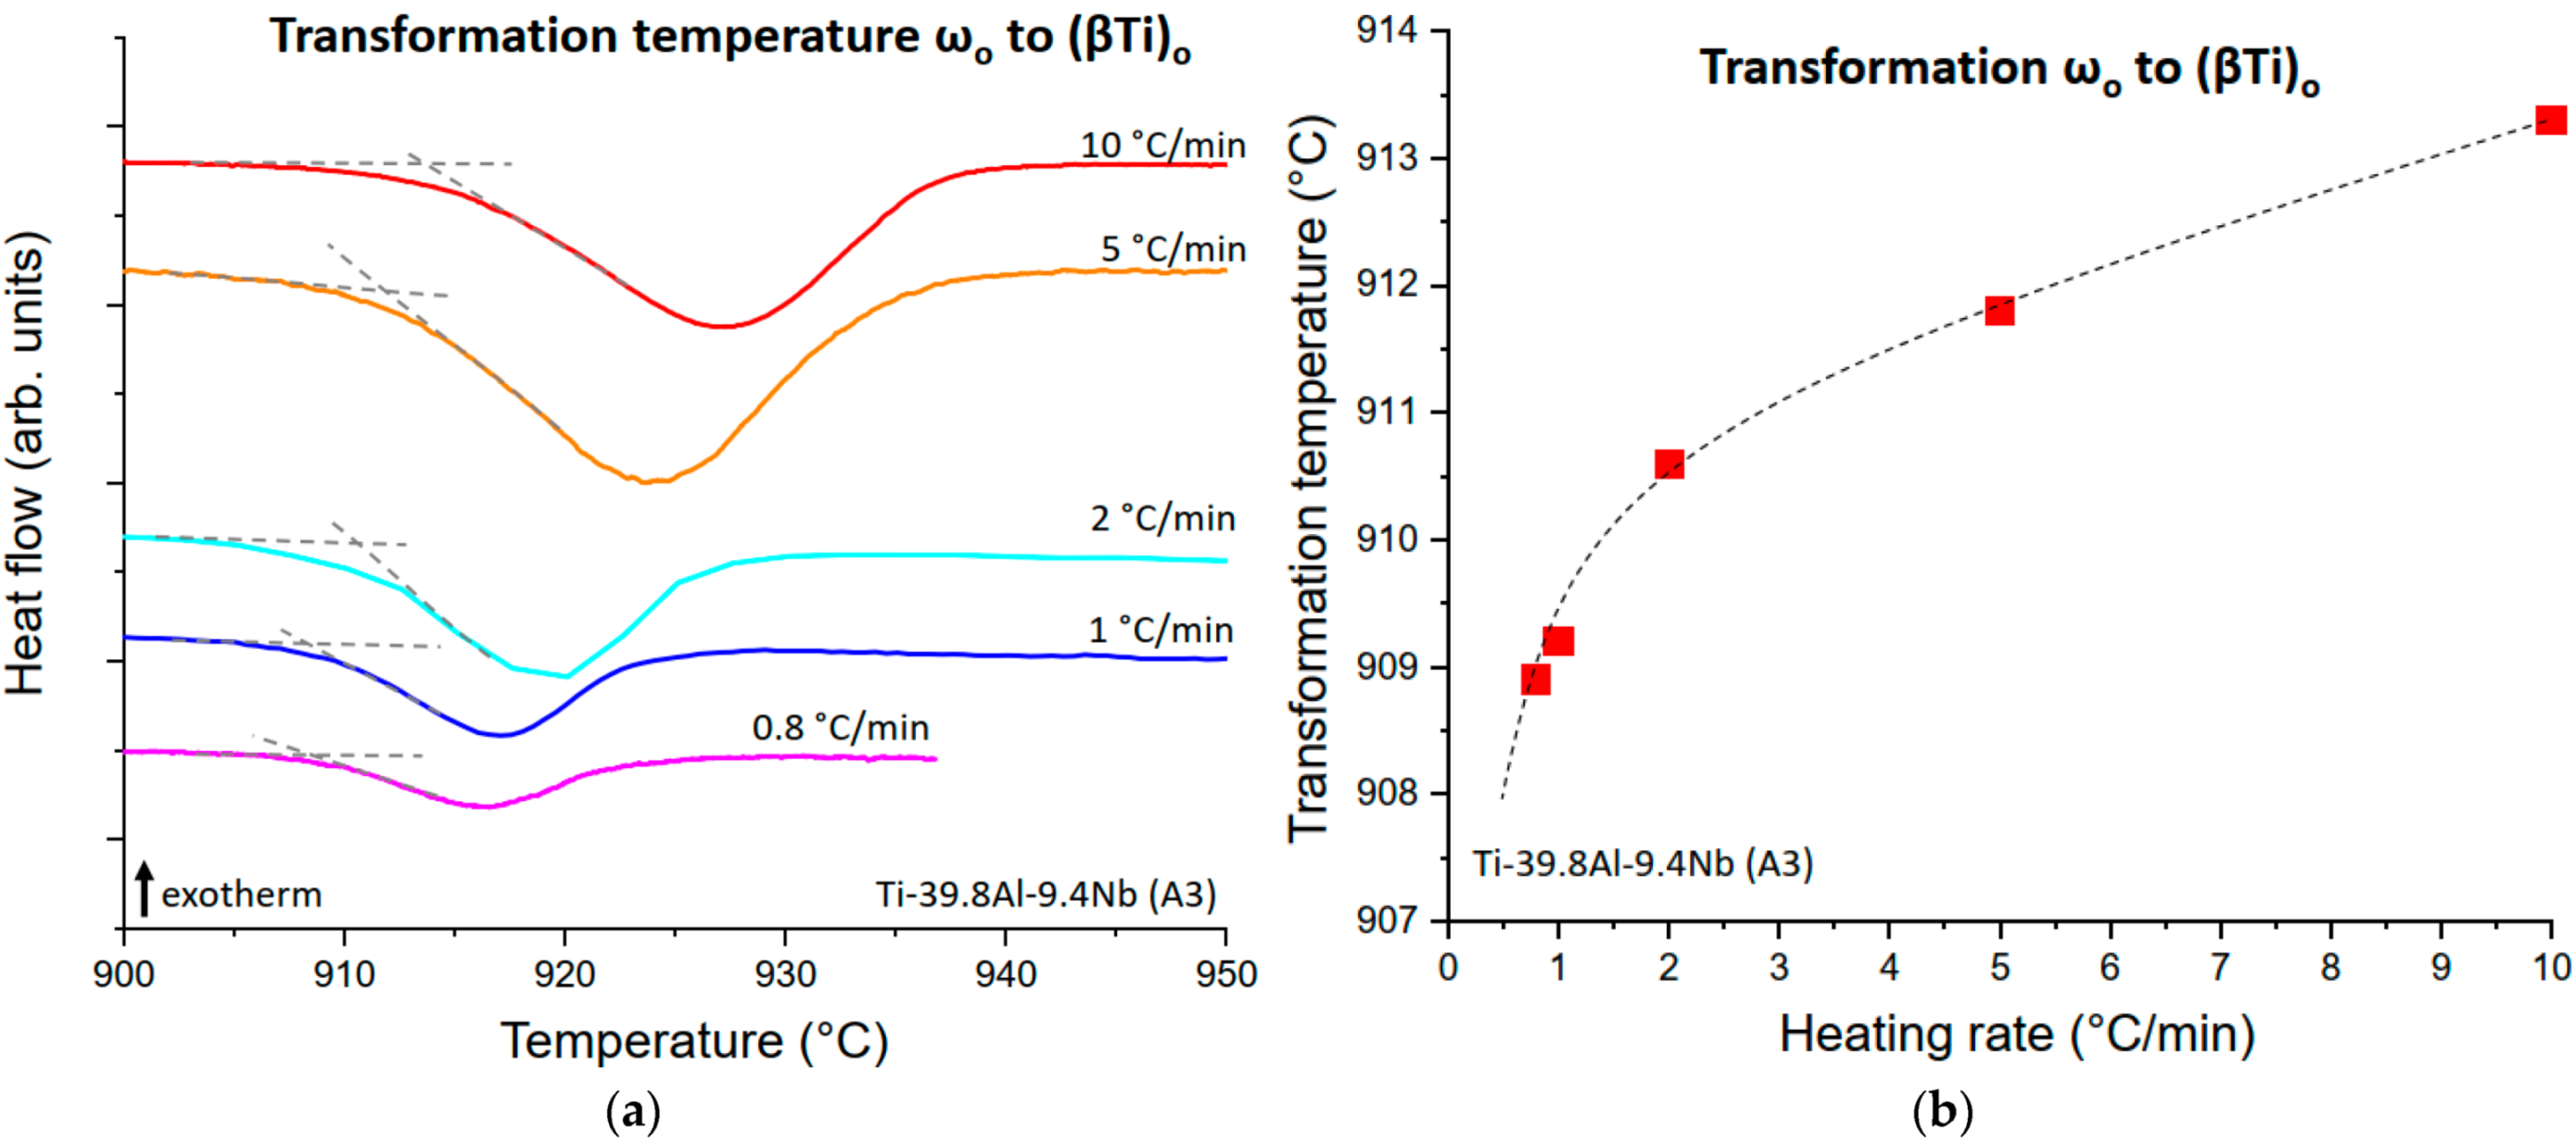
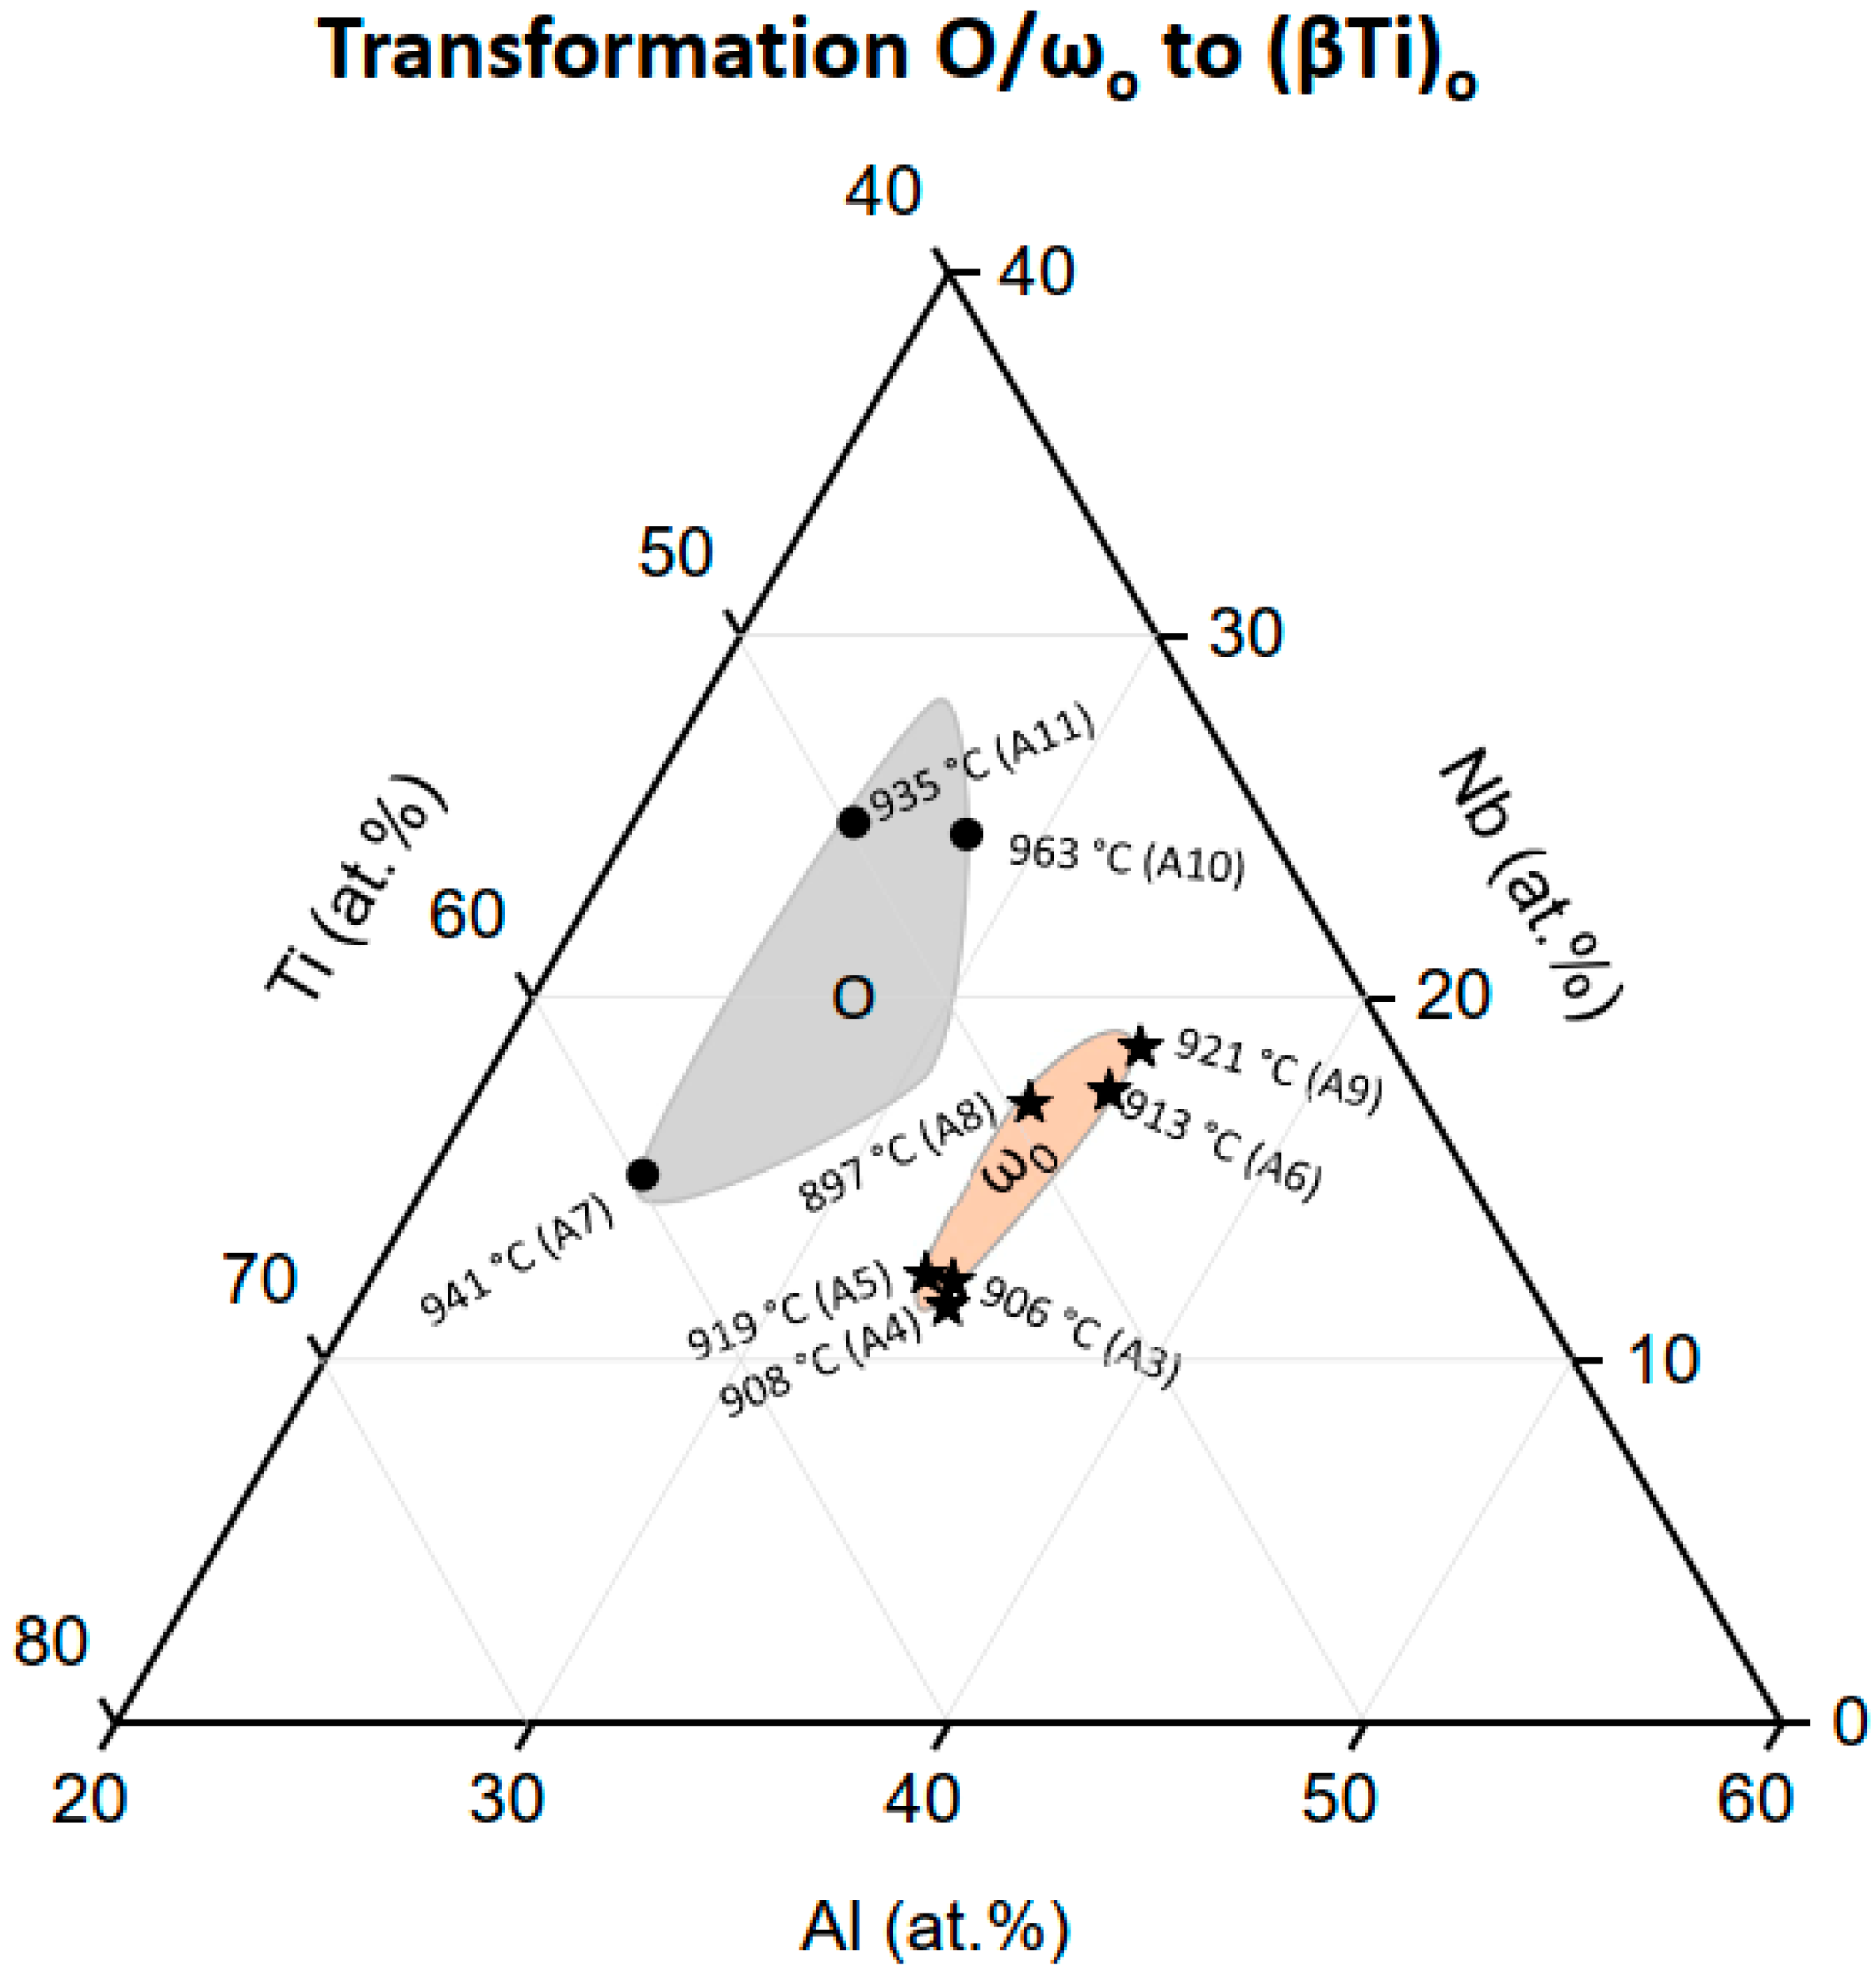
3.2.3. The ωo and O Phase Decomposition Reactions

In contrast to the above described transformation, the solid-solid transition from ωo phase to (βTi)o shows a more pronounced heating rate dependence. As an example, the transformation peak measured with alloy Ti-39.8Al-9.4Nb (A3) is presented in Figure 7a showing a nonlinear, continuous increase of the onset temperature with increasing heating rate (Figure 7b).
Applying the above described model of Zhu et al. [34,35] results in a plot as shown in Figure 8. The data can be well fitted by a linear function allowing the determination of the equilibrium transition temperature for extrapolation to zero heating rate. The same holds true for all alloys showing this transition. The resulting equilibrium transition temperatures are listed in Table 5.
The data for alloys A8 and A5 shows some scatter (Figure 8). This can be explained by the additional presence of a small fraction (<10 vol.%) of O phase in these alloys, which transforms to (βTi)o in the same temperature range. Even though the phase fraction is small, the O phase transformation results in a weak signal which overlaps with the ωo phase transformation peak resulting in some uncertainty in the determination of the onset point.
For the transformation of the O phase to (βTi)o, which was observed in three ternary alloys, there is also a clear heating rate dependence. The measured transformation temperatures for the alloys Ti-25.2Al-13.9Nb (A1), Ti-30.7Al-23.9Nb (A10) and Ti-24.1Al-25.2Nb (A11) are listed in Table 6. Once more by using the approach of Zhu et al. [34,35], the equilibrium transformation temperatures were determined (last row in Table 6).

4. Discussion

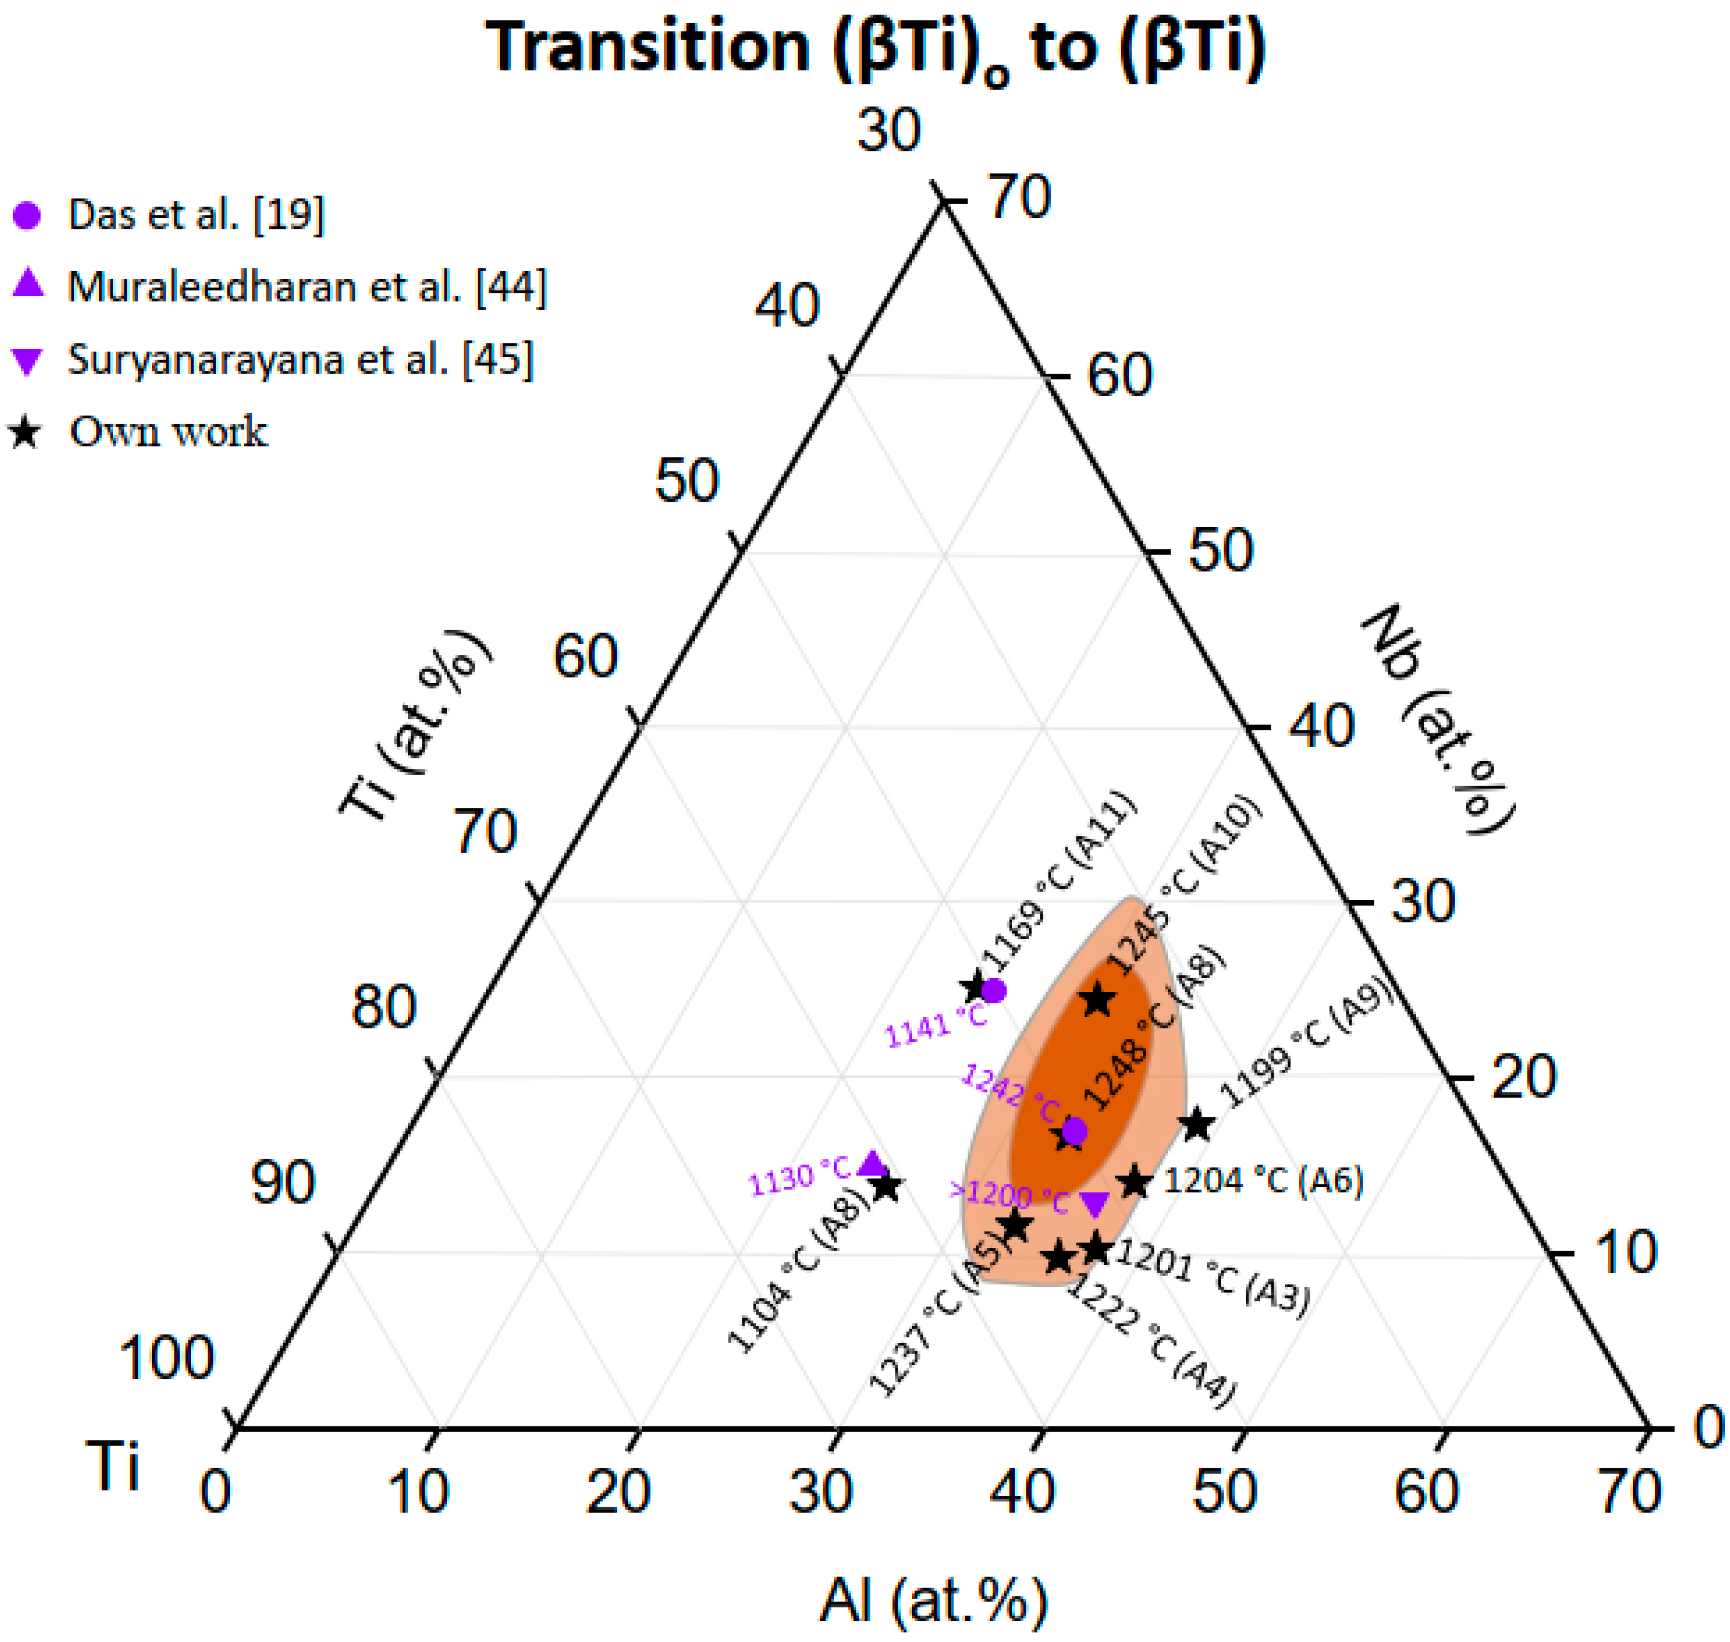
4.1. The Heating Rate Independent Transition (βTi)o to (βTi)

As can be seen from Figure 5a, the disordering temperature of (βTi)o to (βTi) is independent of the heating rate. In addition, the slope change of the DTA heat flow curve before the transition is very shallow (Figure 5b). This means that there is no sudden onset of disorder. Instead, the ordered structure disorders continuously over a wide temperature range and the process is finished at the peak maximum of the heat flow curve during heating, which corresponds to the order/disorder transition temperature. Such a transition is a typical example for a second-order type transformation [24]. An additional observation supporting this classification is the fact that during cooling the ordering process starts at the same temperature at which the disordering process finishes during heating (Figure 5b). The same characteristics were observed in literature for example by Das et al. [19] who investigated two ternary Ti-Al-Nb alloys using DTA as well as by Malinov et al. [38] in quaternary Ti-Al-Nb-Cr alloys. These observations can be explained by the fact that the B2-ordered (βTi)o and A2-disordered (βTi) both have a cubic body-centered crystal lattice and the only difference is that in the case of the disordered (βTi), the lattice sites are statistically occupied by the different types of atoms. In the low-temperature, ordered (βTi)o state, the degree of ordering continuously decreases with increasing temperature due to thermally induced jumps of atoms to other crystal lattice sites resulting in a shallow slope change in the heat flow curve until there is no ordered (βTi)o left at the transition temperature.
A plot of the compositions of (βTi)o and the respective disordering temperatures determined from alloys A3–A11 (Table 3) into a partial Gibbs-triangle (Figure 9) indicates that there is a stability maximum of the (βTi)o phase in the range marked in the figure. The dark colored area in Figure 9 shows a tentative region where the disordering temperature lies above 1240 °C. The maximum is located within a composition range of 30–35 at.% Al, 15–25 at.% Nb, and 45–55 at.% Ti. This is different from other TiAl-based systems with β-stabilizing ternary elements such as the Ti-Al-Mo system. In this case, literature results from Böhm et al. [39], Hamajima et al. [40], and Das et al. [19] also indicate the existence of such a stability maximum, which however is suggested to lie at a stoichiometric composition Ti2AlMo. Assuming an ideal Ti content of 50 at.% for the present case of the Ti-Al-Nb system, the composition range of the maximum stability temperature can be roughly described by the formula Ti2Al1+xNb1-x (0 < x ≤ 0.4). To investigate the site occupancy in the ordered B2 phase, Banerjee et al. [41] investigated an alloy with the composition Ti-25.6Al-10.1Nb. Their experimental findings together with the results from Leonard et al. [42], who found a strong site preference of Ti and Al atoms in a Ti-25Al-25Nb alloy, lead to the conclusion that in the ideally ordered case the atom types on the two independent lattice sites 1a and 1b of the B2 structure tend to be strictly separated with the Ti atoms occupying preferentially the 1a site and Al + Nb atoms sharing the 1b site. This is supported by density functional theory (DFT) calculations of Holec et al. [43] for (βTi)o indicating that Nb prefers to substitute Al. Therefore, one might indeed expect the most stable composition on the section Ti2Al1+xNb1-x.
Our experimental observations are also supported by Das et al. [19] who investigated two alloys (Ti-25Al-25Nb and Ti-33Al-17Nb) with DTA finding disordering temperatures of 1141 °C and ~1242 °C, respectively. The compositions of these alloys are close to alloys A11 (1169 °C) and A8 (1248 °C). The small differences in disordering temperatures can be explained by the fact that Das et al. [19] only gave the intended composition of the alloys and has not measured the actual composition. From TEM investigations of alloys with nominal compositions of Ti-25Al-25Nb and Ti-12.5Al-37.5Nb, Bendersky et al. [28] concluded that the alloy with 25 at.% Nb has the stronger tendency to form B2-ordered (βTi). This translates into a decrease of disordering temperature with increasing the Nb content above 25 at.% along the section TiAl-TiNb. The same trend is observed in ab initio total energy calculations of Asta et al. [46] using the cluster variation method (CVM). However, as they do their calculations for a purely bcc-based system neglecting the stability of the hexagonal (αTi) and Ti3Al as well as the tetragonal TiAl phases, they obtain the highest order/disorder temperature for a hypothetical, binary bcc-TiAl. Actually the present experimental results reveal that along this section the order/disorder temperatures first increase with Nb content (1204 °C for alloy A6 with 12 at.% Nb, 1248 °C for alloy A8 with 17 at.% Nb) and then decrease again (1169 °C for alloy A11 with 25 at.% Nb).
For a constant Al content of 25 at.%, i.e., along a section starting from Ti3Al in the direction of Nb3Al, the experimentally observed disordering temperatures for alloys A7 (Ti-25.2Al-13.9Nb, 1104 °C) and A11 (Ti-24.1Al-25.2Nb, 1169 °C) show an increase of the stability of the ordered phase by replacing Ti by Nb (Figure 9). The same observations were made by Kestner-Weykamp et al. [47] in alloys with up to 30 at.% Nb. Additionally, Muraleedharan et al. [44] found a disordering temperature of 1130 °C for a nominal composition of Ti-24Al-15Nb which is in line with our experimental results. Moreover, Asta et al. [46] found the same trend indicating a maximum of the disordering temperature along this section at 25 at.% Nb in their calculations for a purely bcc-based system.
The highest transition temperature which was measured in the present investigation was for alloy A8 (Ti-32.8Al-16.8Nb, 1248 °C). Results of Suryanarayana et al. [45], who found for two alloys of nearby composition (Ti-36Al-13Nb and Ti-33Al-17Nb) to contain B2-ordered (βTi) at 1200 °C, confirm a high disordering temperature in this composition range. From Figure 9 it is clear that the maximum disordering temperature should lie within the dark colored composition area of 30–35 at.% Al, 15–25 at.% Nb, and 45–55 at.% Ti. This is also observed in the CALPHAD modelling of Cupid et al. [48] and Witusiewicz et al. [49], where calculations indicate that the (βTi)o phase is stable in the mentioned composition range even up to 1300 °C and 1400 °C, respectively. The extremely high maximum temperature obtained in the modelling work of Witusiewicz et al. [49] is based on some indirect observations from Bendersky et al. [20]. From the absence of anti-phase boundaries (APBs) in the (βTi)o phase of an alloy cooled from 1400 °C, they concluded that the sample must have been B2-ordered at 1400 °C (as rapid cooling from a disordered to an ordered state usually leads to formation of APBs) [20]. However, since cooling of the samples was performed in the furnace with an estimated cooling rate of 400 °C/min [20], there is the possibility that APBs indeed have formed but have been annealed out already during further cooling, i.e., it is well possible that (βTi) was not ordered at 1400 °C. There is not any direct measurement of such high transition temperatures mentioned in the literature. The present results and all other experimental work reported in the literature, where the transition temperature was directly measured, clearly suggest that the maximum temperature is much lower and will be in the range of 1250 °C.

4.2. Heating Rate Dependent Transformations

4.2.1. The Ti3Al to (αTi) Transformation

In Ti-Al alloys with 38.5–46.5 at.% Al, the transformation from Ti3Al to (αTi) takes place by an invariant (eutectoid) reaction involving a change in composition, i.e., requiring long-range diffusional processes. In the binary Ti-Al system, this compositional change is only very small (about 0.5 at.% Al [36]). In addition, both Ti3Al and (αTi) possess a hexagonal crystal lattice and the Ti3Al crystal structure can be regarded as an ordered superstructure of disordered (αTi) (for this reason Ti3Al is often called α2 phase). Therefore, even though some long-range diffusional processes are involved, this solid-solid transformation can be expected to proceed comparably easily and its onset temperature in heating experiments should only reveal a weak heating rate dependence. This weak heating rate dependence is confirmed by the results for the binary alloy A0, see Table 4 The results for the equilibrium transformation temperature are determined with the approach of Zhu et al. [34,35] and are also summarized in Table 4.
In the binary phase diagram assessed by Schuster et al. [36], a value of 1120 ± 10 °C is chosen for the eutectoid reaction based on the DTA measurements of Jones et al. [50], who determined the transformation for three different binary Ti-Al alloys (Ti-40Al/Ti-42Al/Ti-45Al). However, our results for alloy A0 suggest a slightly higher transformation temperature of 1137°C. The reported literature values for the transformation temperature from Ti3Al to (αTi) vary significantly. For an alloy Ti-45Al, Appel et al. [51] found a transformation temperature of ~1130 °C, whereas Chladil et al. [52] determined 1122 °C by DTA. Kononikhina et al. [18] determined the transformation temperature using in situ neutron diffraction and obtained values between 1150 and 1160 °C. Witusiewicz et al. [49] reported the transformation temperature to be 1108 °C in an alloy with 44 at.% Al. Recently, Xu et al. [53] measured the transformation temperature in Ti-42.5Al (onset: 1150 °C) and Ti-44Al (onset: 1146 °C) for a heating rate of 10 °C/min. The reason for the significant scattering of the reported values is not obvious. As found in the present investigations, the effect of the heating rate on the measured value is comparably weak (the difference between the value obtained with a heating rate of 10 °C/min and the equilibrium transformation temperature is only 3 °C for the binary alloy A0 (Ti-42.9Al), see Table 4). It is reported in the literature that interstitial elements such as O and C can significantly affect the eutectoid transformation temperature of Ti3Al to (αTi) [54,55]. The O content of alloy A0 is only 110 wt.ppm. Therefore, we consider the transformation temperature value found here to be representative.
A similar, weak heating rate dependence as for the binary alloy is also observed for the ternary alloys A1-A3 (Table 4), which experience the same first-order transformation (some typical DTA curves are shown in Figure 6) from the ordered Ti3Al phase to disordered (αTi). Similar to the binary alloy, both ternary alloys A1 and A2 are two-phase Ti3Al + TiAl and transform to (αTi) + TiAl on heating. The same transformation occurs in alloy A3, which in addition contains the ordered (βTi)o phase. As the heating rate dependence in all cases is weak and similar to that of the binary alloy, it can be assumed that the change in composition between the low-temperature Ti3Al and high-temperature (αTi) phase again is small. This indeed is confirmed by EPMA analysis of the phase compositions showing a difference of the Al content of about 2 at.% between the Ti3Al phase (measured at 1100 °C) and (αTi) (measured at 1200 °C) while the Nb content remains about constant.
From the transformation temperatures of alloys A0-A3 (Table 4), it is also observed that the transformation temperature increases with increasing Nb content indicating that Nb additions stabilize Ti3Al to higher temperatures. This observation is supported by results of Chladil et al. [52], who observed a similar increase in transformation temperature in alloys with 45 at.% Al and 5, 7.5, and 10 at.% Nb. The same trend is also observed when comparing experiments from different authors who investigated alloys with the same Al content but different amounts of Nb [49,52,54,56,57,58]. All these observations classify this reaction as first-order type reaction.

4.2.2. The ωo to (βTi)o Transformation

A significantly stronger heating rate dependence is observed for the transformation from ωo to (βTi)o as can be seen by the heating rate dependent shift of the DTA peak in Figure 7a. The fact that an onset temperature can be determined and the transformation is heating rate dependent classifies this reaction as first-order type. The nonlinear heating rate dependence (see Figure 7b) can be fitted perfectly by applying the approach of Zhu et al. [34,35] as described above in the ‘Results’ section. A possible explanation for the stronger heating rate dependence (compared to the Ti3Al to (αTi) transformation) could be the fact that the crystal lattice needs to change from a hexagonal (ωo phase) to a cubic (βTi)o structure (whereas both Ti3Al and (αTi) possess a hexagonal lattice). Apart from the crystallographic rearrangements, a change in composition and phase fraction as described in Section 3.1 (Alloy characterization) occurs during the transformation. These two factors might be responsible for the increased heating rate dependence compared to the transformation Ti3Al to (αTi).
Figure 10 shows the chemical compositions of the ωo phases (measured with EPMA) together with the respective equilibrium transformation temperatures plotted into a partial Gibbs-triangle. The indicated phase field of the ωo phase is for a temperature of 900 °C [59] and serves as a guide for the eye. The obtained equilibrium transformation temperatures vary only slightly lying in a temperature range of about 900–920 °C.
In literature, there is only limited and scattered information for the transformation temperatures. Most of the literature concerning ωo deals with the transformation mechanism and possible transformation paths as well as microstructure evolution after certain thermal and thermomechanical heat treatments. Sadi et al. [60,61], who used in situ neutron diffraction to investigate the dissolution of ωo in a Ti-35.6Al-12.9Nb alloy, reported dissolution to take place at about 800 °C, which agrees with the observations made in their heat-treated samples. Compared to alloy A4 (908 °C), which has a comparable Al content but 3 at.% less of Nb, the equilibrium transformation temperature appears to be quite low. By considering the fact that Nb is suspected to stabilize ωo [62,63], this large difference between the transformation temperatures is surprising. In a recent DTA investigation of alloys with 8 at.% Nb, Xu et al. [53] determined the transformation temperature from ωo to (βTi)o for Al contents between 32 and 43 at.% Al to lie around 850 °C. When compared to alloy Ti-39.8Al-9.4Nb (A3) and Ti-36.4Al-9.7Nb (A4) with slightly higher Nb contents, these values are 60 °C below the measured transformation temperatures of 906 °C (A3) and 908 °C (A4). With in situ HEXRD, Stark et al. [25] determined the transformation temperature in a Ti-45Al-10Nb alloy to be 870 ± 40 °C. For an alloy with the same composition, Chladil et al. [52] determined the transformation temperature to be 913 ± 10 °C by conventional XRD and in situ HEXRD. We measured the same transformation temperature of 913 °C for an alloy with similar composition of Ti-44.5Al-11.7Nb (A6), which agrees with Chladil et al. [52]. In a study of a Ti-42Al-8.5Nb alloy, Rackel et al. [10] determined 928 °C as final dissolution temperature of the ωo phase using DTA. For the start of the transformation, an onset-temperature of about 900 °C can be determined from his measurements that were performed with a heating rate of 20 °C/min. The alloy composition is similar to that of the present alloy A3 with a transformation temperature of 906 °C. In conclusion it can be said that the data reported in the literature show a strong scatter. While the investigations reported in the literature focus on only one or two alloys, the present study comprises six alloys of different composition covering a large part of the homogeneity range of the ωo phase indicating a range of transformation temperatures between 900 and 920 °C.

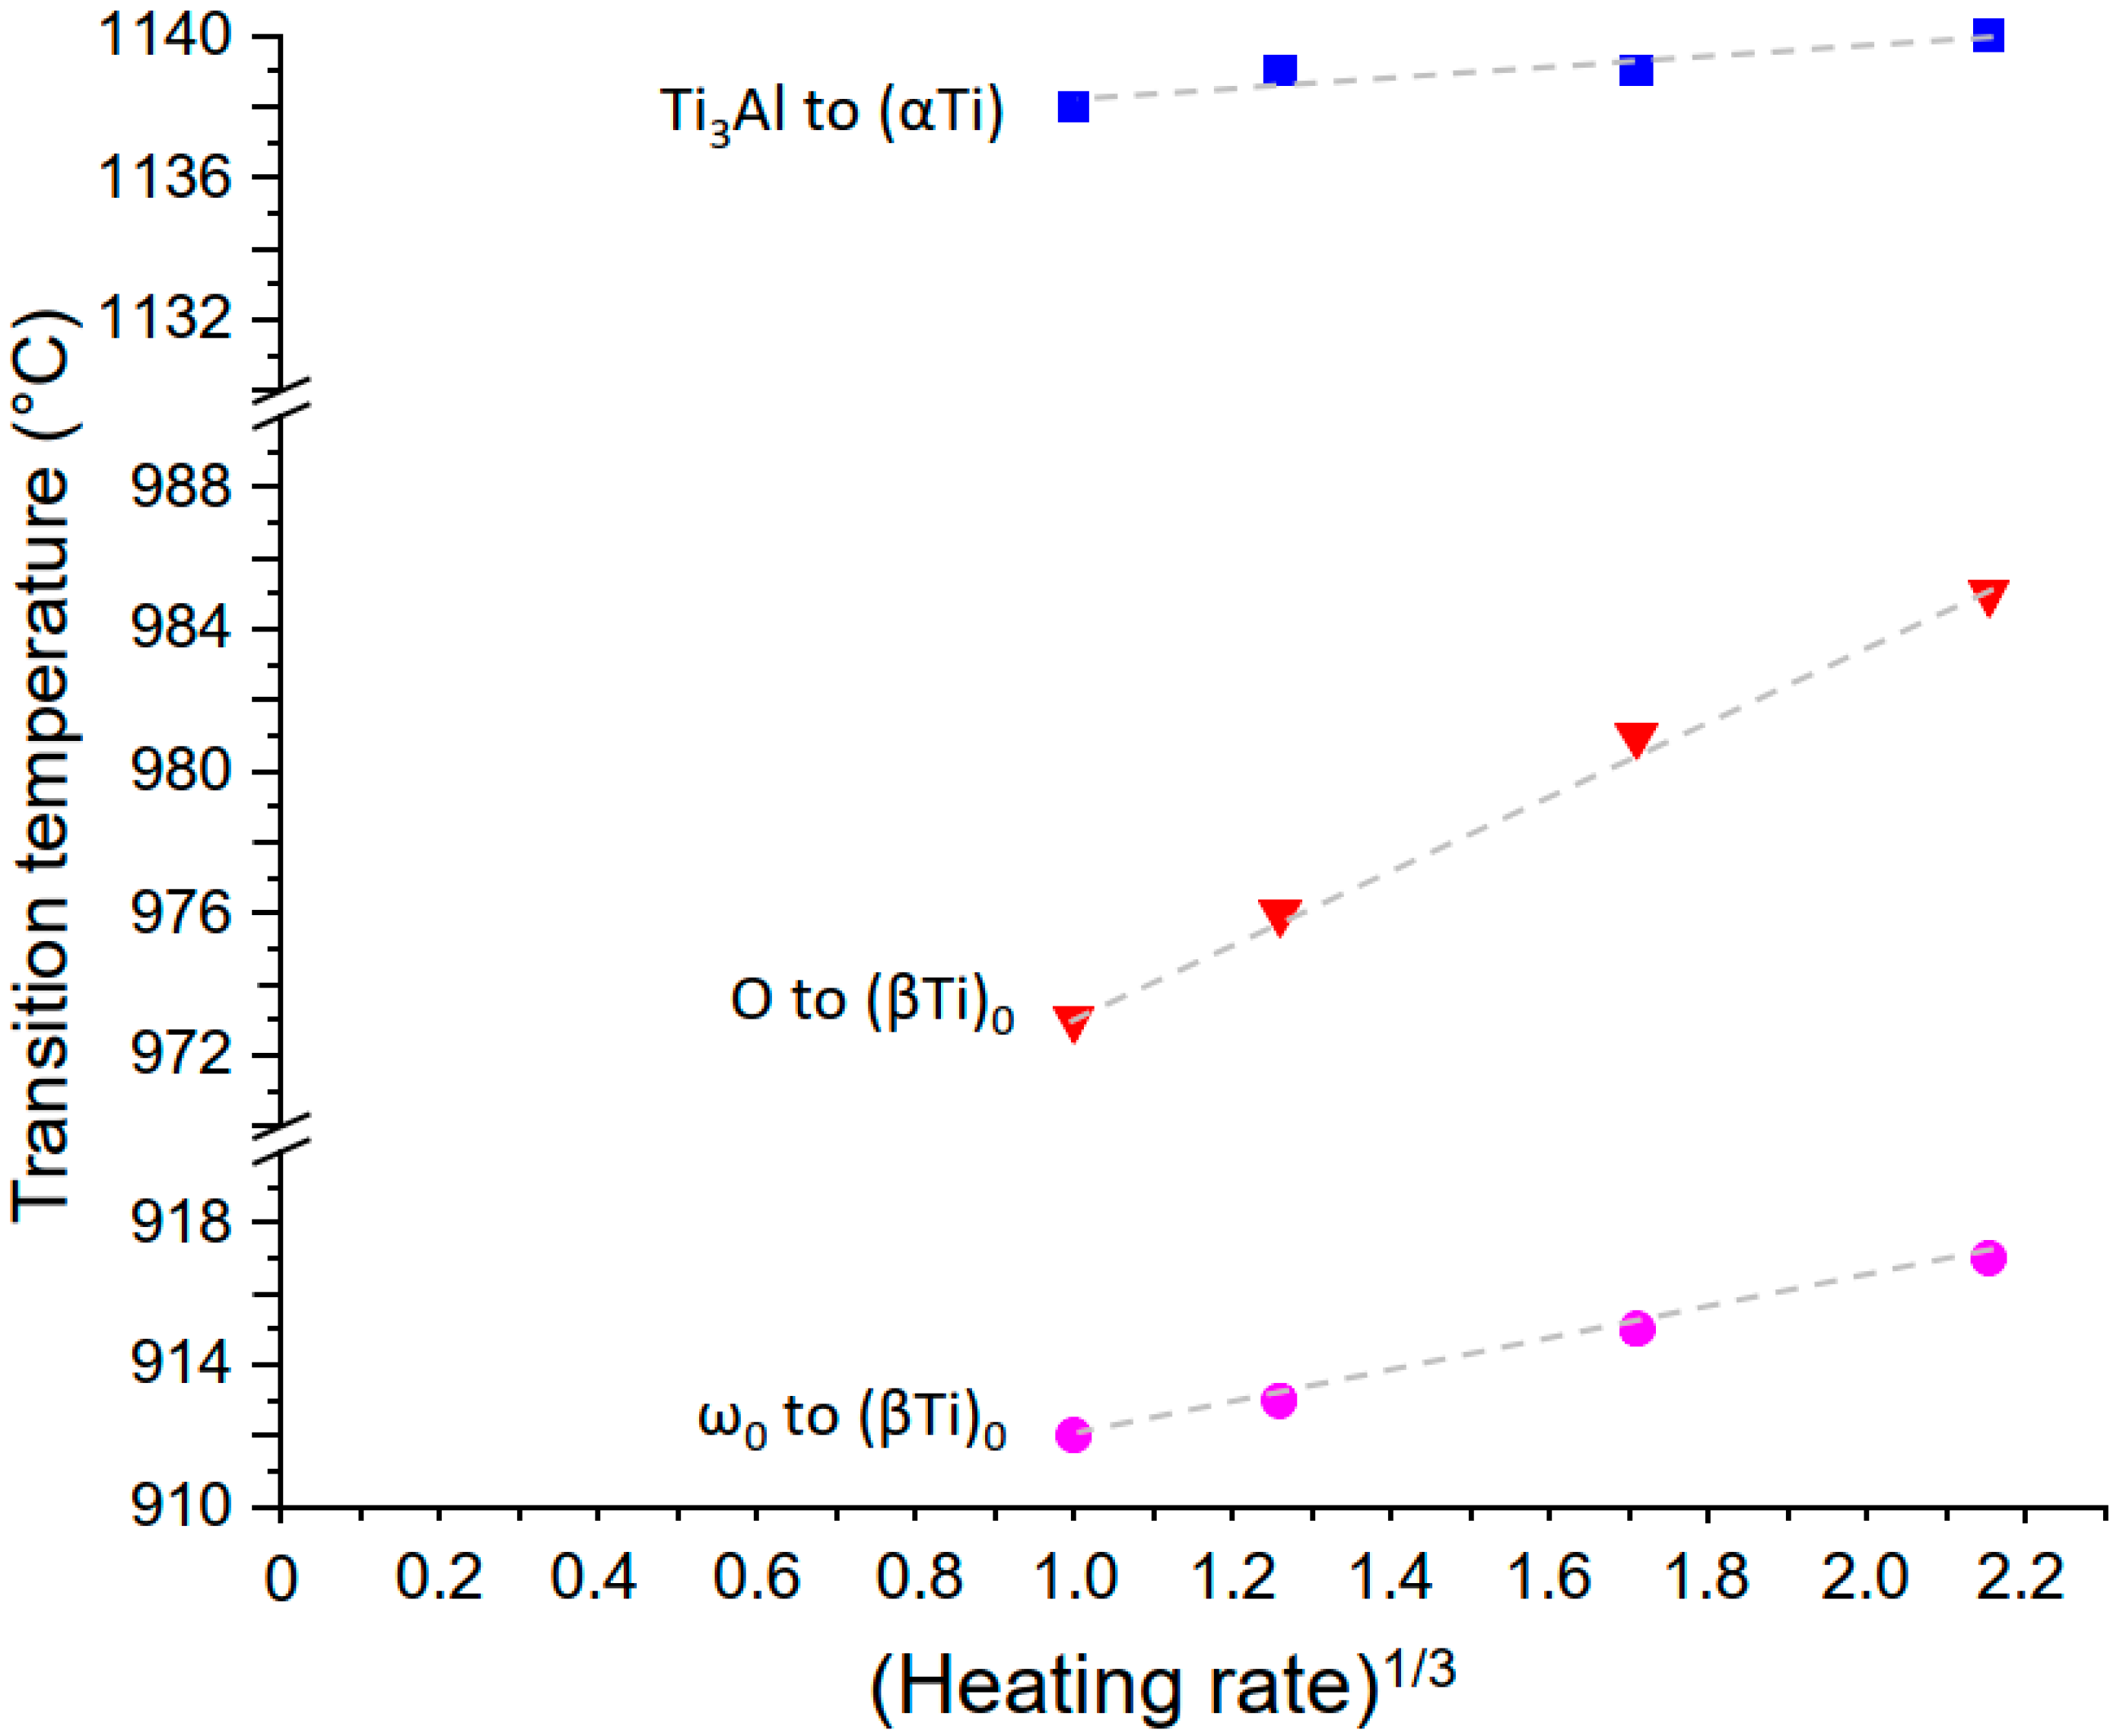
4.2.3. The O Phase to (βTi)o Transformation and Comparison of the Heating Rate Dependent Transformations

Similar as for the transformation ωo to (βTi)o, there is also a change of the crystal structure required for the transformation of the orthorhombic O phase to cubic (βTi)o, which was theoretically described by Banerjee et al. [21]. As is the case for the transformation of the ωo phase, there is also a change in phase composition and phase fraction involved. As can be seen from Table 6, the difference in the measured transformation temperatures for heating rates of 10 °C/min and 1 °C/min is larger than 10 °C resulting in an equilibrium transformation temperature well below the measured values (Table 6). Obviously, the transformation of the O phase has the strongest heating rate dependence of the three described transformations (Figure 11).
Although there is a great interest in developing new alloys based on the O phase [6], there is little to nothing reported in the literature about the equilibrium transformation temperatures. There is general agreement that the O phase is stable above 900 °C, which is confirmed by the present results. Alloys Ti-25.2Al-13.9Nb (A7) and Ti-24.1Al-25.2Nb (A11) transform in the same temperature range and it appears that the influence of the Nb content is not very strong. When the Al content is increased by 5 at.% keeping the Nb content similar to that of A11, the transformation temperature increases to 963 °C in alloy Ti-30.7Al-23.9Nb (A10) (see also Figure 10). This behavior is surprising as one might have expected to find the highest stability of the O phase at the stoichiometric composition (Ti2AlNb, i.e., Ti-25Al-25Nb). In contrast to this expectation, alloy A11 with its O phase composition (Ti-25.3Al-24.3Nb) very near to this stoichiometric composition possesses the lowest of the measured transformation temperatures. Furthermore, the shape of the phase field of the O phase, which is adumbrated in Figure 10, indicates that the highest stability of the O phase most likely is at a composition somewhat lower in Nb and higher in Al compared to the stoichiometric one.
In Figure 11 characteristic examples for the three different heating rate dependent transformations are shown. As described above, the transformation from Ti3Al to (αTi) only requires a slight compositional change and no rearrangement of the crystal structure. Therefore, this transformation can proceed relatively easy. As soon as the transformations become more complex involving changes of the crystal structure as well as significant changes of the phase fractions and phase compositions, it can be well understood that the heating rate dependence becomes stronger, which is the case for the ωo to (βTi)o and O to (βTi)o transformations.

5. Conclusions

By systematic DTA investigations of one binary Ti-Al and 12 ternary Ti-Al-Nb alloys applying at least four different heating rates, the phase transformation characteristics of four solid-solid phase transformations in the Ti-Al-Nb system were investigated and correlated to microstructural observations. From the viewpoint of the performed DTA experiments, there are two types of transformation. In one case, the measured transformation temperatures were found to be independent of the heating rate, while in the other cases the measured temperatures increase with the applied heating rate.
The order/disorder transition of the (βTi) phase from the cubic B2-ordered (βTi)o structure to the otherwise identical but disordered A2 structure belongs to the first (heating rate independent) type of transformations. The observed heating rate independence of the measured disordering temperatures is in agreement with the second-order-type nature of this transition. The disordering temperature only changes as function of composition and the stability of the ordered (βTi)o phase reaches a maximum in the composition range of 30–35 at.% Al, 15–25 at.% Nb, and 45–55 at.% Ti.
The other three transformations Ti3Al to (αTi), ωo to (βTi)o, and O to (βTi)o are first-order transformations, in agreement with that the measured transformation temperatures are dependent on the heating rate. This dependence is clearly nonlinear. To describe the heating rate dependence of such kind of solid-solid phase transformations, Zhu et al. [34,35] had developed a model resulting in a linear relation between (heating rate)1/3 and the measured transformation temperatures. The present data can be very well described by this approach confirming the applicability of the model and allowing the determination of the equilibrium transformation temperatures, which are not accessible directly by a DTA heating or cooling experiment.
The magnitude of the heating rate dependence increases with increasing complexity of the transformation. For the Ti3Al to (αTi) transformation, there is only a weak heating rate dependence. In this case, both phases have the same hexagonal structure and the (αTi) structure can be regarded as the disordered variant of the ordered Ti3Al structure. However, the transformation always also includes a (comparatively small) change in chemical composition and with that also a change in phase fractions. Therefore, there is a dependence on the heating rate, but this dependence is only weak. In case of the ωo to (βTi)o and O to (βTi)o transformations, both the crystal structure types and the phase compositions (and phase fractions) change resulting in a more pronounced heating rate dependence. This dependence is the strongest for the O to (βTi)o transformation, possibly because of the higher Nb content and/or the more complex crystallographic transformation path [20,23].

Author Contributions

Conceptualization, B.D. and F.S.; validation, B.D., K.H. and F.S.; formal analysis, B.D. and K.H.; investigation, B.D. and K.H.; writing—original draft preparation, B.D.; writing—review and editing, F.S., K.H. and F.P.; visualization, B.D.; supervision, F.S. and F.P. All authors have read and agreed to the published version of the manuscript.

Funding

This work is part of the ADVANCE project which has received funding from the Clean Sky 2 Joint Undertaking under the European Union’s Horizon 2020 research and innovation program under grant agreement No. 820647.

Conflicts of Interest

The authors declare no conflict of interest.

References

  1. Clemens, H.; Mayer, S. Design, Processing, Microstructure, Properties, and Applications of Advanced Intermetallic TiAl Alloys. Adv. Eng. Mater. 2012, 15, 191–215. [Google Scholar] [CrossRef]
  2. Mayer, S.; Erdely, P.; Fischer, F.D.; Holec, D.; Kastenhuber, M.; Klein, T.; Clemens, H. Intermetallic β-Solidifying γ-TiAl Based Alloys—From Fundamental Research to Application. Adv. Eng. Mater. 2017, 19, 1600735. [Google Scholar] [CrossRef]
  3. Bewlay, B.P.; Nag, S.; Suzuki, A.; Weimer, M.J. TiAl alloys in commercial aircraft engines. Mater. High Temp. 2016, 33, 549–559. [Google Scholar] [CrossRef]
  4. Yamaguchi, M.; Inui, H.; Ito, K. High-temperature structural intermetallics. Acta Mater. 2000, 48, 307–322. [Google Scholar] [CrossRef]
  5. Ding, J.; Zhang, M.; Ye, T.; Liang, Y.; Ren, Y.; Dong, C.; Lin, J. Microstructure stability and micro-mechanical behavior of as-cast gamma-TiAl alloy during high-temperature low cycle fatigue. Acta Mater. 2018, 145, 504–515. [Google Scholar] [CrossRef]
  6. Zhang, H.; Yan, N.; Liang, H.; Liu, Y. Phase transformation and microstructure control of Ti2AlNb-based alloys: A review. J. Mater. Sci. Technol. 2020, 80, 203–216. [Google Scholar] [CrossRef]
  7. Li, W.; Yin, Y.; Xu, Q.; Zhou, J.; Nan, H.; Ji, X.; Shen, X.; Feng, X.; Yu, W.; Tu, Z.; et al. Tensile behavior of γ/α2 interface system in lamellar TiAl alloy via molecular dynamics. Comput. Mater. Sci. 2018, 159, 397–402. [Google Scholar] [CrossRef]
  8. Gamsjäger, E.; Liu, Y.; Rester, M.; Puschnig, P.; Draxl, C.; Clemens, H.; Dehm, G.; Fischer, F. Diffusive and massive phase transformations in Ti–Al–Nb alloys—Modelling and experiments. Intermetallics 2013, 38, 126–138. [Google Scholar] [CrossRef]
  9. Kenel, C.; Leinenbach, C. Influence of Nb and Mo on microstructure formation of rapidly solidified ternary Ti–Al-(Nb, Mo) alloys. Intermetallics 2016, 69, 82–89. [Google Scholar] [CrossRef]
  10. Rackel, M.W.; Stark, A.; Gabrisch, H.; Schell, N.; Schreyer, A.; Pyczak, F. Orthorhombic phase formation in a Nb-rich γ-TiAl based alloy—An in situ synchrotron radiation investigation. Acta Mater. 2016, 121, 343–351. [Google Scholar] [CrossRef]
  11. Bolz, S.; Oehring, M.; Lindemann, J.; Pyczak, F.; Paul, J.; Stark, A.; Lippmann, T.; Schrüfer, S.; Roth-Fagaraseanu, D.; Schreyer, A.; et al. Microstructure and mechanical properties of a forged β-solidifying γ TiAl alloy in different heat treatment conditions. Intermetallics 2014, 58, 71–83. [Google Scholar] [CrossRef] [Green Version]
  12. Banumathy, S.; Neelam, N.S.; Chandravanshi, V.; Bhattacharjee, A.; Ravi, K. The Effect of Nb addition on microstructure, oxidation behavior and strength of some γ-TiAl alloys. Mater. Today Proc. 2018, 5, 5514–5520. [Google Scholar] [CrossRef]
  13. Bean, G.E.; Kesler, M.S.; Manuel, M.V. Effect of Nb on phase transformations and microstructure in high Nb titanium aluminides. J. Alloys Compd. 2014, 613, 351–356. [Google Scholar] [CrossRef]
  14. Tetsui, T. Effects of high niobium addition on the mechanical properties and high-temperature deformability of gamma TiAl alloy. Intermetallics 2002, 10, 239–245. [Google Scholar] [CrossRef]
  15. Braun, J.; Ellner, M.; Predel, B. Experimental investigations of the structure and stability of the TiAl phase. Z. Fuer Met. 1995, 86, 870–876. [Google Scholar]
  16. Braun, J.; Ellner, M. On the partial atomic volume of aluminium in the titanium-rich phases of the binary system Ti-Al. Z. Fuer Met. 2000, 91, 389–392. [Google Scholar]
  17. Cahn, R.W. Binary Alloy Phase Diagrams, 2nd ed.; Massalski, T.B., Okamoto, H., Subramanian, P.R., Kacprzak, L., Eds.; ASM International: Materials Park, OH, USA, 1990. [Google Scholar]
  18. Kononikhina, V.; Stark, A.; Gan, W.; Schreyer, A.; Pyczak, F. Ordering and disordering of β/βo-phase in γ-TiAl based alloys investigated by neutron diffraction. MRS Adv. 2017, 2, 1399–1404. [Google Scholar] [CrossRef]
  19. Das, K.; Das, S. Order-disorder transformation of the body centered cubic phase in the Ti-Al-X (X = Ta, Nb, or Mo) system. J. Mater. Sci. 2003, 38, 3995–4002. [Google Scholar] [CrossRef]
  20. Bendersky, L.; Boettinger, W.; Burton, B.; Biancaniello, F.; Shoemaker, C. The formation of ordered ω-related phases in alloys of composition Ti4Al3Nb. Acta Met. Mater. 1990, 38, 931–943. [Google Scholar] [CrossRef]
  21. Banerjee, D.P.K.; Gogia, A.; Nandi, T.; Joshi, V. A new ordered orthorhombic phase in a Ti3Al-Nb alloy. Acta Met. 1988, 36, 871–882. [Google Scholar] [CrossRef]
  22. Hsiung, L.; Cai, W.; Wadley, H. Mechanisms of isothermal phase transformations in rapidly solidified Ti-24Al-11Nb. Acta Met. Mater. 1992, 40, 3035–3049. [Google Scholar] [CrossRef]
  23. Bendersky, L.; Roytburd, A.; Boettinger, W. Phase transformations in the (Ti, Al)3 Nb section of the Ti-Al-Nb system—I. Microstructural predictions based on a subgroup relation between phases. Acta Met. Mater. 1994, 42, 2323–2335. [Google Scholar] [CrossRef]
  24. Porter, D.A.; Easterling, K.E. Phase Transformations in Metals and Alloys; Chapman & Hall: London, UK, 1992. [Google Scholar]
  25. Stark, A.; Oehring, M.; Pyczak, F.; Lippmann, T.; Lottermoser, L.; Schreyer, A. The Transformation Mechanism of β Phase to ω-Related Phases in Nb-Rich γ-TiAl Alloys Studied by In Situ High-Energy X-ray Diffraction. Mater. Sci. Forum 2013, 772, 85–89. [Google Scholar] [CrossRef] [Green Version]
  26. Rackel, M.W.; Stark, A.; Gabrisch, H.; Pyczak, F. Screening for O phase in advanced γ–TiAl alloys. Intermetallics 2021, 131, 107086. [Google Scholar] [CrossRef]
  27. Zheng, Y.; Zeng, W.; Li, D.; Xu, J.; Ma, X.; Liang, X.; Zhang, J. Orthorhombic precipitate variant selection in a Ti2AlNb based alloy. Mater. Des. 2018, 158, 46–61. [Google Scholar] [CrossRef]
  28. Bendersky, L.; Boettinger, W.; Roytburd, A. Coherent precipitates in the b.c.c./orthorhombic two-phase field of the Ti-Al-Nb system. Acta Met. Mater. 1991, 39, 1959–1969. [Google Scholar] [CrossRef]
  29. Schell, N.; King, A.; Beckmann, F.; Fischer, T.; Müller, M.; Schreyer, A. The High Energy Materials Science Beamline (HEMS) at PETRA III. Mater. Sci. Forum 2013, 772, 57–61. [Google Scholar] [CrossRef] [Green Version]
  30. Hammersley, A.P. FIT2D: A multi-purpose data reduction, analysis and visualization program. J. Appl. Crystallogr. 2016, 49, 646–652. [Google Scholar] [CrossRef]
  31. Höhne, G.; Cammenga, H.; Eysel, W.; Gmelin, E.; Hemminger, W. The temperature calibration of scanning calorimeters. Thermochim. Acta 1990, 160, 1–12. [Google Scholar] [CrossRef]
  32. Höhne, G.W.H. Remarks on the calibration of differential scanning calorimeters. J. Therm. Anal. Calorim. 1991, 37, 1987–2000. [Google Scholar] [CrossRef]
  33. Gmelin, E.; Sarge, S.M. Calibration of differential scanning calorimeters. Pure Appl. Chem. 1995, 67, 1789–1800. [Google Scholar] [CrossRef] [Green Version]
  34. Zhu, Y.T.; Devletian, J.H. Determination of equilibrium solid-phase transition temperature using DTA. Met. Mater. Trans. A 1991, 22, 1993–1998. [Google Scholar] [CrossRef]
  35. Zhu, Y.T.; Devletian, J.H.; Manthiram, A. Application of differential thermal analysis to solid-solid transitions in phase diagram determination. J. Phase Equilibria Diffus. 1994, 15, 37–41. [Google Scholar] [CrossRef]
  36. Schuster, J.C.; Palm, M. Reassessment of the binary Aluminum-Titanium phase diagram. J. Phase Equilibria Diffus. 2006, 27, 255–277. [Google Scholar] [CrossRef]
  37. Christian, J.W. The Theory of Transformations in Metals and Alloys, 2nd ed.; Pergamon Press: Oxford, UK, 1975; p. 549. [Google Scholar]
  38. Malinov, S.; Novoselova, T.; Sha, W. Experimental and modelling studies of the thermodynamics and kinetics of phase and structural transformations in a gamma TiAl-based alloy. Mater. Sci. Eng. A 2004, 386, 344–353. [Google Scholar] [CrossRef]
  39. Böhm, H.; Löhberg, K.A. Superlattice of the CsCl-Type in the System Ti-Mo-Al. Z. Fuer Met. 1958, 49, 173–178. [Google Scholar]
  40. Hamajima, T.; Luetjering, G.; Weissmann, S. Microstructure and phase relations for Ti-Mo-Al alloys. Met. Mater. Trans. A 1972, 3, 2805–2810. [Google Scholar] [CrossRef]
  41. Banerjee, D.; Nandy, T.; Gogia, A. Site occupation in the ordered beta phase of ternary Ti-Al-Nb alloys. Scr. Met. 1987, 21, 597–600. [Google Scholar] [CrossRef]
  42. Leonard, K.J.; Vasudevan, V.K. Site occupancy preferences in the B2 ordered phase in Nb–rich Nb–Ti–Al alloys. Mater. Sci. Eng. A 2002, 329-331, 461–467. [Google Scholar] [CrossRef]
  43. Holec, D.; Reddy, R.K.; Klein, T.; Clemens, H. Preferential site occupancy of alloying elements in TiAl-based phases. J. Appl. Phys. 2016, 119, 205104. [Google Scholar] [CrossRef] [Green Version]
  44. Muraleedharan, K.; Gogia, A.K.; Nandy, T.K.; Banerjee, D.; Lele, S. Transformations in a Ti-24AI-15Nb alloy: Part I. Phase equilibria and microstructure. Met. Mater. Trans. A 1992, 23, 401–415. [Google Scholar] [CrossRef]
  45. Suryanarayana, C.; Lee, D. Phase relations in Ti-Al-Nb alloys at 1200 °C. Scr. Met. Mater. 1992, 26, 919–924. [Google Scholar] [CrossRef]
  46. Asta, M.; Ormeci, A.; Wills, J.M.; Albers, R.C. First-Principles Study of Intermetallic Phase Stability in the Ternary Ti-Al-Nb Alloy System. MRS Proc. 1994, 364. [Google Scholar] [CrossRef] [Green Version]
  47. Kestner-Weykamp, H.; Ward, C.; Broderick, T.; Kaufman, M. Microstructures and phase relationships in the Ti3Al + Nb system. Scr. Met. 1989, 23, 1697–1702. [Google Scholar] [CrossRef]
  48. Cupid, D.M.; Fabrichnaya, O.; Rios, O.; Ebrahimi, F.; Seifert, H.J. Thermodynamic re-assessment of the Ti–Al–Nb system. Int. J. Mater. Res. 2009, 100, 218–233. [Google Scholar] [CrossRef]
  49. Witusiewicz, V.; Bondar, A.; Hecht, U.; Velikanova, T. The Al–B–Nb–Ti system: IV. Experimental study and thermodynamic re-evaluation of the binary Al–Nb and ternary Al–Nb–Ti systems. J. Alloys Compd. 2009, 472, 133–161. [Google Scholar] [CrossRef]
  50. Jones, S.; Shull, R.; McAlister, A.; Kaufman, M. Microstructural studies of Ti-Al alloys in the vicinity of the “eutectoid” reaction (α→α2 + γ). Scr. Met. 1988, 22, 1235–1240. [Google Scholar] [CrossRef]
  51. Appel, F.; Oehring, M.; Wagner, R. Novel design concepts for gamma-base titanium aluminide alloys. Intermetallics 2000, 8, 1283–1312. [Google Scholar] [CrossRef]
  52. Chladil, H.F.; Clemens, H.; Zickler, G.A.; Takeyama, M.; Kozeschnik, E.; Bartels, A.; Buslaps, T.; Gerling, R.; Kremmer, S.; Yeoh, L.; et al. Experimental studies and thermodynamic simulation of phase transformations in high Nb containing γ-TiAl based alloys. Int. J. Mater. Res. 2007, 98, 1131–1137. [Google Scholar] [CrossRef]
  53. Xu, Y.; Liang, Y.; Song, L.; Hao, G.; Tian, B.; Xu, R.; Lin, J. Experimental Phase Equilibria and Isopleth Section of 8Nb-TiAl Alloys. Metals 2021, 11, 1229. [Google Scholar] [CrossRef]
  54. Chladil, H.; Clemens, H.; Leitner, H.; Bartels, A.; Gerling, R.; Schimansky, F.-P.; Kremmer, S. Phase transformations in high niobium and carbon containing γ-TiAl based alloys. Intermetallics 2006, 14, 1194–1198. [Google Scholar] [CrossRef]
  55. Waterstrat, R.M. Effect of Interstitial Elements on Phase Relationships in the Titanium-Aluminium System; NISTIR 88-3856, U.S. Department of Commerce, National Institute of Standards and Technology: Gaithersburg, MD, USA, 1988; p. 53. [Google Scholar]
  56. Liss, K.-D.; Bartels, A.; Clemens, H.; Bystrzanowski, S.; Stark, A.; Buslaps, T.; Schimansky, F.-P.; Gerling, R.; Scheu, C.; Schreyer, A. Recrystallization and phase transitions in a γ-TiAl-based alloy as observed by ex situ and in situ high-energy X-ray diffraction. Acta Mater. 2006, 54, 3721–3735. [Google Scholar] [CrossRef]
  57. Beran, P.; Petrenec, M.; Heczko, M.; Smetana, B.; Žaludová, M.; Šmíd, M.; Kruml, T.; Keller, L. In-situ neutron diffraction study of thermal phase stability in a γ-TiAl based alloy doped with Mo and/or C. Intermetallics 2014, 54, 28–38. [Google Scholar] [CrossRef]
  58. Yeoh, L.A.; Liss, K.-D.; Bartels, A.; Chladil, H.; Avdeev, M.; Clemens, H.; Gerling, R.; Buslaps, T. In situ high-energy X-ray diffraction study and quantitative phase analysis in the α + γ phase field of titanium aluminides. Scr. Mater. 2007, 57, 1145–1148. [Google Scholar] [CrossRef] [Green Version]
  59. Distl, B.; Hauschildt, K.; Rashkova, B.; Pyczak, F.; Stein, F. Low-temperature phase equilibria between 700 °C and 900 °C in the Ti-rich part of the Ti-Al-Nb system. 2021; in preparation. [Google Scholar]
  60. Sadi, F.-A.; Servant, C. In Situ Neutron Diffraction on the Alloy 50.6Ti-36.5Al-12.9 Nb (at.%). Z. Fuer Met. 2000, 91, 504–509. [Google Scholar]
  61. Sadi, F.-A. Contribution à L’étude du Diagramme de Phases du Système Al–Nb–Ti au Voisinage des Composés AlNbTi2 et Al3NbTi4. Ph.D. Thesis, Université de Paris-Sud, Paris, France, 1997. [Google Scholar]
  62. Song, L.; Xu, X.; You, L.; Liang, Y.; Wang, Y.; Lin, J. Ordered α2 to ωo phase transformations in high Nb-containing TiAl alloys. Acta Mater. 2015, 91, 330–339. [Google Scholar] [CrossRef]
  63. Song, L.; Lin, J.; Li, J. Phase transformation mechanisms in a quenched Ti-45Al-8.5Nb-0.2W-0.2B-0.02Y alloy after subsequent annealing at 800 °C. J. Alloys Compd. 2017, 691, 60–66. [Google Scholar] [CrossRef]
Figure 1. Back-scattered electron (BSE) SEM micrographs of: (a) alloy Ti-36.4Al-9.7Nb (A4) after heat treatment at 900 °C for 650 h showing a three-phase microstructure with ωo (bright) as matrix phase, Ti3Al (grey) and TiAl (dark); (b) alloy Ti-36.4Al-9.7Nb (A4) after heat treatment at 1000 °C for 400 h also showing a three-phase microstructure with (βTi)o (bright) as matrix phase, Ti3Al (grey) and TiAl (dark).
Metals 11 01991 g001
Figure 2. HEXRD diffraction patterns of alloy Ti-36.4Al-9.7Nb (A4) heat-treated at 900 °C (blue, ωo + Ti3Al + TiAl) and 1000 °C (red, (βTi)o + Ti3Al + TiAl) with the intensity displayed on a logarithmic scale.
Metals 11 01991 g002
Figure 3. Back-scattered electron (BSE) SEM micrographs of: (a) alloy Ti-25.2Al-13.9Nb (A7) after heat treatment at 900 °C for 650 h showing a three-phase microstructure of (βTi)o (bright) and a two-phase matrix (Ti3Al and O phase); (b) alloy Ti-25.2Al-13.9Nb (A7) after heat treatment at 1000 °C for 400 h showing a two-phase microstructure consisting of (βTi)o (bright) and Ti3Al (dark).
Metals 11 01991 g003
Figure 4. HEXRD diffraction pattern of alloy Ti-25.2Al-13.9Nb (A7) heat-treated at 900 °C (blue, (βTi)o + O phase + Ti3Al) and 1000 °C (red, Ti3Al + (βTi)o) with the intensity displayed on a logarithmic scale.
Metals 11 01991 g004
Figure 5. (a) Order/disorder temperatures for the (βTi)o to (βTi) transition in selected alloys measured with heating rates of 1, 2, 5, and 10 °C/min; (b) comparison of a heating and respective cooling DTA curve of Ti-32.8Al-16.8Nb (A8) showing agreement of the reaction temperature.
Metals 11 01991 g005
Figure 6. DTA heat flow curves (heating rate: 10 °C/min) of alloy Ti-44.3Al-4.9Nb (A1) showing the transformation Ti3Al to (αTi) for three differently heat-treated samples (preceding heat treatment at 700, 800, or 900 °C).
Metals 11 01991 g006
Figure 7. (a) DTA heating curves of alloy Ti-39.8Al-9.4Nb (A3) obtained with different heating rates; (b) non-linear heating rate dependence of the transformation temperatures.
Metals 11 01991 g007
Figure 8. Plot of the experimentally determined transformation temperatures for the transformation ωo to (βTi)o as a function of (heating rate)1/3 (approach of Zhu et al. [34,35]). From the linear extrapolations to 0 °C/min heating rate, the equilibrium transformation temperatures for alloys A3, A4, A5, A6, A8 and A9 were determined.
Metals 11 01991 g008
Figure 9. Disordering temperatures and phase compositions of (βTi) plotted in a partial Gibbs-triangle with tentative areas of disordering temperatures above 1240 °C (dark colored area) and 1200 °C (light colored area). Included are also experimental results from Das et al. [19], Muraleedharan et al. [44], and Suryanarayana et al. [45].
Metals 11 01991 g009
Figure 10. Transformation temperature and composition of ωo (stars) and O phase (circles) plotted in a partial Gibbs-triangle with homogeneity range of ωo (orange colored area) and O phase (grey colored area) at 900 °C.
Metals 11 01991 g010
Figure 11. Comparison of the heating rate dependence of the transformations Ti3Al to (αTi), O to (βTi)o, and ωo to (βTi)o (for each type of transformation one specific example was chosen, the presented data belong to alloys A0 (squares), A4 (circles), and A10 (triangles), respectively).
Metals 11 01991 g011
Table 1. Composition of synthesized and heat-treated Ti-Al-Nb alloys measured with EPMA and the phase transformations taking place in these alloys are marked by “x” (for simplification, only the phases are mentioned that transform into each other even though other phases might be involved the phase fraction and composition of which also changes).
AlloyTi (at.%)Al (at.%)Nb (at.%)ωo to (βTi)oO to (βTi)oTi3Al to (αTi)(βTi)o to (βTi)
A057.142.9x
A150.844.34.9x
A249.045.85.2x
A350.839.89.4xxx
A453.936.49.7x*x
A555.632.711.6xx
A643.844.511.7xx
A760.925.213.9xx
A850.432.816.8x*x
A940.439.620.0xx
A1045.430.723.9xx
A1150.724.125.2xx
*: transformation temperatures could not be reliably measured by DTA because of a very small phase fraction of the transforming phase and/or proximity of the critical temperature to another reaction in the same alloy.
Table 2. Disordering temperature of (βTi)o as measured with constant heating rate of 10 °C/min for differently heat-treated samples of the alloys Ti-36.4Al-9.7Nb (A4) and Ti-44.5Al-11.7Nb (A6).
Heat Treatment (Temperature/Time)Disordering Temperature (°C)
Ti-36.4Al-9.7Nb (A4)Ti-44.5Al-11.7Nb (A6)
700 °C/1500 h12221204
900 °C/650 h12231204
1000 °C/400 h12231204
Table 3. Equilibrium disordering temperatures of (βTi)o for alloys A3–A11 with the respective composition of the (βTi)o phase.
AlloyTi (at.%)Al (at.%)Nb (at.%)(βTi)o to (βTi) (°C)
A352.337.410.41201 ± 1
A454.435.89.81222 ± 1
A555.632.711.61237 ± 1
A648.537.514.11204 ± 1
A760.925.213.91104 ± 1
A850.432.816.81248 ± 1
A942.938.119.01199 ± 1
A1045.430.723.91243 ± 1
A1150.724.125.21169 ± 1
Table 4. Transformation temperatures for the Ti3Al to (αTi) transformation in different alloys as determined from DTA heating curves. The extrapolated equilibrium transformation temperatures (corresponding to 0 °C/min heating rate) are given in the last row.
Heating Rate (°C/min)Ti3Al to (αTi) Transformation Temperatures (°C)
Ti-42.9Al (A0)Ti-44.3Al-4.9Nb (A1)Ti-45.8Al-5.2Nb (A2)Ti-39.8Al-9.4Nb (A3)
101140114711631174
51139114811631173
21139114511611173
11138– *– *1172
01137 ± 11143 ± 11159 ± 11171 ± 1
* measured signal was too small to allow an exact determination of the value of the onset.
Table 5. Equilibrium phase transformation temperatures that were determined by applying the approach of Zhu et al. [34,35] to the present DTA results for the phase transformation ωo to (βTi)o.
AlloyTi (at.%)Al (at.%)Nb (at.%)ωo to (βTi)o (°C)
A350.839.89.4906 ± 1
A453.936.49.7908 ± 1
A555.632.711.6919 ± 2
A643.844.511.7913 ± 1
A850.432.816.8897 ± 3
A940.439.620.0923 ± 1
Table 6. Transformation temperatures for the O to (βTi)o transformations in different alloys upon heating as determined by DTA. The extrapolated equilibrium transformation temperatures are given in the last line.
Heating Rate (°C/min)O to (βTi)o Transformation Temperatures (°C)
Ti-25.2Al-13.9Nb (A7)Ti-30.7Al-23.9Nb (A10)Ti-24.1Al-25.2Nb (A11)
10964985979
5960981973
2956976962 *
1951973955 *
0941 ± 1963 ± 1935 ± 2
* increase in uncertainty to ± 2 °C due to difficulties in onset determination resulting from weak signal at low heating rates.
Publisher’s Note: MDPI stays neutral with regard to jurisdictional claims in published maps and institutional affiliations.

