
Mechanism of Blunt Punching Tools’ Influence on Deformation and Residual Stress Distribution


Abstract
:1. Introduction
2. Materials and Methods
2.1. Material Preparation
2.2. Microstructure Analysis
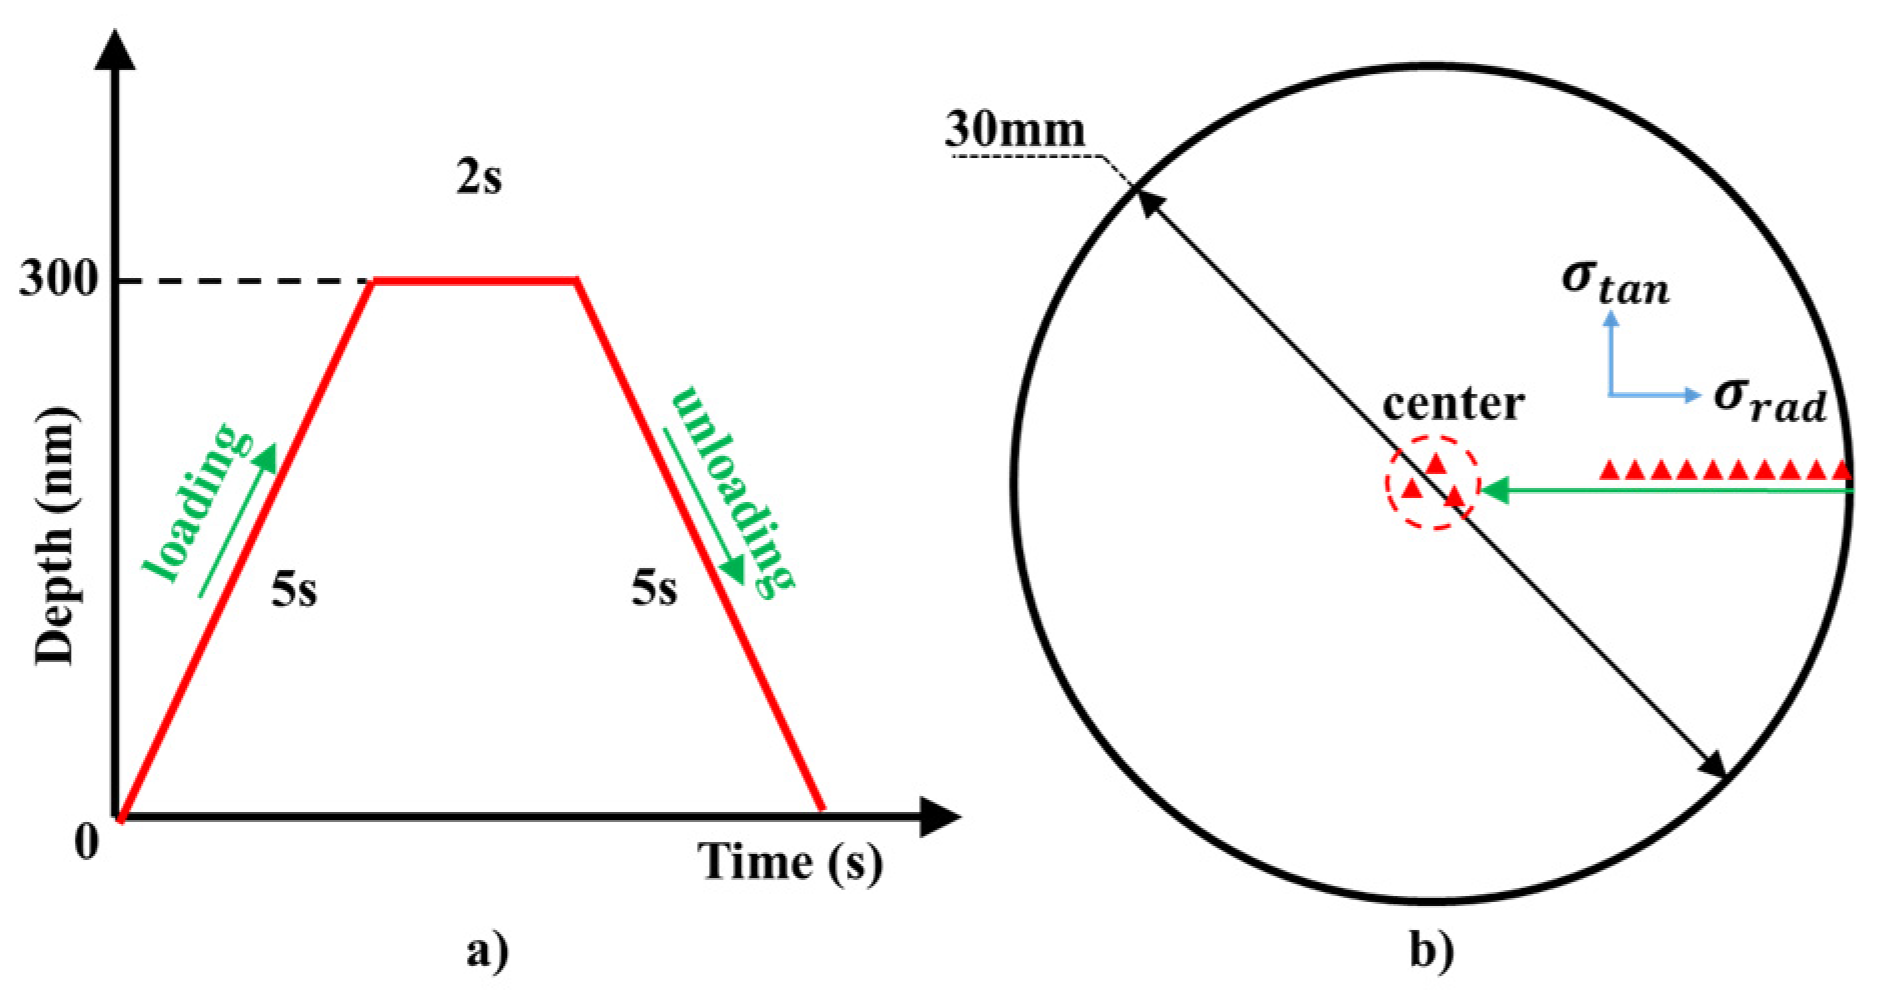
2.3. Residual Stress Determination
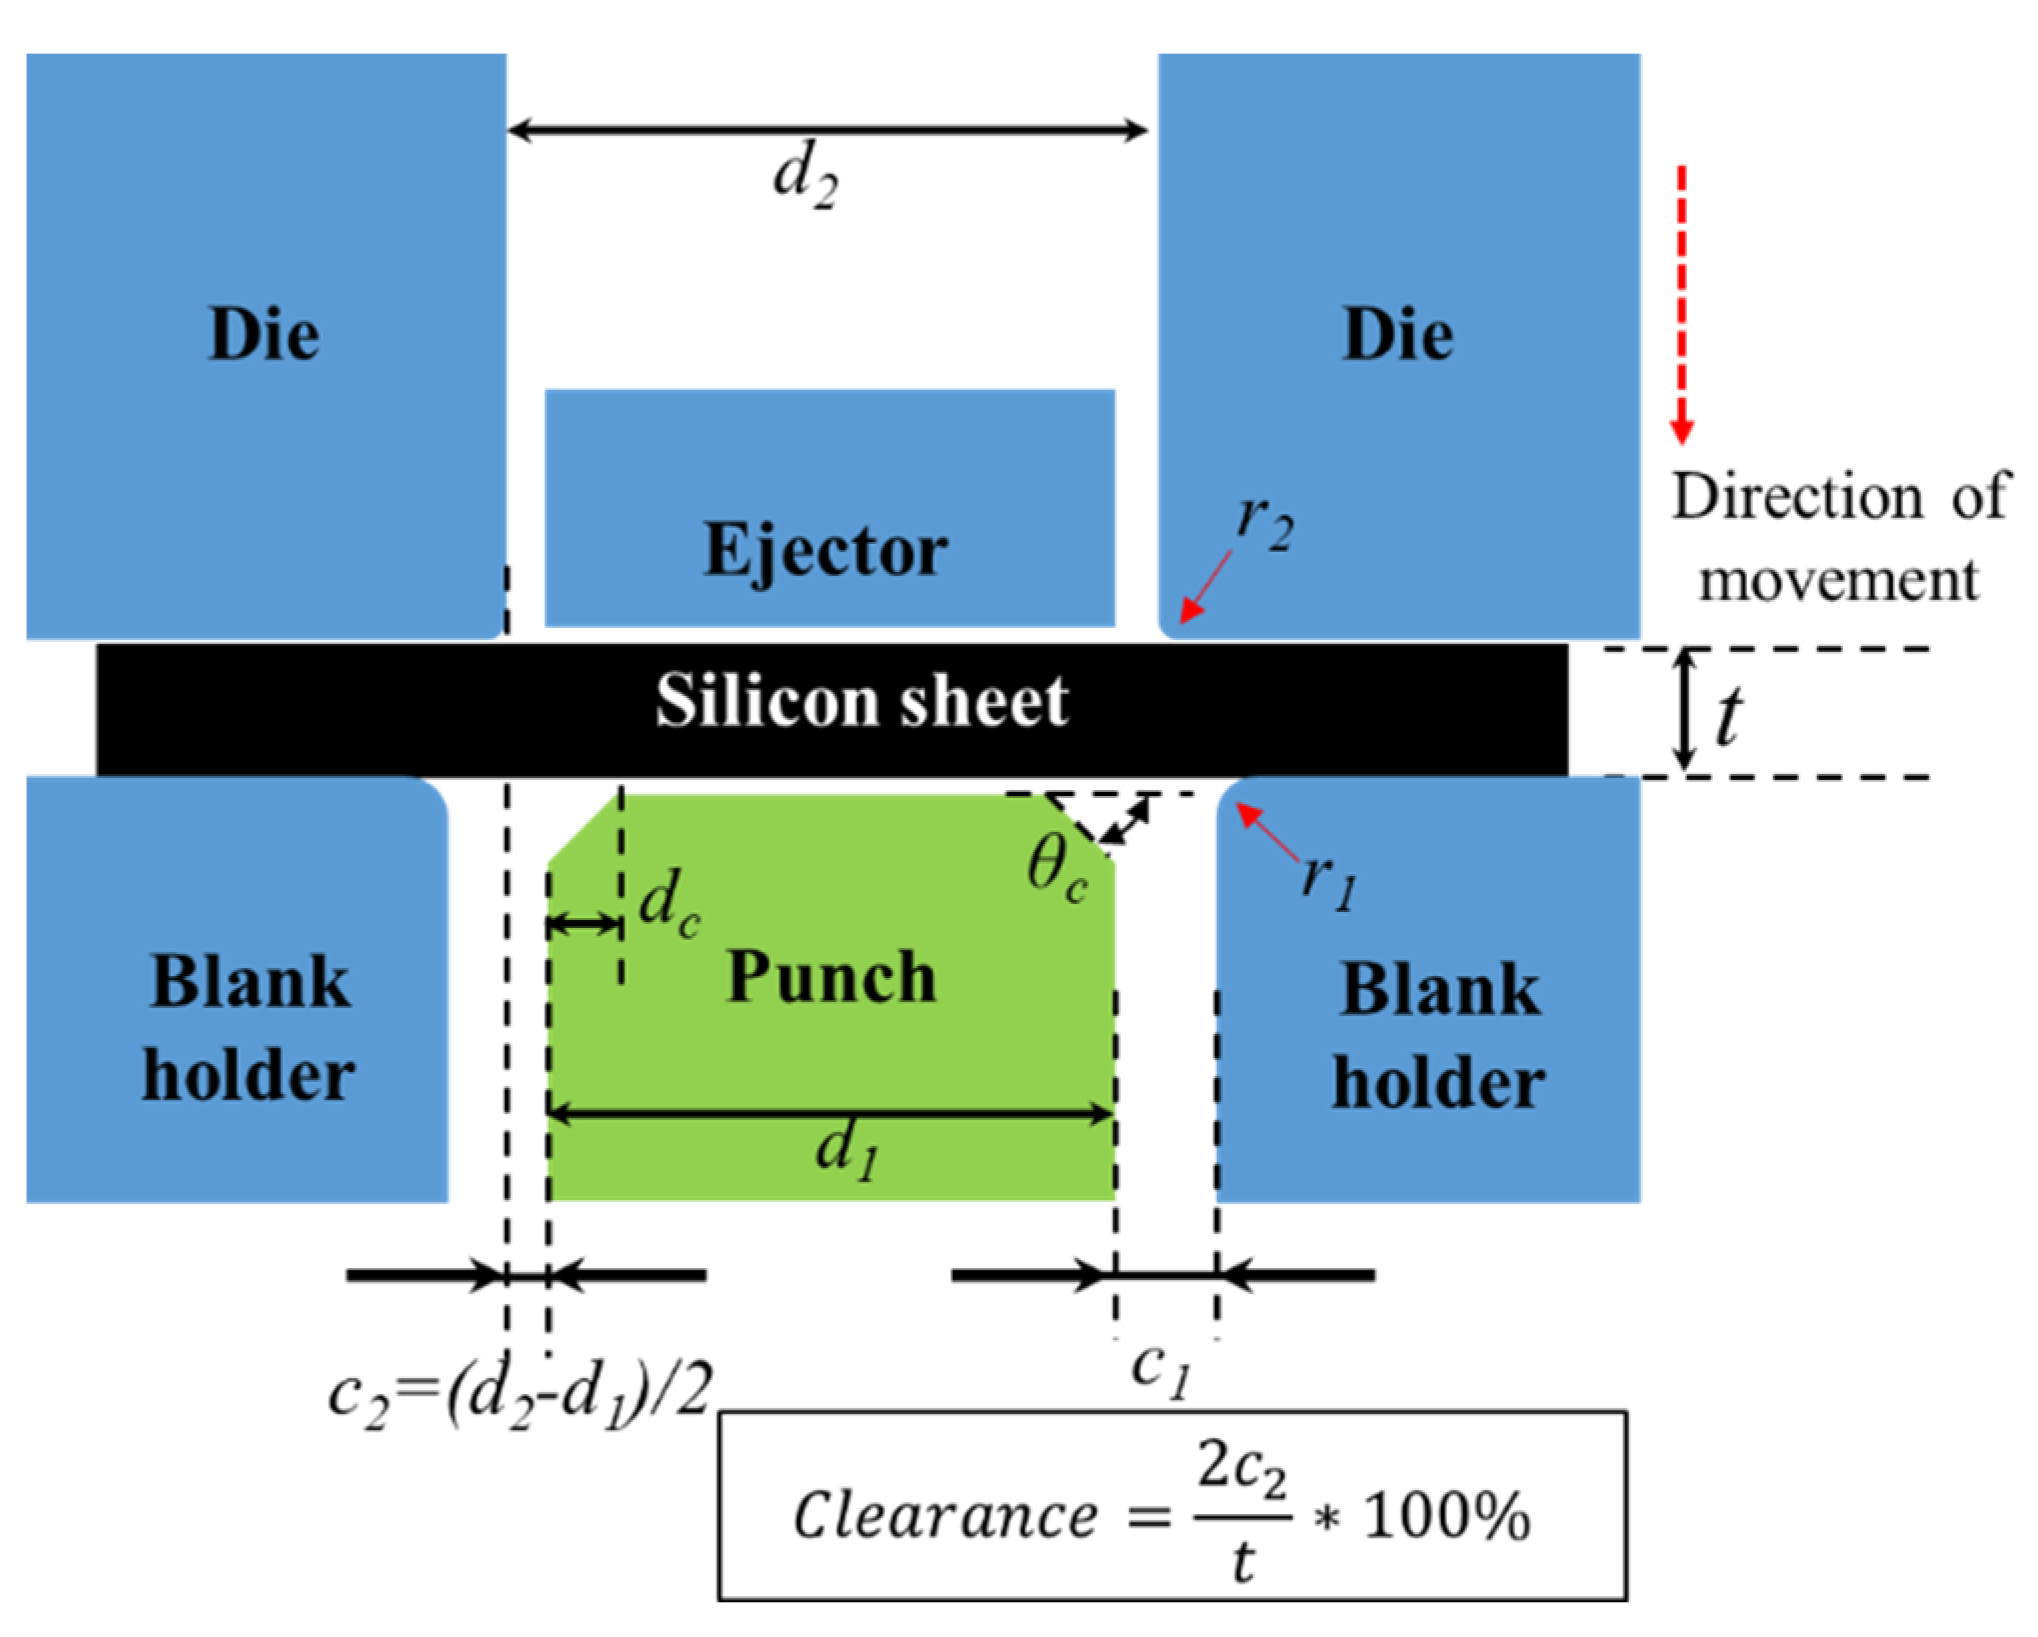
2.4. Finite Element Simulation
3. Results and Discussions
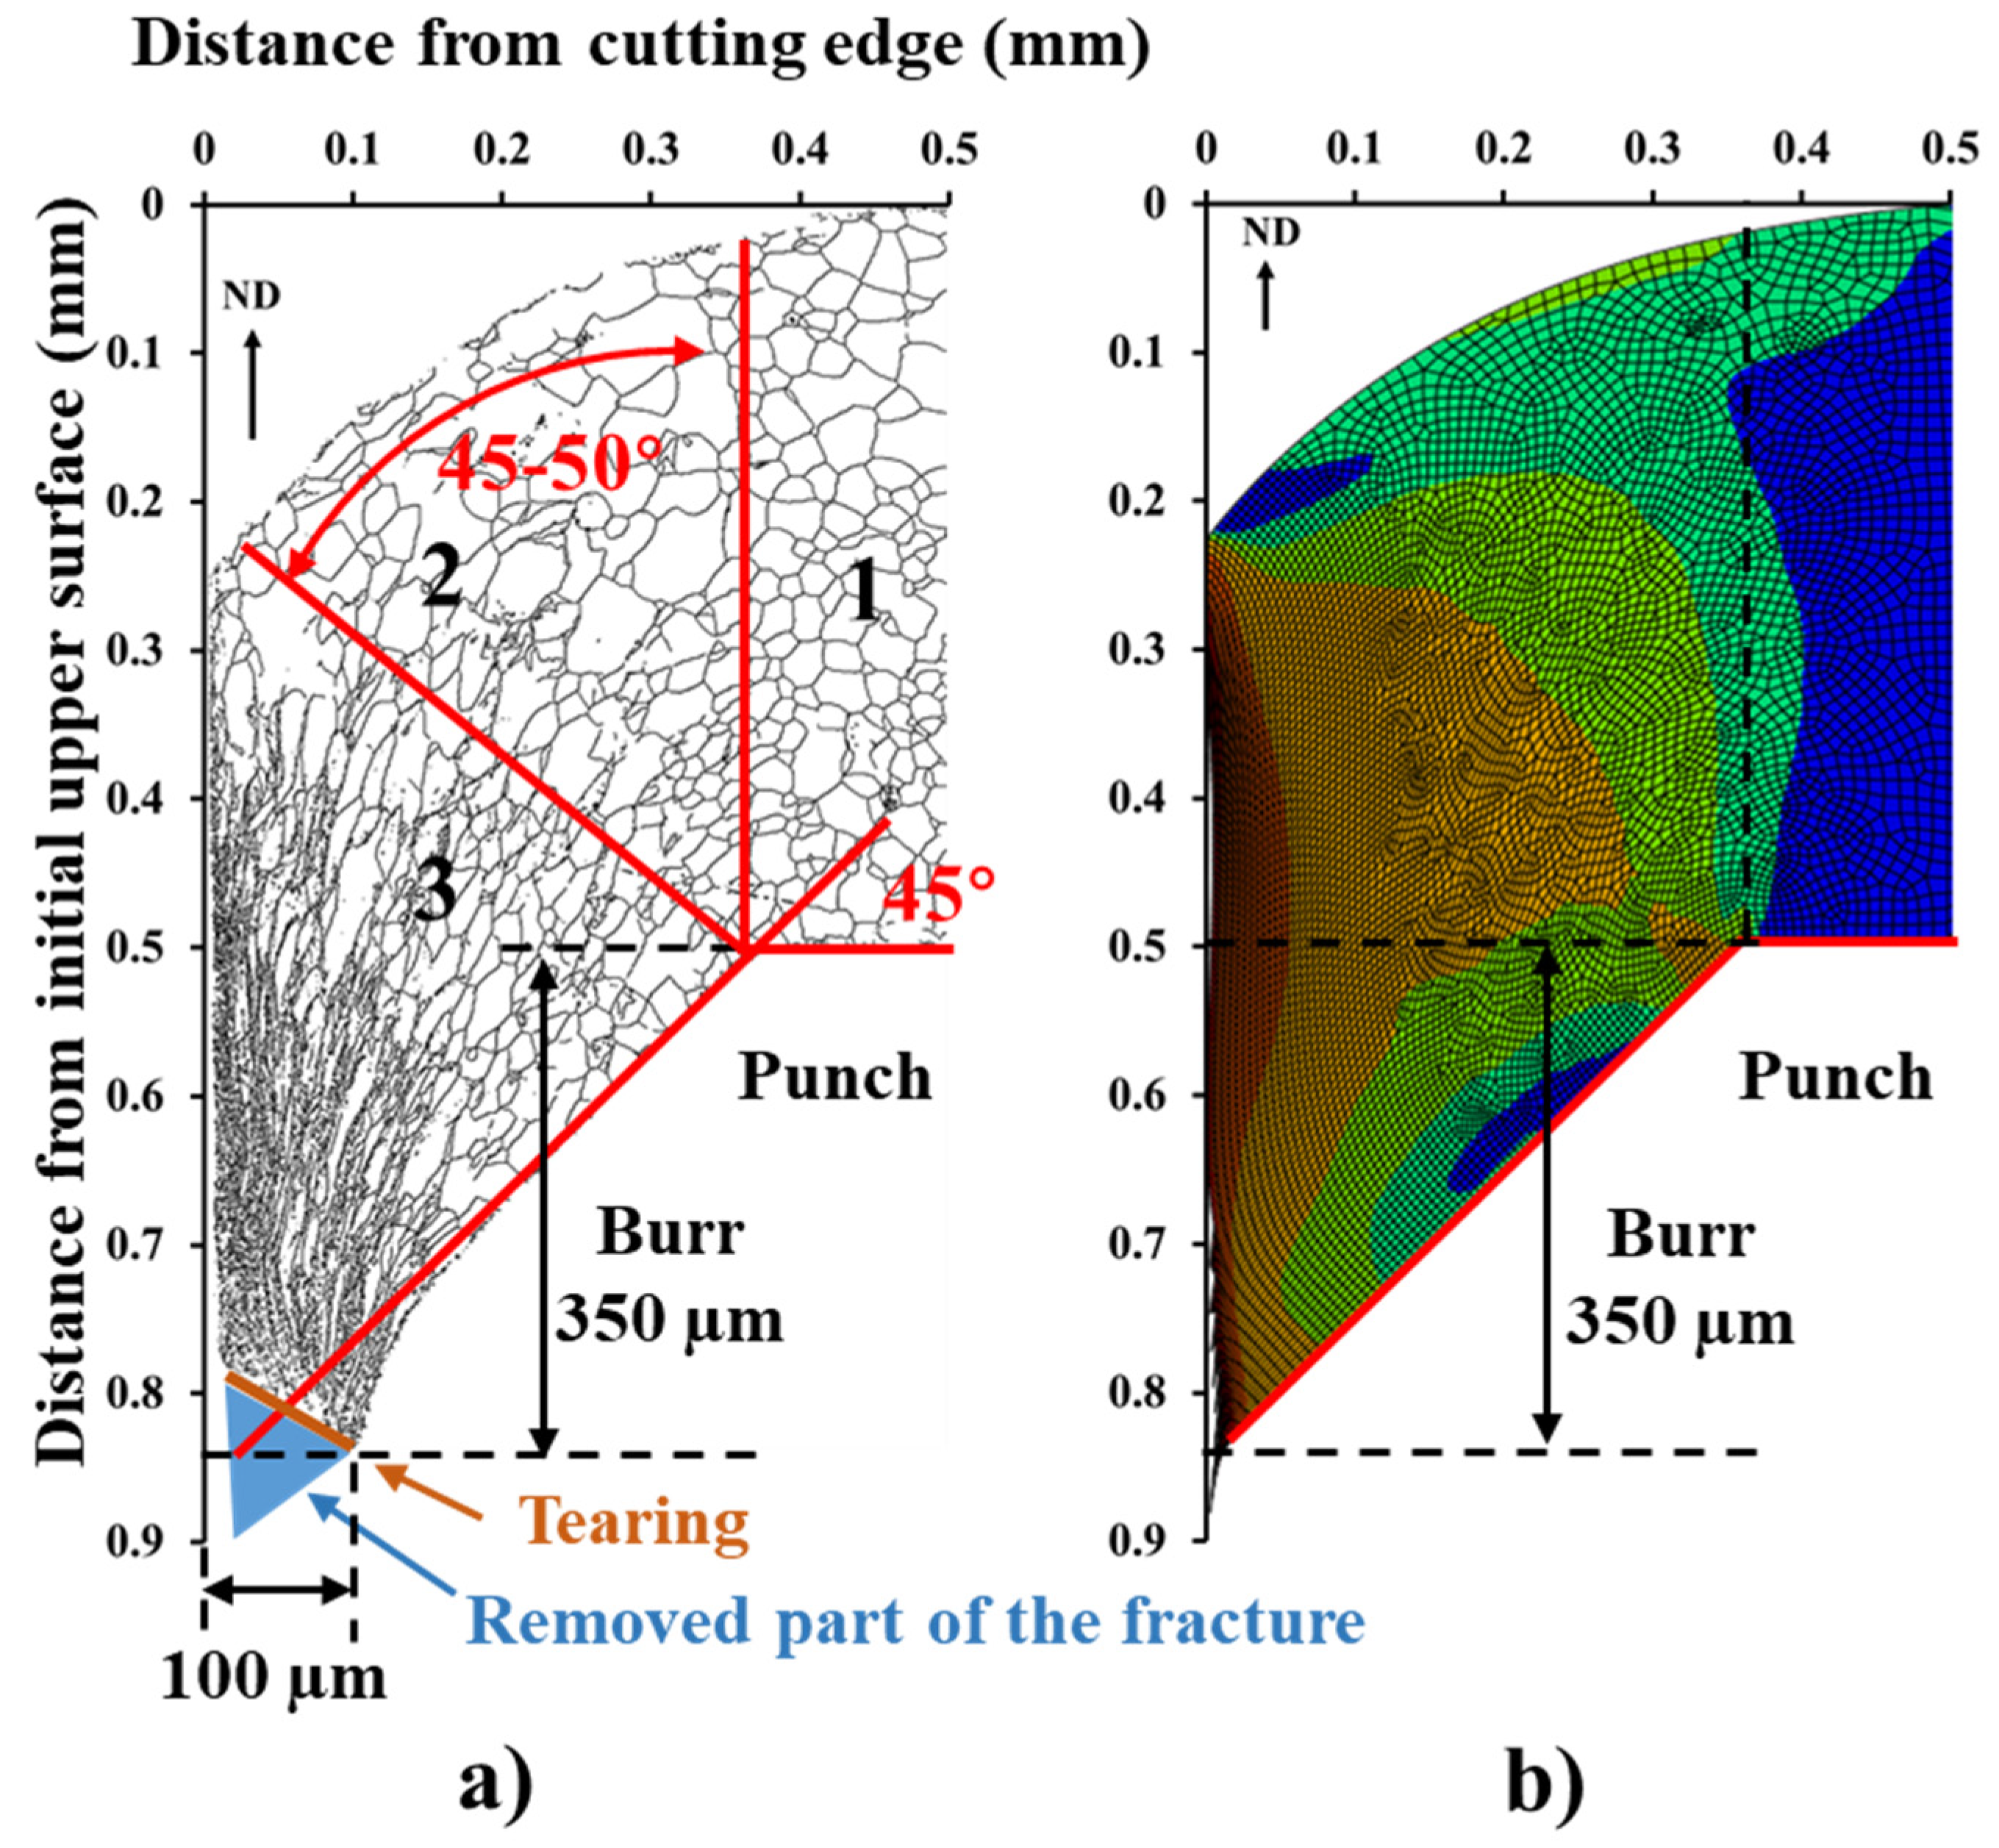
3.1. Deformation during Punching
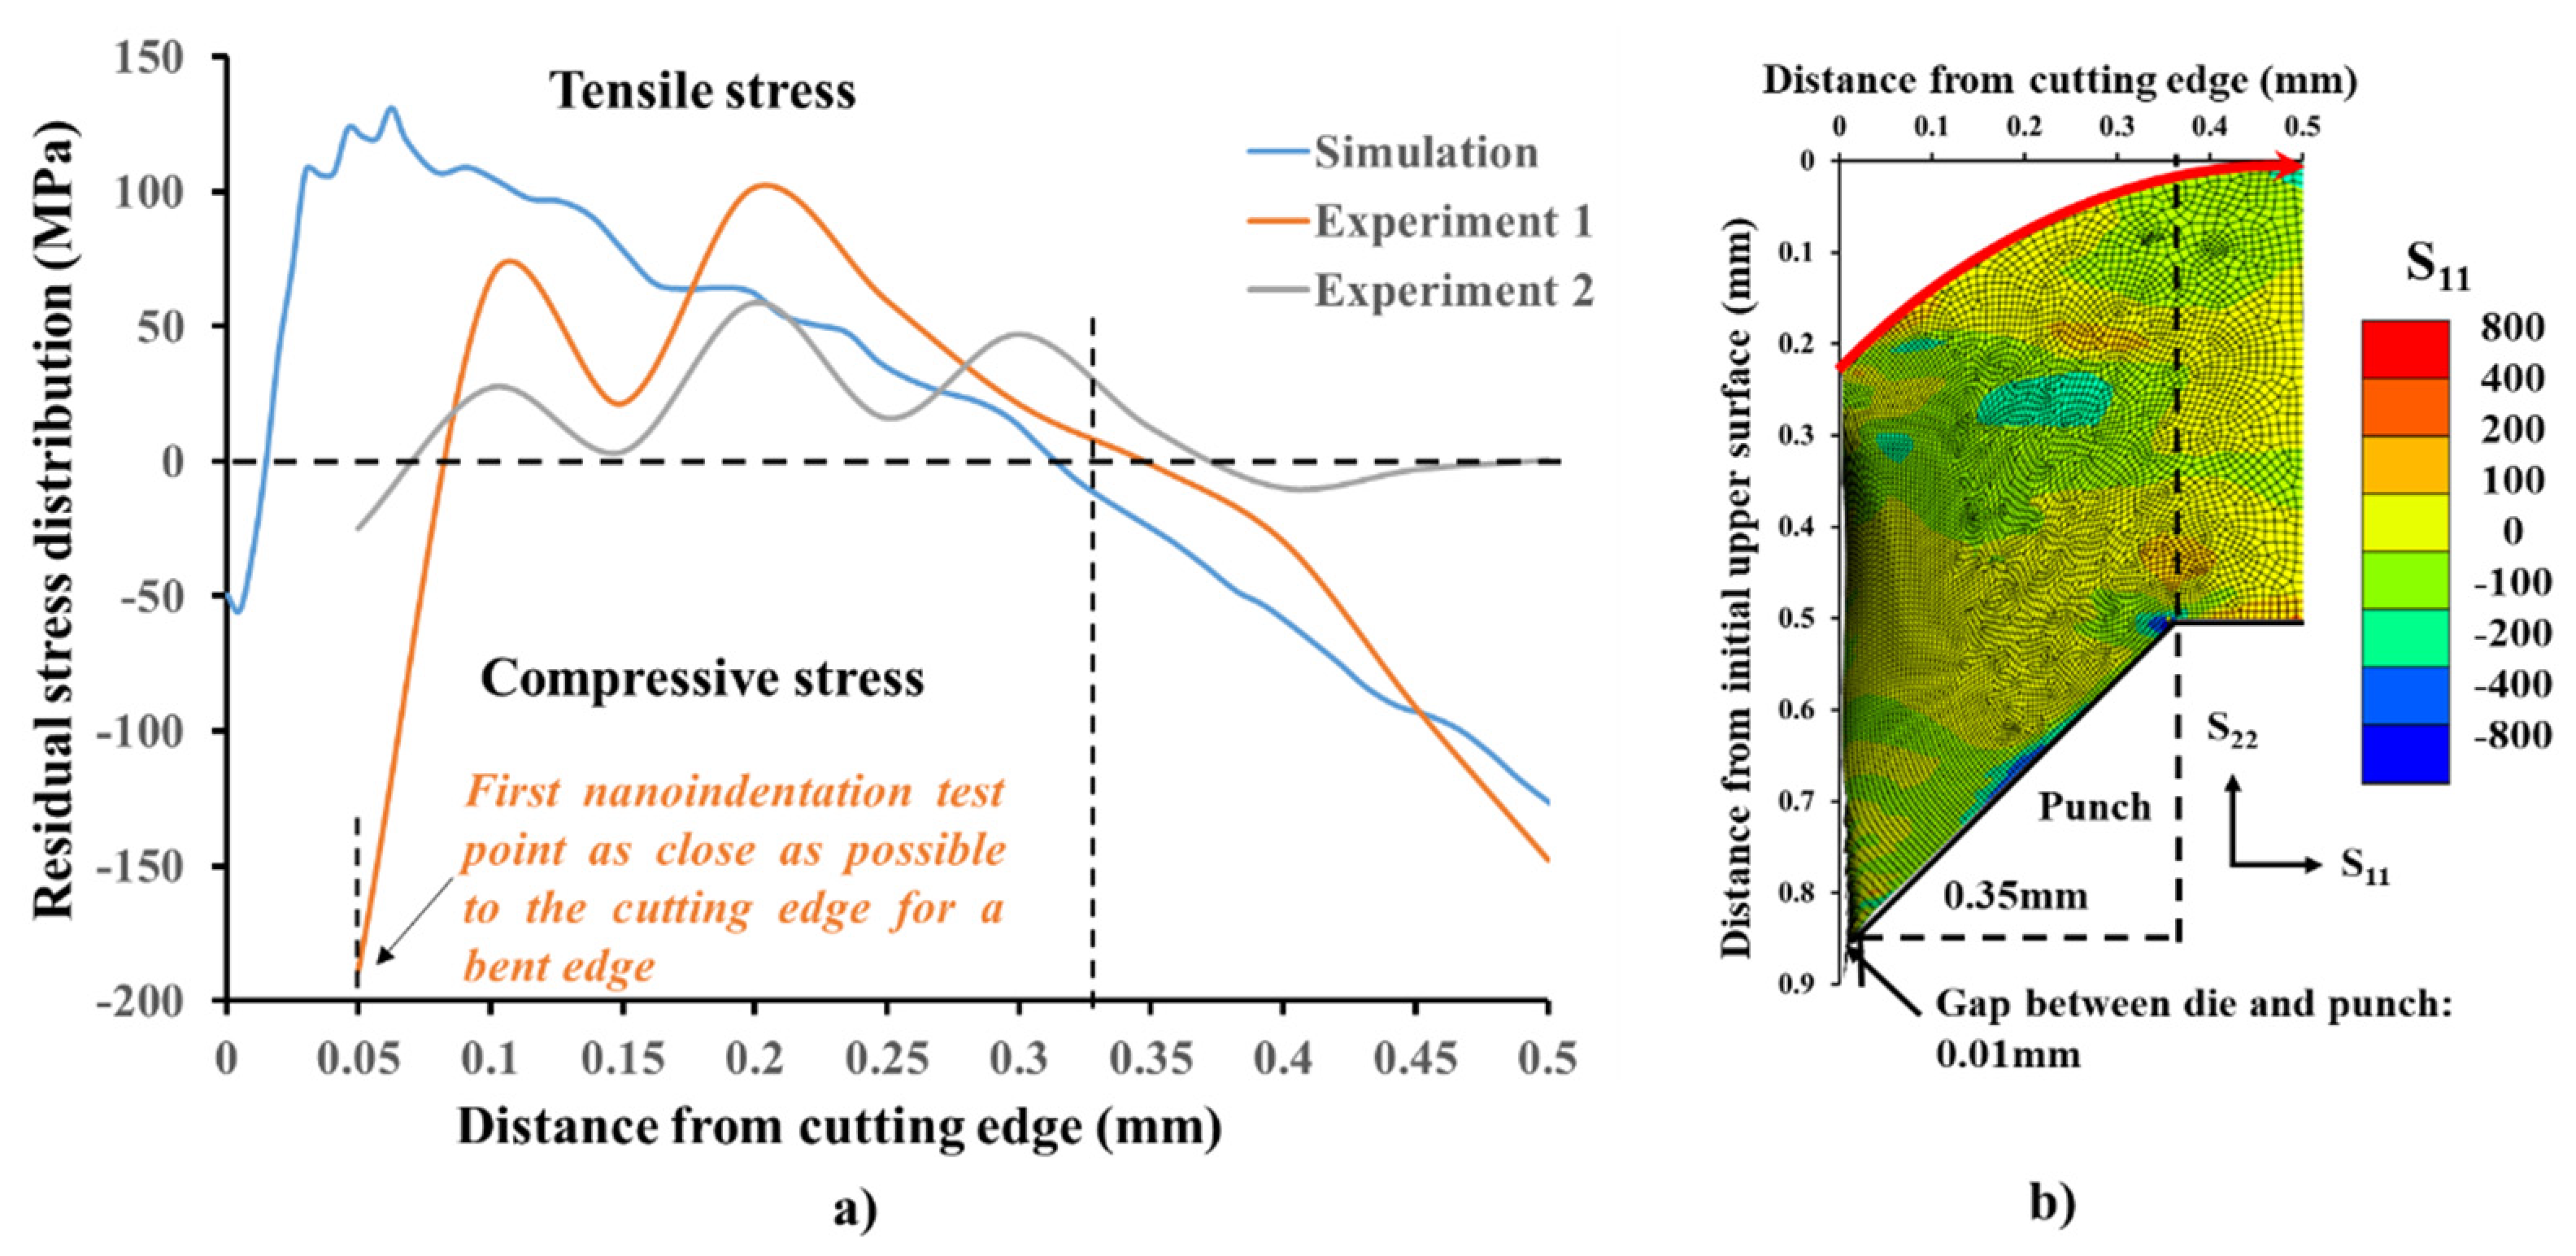
3.2. Residual Stress Distribution after Punching
3.3. Formation Mechanism of Tensile Stress on the Surface
4. Conclusions
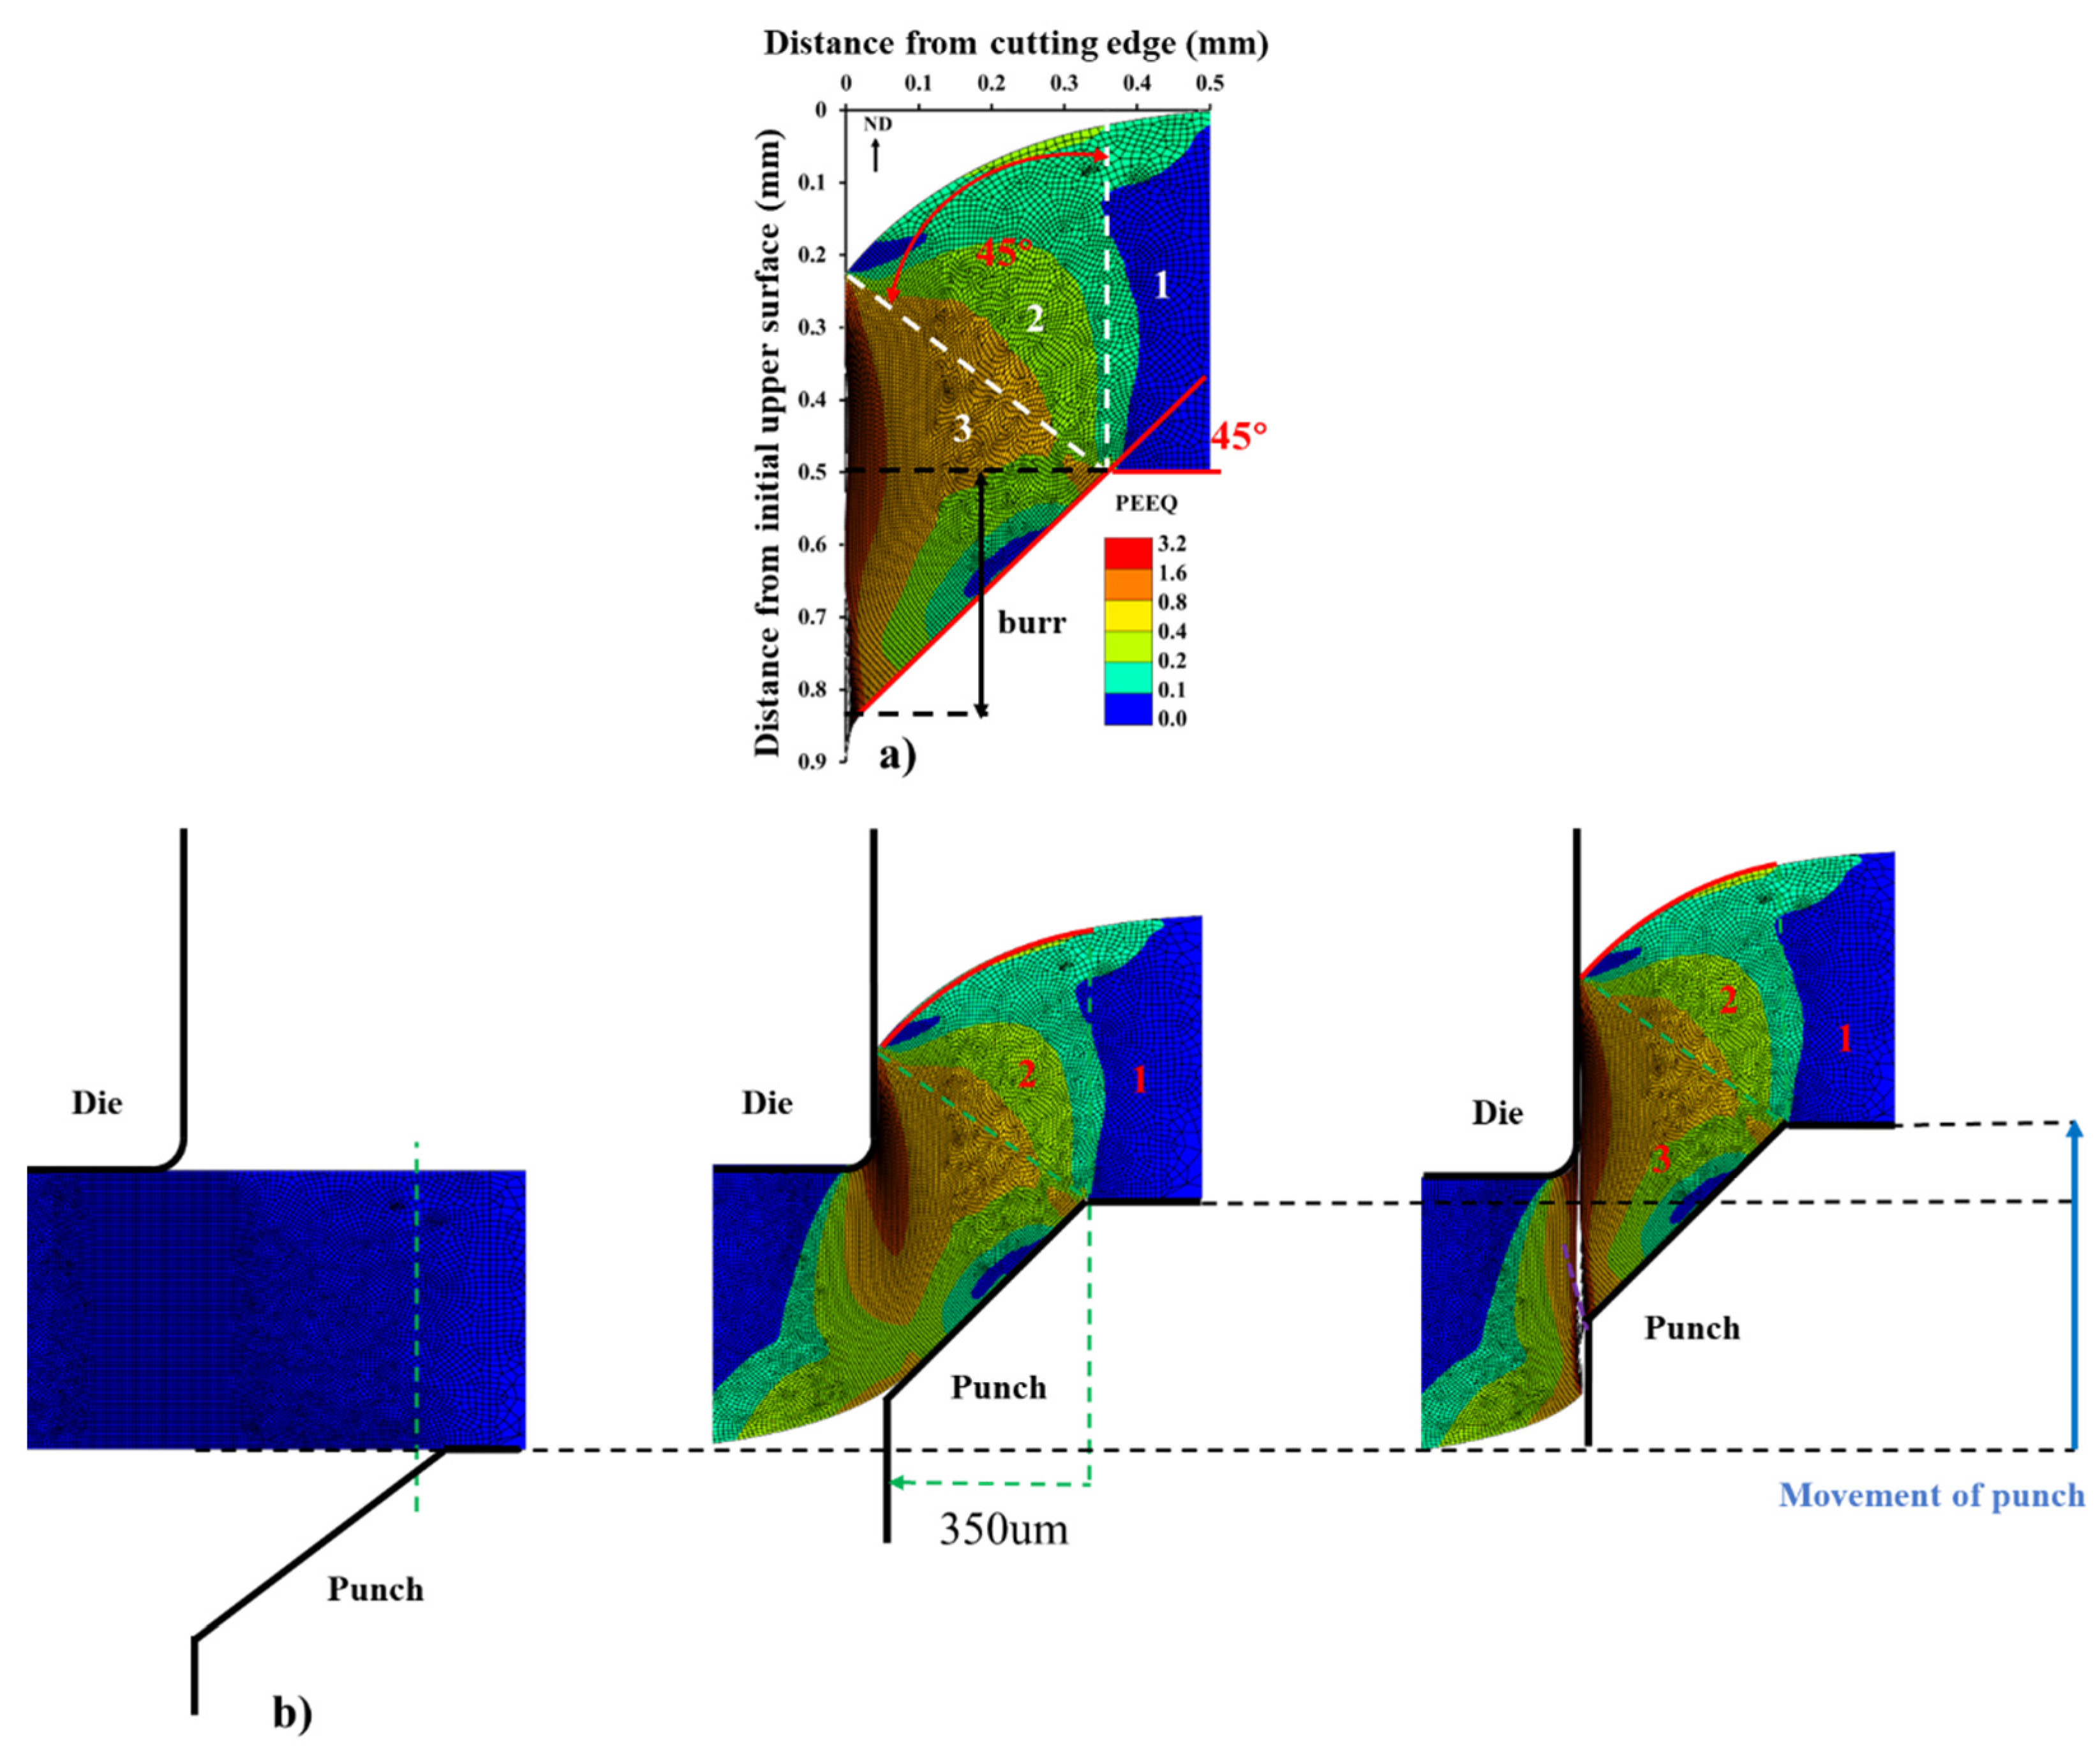
- (a)
- After the punching process using blunt tools, a large burr was formed and the cutting edge could be divided to three distinct areas: a highly deformed area, a bent area with moderate deformation and a non-deformed area. The closer to the cutting edge, the greater the plastic deformation.
- (b)
- The ribbon grains were formed in the highly deformed area, very close to the cutting edge. Dislocation slip and shear band formation were the deformation mechanisms. The mechanism of deformation in the bent area corresponds to only dislocation slip.
- (c)
- Tensile residual stress on the surface of punched sheet was observed, and the distribution width of tensile residual stress was about 0.33 mm.
- (d)
- The formation of tensile residual stress on the surface of a punched sample depends on the formation of a bent area with the blunt tools. Punch tools with high wear will form a large bending area at the cutting edge with a large and deep tensile stress region on the surface, which will be retained after punching.
Author Contributions
Funding
Data Availability Statement
Conflicts of Interest
References
- Saleem, A.; Alatawneh, N.; Chromik, R.R.; Lowther, D.A. Effect of Shear Cutting on Microstructure and Magnetic Properties of Non-Oriented Electrical Steel. IEEE Trans. Magn. 2016, 52, 1–4. [Google Scholar] [CrossRef]
- Peksoz, A.; Erdem, S.; Derebasi, N. Mathematical model for cutting effect on magnetic flux distribution near the cut edge of non-oriented electrical steels. Comput. Mater. Sci. 2008, 43, 1066–1068. [Google Scholar] [CrossRef]
- Cao, H.; Hao, L.; Yi, J.; Zhang, X.; Luo, Z.; Chen, S.; Li, R. The influence of punching process on residual stress and magnetic domain structure of non-oriented silicon steel. J. Magn. Magn. Mater. 2016, 406, 42–47. [Google Scholar] [CrossRef]
- Mori, K.; Abe, Y.; Kidoma, Y.; Kadarno, P. Slight clearance punching of ultra-high strength steel sheets using punch having small round edge. Int. J. Mach. Tools Manuf. 2013, 65, 41–46. [Google Scholar] [CrossRef]
- Naumoski, H.; Maucher, A.; Herr, U. Investigation of the influence of global stresses and strains on the magnetic properties of electrical steels with varying alloying content and grain size. In Proceedings of the 2015 5th International Electric Drives Production Conference (EDPC), Nuremberg, Germany, 15–16 September 2015; pp. 1–8. [Google Scholar]
- Aydin, U.; Rasilo, P.; Martin, F.; Belahcen, A.; Daniel, L. Effect of simultaneous plastic and elastic deformation on magnetic properties of electrical steel sheets. In Proceedings of the 64th Annual Conference on Magnetism and Magnetic Materials (MMM 2019), Las Vegas, NV, USA, 4–8 November 2019. [Google Scholar]
- Laakso, S.V.A.; Aydin, U.; Krajnik, P. Verification of electric steel punching simulation results using microhardness. Int. J. Adv. Manuf. Technol. 2021, 112, 2027–2036. [Google Scholar] [CrossRef]
- Singh, U.P.; Streppel, A.H.; Kals, H.J.J. Design study of the geometry of a punching/blanking tool. J. Mater. Process. Technol. 1992, 33, 331–345. [Google Scholar] [CrossRef] [Green Version]
- Saleem, A.; Goldbaum, D.; Brodusch, N.; Gauvin, R.; Chromik, R.R. Microstructure and mechanical property connections for a punched non-oriented electrical steel lamination. Mater. Sci. Eng. A 2018, 725, 456–465. [Google Scholar] [CrossRef]
- Chen, Y.-W.; Tsai, Y.-T.; Tung, P.-Y.; Tsai, S.-P.; Chen, C.-Y.; Wang, S.-H.; Yang, J.-R. Phase quantification in low carbon Nb-Mo bearing steel by electron backscatter diffraction technique coupled with kernel average misorientation. Mater. Charact. 2018, 139, 49–58. [Google Scholar] [CrossRef]
- Tiwari, A.K.; Kumar, A.; Kumar, N.; Prakash, C. Investigation on micro-residual stress distribution near hole using nanoindentation: Effect of drilling speed. Meas. Control 2019, 52, 1252–1263. [Google Scholar] [CrossRef] [Green Version]
- Suresh, S.; Giannakopoulos, A.E. A new method for estimating residual stresses by instrumented sharp indentation. Acta Mater. 1998, 46, 5755–5767. [Google Scholar] [CrossRef]
- Pathak, R.K.; Ravi Kumar, A.; Ananthasuresh, G.K. Simulations and experiments in punching spring-steel devices with sub-millimeter features. J. Manuf. Process. 2013, 15, 108–114. [Google Scholar] [CrossRef]
- He, J.; Li, S.; Dong, L. Experiments and FE simulation of edge cracking considering prehardening after blanking process. Int. J. Mater. Form. 2019, 13, 547–560. [Google Scholar] [CrossRef]
- Subramonian, S.; Altan, T.; Ciocirlan, B.; Campbell, C. Optimum selection of variable punch-die clearance to improve tool life in blanking non-symmetric shapes. Int. J. Mach. Tools Manuf. 2013, 75, 63–71. [Google Scholar] [CrossRef]
- Wang, X.; Shi, J. Validation of Johnson-Cook plasticity and damage model using impact experiment. Int. J. Impact Eng. IJIE 2013, 60, 67–75. [Google Scholar] [CrossRef]
- Dabboussi, W.; Nemes, J. Modeling of ductile fracture using the dynamic punch test. Int. J. Mech. Sci. 2005, 47, 1282–1299. [Google Scholar] [CrossRef]
- Poizat, C.; Campagne, L.; Daridon, L.; Ahzi, S.; Husson, C.; Merle, L. Modeling and simulation of thin sheet blanking using damage and rupture criteria. Int. J. Form. Process. 2005, 8, 29–47. [Google Scholar] [CrossRef]
- Børvik, T.; Hopperstad, O.; Berstad, T. On the influence of stress triaxiality and strain rate on the behaviour of a structural steel. Part II. Numerical study. Eur. J. Mech. A-Solids 2003, 22, 15–32. [Google Scholar] [CrossRef]
- Chen, Z.H.; Tang, C.Y.; Lee, T.C. An investigation of tearing failure in fine-blanking process using coupled thermo-mechanical method. Int. J. Mach. Tools Manuf. 2004, 44, 155–165. [Google Scholar] [CrossRef]
- Jin, X.; Fu, B.-Q.; Zhang, C.-L.; Liu, W. Evolution of the texture and mechanical properties of 2060 alloy during bending. Int. J. Miner. Metall. Mater. 2015, 22, 966–971. [Google Scholar] [CrossRef]
- Raabe, D. Recovery and recrystallization: Phenomena, physics, models, simulation. Phys. Metall. 2014, 23, 2291–2397. [Google Scholar] [CrossRef]
- Chan, L.C.; Leung, Y.; Lee, T.; Fan, J.; Tang, C.Y. Numerical simulation for fine-blanking—A new approach. Mater. Sci. Eng. A 2004, 364, 207–215. [Google Scholar] [CrossRef]
- Romanowski, W.P. Spravochnik po Holodnoj Shtampovke, 6. Leningrad Mashinostroenie, Leningradskoe Otdelenie. 1979, pp. 15–16. Available online: https://spbarchives.ru/infres/-/archive/cgantd/R-53 (accessed on 17 April 2019).


| Alloy | Chemical Composition | Mechanical Properties | |||||
|---|---|---|---|---|---|---|---|
| Si | Al | Mn | Fe | Tensile Strength (MPa) | Elongation | Young’s Modulus (GPa) | |
| 50WW1300 | 0.63 | 0.23 | / | Bal. | 384.71(RD)387.79(TD) | 44.40%(RD)45.01%(TD) | 184 |
| Clearance | d1 (mm) | d2 (mm) | dc (mm) | θc | r1 (mm) | r2 (mm) | c1 (mm) | c2 (mm) | t (mm) |
|---|---|---|---|---|---|---|---|---|---|
| 4% | 29.980 | 30.000 | 0.350 | 45° | 0.005 | 0.050 | 0.020 | 0.010 | 0.500 |
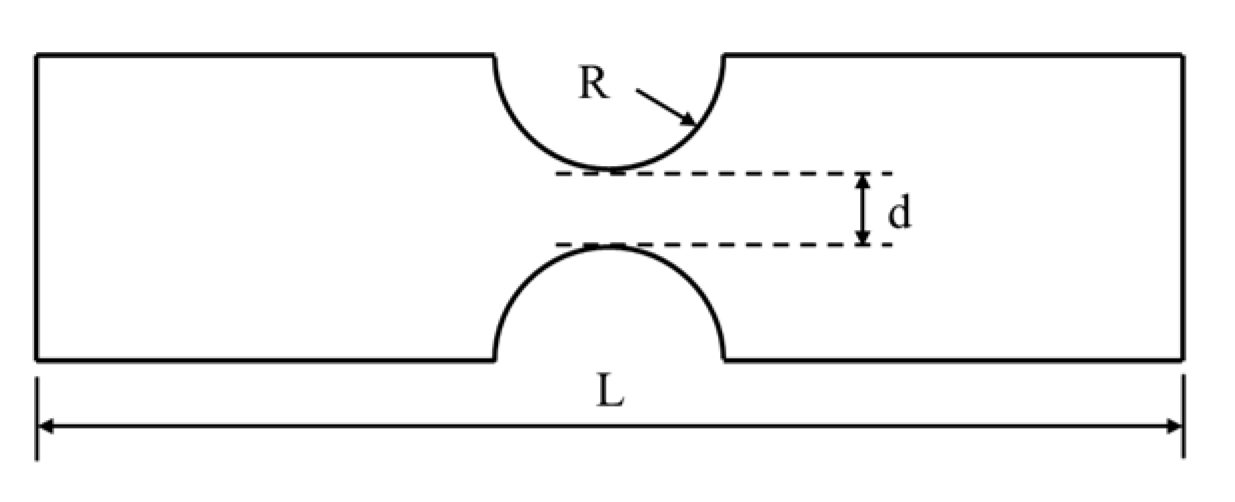
| Sample | Stress Triaxiality | L (mm) | d (mm) | R (mm) |
|---|---|---|---|---|
| A | 0.335 | 110 | 10 | 15 |
| B | 0.338 | 110 | 10 | 5 |
| C | 0.346 | 110 | 10 | 2 |
| D | 0.358 | 110 | 10 | 1 |
| E | 0.380 | 110 | 10 | 0.5 |
| Parameter | A (Mpa) | B (Mpa) | C | n |
|---|---|---|---|---|
| Value | 267 | 749.95 | 0.064 | 0.8 |
| Failure Parameter | d1 | d2 | d3 | d4 |
|---|---|---|---|---|
| Value | 0.028 | 3.2*E11 | 84.27 | −0.4 |
Publisher’s Note: MDPI stays neutral with regard to jurisdictional claims in published maps and institutional affiliations. |
© 2021 by the authors. Licensee MDPI, Basel, Switzerland. This article is an open access article distributed under the terms and conditions of the Creative Commons Attribution (CC BY) license (https://creativecommons.org/licenses/by/4.0/).
Share and Cite
Wang, W.; Fang, X.; Wang, X.; Andrieux, M.; Ji, V. Mechanism of Blunt Punching Tools’ Influence on Deformation and Residual Stress Distribution. Metals 2021, 11, 2029. https://doi.org/10.3390/met11122029
Wang W, Fang X, Wang X, Andrieux M, Ji V. Mechanism of Blunt Punching Tools’ Influence on Deformation and Residual Stress Distribution. Metals. 2021; 11(12):2029. https://doi.org/10.3390/met11122029
Chicago/Turabian StyleWang, Wei, Xiang Fang, Xuanguo Wang, Michel Andrieux, and Vincent Ji. 2021. "Mechanism of Blunt Punching Tools’ Influence on Deformation and Residual Stress Distribution" Metals 11, no. 12: 2029. https://doi.org/10.3390/met11122029