Article

Investigation of the Self-Heating of Q460 Butt Joints and an S-N Curve Modeling Method Based on Infrared Thermographic Data for High-Cycle Fatigue

1
School of Materials Science and Engineering, Dalian Jiaotong University, Dalian 116028, China
2
Liaoning Key Laboratory of Welding and Reliability of Rail Transportation Equipment, Dalian Jiaotong University, Dalian 116028, China
*
Author to whom correspondence should be addressed.
Metals 2021, 11(2), 232; https://doi.org/10.3390/met11020232
Submission received: 29 December 2020 / Revised: 23 January 2021 / Accepted: 24 January 2021 / Published: 29 January 2021
(This article belongs to the Section Metal Failure Analysis)

Abstract

:
In this study, we investigated the fatigue behavior of Q460 welded joints using tensile fatigue tests. Furthermore, real-time temperature profiles of the examined specimens were recorded by infrared thermography. Based on the obtained thermographic data, we calculated the entropy production rate of the specimens under different stress amplitudes. Hypothetically, the entropy production during high-cycle fatigue (HCF) could be divided into two parts. The first is induced by inelastic behavior that corresponds to damage accumulation, and the second originates from anelasticity associated with recoverable non-damaging microstructural motions. The turning point of entropy production under different stress levels represents an index for fatigue limit estimation. Then, considering the average damage threshold that exists during HCF, the entropy production related to damage accumulation (cumulative damage entropy) is obtained by testing three specimens under the same stress amplitude above the fatigue limit. Finally, a rapid three-parameter S-N curve with a survival probability rate of 50% is obtained. Then, combined with the maximum likelihood method, the 5% and 95% survival probability rate S-N curves are established. Most of experimental data are distributed in the area between S-N curves that correspond to 5% and 95% survival probability rate, indicating good accordance with the test data.

1. Introduction

Fatigue fracture is a primary failure of mechanical structures during their service life [1,2,3,4]. Many catastrophic accidents were caused by structural fatigue fractures, generating severe economic losses [5]. Thus, a reliable prediction of fatigue performance is of crucial significance in engineering applications. Traditional fatigue evaluation methods based on extensive experimental data are time-consuming and tedious, so alternatives that shorten test duration and realize a rapid fatigue reliability evaluation of mechanical components during high-cycle fatigue (HCF) are required.
Thermography methods enable in-situ, non-contact, and non-invasive characterization of fatigue performance. Infrared thermography imagers measure the temperature field data of the investigated specimen, which are further used to predict the fatigue limit [6,7,8,9,10] and service life [11,12,13,14], structural health monitoring [15], and crack detection [16,17]. However, temperature-dependent thermography methods fail to reveal the distinct physical background and the nature of fatigue evolution, limiting its further application and development.
HCF evolution is accompanied by energy dissipation [18], and considerable progress has been achieved in the rapid assessment of the fatigue performance by utilizing energy dissipation. Guo et al. [18,19,20] studied the HCF behavior of FV520B stainless steel specimens based on the energy dissipation model for S-N curve prediction and fatigue limit evaluation. Fan et al. [21] established a unifying energy dissipation method for the Q235 steel fatigue reliability assessment. Teng et al. [22] developed a unified thermal dissipation model derived from the literature to estimate the fatigue life of SAE1045 medium-carbon steel. These methods mainly follow some basic assumptions: (i) energy dissipation during HCF is composed of anelasticity and microplasticity; (ii) microplasticity contributes mostly to HCF damage accumulation, whereas the anelastic behavior is recognized as non-damaging. Based on these hypotheses, rapid fatigue evaluation methods during HCF based on energy dissipation are well developed.
Fatigue represents the evolution of the disorder. When any disorder, such as grain size inhomogeneity, microscopic dislocations, or other irreversible microstructure changes, evolves, [18,22], it may cause an increase in irreversible entropy production behind energy dissipation during HCF. Thus, researchers have investigated thermodynamic entropy methodology to characterize fatigue performance and unveil the nature of the fatigue process. For low-cycle fatigue (LCF), Naderi et al. [23,24,25] reported the irreversible entropy model to evaluate fatigue damage and structural life monitoring. Ribeiro et al. [26] experimentally calculated the threshold entropy of Al-2024 specimen during an LCF process and compared the results with empirical Park and Nelson’s model. Salimi et al. [27] proposed a temperature evolution prediction model, and this model was used for the life prediction and thermodynamic entropy production estimation. Other relevant entropy-based LCF assessments used in the fatigue life prediction [28,29] and cumulative damage evaluation [30] also provide a good example of entropy application. In the developed LCF model, its thermodynamic entropy generation is estimated by calculating the hysteresis loop area. However, for an HCF process, the hysteresis loop area is very small and hardly measurable. Therefore, an entropy-based model for fatigue life assessment for the HCF evaluation is of the greatest importance.
Teng et al. [31] regarded thermodynamic entropy as a marker to monitor fatigue damage of normalized SAE 1045 steel during HCF. Huang et al. [32] investigated the internal friction of Carbon Fiber Reinforced Polymer (CFRP) and calculated the entropy generation during HCF. Subsequently, they realized the fatigue limit prediction and S-N curve estimation through the developed entropy model. These investigations pointed out the use of thermodynamic entropy during HCF. However, more extensive studies about the HCF evaluation using entropy are missing, and the basic precondition assumptions are still elusive. Consider that the HCF evolution is a process accompanied by energy dissipation, comprising anelastic dissipation and microplasticity dissipation, as mentioned above. The anelastic dissipation relates to recoverable motions, while microplasticity dissipation addresses an increase in irreversible damage. Thus, combined with the basic assumptions of the energy dissipation model for the HCF assessment, some hypotheses of entropy production combined with the representative volume element (RVE) model during HCF are generalized as follows:
(1)
Entropy production during HCF is mainly induced by recoverable motions (anelasticity) and irreversible microstructural changes (microplasticity);
(2)
Irreversible microstructural changes contribute to damage accumulation, whereas the anelasticity is regarded to be non-damaging.
This paper aims to develop a cumulative damage entropy (CDE) method to reach a three-parameter S-N curve prediction rapidly based on the hypotheses mentioned above. Fatigue tests of Q460 welded joints were implemented, applying IR thermography simultaneously. The entropy production during HCF, calculated based on acquired thermography data, was supposed that could be divided into entropy production induced by non-damaging anelasticity and entropy production related to damage accumulation. The turning point of entropy production with the increasing stress level was then identified as an indicator for the fatigue limit estimation. Finally, the average CDE under a certain amplitude was calculated to rapidly predict the three-parameter S-N curve of Q460 welded joints.

2. Energy Dissipation Framework during HCF

2.1. RVE Model

As well described in the cited references [18,33], the damage in HCF caused by microplasticity, such as dislocations or other irreversible microstructure motions, hypothetically occurs at a microscopic scale. The applied stress in HCF is lower than the material’s macroscopic yield strength, inducing an elastic shakedown [21,22]. However, the microplastic sites can be activated on a microscopic scale because of the stress concentration resulting from the localized dislocations or inconsistent grain boundaries. Eventually, the permanent microscopic damage may consistently accumulate until a fracture occurs.
Doudard et al. [33] developed an RVE model to evaluate the damage accumulation during HCF induced by inelastic behavior. The model is divided into two parts: (i) elastic matrix; (ii) elastoplastic inclusion, as shown in Figure 1. The elastic matrix, which surrounds the circular area (elastoplastic inclusion), characterizes the elastic behavior of grains and non-damaging microstructural evolution. Elastoplastic inclusion describes microplastic or inelastic evolution, leading to damage accumulation during HCF. It is assumed that these two parts have the same elastic behavior. Still, the yield strength of the elastoplastic inclusion is smaller than the macroscopic yield stress in the elastic matrix. The relationship between the macroscopic yield stress tensor, Σ, and the microscopic yield stress tensor, σ, according to the theory of localization and homogenization, is expressed as follows:
σ = Σ 2 μ ( 1 β ) ε ˙ p
where ε ˙ p is the strain tensor, β = 2(4 − 5ν)/15(1 − ν) characterizes a spherical inclusion based on Eshelby analysis, μ is the shear modulus, andν is the Poisson ratio.
Equation (1) correlates both the microscopic and macroscopic stress tensors and the strain tensor. The microscopic yield stress is lower than the macroscopic yield stress. Therefore, some sites within the elastoplastic inclusion may be activated due to stress concentration, especially in a weld toe, initiated by microstructural discontinuity or micro-defects. Thus, the microplastic behavior in the RVE area contributes to the damage accumulation during HCF. Dissipated energy per unit of cycle, corresponding to irreversible microstructural motions, is given as follows [21]:
d R V E = 4 η D + 3 μ ( 1 β ) y Σ a y
where dRVE is the microplastic energy dissipation related to damage accumulation, η is the volume fraction of plastic strain coefficient in VRVE, D is a constant, and the brackets <⋅> denote that a value inside the brackets, ·, is positive. This equation indicates that the microplastic dissipated energy is zero when Σa equals the material’s fatigue limit, Σy.

2.2. Intrinsic Dissipation

The fatigue evolution of materials will lead to energy dissipation [34]. The increase in the specimen surface temperature within the gauge part is an important manifestation of energy dissipation. According to the basic viewpoint of continuum mechanics, the HCF behavior of materials can be regarded as a quasi-static process [35]. An HCF process can be expressed as follows [19,20,35]:
ρ C T ˙ d i v ( k g r a d T ) = d 1 + s t h e + s i c + r e
where ρ, c, and k represent the density, specific heat capacity, and thermal conductivity of the material, respectively. On the left side of Equation (3), ρCṪ is the heat storage rate caused by the temperature increase, div(kgradT) is the thermal loss due to heat conduction. On the right side of Equation (3), d1 denotes the intrinsic dissipation, sthe represents thermoelastic source, sic is the heat source caused by coupling of the internal variable and temperature, and re is the external volumetric heat source.
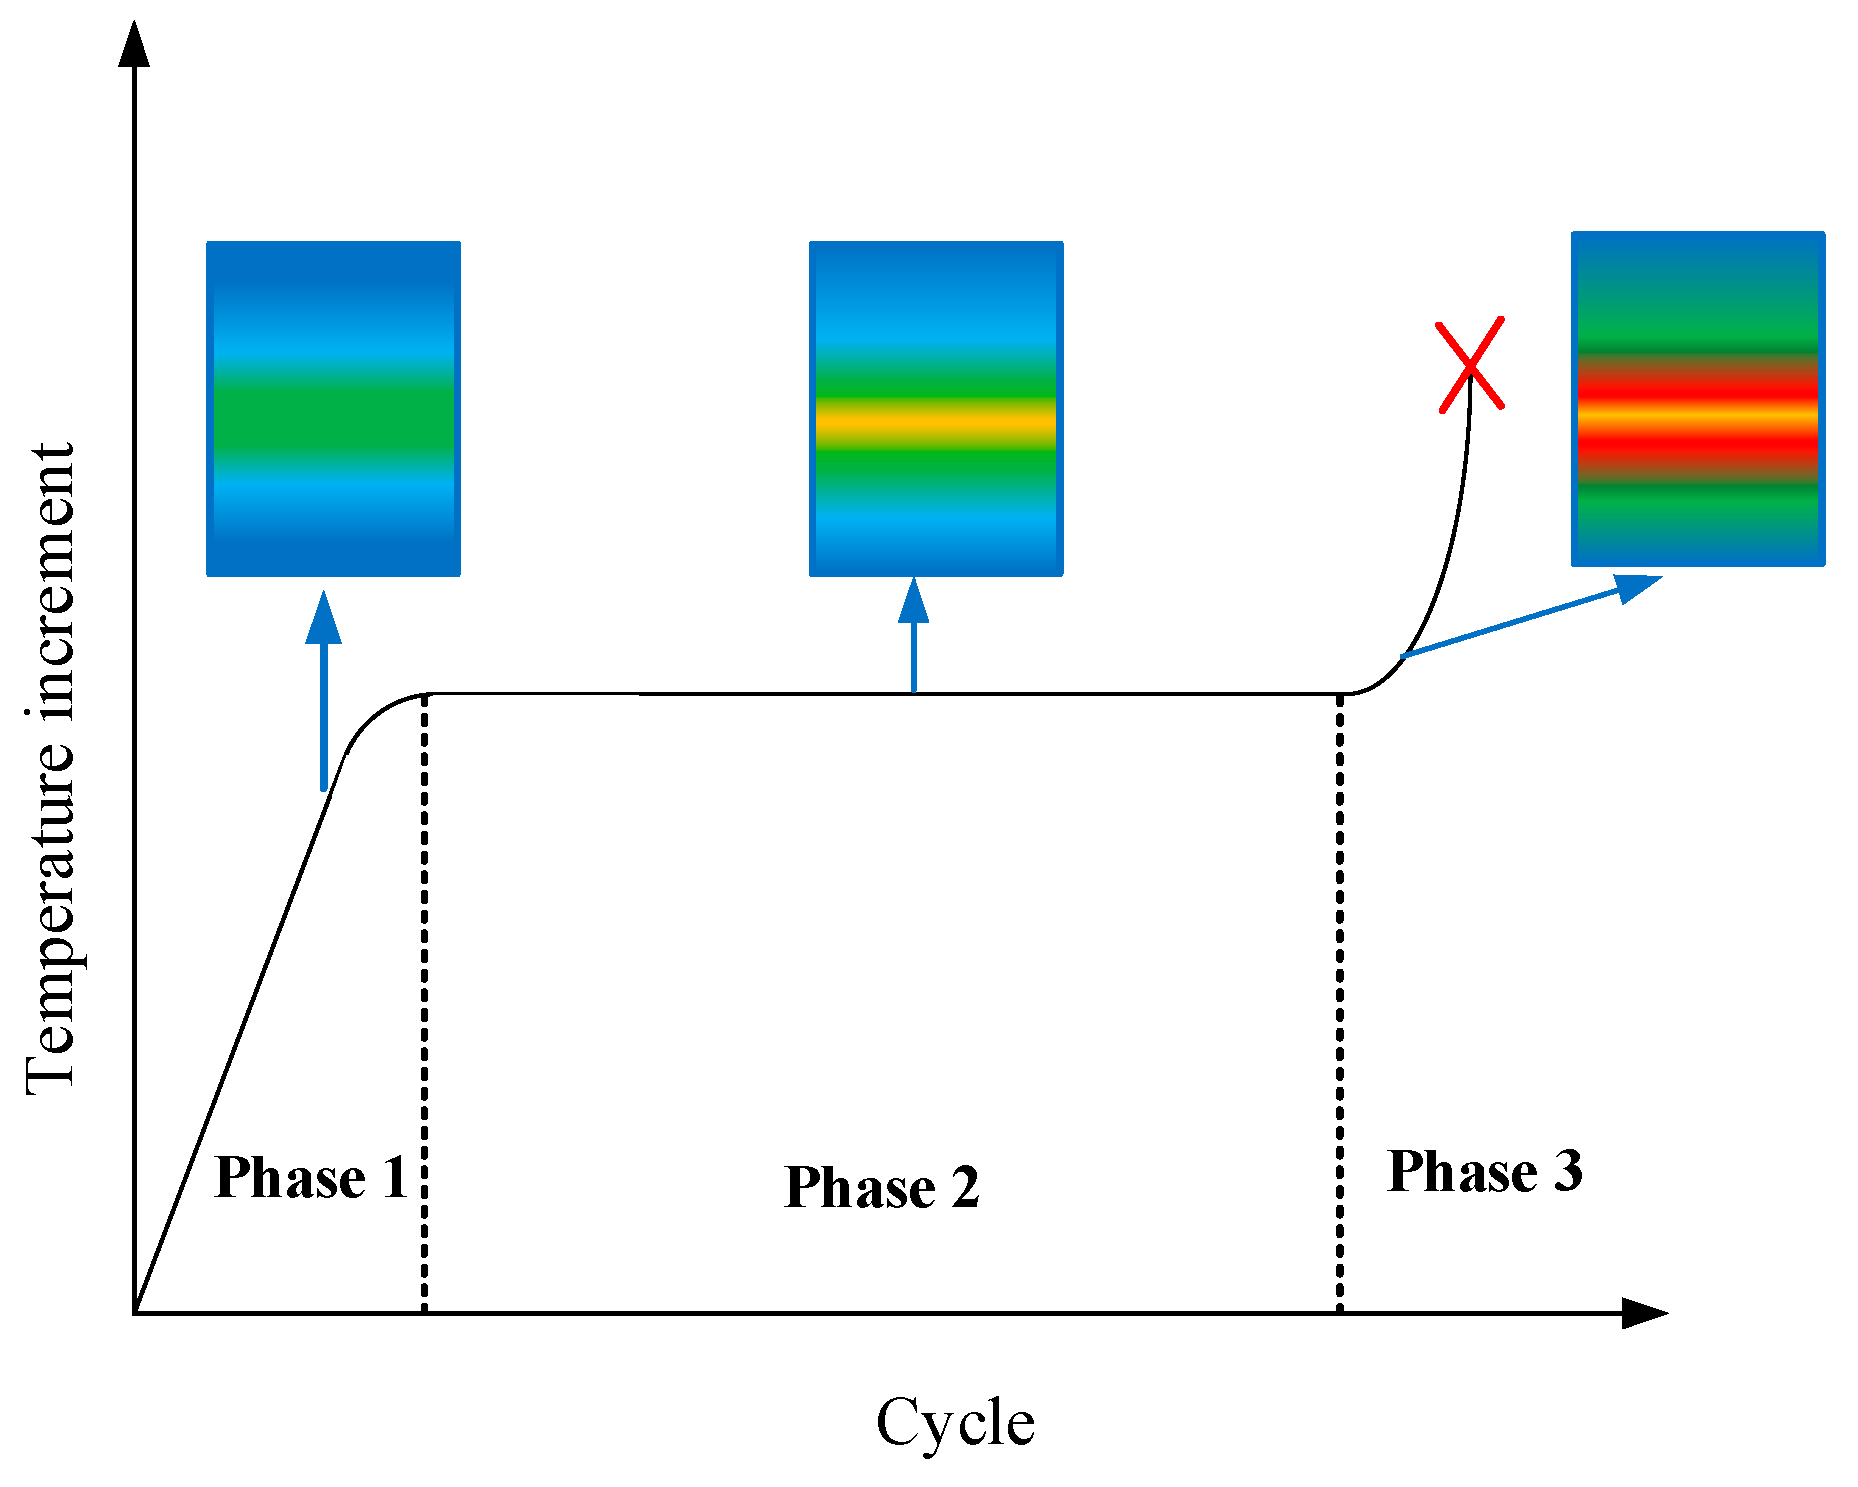
The temperature increase in the fatigue test can be divided into three phases [34,36]: the initial temperature increase (Phase I); the stable temperature increase (Phase II); and the rapid temperature increase (Phase III) (as shown in Figure 2).
Based on Equation (3) and an assumption that thermal conduction along the transverse and vertical directions of the specimen is almost negligible as the length of gauge area is several times the width and thickness of gauge area, we can define an equation of one-dimensional energy conservation of the specimen within the gauge area at any time of the fatigue process as follows [19,20]:
ρ C { θ ( x , t ) t } k { 2 θ ( x , t ) x 2 } = s t h e ( t ) + d 1 ( t )
In this equation, θ(x) denotes the temperature increase value within the gauge area, x is the coordinate of the one-dimensional temperature field, and t is time. For HCF, the temperature oscillation caused by sthe can be offset during the overall fatigue evolution [20]. Thus, Equation (4) can be reduced to:
ρ C { θ ( x , t ) t + θ ( x , t ) τ e q } k { 2 θ ( x , t ) x 2 } = d 1 ( t )
Hence, Equation (5) represents well the energy transformation during the fatigue process expression. Herein, ρ c θ ( x , t ) t denotes the heat storage rate, k θ 2 ( x , t ) x 2 represents the heat transfer by heat conduction, τeq is time constant related to thermal convection and radiation [37], and d1(t) is the intrinsic dissipation. Since the temperature variation inclines to be asymptotic in Phase II, Equation (5) can be simplified to calculate the dissipation value [21]:
d 1 ( t ) = ρ C θ τ e q
where θ is the temperature increment within the gauge area, and τeq can be calculated referring to Equation (7):
τ e q = ρ C w 0 v 0 2 h ( w 0 + v 0 )
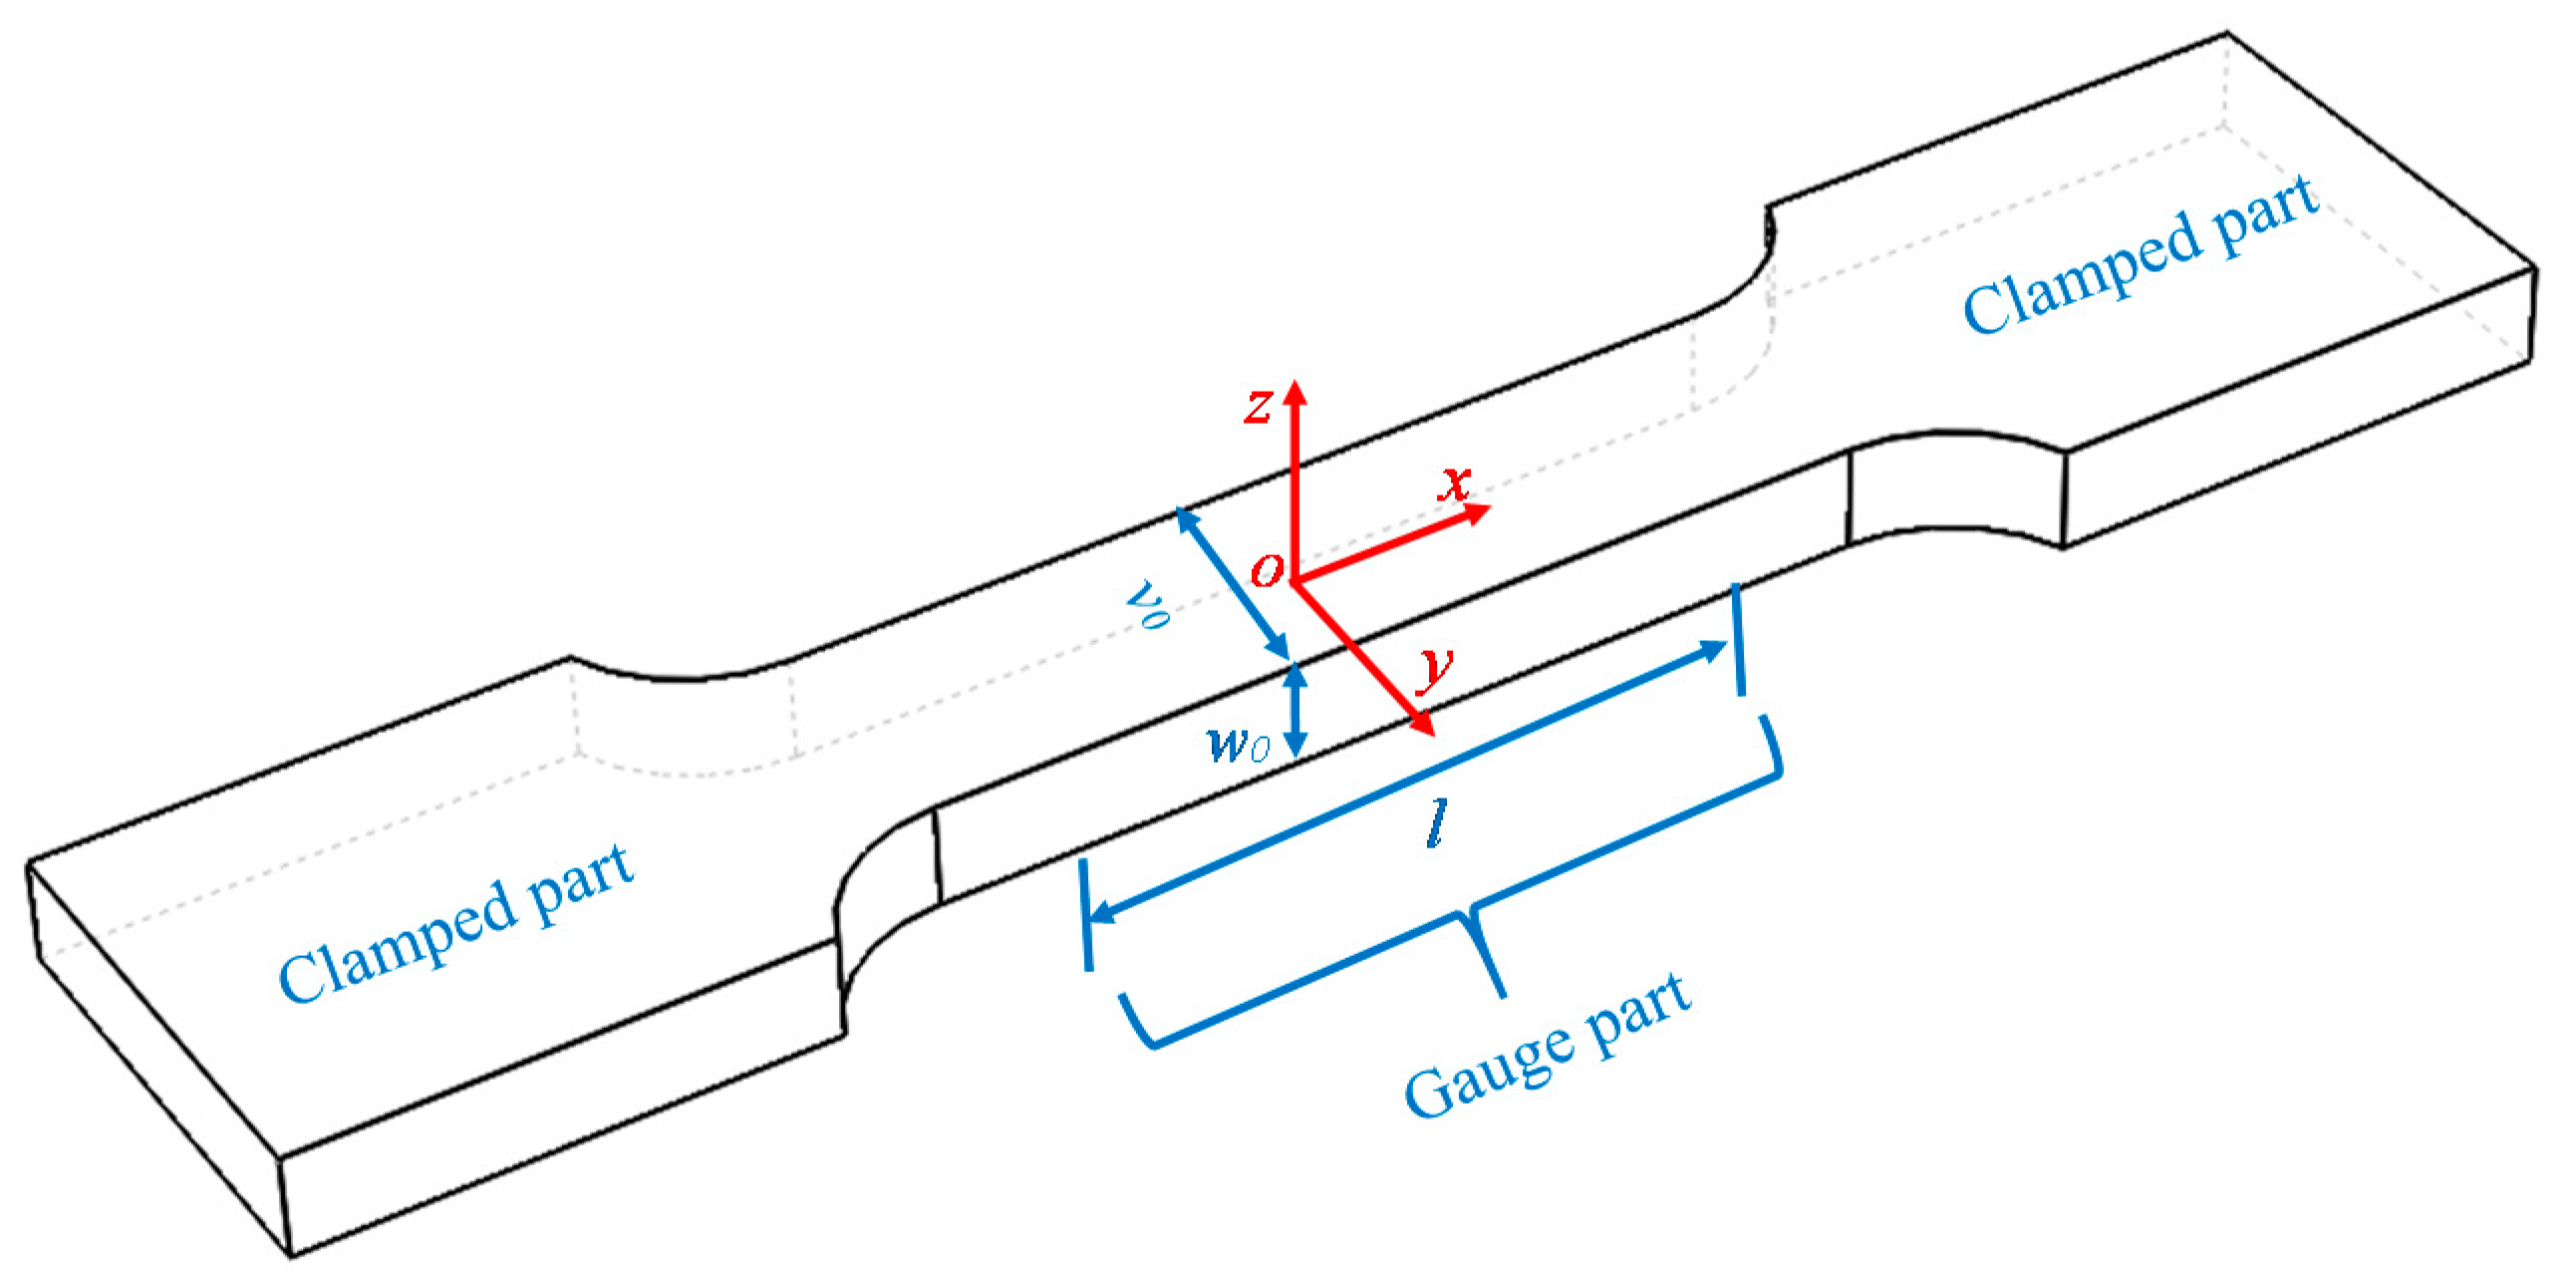
In this equation, w0 and v0 are the width and thickness of the specimen’s gauge part, respectively, as shown in Figure 3. h is a coefficient that relates to radiation and convection, which can be expressed as follows:
h = h r + h c
where hr = εσ(T2 + T02)(T + T0) is the radiation coefficient, ε is thermal emissivity, σ is Stefan–Boltzmann constant, hc is the convection coefficient. Thus, hc can be derived as follows [38]:
h c = 0.59 k a ( 0.71 g λ T e 2 ) 0.25 l 1 4
where
ka is the heat conduction coefficient, e is the kinematic viscosity that refers to [39], and λ = 1/Tf and Tf = (Tb + Tr)/2 are the volume expansion coefficient and film temperature, respectively. T b is the specimen boundary temperature, and T r is the room temperature, g is gravitational acceleration that equals 9.8 m/s2. ΔT = TbTr is the temperature difference between the wall temperature and room temperature, which represents the heat exchange with the external part, and l is the gauge length of the specimen, as shown in Figure 3.
The intrinsic dissipation in Phase II can be calculated by Equation (6), and then, combined with the RVE model, the intrinsic dissipation is composed of inelastic dissipation, din, and anelastic dissipation, dan, which is expressed as follows [20]:
d 1 = d a n + d i n
Here, it should be noted that inelastic dissipation din, which is equal to f · dRVE [21], mainly contributes to the damage accumulation during HCF, induced by microstructural evolution, such as dislocation intersection or dislocation pile-up. The accumulated microstructural changes lead to an entropy increase and may yield fatigue fracture. Anelastic dissipation, induced by recoverable motions such as internal friction, is considered to account for a very small part of the damage, or it is non-damaging to materials during HCF.

3. Thermodynamic Entropy

3.1. Cumulative Damage Entropy (CDE) Calculation

Energy dissipation exists during the whole fatigue evolution until the sample fractures. The accumulated heat causes the temperature increase of the specimen, and the temperature variation is a manifestation of irreversible energy dissipation during HCF. According to Clausius–Duhem inequality [40], the entropy production rate within the unit volume is described as follows [32]:
S ˙ = 1 T ( ( σ ρ F α ) : ε ˙ p ρ F α α ˙ intrinsic   dissipation   J q T g r a d T thermal   dissipation )
where is the entropy production rate, T is the real-time temperature, σ is the stress tensor, ε ˙ p is the strain rate, F is Helmholtz free energy, α ˙ denotes the derivative of internal variables, Jq is the heat flux. In Equation (11), there are two parts in the right brackets, i.e., intrinsic dissipation and thermal dissipation relates to heat conduction. For HCF, thermal dissipation caused by heat conduction is negligible. Thus, Equation (11) can be rewritten:
S ˙ = d 1 T
where d1 is intrinsic dissipation comprised of inelastic dissipation and anelastic dissipation, as presented in Equation (10). Thus, we obtain:
d 1 T = d i n T + d a n T
Combining Equations (12) and (13), we obtain:
S ˙ = S ˙ i n + S ˙ a n
In Equation (14), in characterizes the entropy generation rate contributed by inelastic behavior, while an denotes the entropy generation rate resulting from anelasticity. At this point, some notes should be made clear:
(1)
Both inelasticity/microplasticity and anelasticity evolutions are irreversible;
(2)
Irreversible inelastic behavior will cause energy dissipation and damage accumulation;
(3)
Anelastic evolution is irreversible and does not damage the material because of the recoverable microstructural motions, so the related entropy production is minimal.
It should be noted that the microplasticity evolution, such as dislocation intersection or dislocation pile-up, is irrecoverable, inducing a main damage accumulation in the material. While the microstructure change during the anelasticity evolution, i.e., the strain lags behind stress, is recoverable but leads to hysteresis loop dissipated energy. Therefore, the anelasticity evolution is irreversible due to existing energy dissipation, but the microstructure can be recoverable and is almost non-damaging to the material. Nevertheless, the damage resulting from anelasticity evolution is considered to be neglected due to the hysteresis loop dissipated energy in HCF being hardly measurable, especially when the macroscopic stress is much smaller than the macro yield limit. Therefore, for HCF, inelastic microstructure change dedicated to fatigue damage increase, and CDE per unit of time during the whole HCF, is defined as follows:
0 t f S ˙ i n d t = 0 t f S ˙ d t 0 t f S ˙ a n d t
where 0 t f S ˙ i n d t is CDE during fatigue evolution.
C D E = 0 t f ( S ˙ S ˙ a n ) d t

3.2. Fatigue Limit Prediction

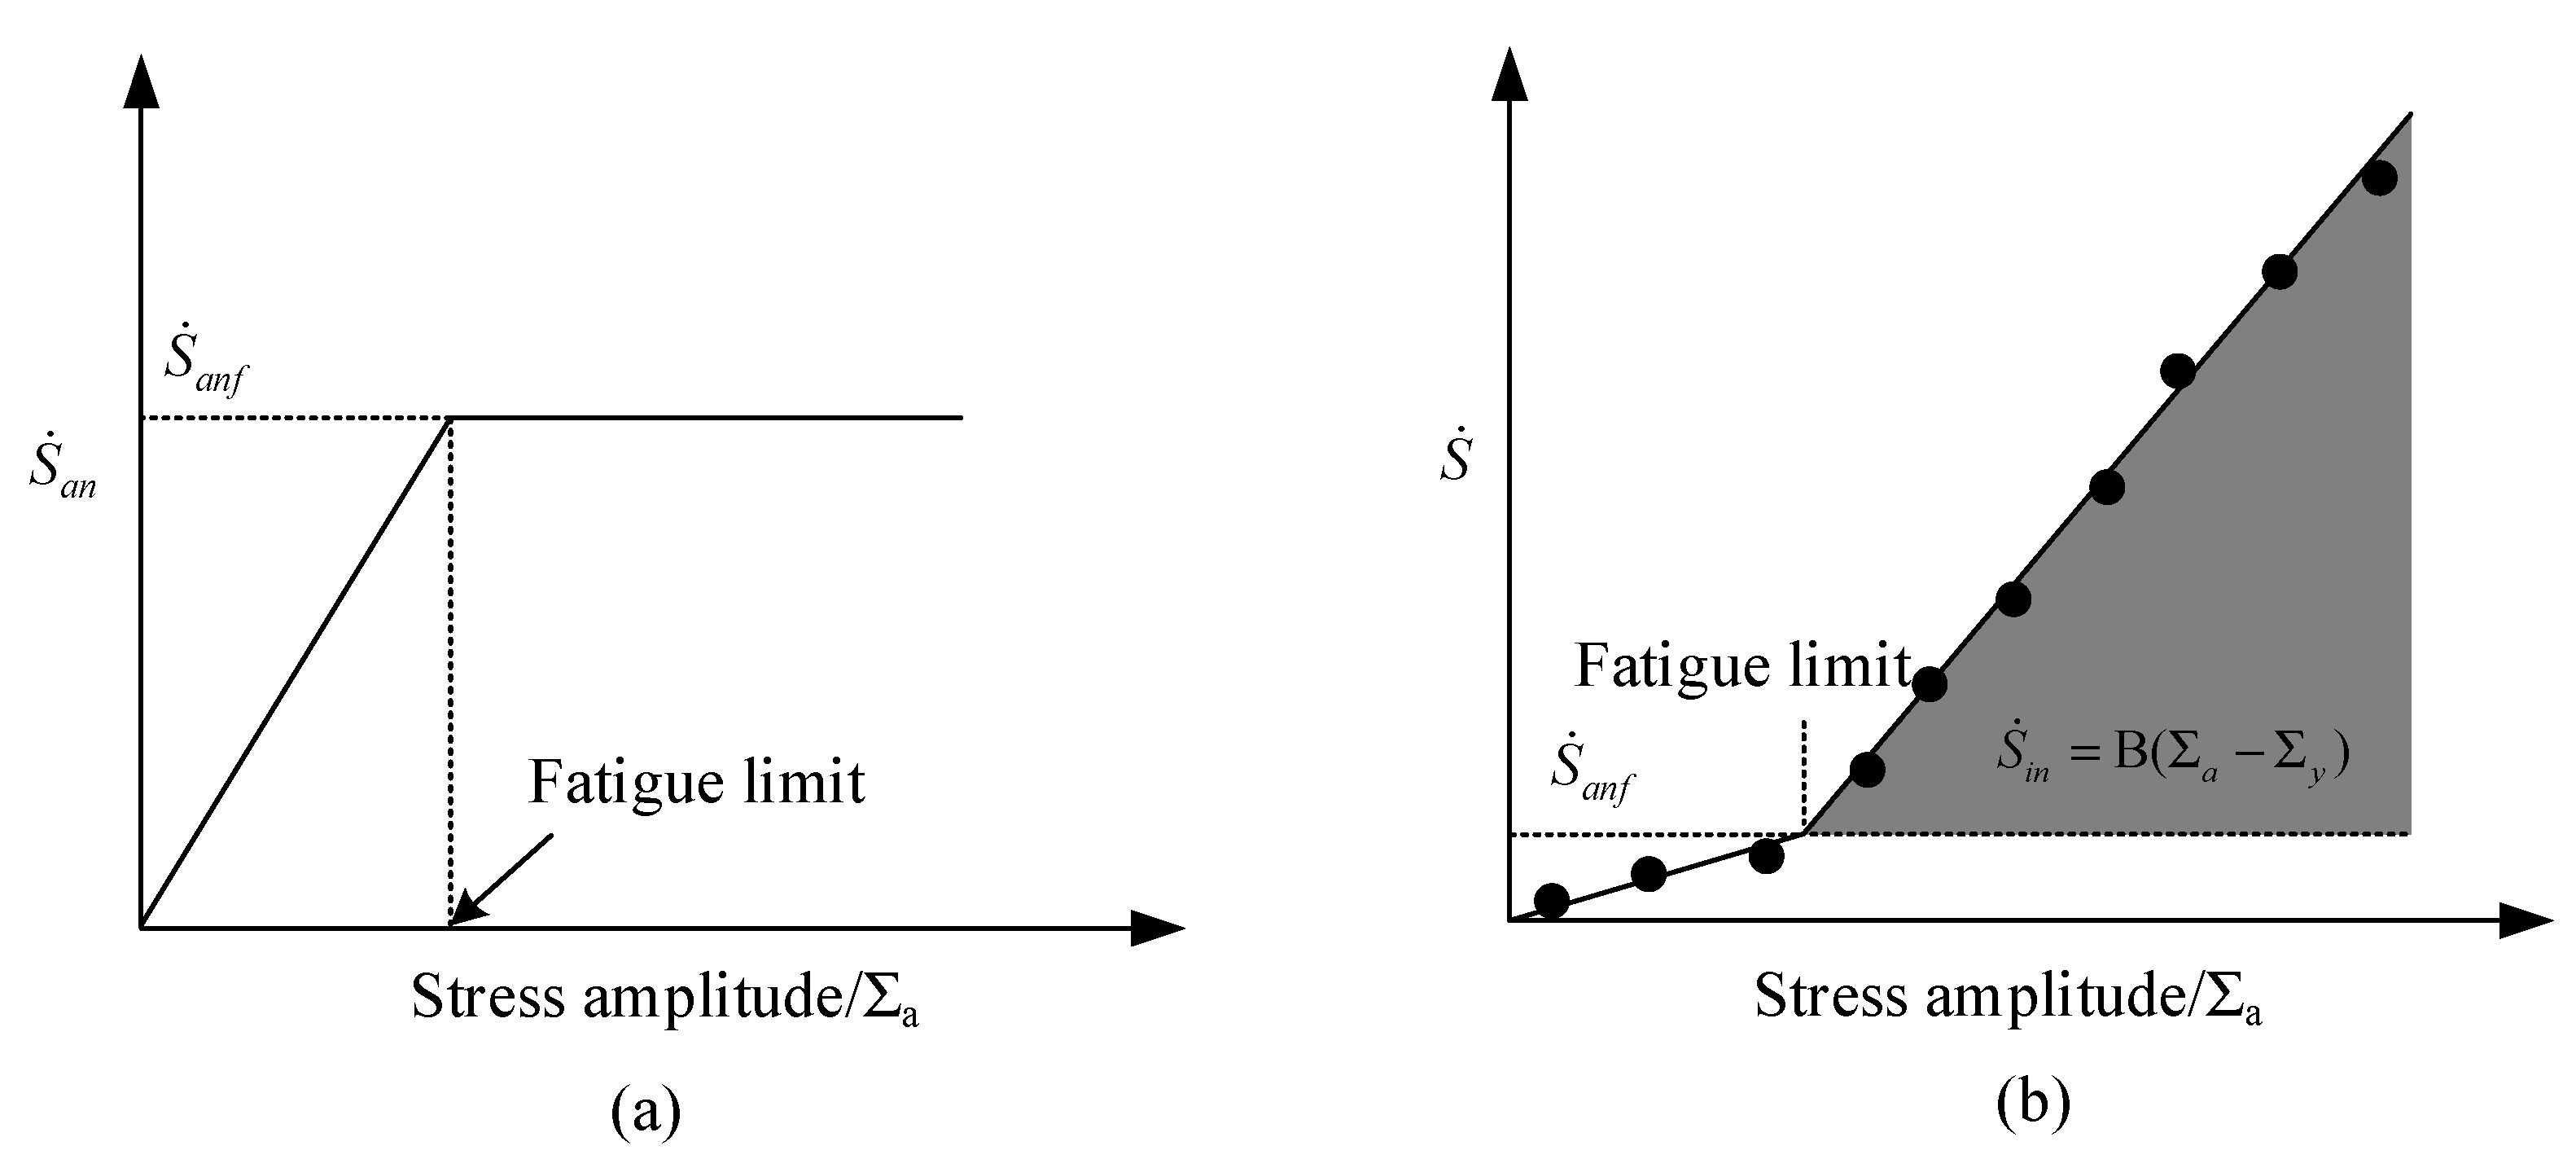
As mentioned in Section 2.1, we employed the RVE model to characterize the damage accumulation during HCF, divided into two parts: (i) elastic matrix; (ii) elastoplastic inclusion. The elastic matrix relates to the anelastic dissipation, originating from recoverable microstructural motions, and it does not damage the material. The elastoplastic inclusion that corresponds to inelastic dissipation addresses the damage accumulation of the specimen during HCF. Anelastic dissipation and inelastic dissipation cause an entropy increase, but the entropy generation from the anelastic dissipation is nearly non-invasive to the material due to recoverable microstructure. Figure 4 schematically illustrates the damage based on entropy production.
Figure 4a depicts an assumption that the entropy production rate induced by anelasticity tends to be stable when the stress amplitude exceeds the macroscopic yield stress. Based on this hypothesis, the entropy production rate is only induced by anelasticity when Σa is lower than the fatigue limit, whereas both anelasticity and microplasticity lead to entropy increase when Σa is higher than the fatigue limit, as shown in Figure 4b. Therefore, a critical value exists when applied loads are close to the fatigue limit, which can be used as an index for the fatigue limit prediction. The method enables a rapid fatigue limit evaluation and reveals the mechanism of the damage-induced entropy increase.
Combining Equations (2) and (14), Equation (14) can be rewritten:
CDEPR = S ˙ S ˙ a n = 4 η f T ( D + 3 μ ( 1 β ) ) σ y Σ a Σ y
where CDEPR represents the cumulative damage entropy production rate caused by microplastic behavior. 4 η f T ( D + 3 μ ( 1 β ) is defined as B. Therefore, Equation (17) transforms into:
CDEPR = S ˙ i n = B ( Σ a y ) ,   ( Σ a > y )
where B is a material coefficient acquired via linear fitting.

3.3. S-N Curve Evaluation Using Thermography Data

HCF is accompanied by irreversible damage accumulation when the applied stress is higher than the fatigue limit, which is physically described as the system undergoes an order–disorder transition. The fracture occurs when accumulated damage in the material exceeds the average critical value, so the specimen does not function normally. It is assumed that the average critical value of CDE is independent of the load and that it can be calculated using Equation (16). Considering that Phase II accounts for around 90% of the total fatigue life, Equation (16) can be replaced with:
CDE = S ˙ i n N a c
where in is CDEPR in Phase II, and Nac is the fatigue life under a certain stress amplitude. If we substitute Equation (18) into Equation (19), we obtain:
CDE B = ( a y ) N a c ,   ( a > y )
Given the discreteness of fatigue life, the average critical value of CDE should be calculated as follows:
CDE ¯ = j = 1 n 2 S ˙ i n ( j ) N a c ( j ) n 2
Here, n2 is the total number of specimens having a certain stress amplitude, which is used to obtain the average critical CDE value. Thus, that is:
( Σ a Σ y ) N a c = CDE ¯ B ,   ( Σ a > Σ y )
Hereto, as shown in Equation (22), the S-N curve with a 50% survival probability rate is well estimated using the proposed model.

3.4. P-S-N Curve Evaluation

As mentioned in Section 3.2, the median S-N curve can be estimated using Equation (22). Furthermore, the S-N curve with different survival probability rates can be estimated with the maximum likelihood method [41]. The specific procedure is generalized as follows:
(1)
Based on Equation (22), the predicted fatigue life lgNa(i) (i = 1, 2, …, n1) with a 50% survival probability rate under different stress levels Σa(i) can be obtained;
(2)
Then, the tested fatigue life lgNac(j) (j = 1, 2, …, n2) of three specimens under a certain stress amplitude Σac can be used, as presented in Section 4.3, Procedure (2), to obtain relevant parameters of the P-S-N curve.
Furthermore, some basic assumptions are as follows [41,42]:
(1)
Logarithmic fatigue life under different stress levels obey the normal distribution;
(2)
The relationship of the mean of logarithmic fatigue life μi and standard deviation σi, with any stress amplitude Σa(i), (above fatigue limit), is supposed linear.
Thus, the horizontal distance between the median S-N curve and S-N curve with 5% and 95% survival probability rates under any stress amplitude is written as follows:
μ ^ x ^ p = u p σ ^
where up is a standard normal deviation that refers to the reference [41,42], and x ^ p is the predicted P-S-N curve. Based on second assumption, μi and σi at Σa(i) can be represented as follows:
{ μ i = a 1 + a 2 lg Σ a i σ i = a 3 + a 4 lg Σ a i
where a1, a2, a3, and a4 are constant. For n2 specimens under a certain stress amplitude Σac, the mean of logarithmic fatigue life μac and standard deviation σac are estimated as follows:
μ a c = 1 n 2 j = 1 n 2 lg N a c ( j )
σ a c = 1 n 2 1 { j = 1 n 2 ( lg N a c ( j ) ) 2 1 n 2 ( j = 1 n 2 lg N a c ( j ) ) 2 }
Then, according to Equation (24), for specimen under the stress amplitude Σac, we have:
{ μ a c = a 1 + a 2 lg Σ a c σ a c = a 3 + a 4 lg Σ a c
Combining Equations (24) and (25), and eliminating a1 and a3:
{ μ i = μ a c + a 2 lg ( Σ a i Σ a c ) σ i = σ a c + a 4 lg ( Σ a i Σ a c )
According to the first assumption, the likelihood function is expressed as follows [43]:
L = i = 1 n 1 { 1 σ i 2 π exp [ ( lg N a ( i ) μ i ) 2 2 σ i 2 ] }
Substituting Equation (28) into Equation (29), we obtain:
L = i = 1 n 1 { 1 2 π ( σ a c + a 4 lg ( Σ a i Σ a c ) ) × exp [ ( lg N a ( i ) μ a c a 2 lg ( Σ a i Σ a c ) ) 2 2 [ σ a c + a 4 lg ( Σ a i Σ a c ) ] 2 ] }
Take the natural logarithm of the left and right sides of Equation (30):
ln L = i = 1 n 1 { ln 2 π + ln [ σ a c + a 4 lg ( Σ a i Σ a c ) ] + ( lg N a ( i ) μ a c a 2 lg ( Σ a i Σ a c ) ) 2 2 [ σ a c + a 4 lg ( Σ a i Σ a c ) ] 2 }
Further, take the partial derivatives of lnL with respect to a2 and a4, respectively, and set them equal to zero:
{ ln L a 2 = 0 ln L a 4 = 0
Therefore, after determining a2 and a4, the S-N curve with any survival probability rate can be obtained:
lg N p = μ a c + u p σ a c + ( a 2 + u p a 4 ) ( lg Σ a i lg Σ a c )
In Equation (33), N p is estimated fatigue life with the survival probability rate, p, μac and σac are the mean of fatigue life and standard deviation of the tested three specimens under a certain stress amplitude, respectively, a2 and a4 are constants derived from the iteration method in [41], and Σai and Σac are the stress amplitude above the fatigue limit and a certain stress amplitude, respectively.

4. Experimental Study

4.1. Materials and Specimens

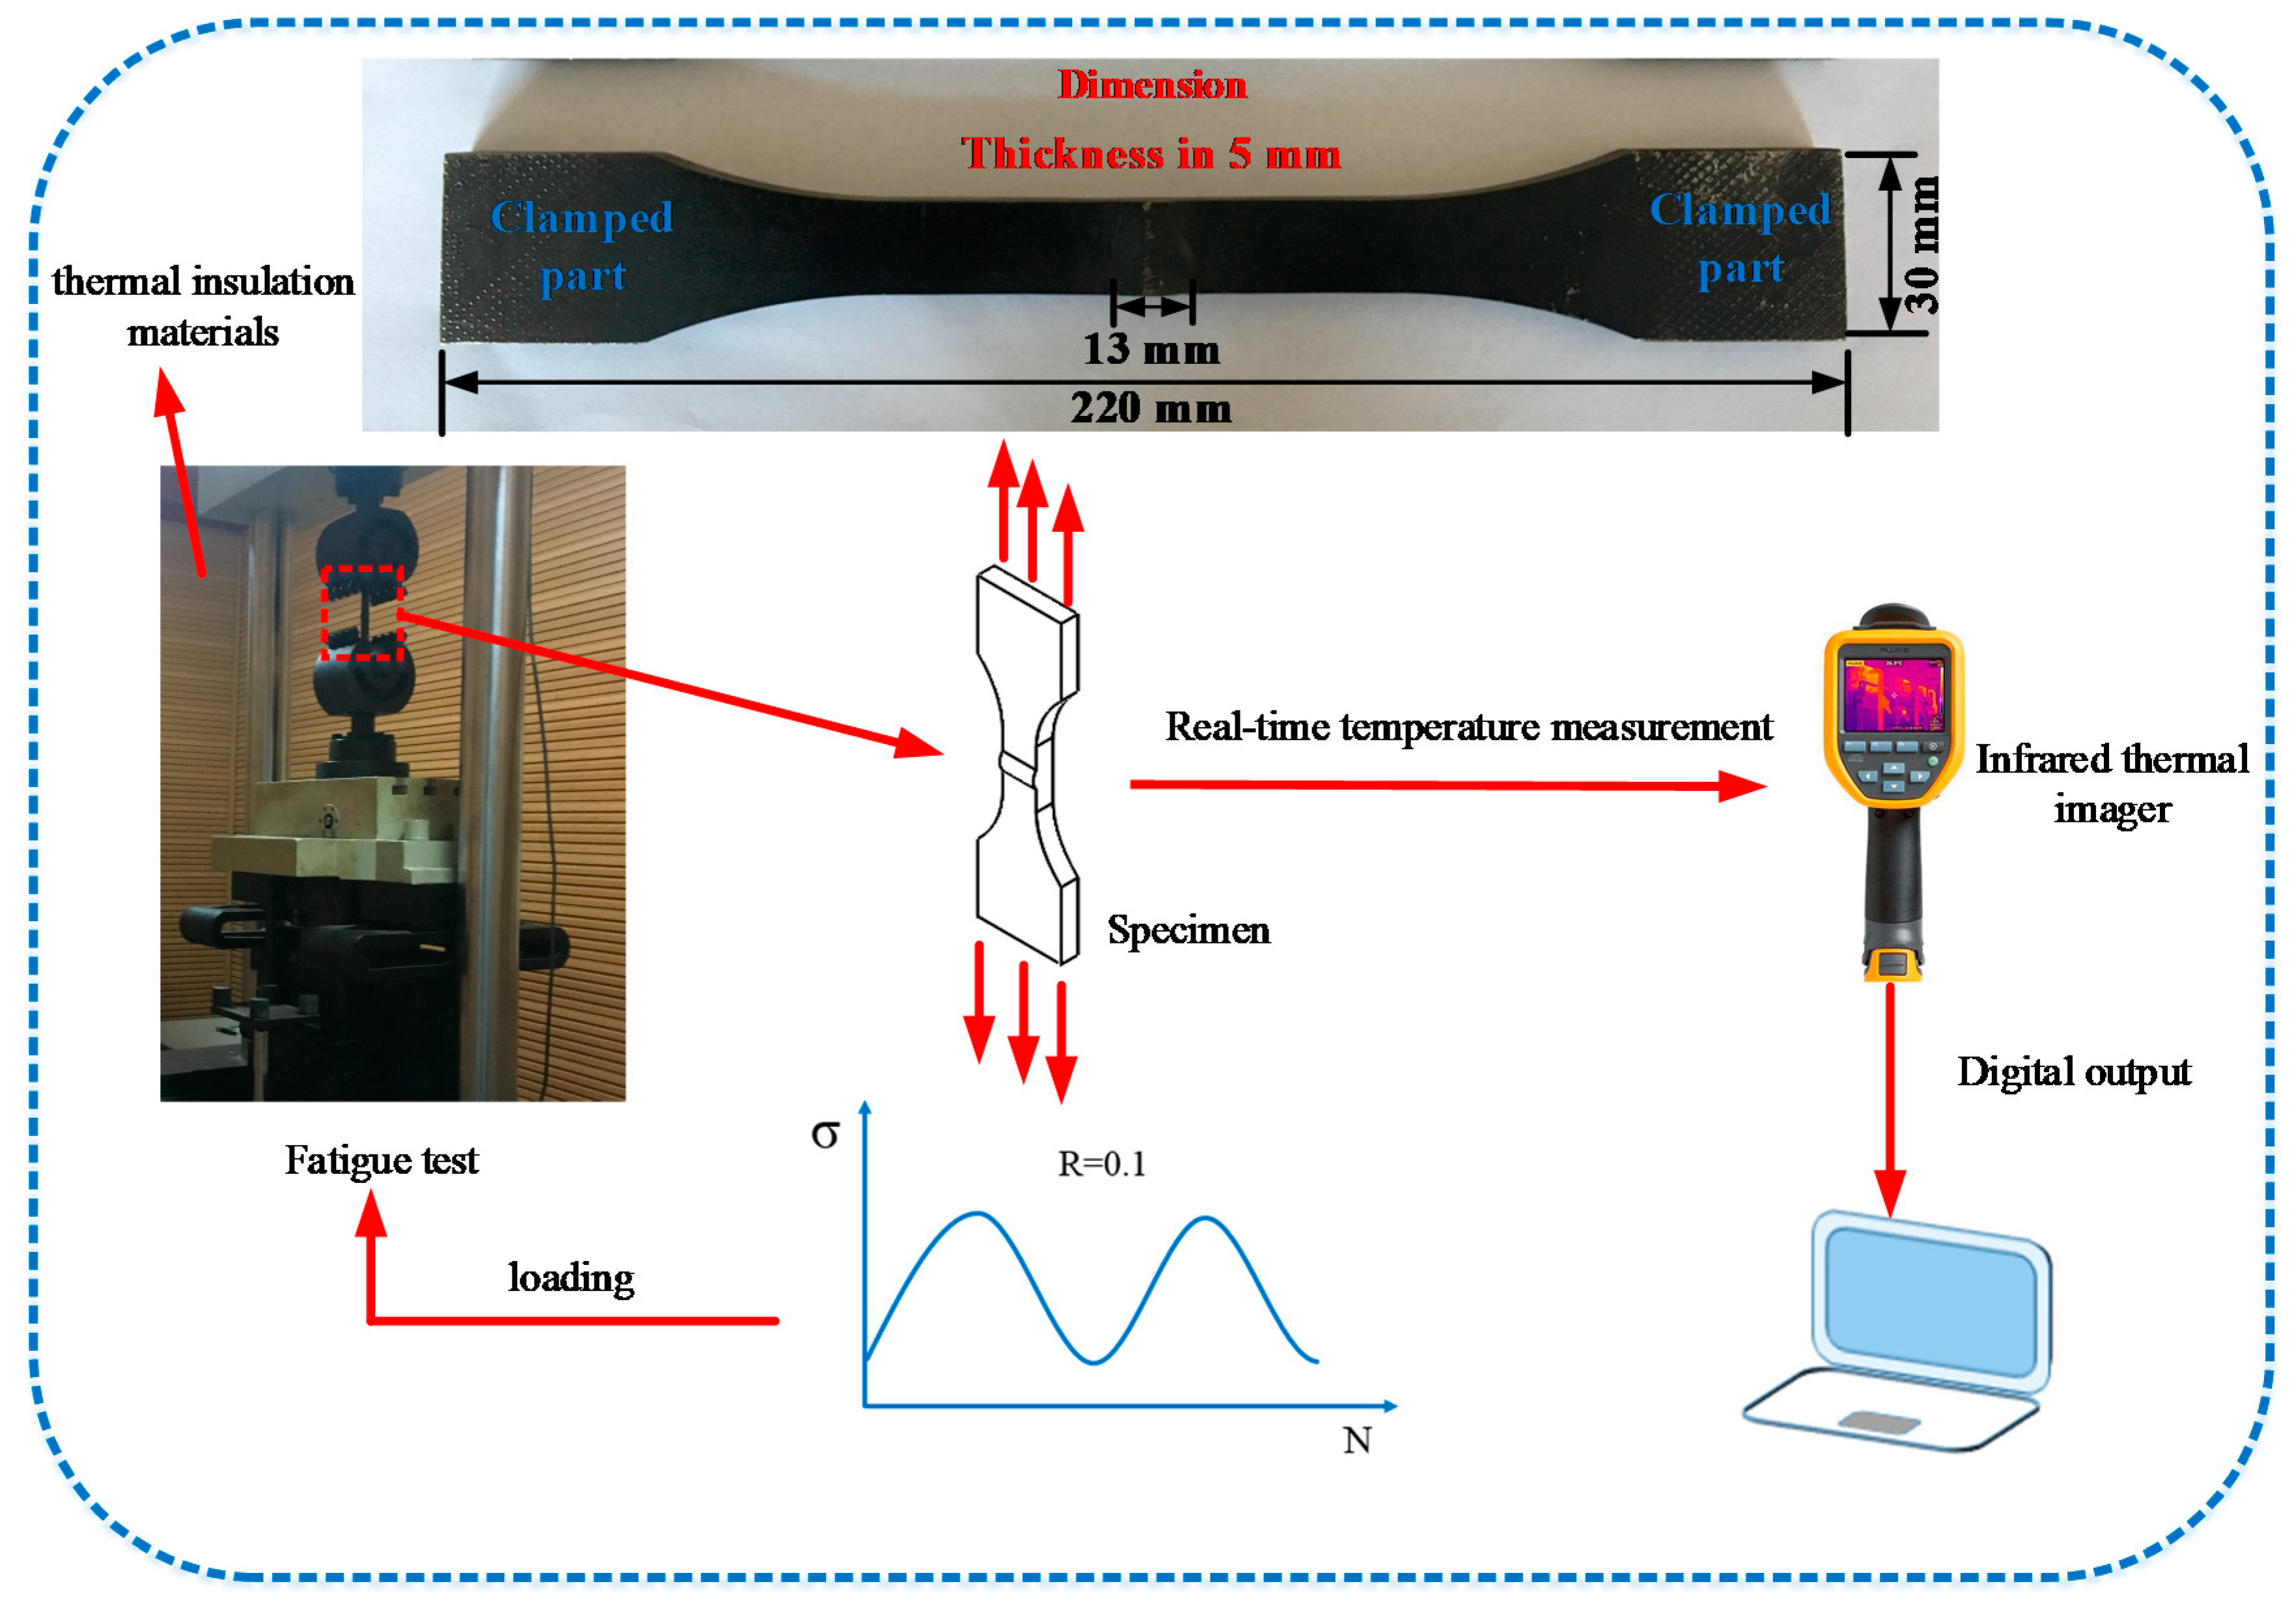
In this work, Q460 butt joints were experimentally investigated. We prepared specimens with a thickness of 5 mm by Metal Active Gas welding (MAG). The welding shielding gas is Ar(80%) + CO2(20%), the welding groove form is V-shape, the groove angle is 55° and the blunt edge is 1 mm. To eliminate the influence of micro-defects in the weld root, the backside of the specimens (weld root) was polished. The chemical composition and mechanical properties of welded joints are given in Table 1 and Table 2, respectively. The welding parameters are listed in Table 3, while the specimen dimensions are illustrated in Figure 5.

4.2. Experimental Apparatus

Constant-amplitude fatigue tests were performed on the PLG-200 fatigue testing machine with a 200 kN capacity. A Fluke Ti450 infrared thermal imager was employed to monitor the real-time temperature variation at the specimen surface. The IR camera (Fluke Ti450) had a temperature range from −20 to 1200 °C, a resolution of 320 × 240 pixel, a sensitivity of 0.03 °C at 30 °C, and an infrared spectrum band from 4 to 14 μm (long wave). Since the infrared imager is particularly sensitive to emissivity, a uniform black matte paint was sprayed on the specimen surface to enhance the surface emissivity. The measurement device has been shown in Figure 5.
Furthermore, to reduce the influence of the external environment, the fatigue experiment was performed in a small closed room with walls made of soundproof and thermo-insulating materials, which can be considered as an insulation system.

4.3. Experimental Procedure

All the specimens underwent uniaxial and sinusoidal loadings with R = 0.1 and f = 112 Hz at room temperature. The sampling of the infrared thermal imager was once every three seconds. The specific experimental procedure under each loading was as follows:
(1)
Stress amplitudes of 157.5, 148.5, 135, 130.5, 126, 121.5, 117, 112.5, 108, 103.5, 99, and 94.5 MPa were selected to conduct fatigue tests until fracture or 2 × 10⁶ cycles to obtain the entropy production rate in Phase II;
(2)
After finishing Procedure (1), i.e., determining the fatigue limit using the method developed in Section 3.2, three specimens were tested under the stress amplitude above the fatigue limit to estimate the average CDE for S-N curve prediction;
(3)
The fatigue life of tested specimens in Procedure (1) and (2) was employed to verify the predicted S-N curve.
For Procedure (1), it should be noted that it needs only 250,000 cycles for temperature increment in the stable stage at a frequency of 112 Hz. The aim of performing fatigue tests is to acquire thermographic data in Phase II for the median S-N curve prediction and obtain test fatigue life for model verification.

5. Results and Discussion

5.1. Fatigue Temperature Evolution by IR Techniques

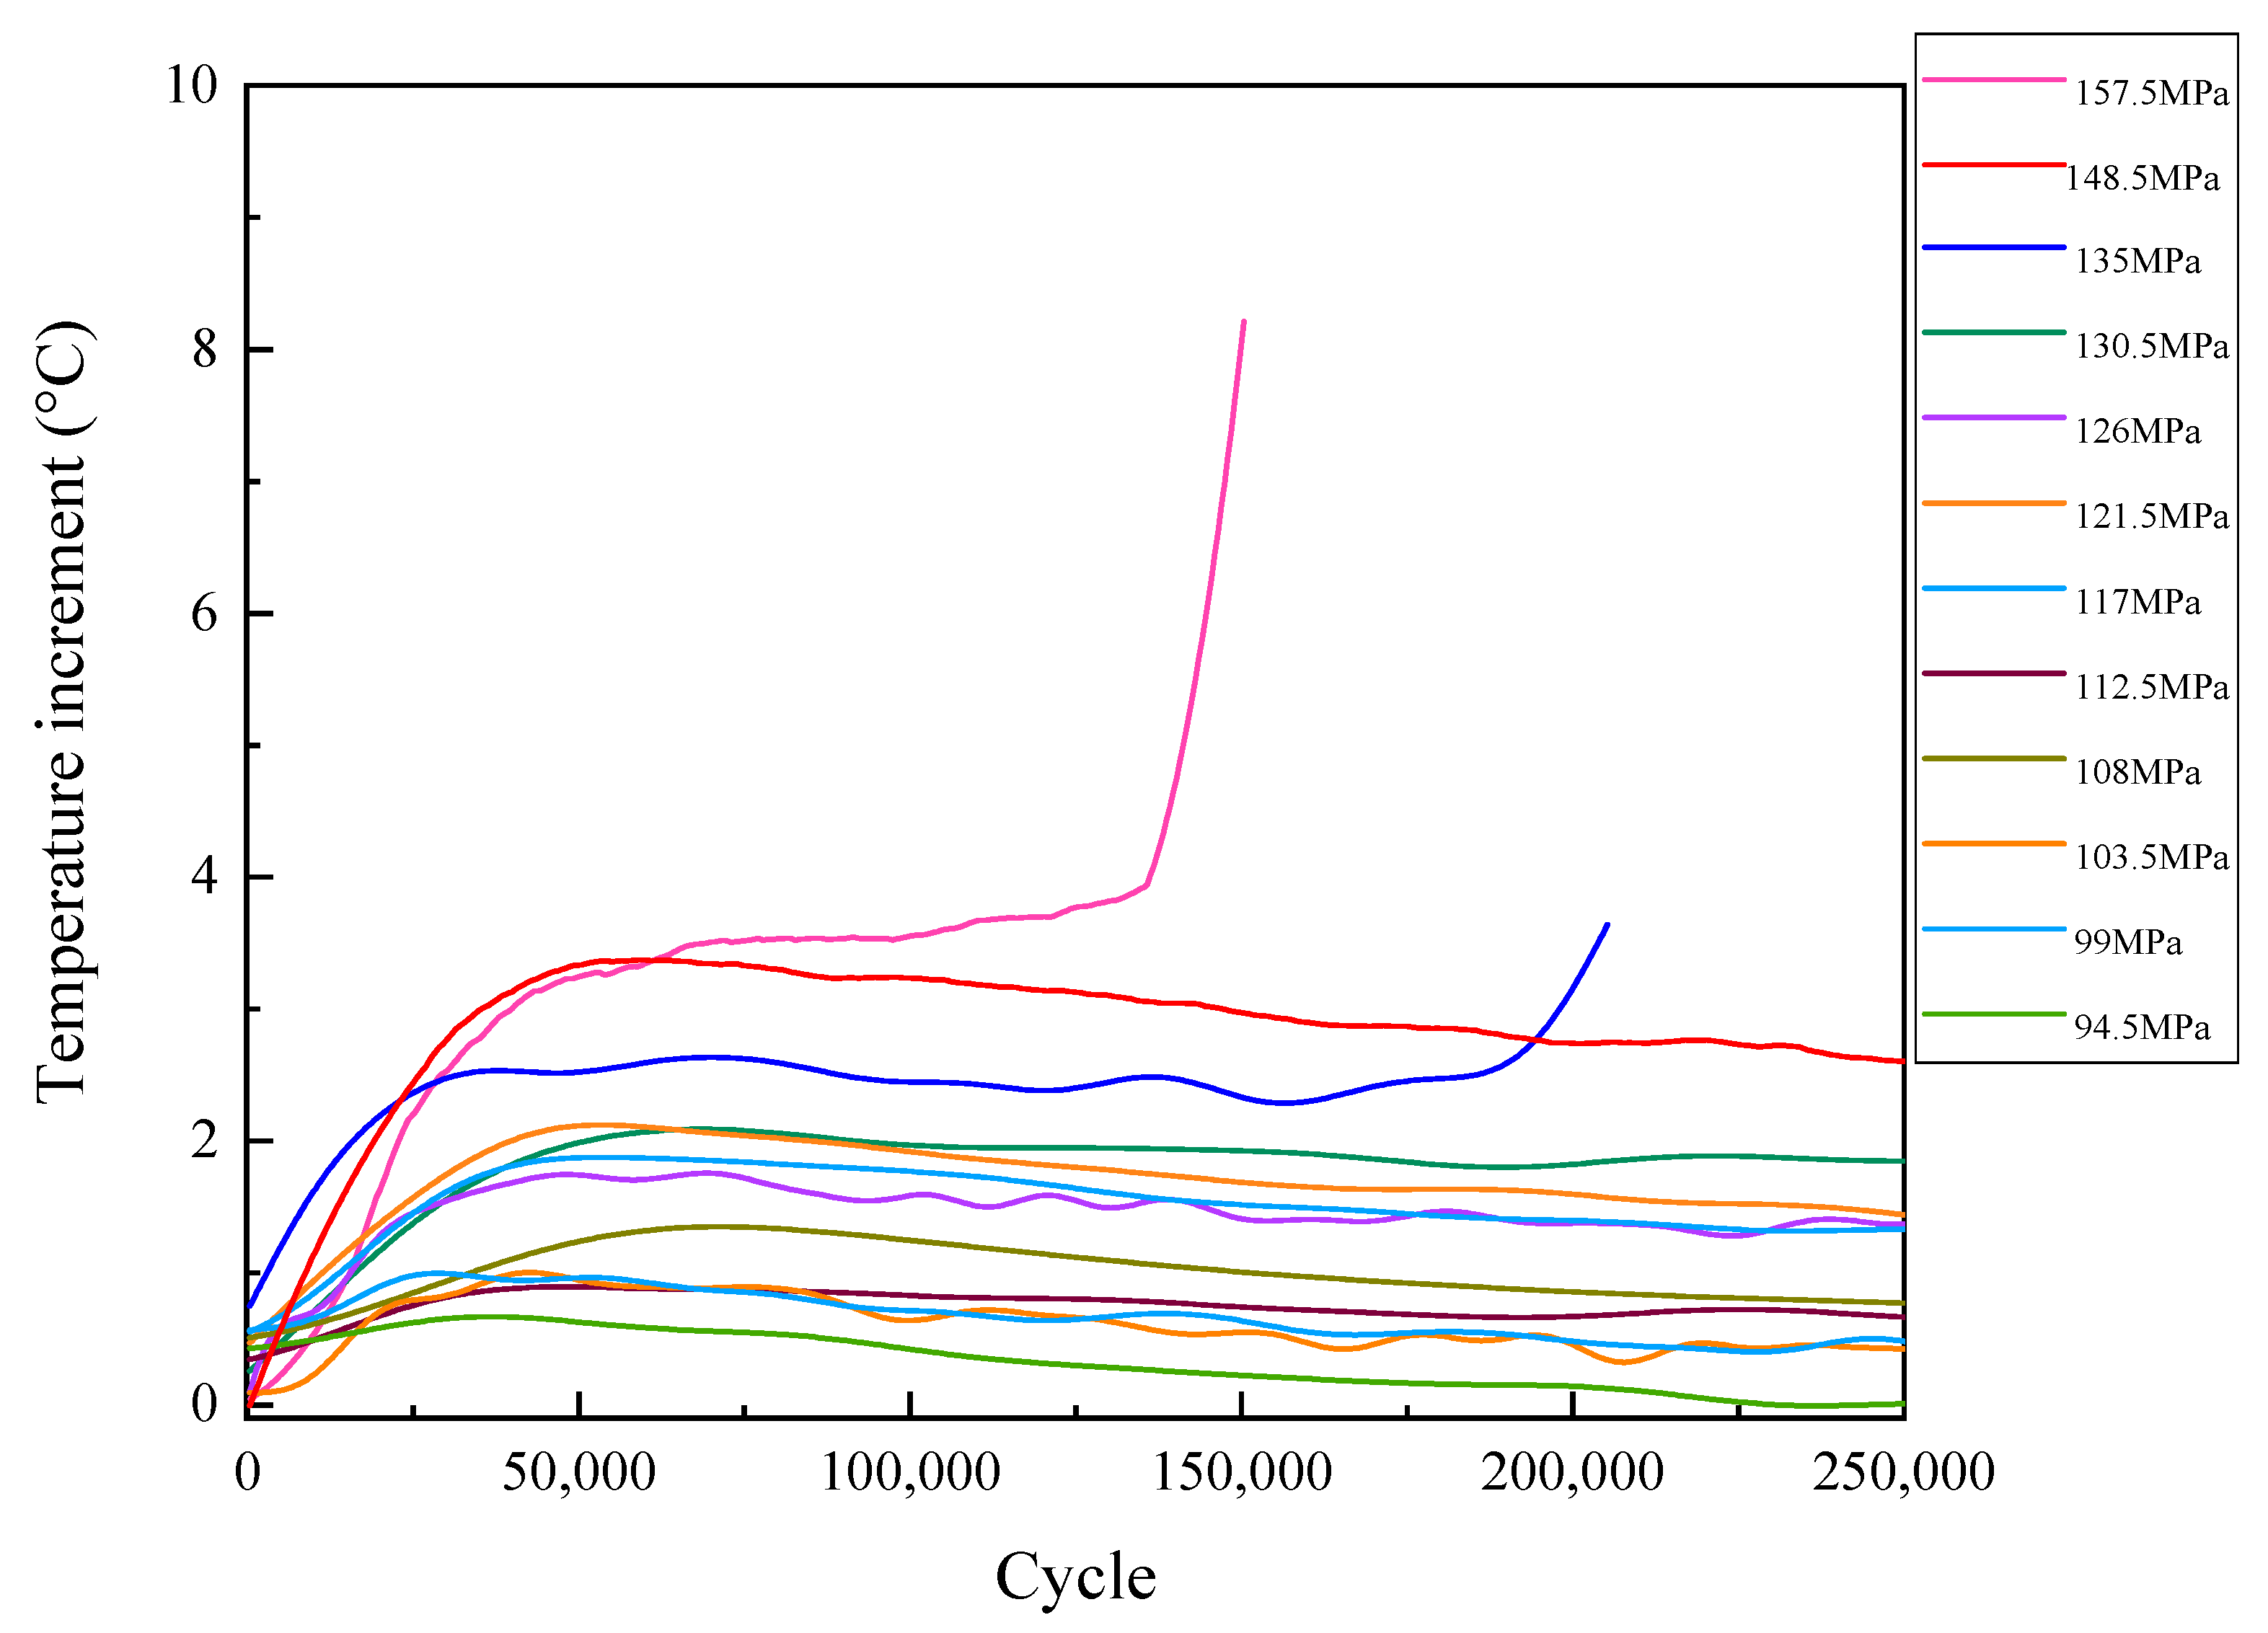
Figure 6 shows the evolution of the temperature increase of Q460 butt joints vs. the cycle number, under varying stress amplitudes, from 94.5 to 157.5 MPa. The temperature value gradually increases in Phase I and then stabilizes under every investigated stress amplitude further. All specimens, except the specimen under the stress amplitude of 157.5 MPa, experience, after Phase I, an increase and then a decrease in the temperature increment. However, at 157.5 MPa, there is no such feature, indicating that it does not exist under a higher stress level. This phenomenon was also reported in the literature [43,44,45,46], but an adequate mechanistic explanation is still missing. Huang et al. [47] attributed the increase–decrease process of CFRP laminates to the work-hardening effect, so they performed fatigue tests to verify the proposed assumption. The fatigue tests were designed to test the same specimen two times in a row under the same load, and the results show that the increase–decrease process has disappeared in the second test. The stabilized temperature value in Phase I and Phase II is equal, although the temperature increase process in Phase I of the first test and the second test is different. This phenomenon was described as a rapid heat generation in the first test, which causes work-hardening. The work-hardening has finished in the second test, so there is no increase–decrease process.
Here we need to pay attention to how to select a stable temperature rise value. Skibicki et al. [46] employed the temperature increment value at the end of Phase I or peak between Phase I and Phase II, which made a great contribution to elevating the calculation accuracy of the relevant model. However, the peak under 148.5 MPa is higher than at 157.5 MPa (also occurring at 126 MPa and 121.5 MPa).Then, the temperature values at 148.5 MPa and 121.5 MPa gradually decrease in Phase 2, as shown in Figure 6. This phenomenon may attribute to the difference of specimens and unstable loads in Phase I.
Another point should be noted that the curve of Figure 6 indicates a lack of stabilization after Phase I due to work hardening, which is different from the assumption in Figure 2, i.e., the temperature increment is stable in Phase 2. Nevertheless, the decrease of temperature value caused by working hardening is gradually reduced after 250,000 cycles in this study. Therefore, we defined the temperature increment of the 250,000th cycle as the stabilization temperature because of its minimal changes after 250,000 cycles.
Therefore, in this work, we only monitor thermographic data of specimens within 250,000 cycles for establishing a rapid S-N curve calculation model, and the influence of temperature decrease induced by working hardening (after 250,000 cycles) is not considered. In this study, the influence of frequency on the fatigue limit and S-N curve is considered to be almost negligible. The reasons are generalized as follows:
(1) The temperature increment in Phase II is only around 3.5 degrees when the maximum macro stress amplitude equals 157.5 MPa, which is far lower than the yield limit of the material. However, in LCF, the self-heating effect may well have a higher temperature increment in Phase II due to higher loads and plastic strain on a macroscopic scale. The temperature increment may affect the material properties, thus influencing the experimental results.
(2) The fatigue tests were carried out in a closed static chamber, and the atmospheric corrosion can be ignored.
In summary, the influence from loading frequency (in present data, 112 Hz) to fatigue limit, S-N curve, and material properties is not taken into account.
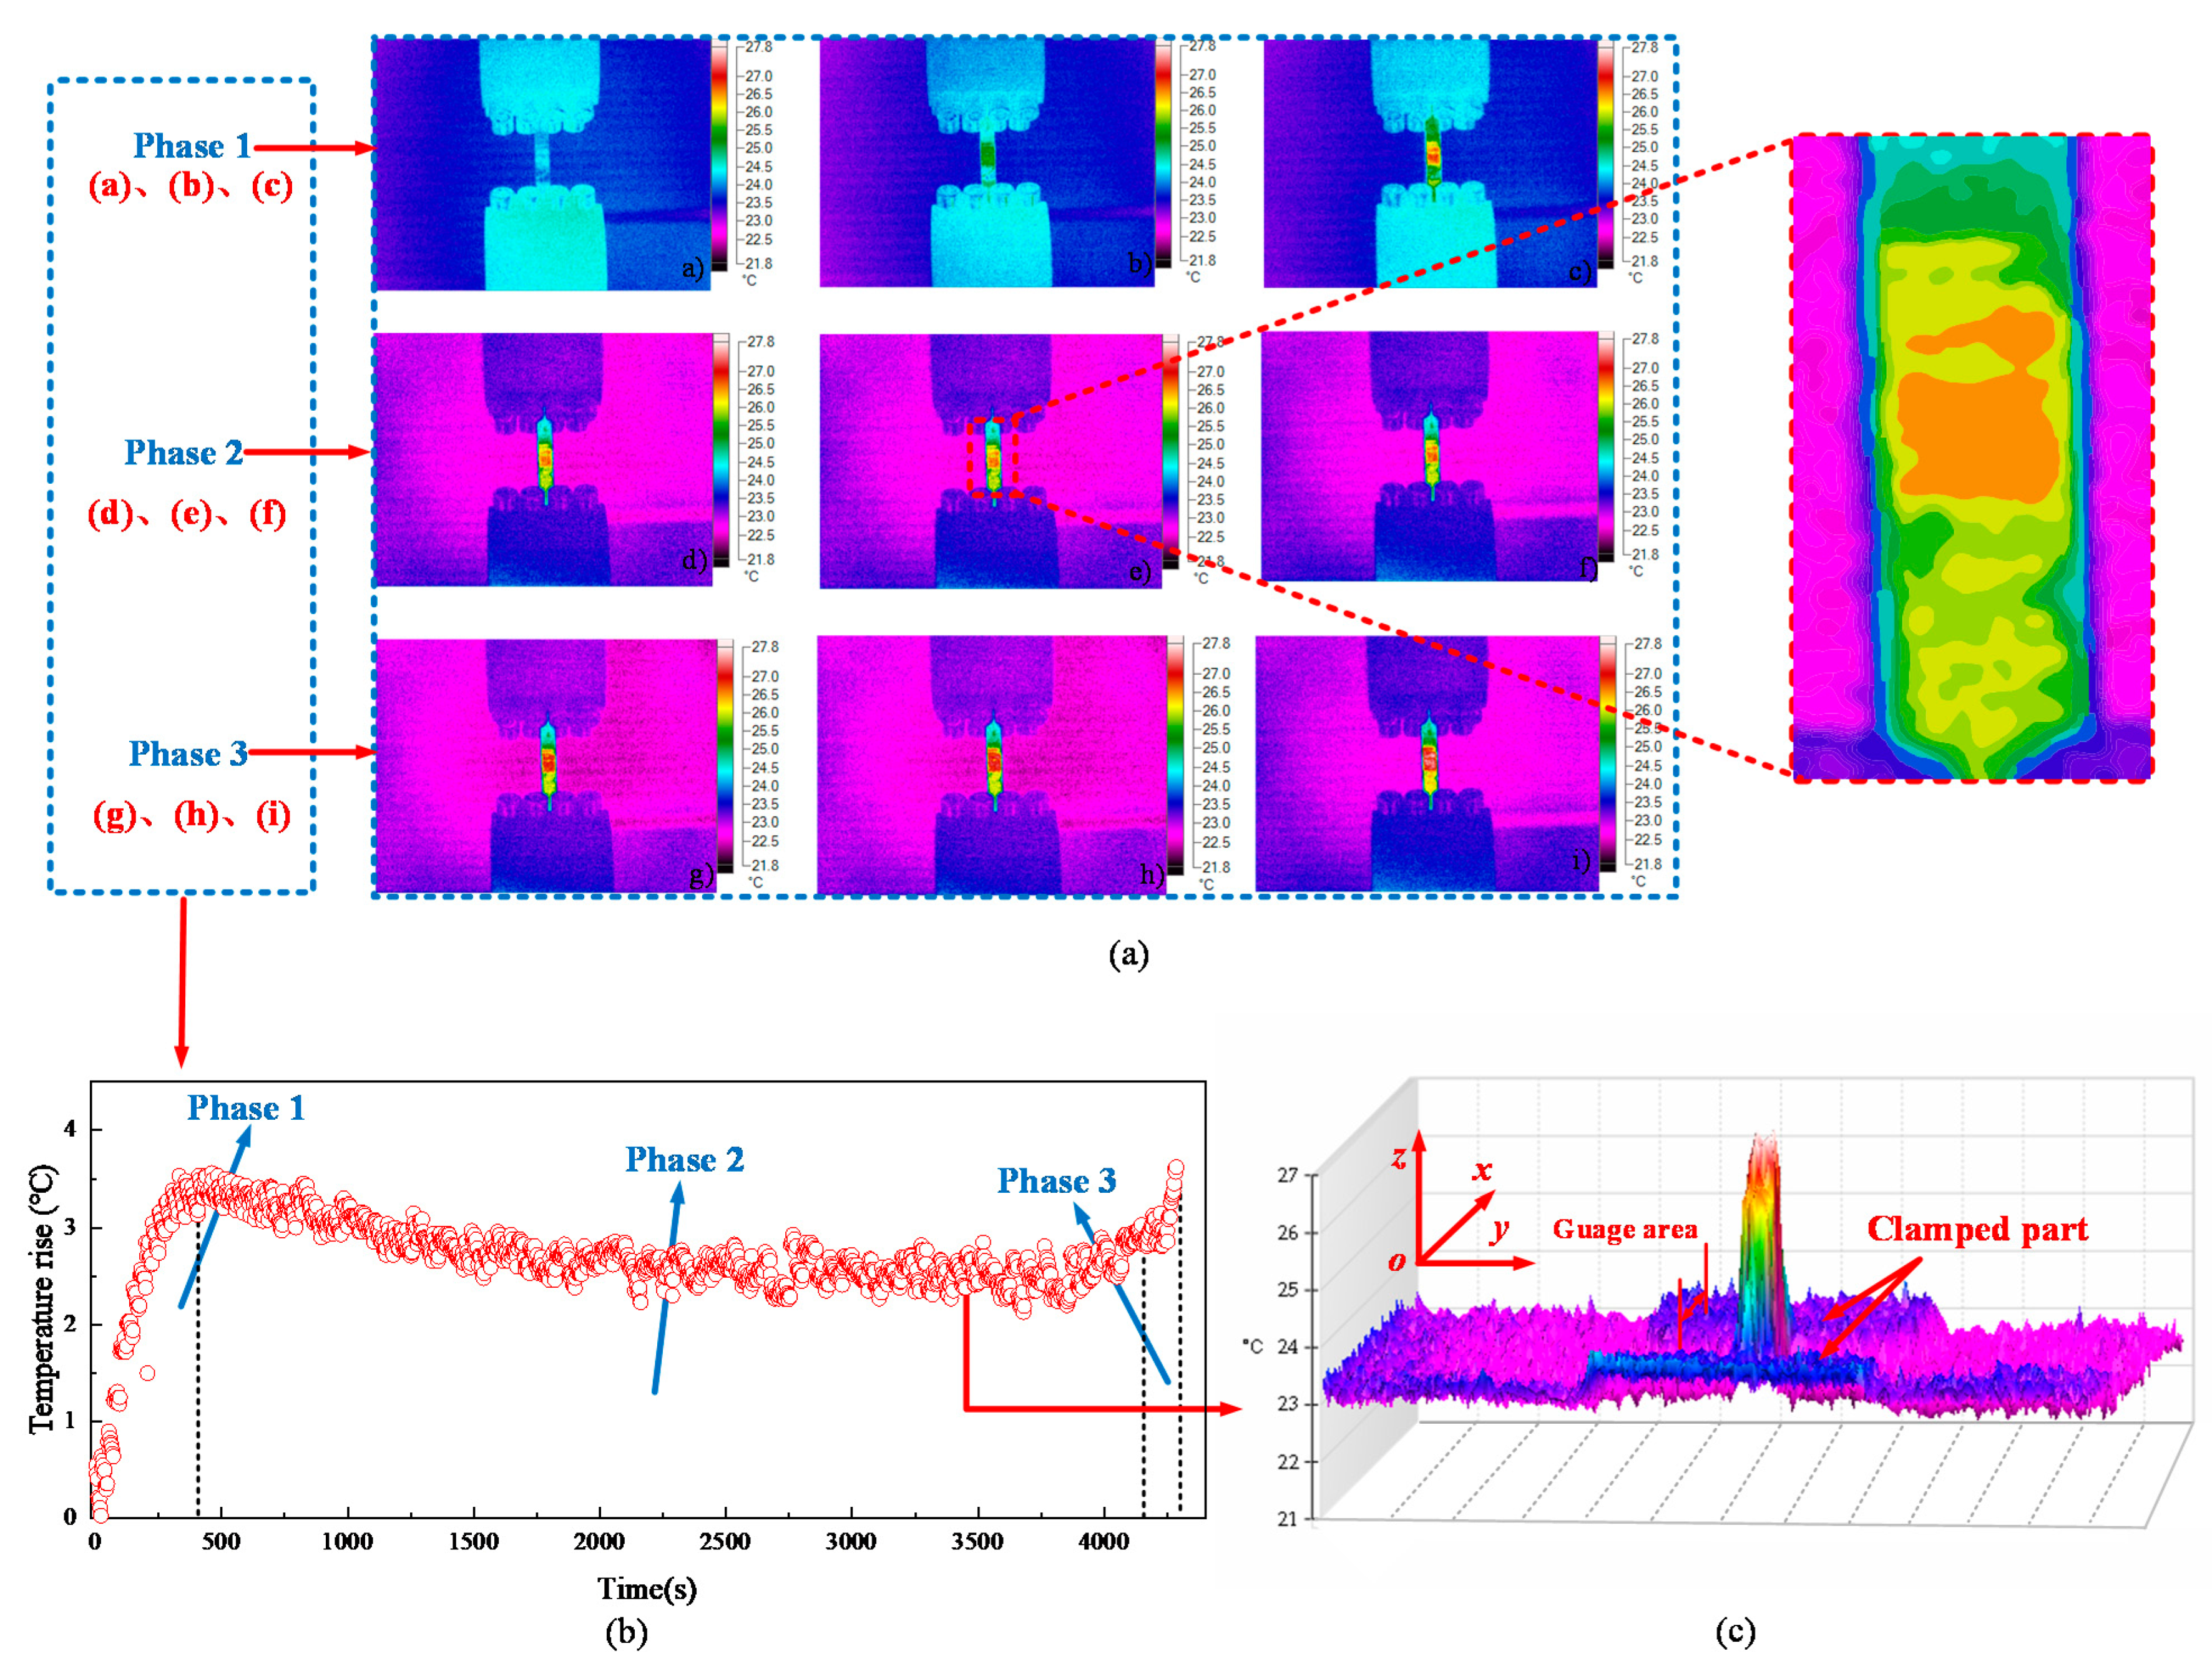
A typical temperature evolution and infrared thermal images under the stress amplitude of 148.5 MPa are illustrated in Figure 7. In Figure 7a, (a), (b), and (c) represent three typical thermal images in Phase I, (d), (e), and (f) denote typical thermal images in Phase II, and (g), (h), and (i) characterize thermal images in Phase III. Figure 7b indicates that the temperature tends to stabilize during Phase II. The temperature increment in Phase II tends to be stable, which suggests that the thermodynamic balance between heat production and thermal dissipation occurred.
The sudden temperature increase in Phase III might be attributed to several reasons: (a) at the end of Phase II, the weld toe crack length reaches a threshold, so the structural strength of the specimen decreases; (b) the effective load-bearing cross-sectional area has reduced in the weld toe because the crack length reached a threshold. Therefore, the stress distribution is extremely singular, especially at the weld toe, and the peak stress sharply increases. Conclusively, heat production will suddenly increase before fatigue fracture.
Figure 7c represents the 3D temperature profile thermal images of the specimen under the stress amplitude, and the clamped part is marked. It can be noted that the temperature peak exists in the center of the gauge area, and the temperature value gradually decreases along with the positive and negative values of the x-axis. Furthermore, the temperature value is almost stable along the y-axis, which is consistent with the hypothesis in Section 2.2, i.e., the temperature variation along the y-axis is minimal, so only a one-dimensional temperature field is considered.
Here, the difference of the curve in Figure 6 and Figure 7b with the stress amplitude of 148.5 MPa should be noted. Figure 7b shows the temperature evolution curve was drawn based on the measured data with the stress amplitude of 148.5 MPa, while the temperature evolution curve with the stress amplitude of 148.5 MPa in Figure 6 was drawn based on the processed data from Figure 7b to obtain the mean temperature increment.

5.2. Fatigue Limit Prediction

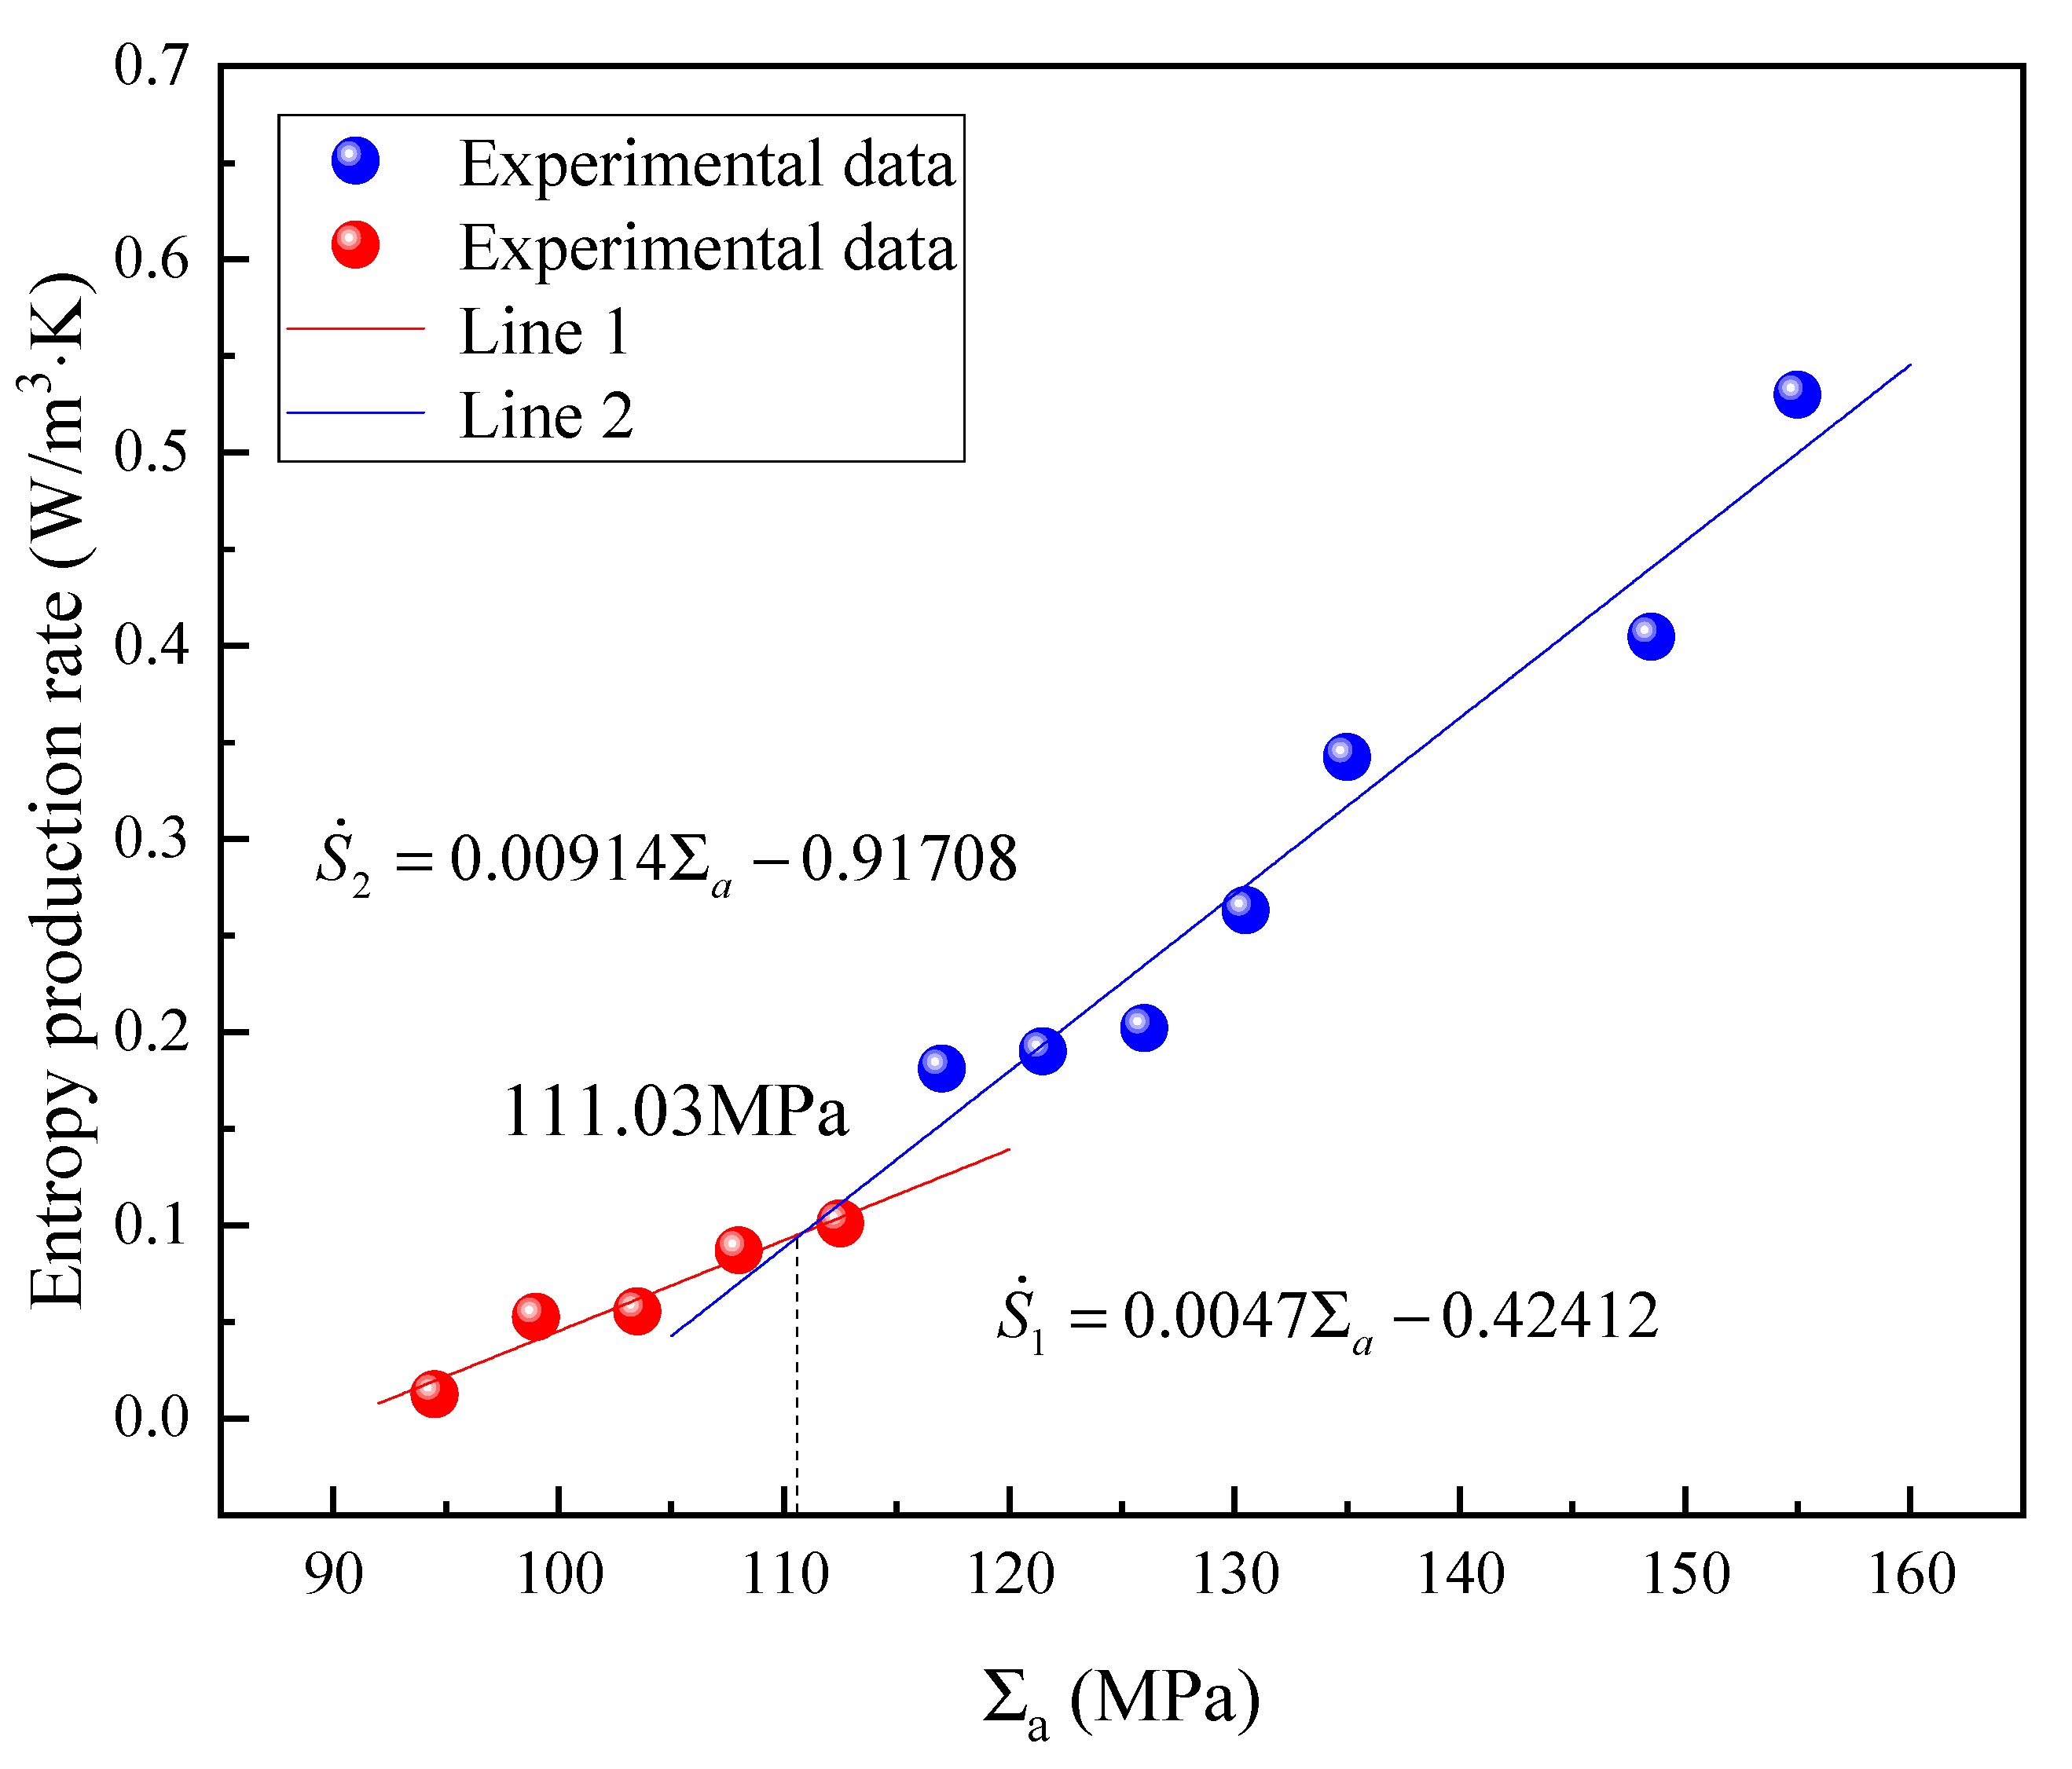
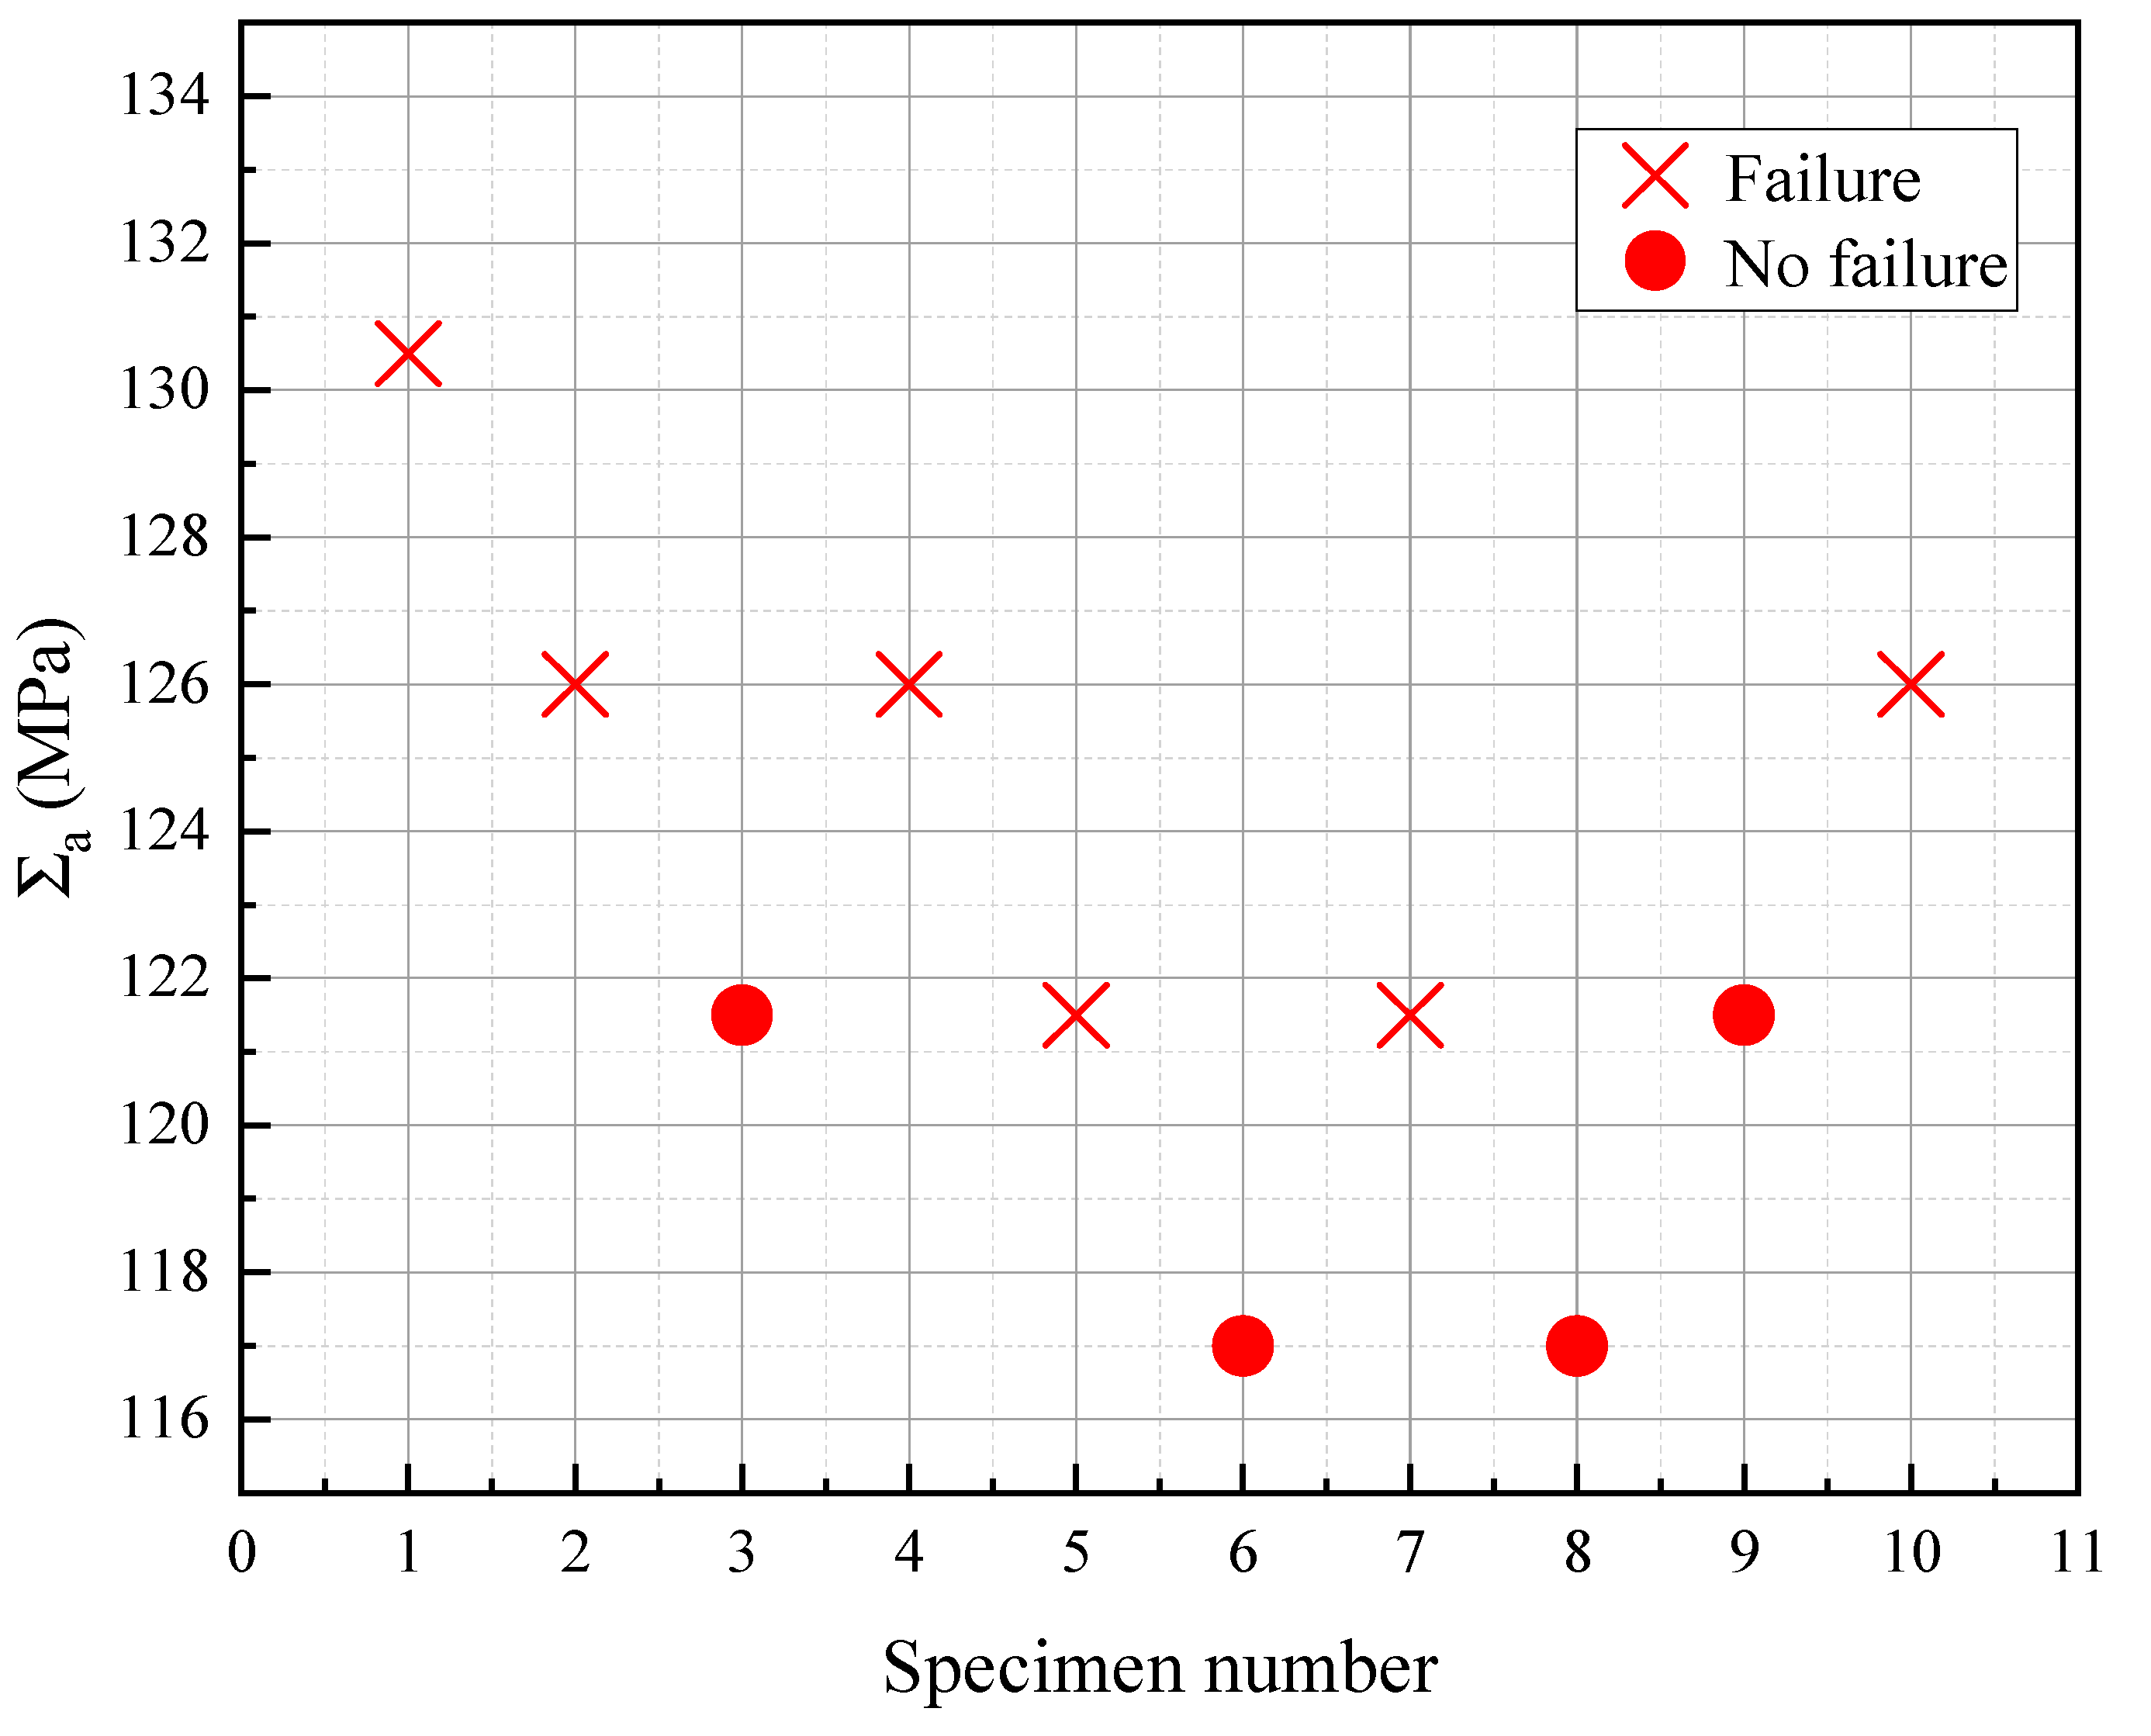
Figure 8 shows the fatigue limit prediction addressing the developed method, as presented in Section 3.2. The entropy production rate data are calculated using Equation (12) and then processed to finish the fatigue limit prediction. The fatigue limit value is 111.03 MPa, which can be acquired from the intersection between line 1 and line 2. The intersection between line 1 and line 2 was determined based on the maximum angle change refers to [9]. After determining the maximum angle change, the two point-sets can be well fitted, respectively. For line 1, five points are used for fitting, and R2 equals 0.94512, while for line 2, seven points are utilized for fitting, and R2 equals 0.9523, which suggests very good fitting. By setting the intersection of these two lines as an indicator, we can rapidly predict the fatigue limit. Figure 9 shows the fatigue limit test results through the traditional staircase method, “×” represents the specimen fractures within 2 × 10⁶ cycles, and “∙” represents the specimen does not fracture within 2 × 10⁶ cycles. To verify the accuracy of this developed model, we compared the fatigue limit prediction values with the staircase method (SM) presented in Table 4. The absolute value of error is 8.62%, indicating the high accuracy of the proposed model for the fatigue limit estimation. Therefore, the developed bi-linear method can provide a rapid and accurate fatigue limit estimation of Q460 welded joints during HCF.

5.3. Analysis of Fatigue Fracture Mechanism

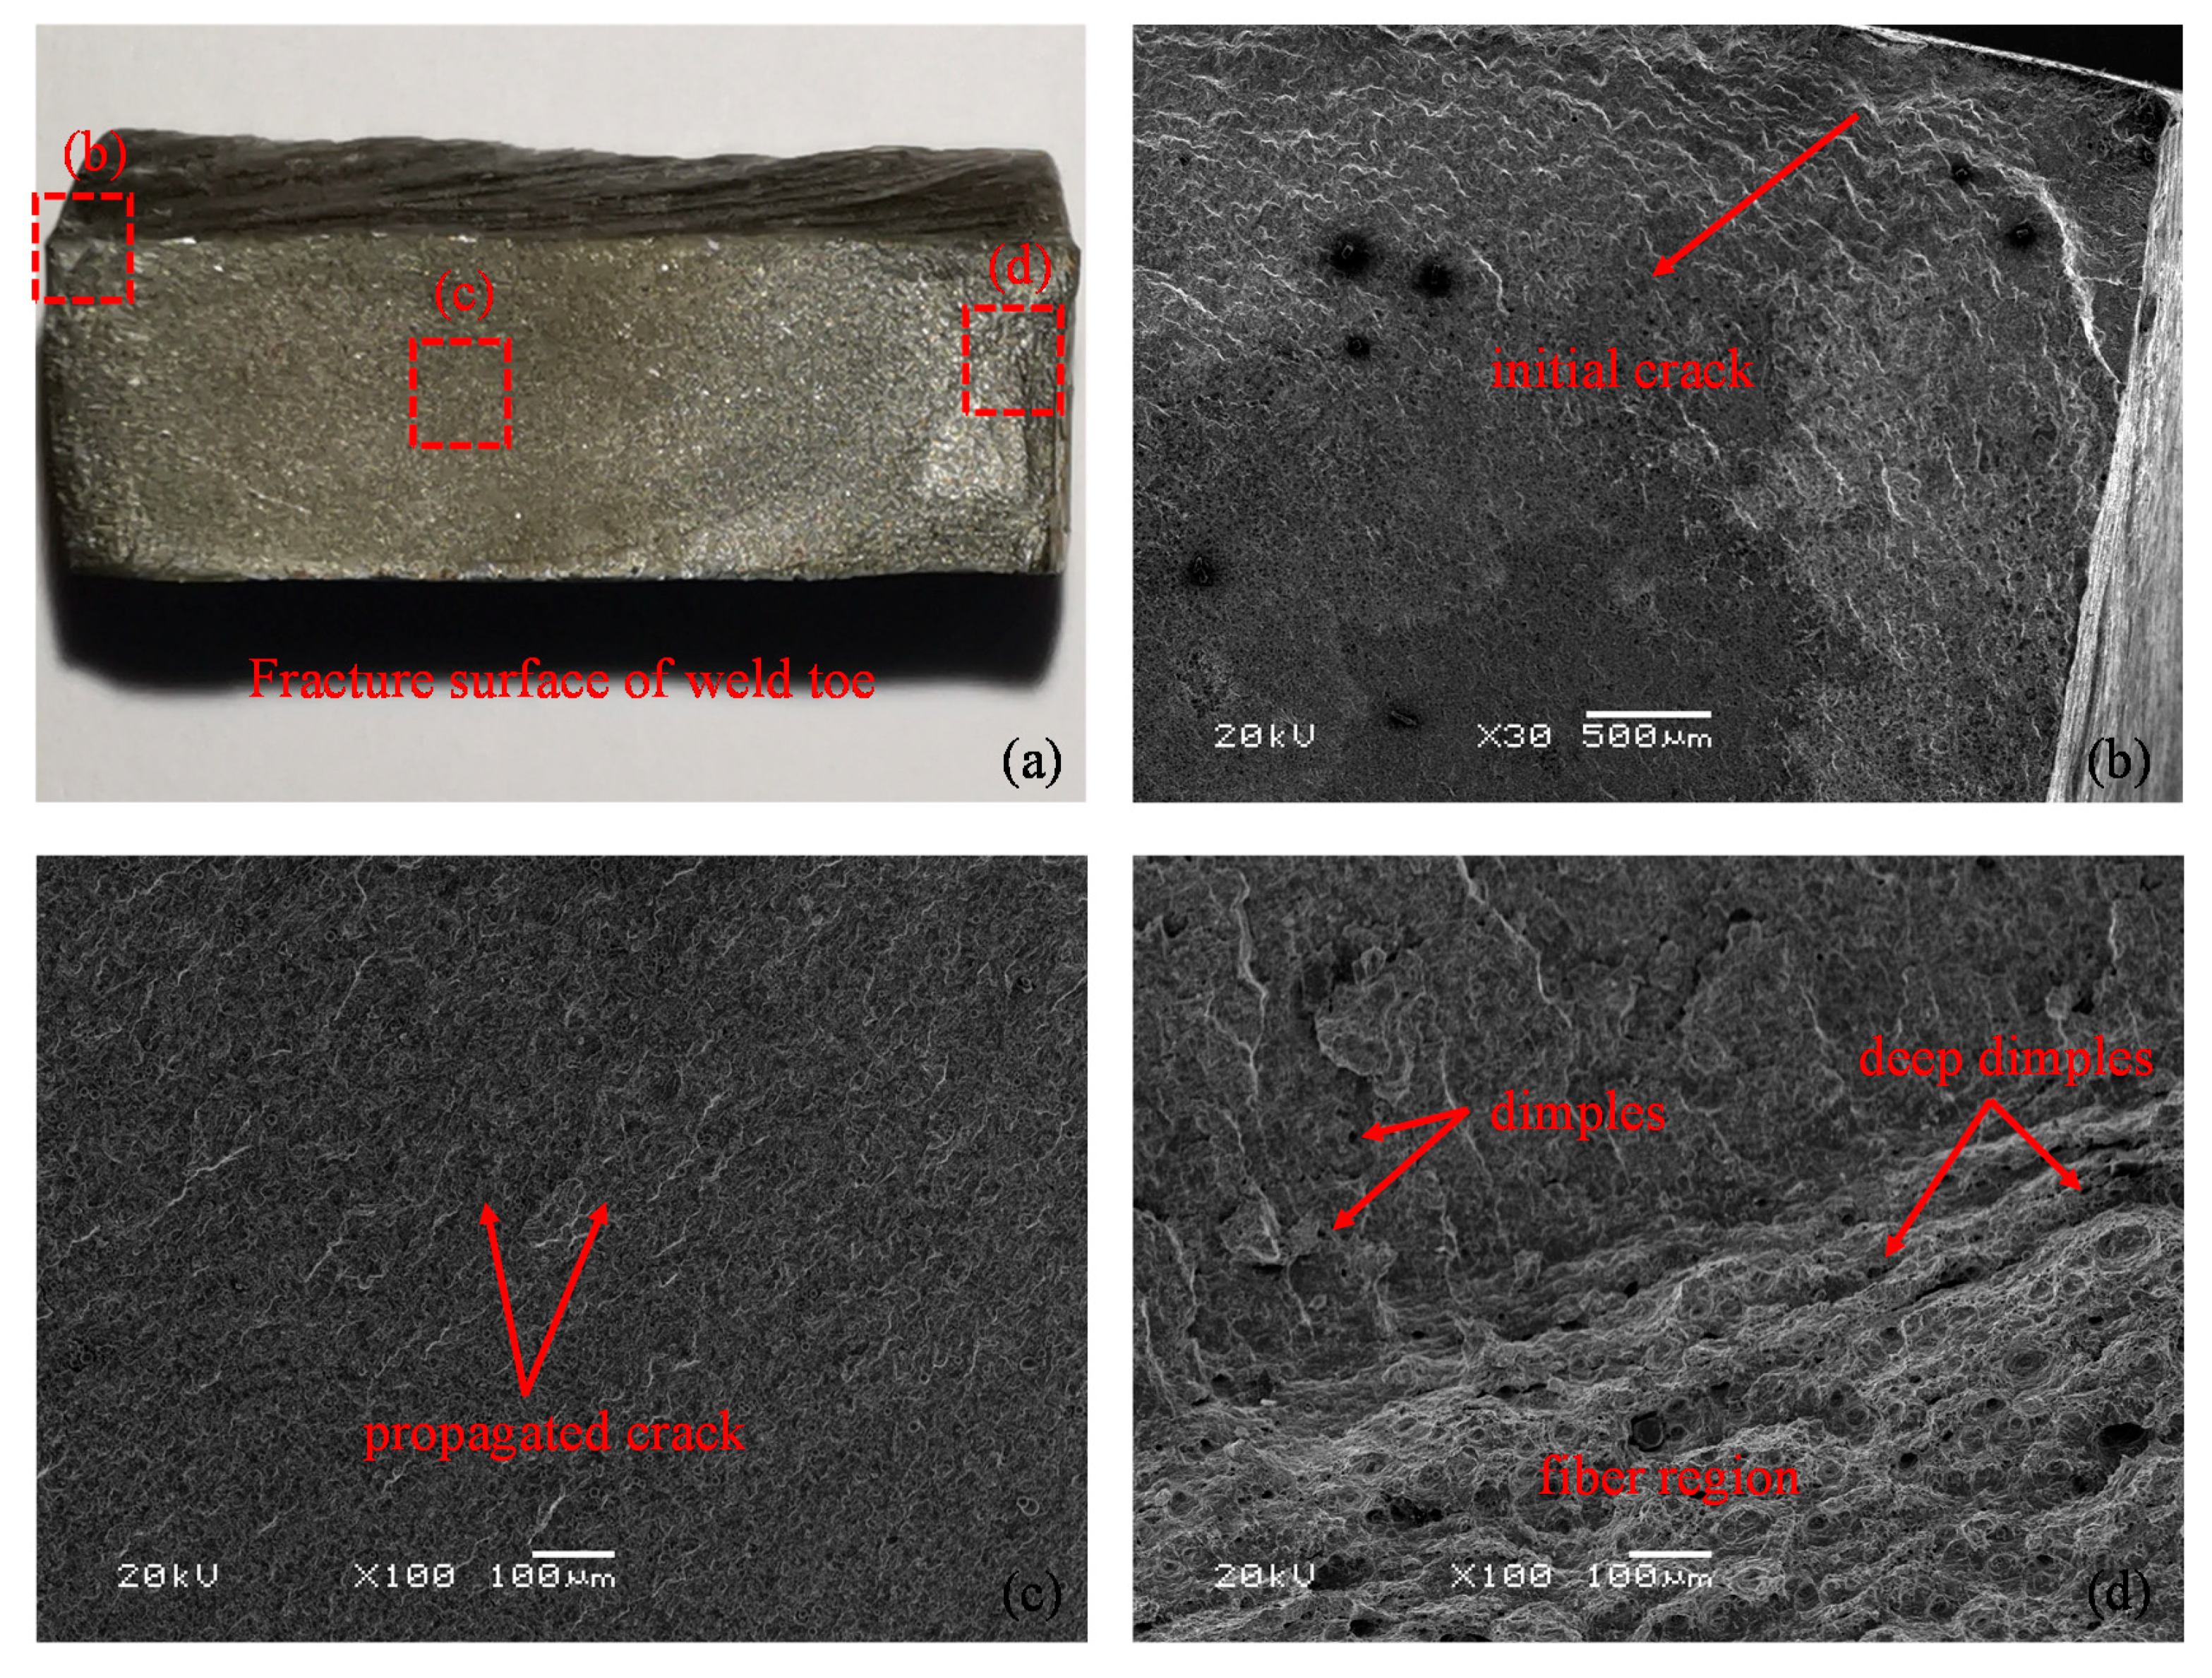
Figure 10a–d presents the high-cycle fatigue fracture characteristics of Q460 welded joints. Figure 10a shows the fracture surface of welded joints; the fracture occurred near the weld toe, which is attributed to the stress concentration and singularity due to geometric and microstructure discontinuity in the weld toe [48]. In addition, some welding micro-defects may evolve into initial cracks at the beginning of tests. Therefore, for welded joints, the weld toe is particularly prone to crack and eventually lead to fracture. Figure 10b exhibits the initial crack formed near the weld toe induced by welding micro-defects and microstructure discontinuity. The initial crack in Figure 10b parallelly propagated forward until the propagation tends to be stable, as shown in Figure 10c. Eventually, the fracture will occur when the crack has propagated to a certain extent. Figure 10d displays the region between the crack propagation region and the fiber region; the dimples in the propagation and fiber regions may be due to the void coalescence. Moreover, the deep dimples within the fiber region indicate good ductility of the base metal.

5.4. S-N Curve Estimation of Q460 Butt Joints

Based on the established model in Section 3.2, and as illustrated in Figure 4b, the CDE production rate induced by inelasticity in is calculated as follows:
S ˙ i n = S ˙ S ˙ a n = 9.14 × 10 3 ( Σ a 111.03 )
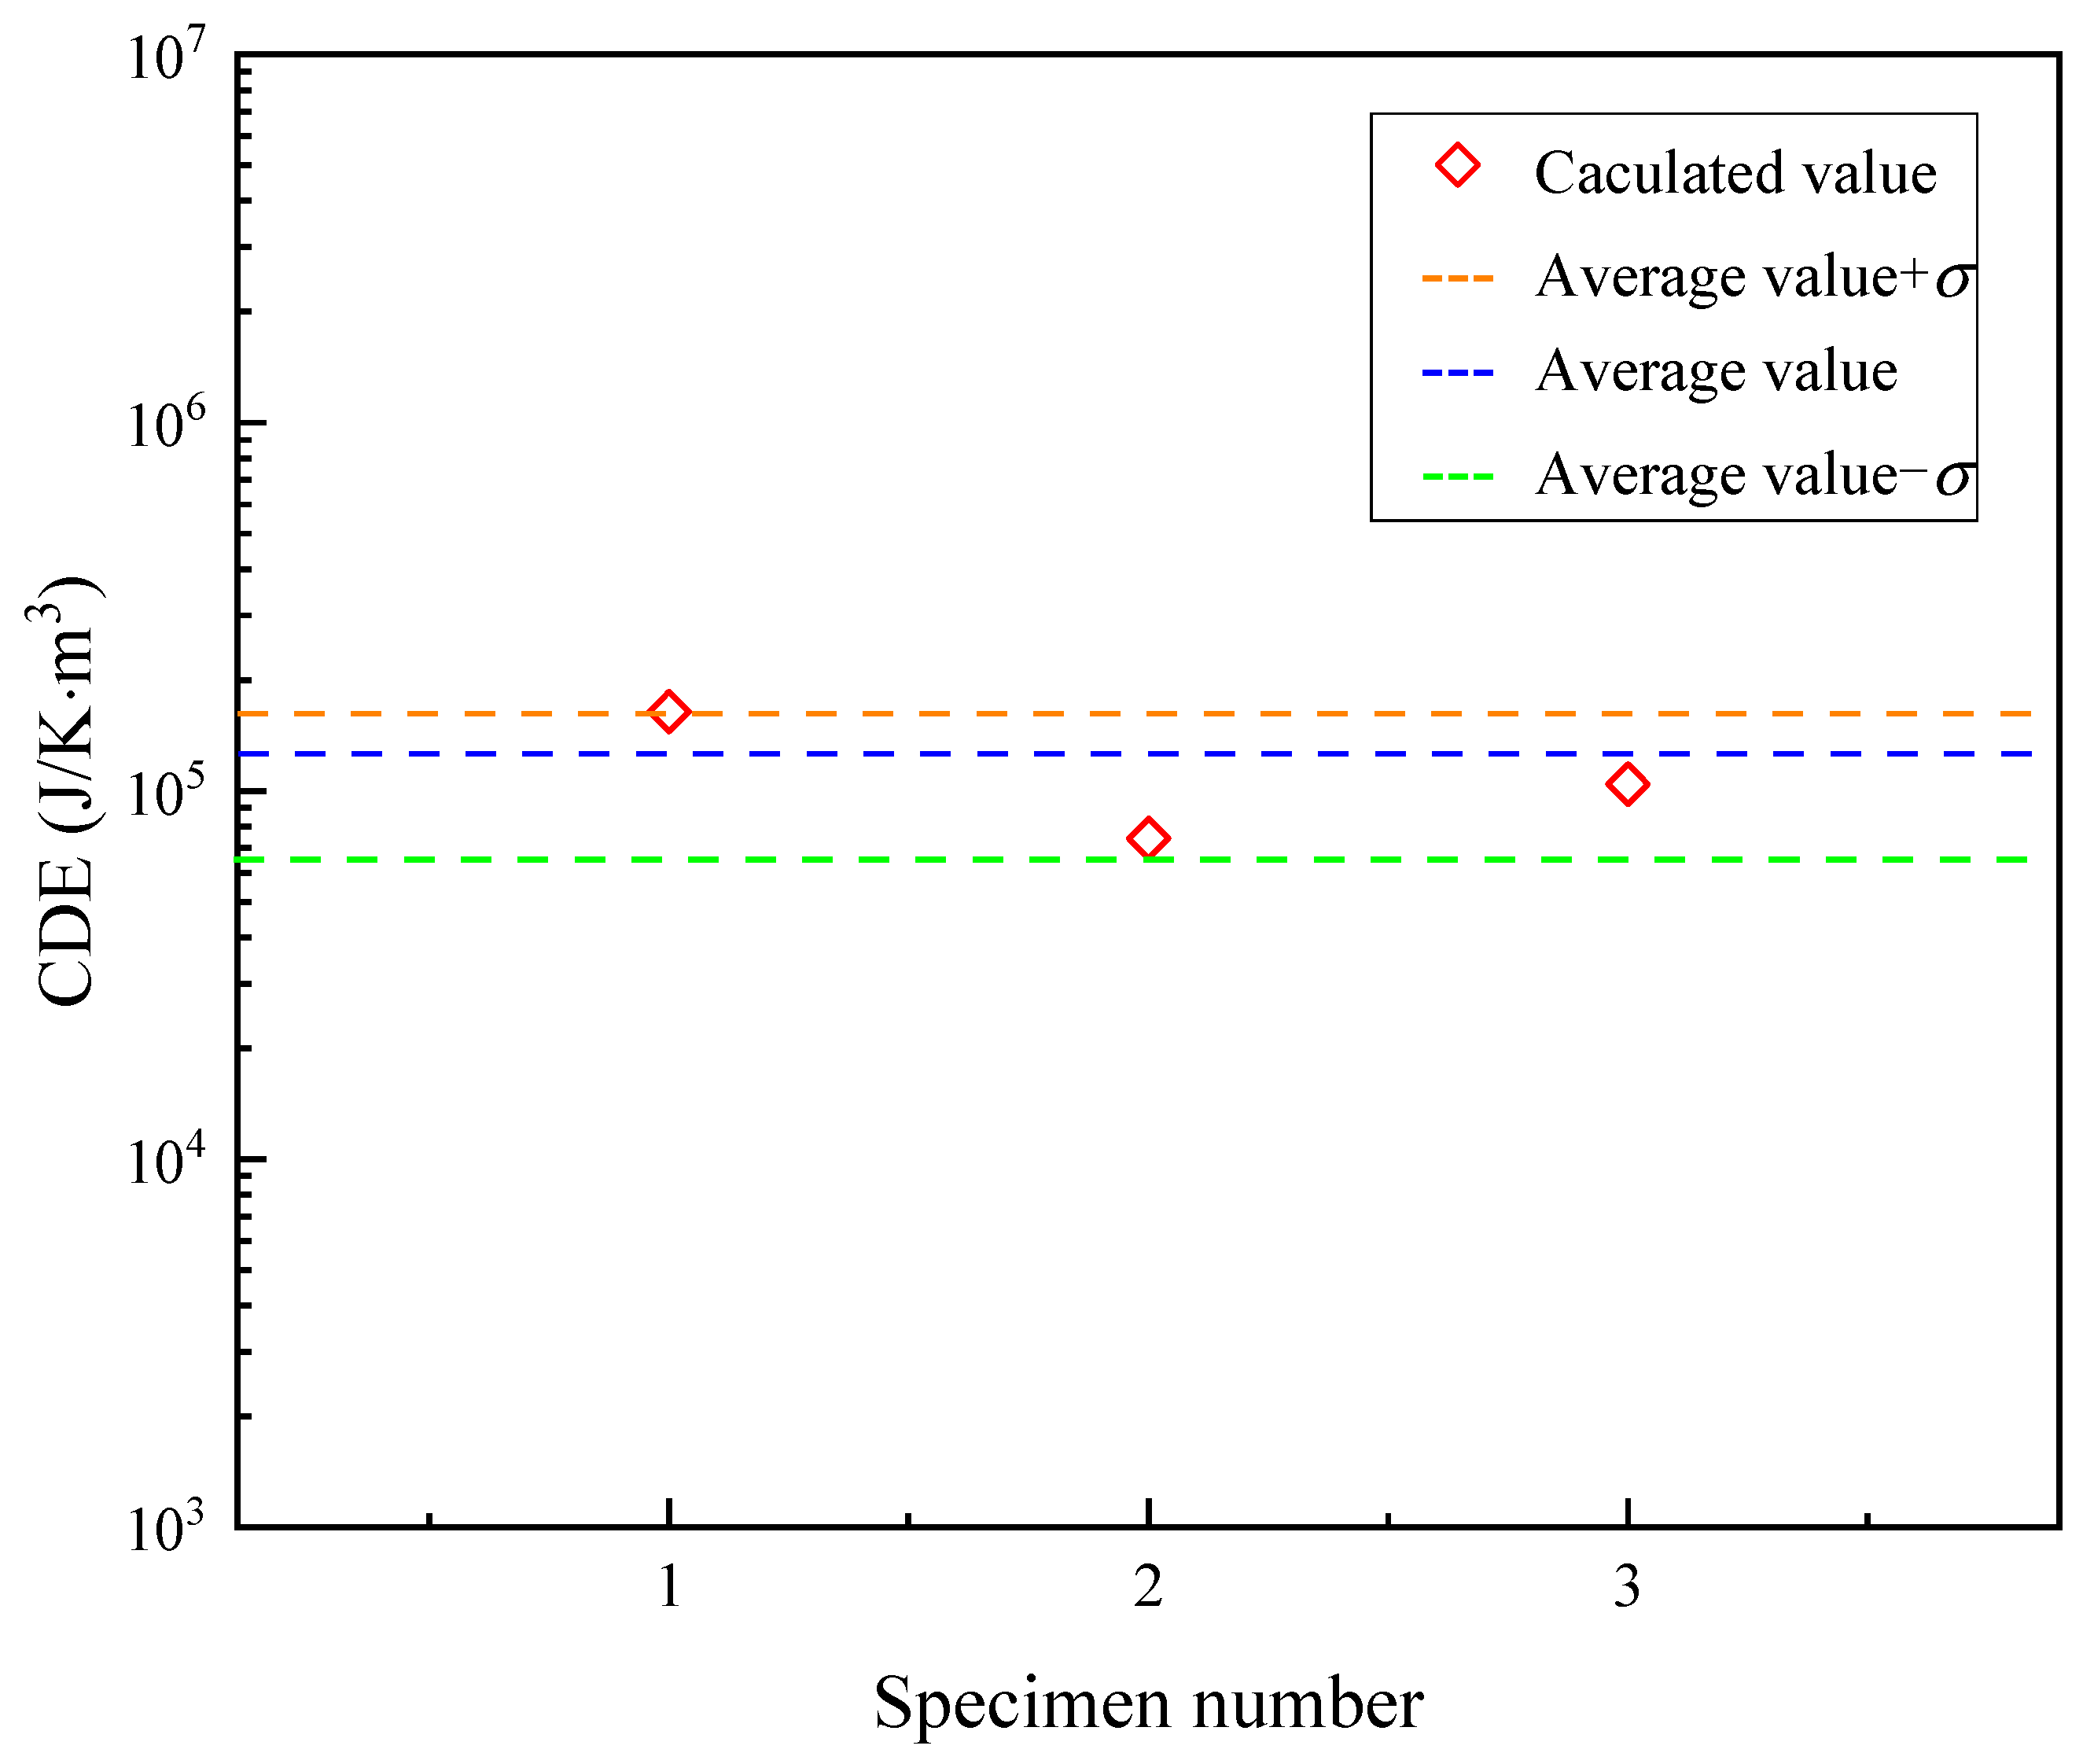
where B is 9.14 × 10⁻³, which equals the slope of the fitting line 2, as shown in Figure 8. After obtaining the in that corresponds to the stress amplitude above the fatigue limit, we need to calculate the average CDE threshold. Here, as mentioned in Section 4.3, Procedure (2), three specimens with a stress amplitude of 148.5 MPa were selected to calculate the average value of CDE, i.e., CDE _____ . The CDE (red hollow diamond) of three specimens with a stress amplitude of 148.5 MPa and CDE _____ (blue dotted line), as shown in Figure 11 and Table 5. In Figure 11, the CDE of three specimens is basically distributed within the area of the values of CDE _____ + σ (orange dotted line) and CDE _____ σ (green dotted line). Thus, in this work, the CDE can be regarded as a constant independently of loads, which is consistent with the assumption in Section 3.3 and the conclusion reported in the literature [47].
Therefore, the S-N curve with a survival probability rate of 50% based on the CDE during HCF is written as follows:
( Σ a 111.03 ) N f = 1.25 × 10 7 ,   ( Σ a > σ y )
According to Equation (35), the S-N curve with a survival probability rate of 50% is plotted in Figure 12 and combined with the maximum likelihood method, the 5% and 95% survival probability rate S-N curves are well established. In Figure 12, most of the tested data are well distributed in the area between the solid blue line (predicted 95% S-N curve based on maximum likelihood method) and the blue dash-dot line (predicted 5% S-N curve based on maximum likelihood method). The blue dash line represents the predicted 50% S-N curve based on the developed CDE model, and the predicted 50% S-N curve has a good accordance with the tested 50% S-N curve (red dash line), indicating that the developed S-N curve modeling method based on CDE yields a good prediction of fatigue life distribution.
This works aims to develop an S-N curve modeling method for rapid S-N curve prediction. For median S-N curve estimation, we tested three specimens for obtaining the average CDE, and combined with the well-established model in Section 3.3, the rapid S-N curve with 50% survival probability rate is quickly calculated. Then, the predicted life under different stress amplitudes and the tested data of three specimens can be used to rapidly calculate the S-N curve with different stress amplitudes, in combination with the maximum likelihood method.

6. Conclusions

In this paper, we investigated the self-heating of Q460 welded joints under sinusoidal tensile cyclic loads. The temperature profile of the specimen under different stress amplitudes during HCF was monitored. The entropy production rate per unit of time under different stress levels was calculated using the obtained thermographic data. The results exhibit that the entropy production rate slowly increases under a stress amplitude lower than the fatigue limit. In contrast, the entropy production rate rapidly rises when the stress amplitude is higher than the fatigue limit.
The entropy production during HCF can be mainly classified into two parts combined with the RVE model: (i) cumulative damage entropy associated with irreversible damage accumulation; (ii) entropy production originating from recoverable microstructural motions. Consequently, we considered the average CDE threshold that exists during HCF. Therefore, we suggest a generalized protocol for the rapid S-N curve prediction based on thermographic data as follows:
(1)
Perform fatigue tests of Q460 welded joints and simultaneously record the temperature field using an infrared camera;
(2)
Calculate the entropy production rate in Phase II under different stress amplitudes. Two datasets of the entropy generation rate are obtained. Fit them linearly to determine the fatigue limit;
(3)
Test three specimens to acquire the average CDE threshold and realize the P-S-N curve prediction combining with the maximum likelihood method. Finally, the P-S-N curve can be estimated quickly compared with the traditional method. This new method complements conventional methods toward achieving rapid S-N curve prediction of welded joints.

Author Contributions

Conceptualization, W.W. and X.Y.; methodology, W.W.; validation, W.W; investigation, W.W. and X.Y.; data curation, W.W., H.X. and C.L.; writing—original draft preparation, W.W.; writing—review and editing, W.W. and Y.S.; su-pervision, X.Y.; funding acquisition, X.Y. All authors have read and agreed to the published version of the manuscript.

Funding

This research was funded by [the National Natural Science Foundation of China] grant number (51875072), [the National Natural Science Foundation of China] grant number (52005071), and [Foundation for Overseas Talents Training Project in Liaoning Colleges and Universities] grant number [2018LNGXGJWPY-YB012]. And the APC was funded by [Foundation for Overseas Talents Training Project in Liaoning Colleges and Universities].

Institutional Review Board Statement

Not applicable.

Informed Consent Statement

Not applicable.

Data Availability Statement

All data generated or analysed during this study are included in this article.

Acknowledgments

The authors are grateful for the support provided by the National Natural Science Foundation of China (ProjectNo. 51875072), the National Natural Science Foundation of China (ProjectNo. 52005071), and Foundation for Overseas Talents Training Project in Liaoning Colleges and Universities (ProjectNo. 2018LNGXGJWPY-YB012).

Conflicts of Interest

The authors declare no conflict of interest.

Nomenclature

BMaterial coefficient
CSpecific heat capacity
CDECumulative damage entropy
d1Intrinsic dissipation
dRVEMicroplastic energy dissipation
dinInelastic dissipation
danAnelastic dissipation
eKinematic viscosity
FHelmholtz free energy
fTest frequency
gGravitational acceleration
hCoefficient relates to radiation and convection
hcThe convection coefficient
hrThe radiation coefficient
HCFHigh-cycle fatigue
JqHeat flux
kThermal conductivity
kaHeat conduction coefficient
lThe gauge length
LCFLow-cycle fatigue
n1The number of estimated fatigue life under different stress amplitude based on the proposed model
n2The total number of specimens under a certain stress amplitude
NacThe fatigue life under a certain stress amplitude (n2)
Na(i)The number of estimated fatigue life under different stress amplitude (n1)
reExternal volumetric heat source
Entropy production rate
inEntropy production rate contributed by inelastic behavior
anEntropy production rate resulting from anelasticity
TReal-time temperature
T0Initial temperature
TbSpecimen boundary temperature
TrRoom temperature
TfFilm temperature
upThe standard normal deviation
vPoisson ratio
v0The width of specimen’s gauge part
w0The thickness of specimen’s gauge part
αInternal variables
βSpherical inclusion based on Eshelby analysis
εThermal emissivity
ε ˙ p Strain rate
ηvolume friction fraction of plastic strain coefficient
θTemperature increment
λVolume expansion coefficient
μShear modulus
μacThe mean of logarithmic fatigue life under Σac
μiThe mean of logarithmic fatigue life under Σa(i)
σMicroscopic yield stress tensor
σStefan–Boltzmann constant
σacThe standard deviation under Σac
σiThe standard deviation under Σa(i)
ΣMacroscopic yield stress tensor
ΣaMacro stress amplitude
ΣacA certain stress amplitude
Σa(i)Stress amplitude relates to Na(i)
ΣyFatigue limit
ρDensity
τeqTime constant relates to thermal convection and radiation

References

  1. Xiong, J.J.; Shenoi, R.A. Fatigue and Fracture Reliability Engineering; Springer Science & Business Media: London, UK, 2011. [Google Scholar]
  2. Gurney, T.R.; Saunders, H. Fatigue of Welded Structures (2nd Edition). Eng. Mater. Technol. 1979, 103, 185. [Google Scholar] [CrossRef] [Green Version]
  3. Okagata, Y.; Kiriyama, K.; Kato, T. Fatigue strength evaluation of the Japanese railway wheel. Fatigue Fract. Eng. Mater. Struct. 2007, 30, 356–371. [Google Scholar] [CrossRef]
  4. Fricke, W.; Remes, H.; Feltz, O.; Lilleme, I.; Tchuindjang, D.; Reinert, T.; Nevierov, A.; Sichermann, W.; Brinkmann, M.; Kontkanen, T. Fatigue strength of laser-welded thin-plate ship structures based on nominal and structural hot-spot stress approach. Ships Offshore Struct. 2015, 10, 39–44. [Google Scholar] [CrossRef]
  5. Schijve, J. Fatigue of Structures and Materials; Kluwer Academic Publishers: AA Dordrecht, Netherlands, 2001. [Google Scholar]
  6. Luong, M.; Van, K.D. Metal fatigue limit evaluation using infrared thermography. In Proceedings of the Workshop Advanced Infrared Technology and Applications, Capri, Italy, 20–21 September 1993; pp. 245–253. [Google Scholar]
  7. Luong, M.P. Fatigue limit evaluation of metals using an infrared thermographic technique. Mech Mater 1998, 28, 155–163. [Google Scholar] [CrossRef]
  8. Geraci, A.; La Rosa, G.; Risitano, A. On the new methodology for the determination of the fatigue limit of materials using thermal infrared techniques. In Proceedings of the VDI IMEKO/GESA Symposium, Düsseldorf, Germany, 28–30 April 1992; pp. 183–190. [Google Scholar]
  9. Huang, J.; Pastor, M.-L.; Garnier, C.; Gong, X. Rapid evaluation of fatigue limit on thermographic data analysis. Int. J. Fatigue 2017, 104, 293–301. [Google Scholar] [CrossRef] [Green Version]
  10. Guo, S.; Liu, X.; Zhang, H.; Yan, Z.; Fang, H. Fatigue Limit Evaluation of AZ31B Magnesium Alloy Based on Temperature Distribution Analysis. Metals 2020, 10, 1331. [Google Scholar] [CrossRef]
  11. Amiri, M.; Khonsari, M.M. Life prediction of metals undergoing fatigue load based on temperature evolution. Mater. Sci. Eng. A 2010, 527, 1555–1559. [Google Scholar] [CrossRef]
  12. Xiao-qing, L.; Hong-xia, Z.; Zhi-feng, Y.; Wen-xian, W.; Ya-guo, Z.; Qian-ming, Z. Fatigue life prediction of AZ31B magnesium alloy and its welding joint through infrared thermography. Theor. Appl. Fract. Mech. 2013, 67-68, 46–52. [Google Scholar] [CrossRef]
  13. Zhang, L.; Liu, X.S.; Wu, S.H.; Ma, Z.Q.; Fang, H.Y. Rapid determination of fatigue life based on temperature evolution. Int. J. Fatigue 2013, 54, 1–6. [Google Scholar] [CrossRef]
  14. Acosta, R.; Wu, H.; Venkat, S.R.; Weber, F.; Tenkamp, J.; Walther, F.; Starke, P. SteBLife, a New Approach for the Accelerated Generation of Metallic Materials’ Fatigue Data. Metals 2020, 10, 798. [Google Scholar] [CrossRef]
  15. Amiri, M.; Khonsari, M.M. Rapid determination of fatigue failure based on temperature evolution: Fully reversed bending load. Int. J. Fatigue 2010, 32, 382–389. [Google Scholar] [CrossRef]
  16. Plekhov, O.; PALIN-LUC, T.; Saintier, N.; Uvarov, S.; Naimark, O. Fatigue crack initiation and growth in a 35CrMo4 steel investigated by infrared thermography. Fatigue Fract. Eng. Mater. Struct. 2010, 28, 169–178. [Google Scholar] [CrossRef] [Green Version]
  17. Wagner, D.; Ranc, N.; Bathias, C.; Paris, P.C. Fatigue crack initiation detection by an infrared thermography method. Fatigue Fract. Eng. Mater. Struct. 2009, 33, 12–21. [Google Scholar] [CrossRef]
  18. Yang, W.; Guo, X.; Guo, Q.; Fan, J. Rapid evaluation for high-cycle fatigue reliability of metallic materials through quantitative thermography methodology. Int. J. Fatigue 2019, 124, 461–472. [Google Scholar] [CrossRef]
  19. Guo, Q.; Guo, X.; Fan, J.; Wu, C. Research on high-cycle fatigue behavior of FV520B steel based on intrinsic dissipation (in chinese). Acta Metall. Sin. 2015, 51, 18–24. [Google Scholar]
  20. Guo, Q.; Guo, X. Research on high-cycle fatigue behavior of FV520B stainless steel based on intrinsic dissipation. Mater. Des. 2016, 90, 248–255. [Google Scholar] [CrossRef]
  21. Fan, J.; Zhao, Y.; Guo, X. A unifying energy approach for high cycle fatigue behavior evaluation. Mech. Mater. 2018, 120, 15–25. [Google Scholar] [CrossRef]
  22. Teng, Z.; Wu, H.; Boiler, C.; Starke, P. A unified fatigue life calculation based on intrinsic thermal dissipation and microplasticity evolution. Int. J. Fatigue 2020, 131, 105370. [Google Scholar] [CrossRef]
  23. Naderi, M.; Amiri, M.; Khonsari, M.M. On the thermodynamic entropy of fatigue fracture. Proc. R. Soc. A Math. Phys. Eng. Sci. 2010, 466, 423–438. [Google Scholar] [CrossRef] [Green Version]
  24. Naderi, M.; Khonsari, M. An experimental approach to low-cycle fatigue damage based on thermodynamic entropy. Int. J. Solids Struct. 2010, 47, 875–880. [Google Scholar] [CrossRef] [Green Version]
  25. Naderi, M.; Khonsari, M. Real-time fatigue life monitoring based on thermodynamic entropy. Struct. Health Monit. 2011, 10, 189–197. [Google Scholar] [CrossRef]
  26. Ribeiro, P.; Petit, J.; Gallimard, L. Experimental Determination of Entropy and Exergy in Low Cycle Fatigue. Int. J. Fatigue 2019, 136, 105333. [Google Scholar] [CrossRef]
  27. Salimi, H.; Pourgol-Mohammad, M.; Yazdani, M. Metal Fatigue Assessment Based on Temperature Evolution and Thermodynamic Entropy Generation. Int. J. Fatigue 2019, 127, 403–416. [Google Scholar] [CrossRef]
  28. Rongda, Z.; Dejun, X.; Tao, L.; Fangbin, W.; Zhutao, C. Thermodynamic Entropy Characteristics Analysis and Life Prediction Model of Metal Low Cycle Fatigue Processes (in chinese). China Mech. Eng. 2019, 30, 1904–1910. [Google Scholar]
  29. Wang, J.; Yao, Y. An Entropy Based Low-Cycle Fatigue Life Prediction Model for Solder Materials. Entropy 2017, 19, 503. [Google Scholar] [CrossRef] [Green Version]
  30. Mahmoudi, A.; Mohammadi, B. On the evaluation of damage-entropy model in cross-ply laminated composites. Eng. Fract. Mech. 2019, 219, 106626. [Google Scholar] [CrossRef]
  31. Teng, Z.; Wu, H.; Boller, C.; Starke, P. Thermodynamic entropy as a marker of high-cycle fatigue damage accumulation: Example for normalized SAE 1045 steel. Fatigue Fract. Eng. Mater. Struct. 2020, 1–13. [Google Scholar] [CrossRef]
  32. Huang, J.; Li, C.; Liu, W. Investigation of internal friction and fracture fatigue entropy of CFRP laminates with various stacking sequences subjected to fatigue loading. Thin-Walled Struct. 2020, 155, 106978. [Google Scholar] [CrossRef]
  33. Doudard, C.; Calloch, S.; Cugy, P.; Galtier, A.; Hild, F. A probabilistic two-scale model for high-cycle fatigue life predictions. Fatigue Fract. Eng. Mater. Struct. 2010, 28, 279–288. [Google Scholar] [CrossRef] [Green Version]
  34. Fan, J.L.; Guo, X.L.; Wu, C.W.; Zhao, Y.G. Research on fatigue behavior evaluation and fatigue fracture mechanisms of cruciform welded joints. Mater. Sci. Eng. A 2011, 528, 8417–8427. [Google Scholar] [CrossRef]
  35. Guo, Q.; Guo, X.; Fan, J.; Syed, R.; Wu, C. An energy method for rapid evaluation of high-cycle fatigue parameters based on intrinsic dissipation. Int. J. Fatigue 2015, 80, 136–144. [Google Scholar] [CrossRef]
  36. Corigliano, P.; Epasto, G.; Guglielmino, E.; Risitano, G. Fatigue analysis of marine welded joints by means of DIC and IR images during static and fatigue tests. Eng. Fract. Mech. 2017, 183, 26–38. [Google Scholar] [CrossRef]
  37. Chrysochoos, A.; Louche, H. An infrared image processing to analyse the calorific effects accompanying strain localisation. Int. J. Eng. Sci. 2000, 38, 1759–1788. [Google Scholar] [CrossRef]
  38. Yang, W.; Guo, X.; Guo, Q. A high-cycle fatigue energy dissipation accurate estimation method considering natural convection and radiation heat transfer. Int. J. Fatigue 2020, 138, 105717. [Google Scholar] [CrossRef]
  39. Holman, J.P. Heat Transfer, 10th ed.; McGraw-Hill: New York, NY, USA, 2010. [Google Scholar]
  40. Lemaitre, J.; Chaboche, J.-L. Mechanics of Solid Materials; Cambridge University Press: Cambridge, UK, 1990. [Google Scholar]
  41. Gao, Z. Fatigue Applied Statistics (in Chinese); National Defence Industry Press: Beijing, China, 1986. [Google Scholar]
  42. Gu, Y.J.; Jin, T.Z.; Zu, H.D.; Xu, J.; Chen, D.C. High-Cycle Fatigue P-S-N Curve Estimating Method Based on Maximum Likelihood Method for Turbine Coupling Bolt Materials. Appl. Mech. Mater. 2014, 541–542, 592–598. [Google Scholar] [CrossRef]
  43. Zhang, H.; Wu, G.; Yan, Z.; Guo, S.; Chen, P.; Wang, W. An experimental analysis of fatigue behavior of AZ31B magnesium alloy welded joint based on infrared thermography. Mater. Des. 2014, 55, 785–791. [Google Scholar] [CrossRef]
  44. Liu, Y. Research on Cumulative Damage Aseessment Method of Spot Welded Joints Based on Fatigue Damage Entropy; Dalian Jiaotong University: Dalian, China, 2018. [Google Scholar]
  45. Liu, Y.; Sun, Y.; Sun, Y.; Xu, H.; Yang, X. Rapid fatigue life prediction for spot-welded joint of SUS301 L-DLT stainless steel and Q235B carbon steel based on energy dissipation. Adv. Mech. Eng. 2018, 10, 1687814018811013. [Google Scholar] [CrossRef]
  46. Skibicki, D.; Lipski, A.; Pejkowski, Ł. Evaluation of plastic strain work and multiaxial fatigue life in CuZn37 alloy by means of thermography method and energy-based approaches of Ellyin and Garud. Fatigue Fract. Eng. Mater. Struct. 2018, 4, 2541–2556. [Google Scholar] [CrossRef]
  47. Huang, J.; Garnier, C.; Pastor, M.L.; Gong, X. Investigation of self-heating and life prediction in CFRP laminates under cyclic shear loading condition based on the infrared thermographic data. Eng. Fract. Mech. 2020, 229, 106971. [Google Scholar] [CrossRef]
  48. Dong, P. A Structural Stress Definition and Numerical Implementation for Fatigue Analysis of Welded Joints. Int. J. Fatigue 2001, 23, 865–876. [Google Scholar] [CrossRef]
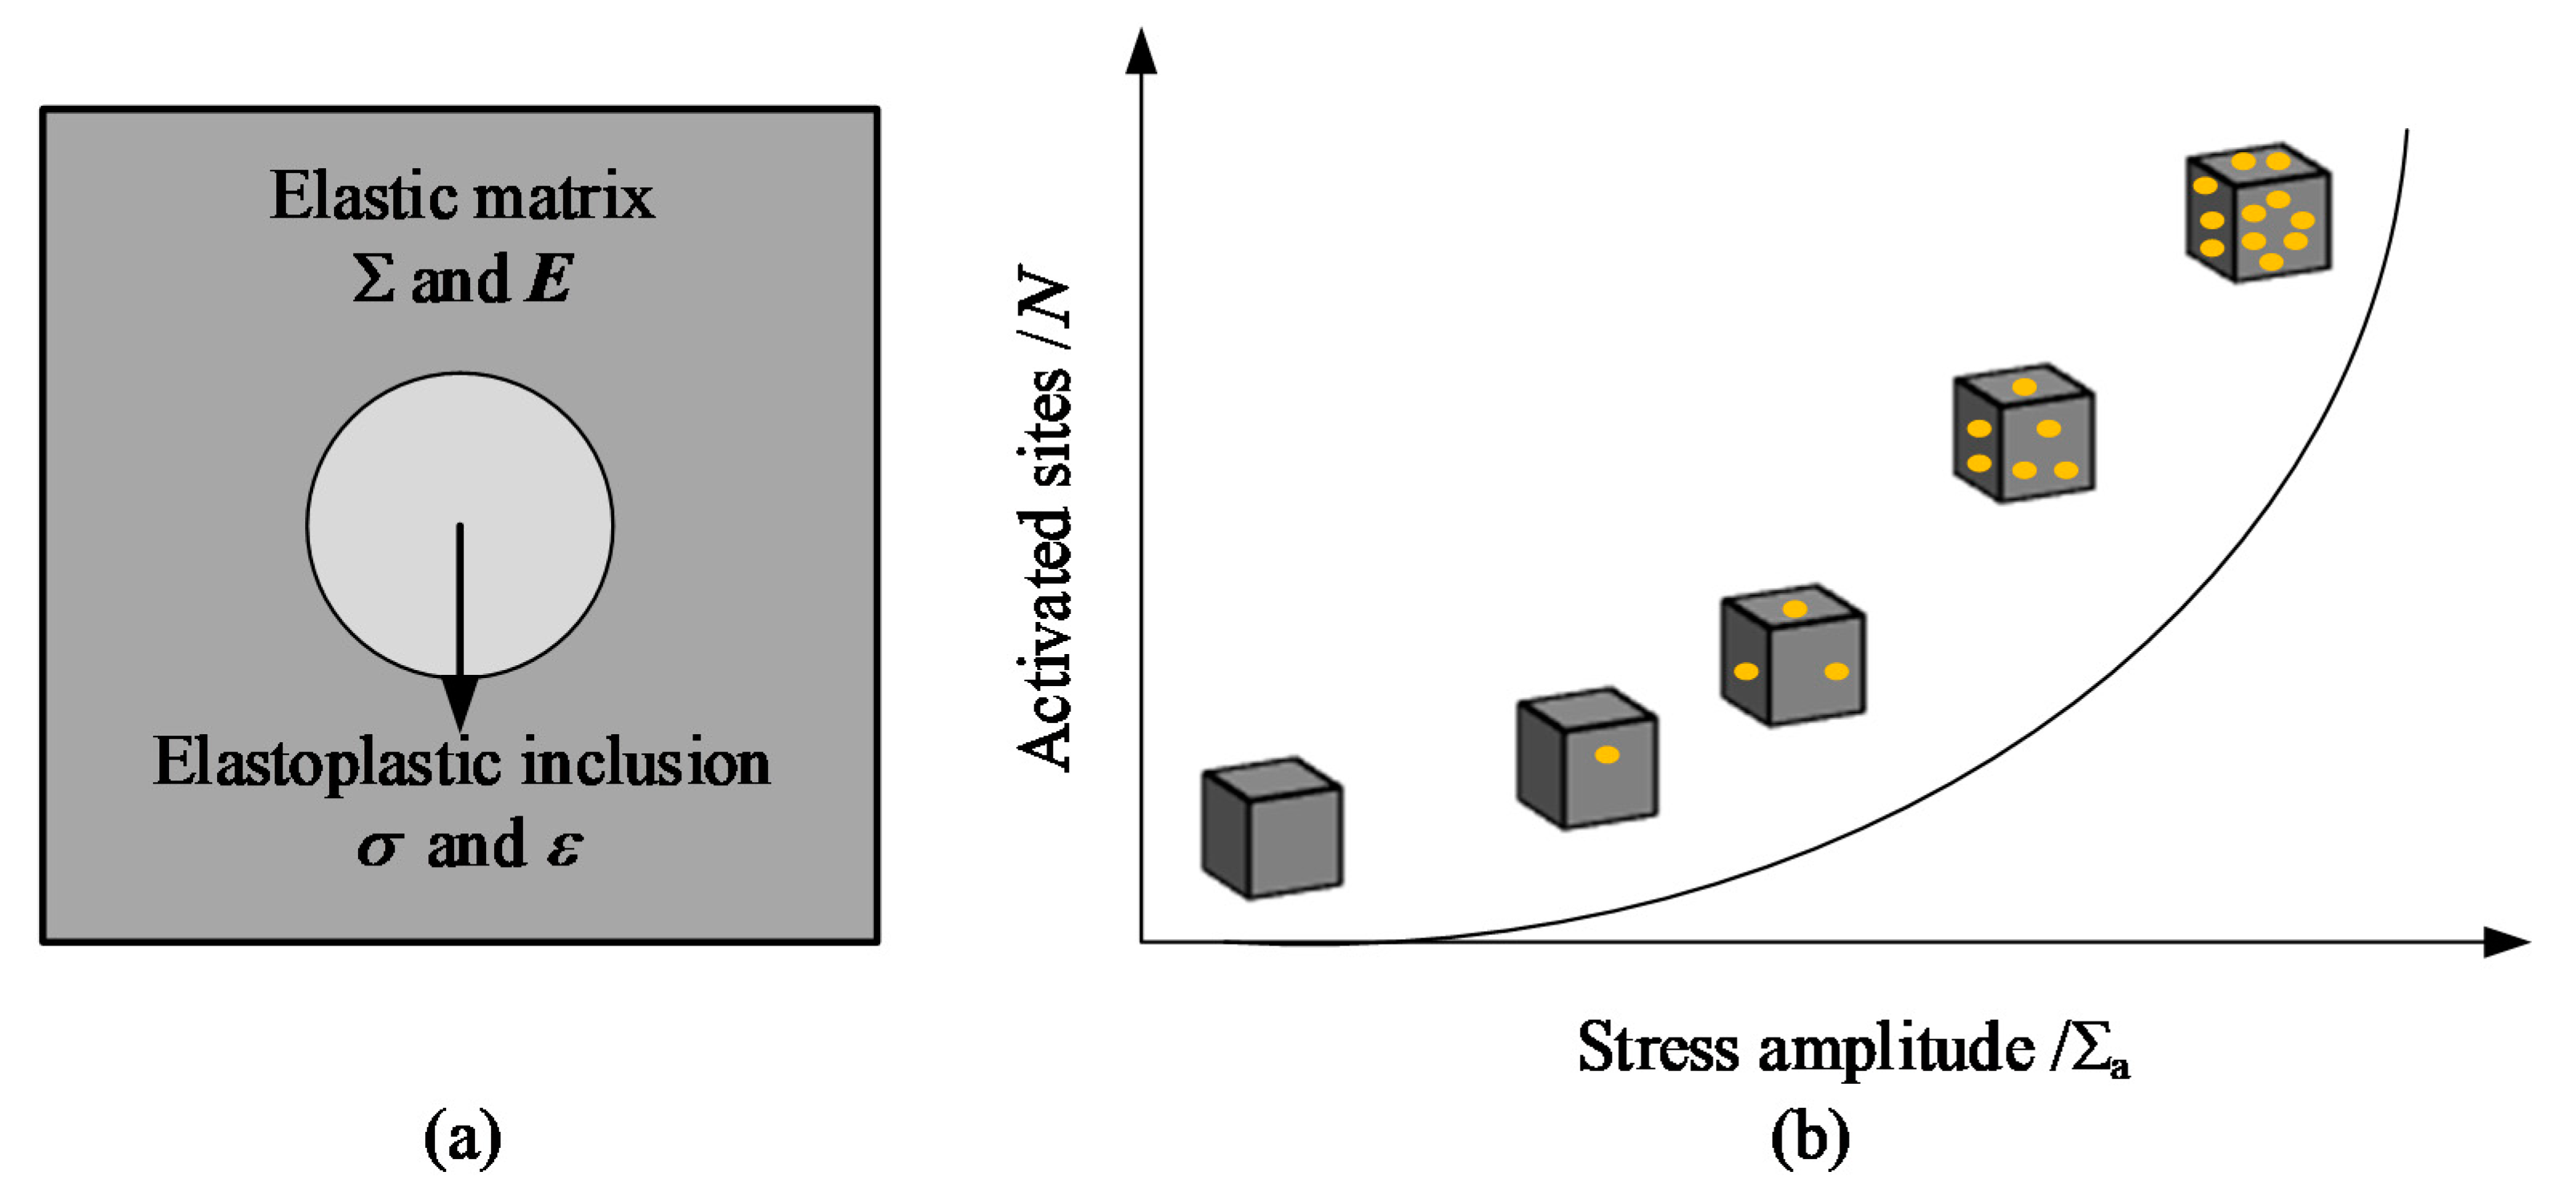
Figure 1. Schematic representation of representative volume element (RVE) model: (a) RVE model; (b) Activated sites within an elastoplastic inclusion during high-cycle fatigue (HCF).
Metals 11 00232 g001
Figure 2. Three phases of the temperature increase in the fatigue test.
Metals 11 00232 g002
Figure 3. Schematic representation of the specimen geometry during the fatigue test.
Metals 11 00232 g003
Figure 4. The entropy generation rate induced by inelasticity and anelasticity during HCF: (a) entropy production rate caused by anelasticity during HCF; (b) fatigue limit prediction model.
Metals 11 00232 g004
Figure 5. Experimental apparatus.
Metals 11 00232 g005
Figure 6. Temperature evolution during fatigue at different loading levels.
Metals 11 00232 g006
Figure 7. Infrared images and the three-stage fatigue temperature increase of the specimen at an amplitude of 148.5 MPa. (a) Typical thermal images; (b) three-stage fatigue evolution; (c) 3D temperature profile.
Metals 11 00232 g007
Figure 8. Fatigue limit prediction based on the developed method.
Metals 11 00232 g008
Figure 9. Fatigue limit determination based on the staircase method.
Metals 11 00232 g009
Figure 10. Fractographic analysis of Q460 welded joints: (a) fracture surface of weld toe; (b) initial crack; (c) propagated crack; (d) fiber region.
Metals 11 00232 g010
Figure 11. The CDE of three specimens with the stress amplitude of 148.5 MPa.
Metals 11 00232 g011
Figure 12. Comparison between predicted S-N curves and experimental data.
Metals 11 00232 g012
Table 1. Chemical composition of Q460 low-carbon steel (%).
MaterialCMnSiNiMoVTiAl
Q460≤0.161.70.60.50.20.10.050.02 ~ 0.04
Table 2. Mechanical properties of Q460 low-carbon steel.
MaterialElastic Modulus (GPa)Yield Strength (MPa)Tensile Strength (MPa)Elongation (%)
Q46019049063019
Table 3. Welding parameters of Q460 low-carbon steel butt joint.
Welding Voltage (V)Welding Current (A)Welding Speed (mm/s)Welding Pass
262206.51
Table 4. The error between the developed method (DM) and staircase methods (SM).
ParametersDMSM|Error|
Fatigue limit (MPa)111.03121.58.62%
Table 5. The cumulative damage entropy (CDE) of three specimens and CDE when the stress amplitude is 148.5 MPa.
Specimen NumberNo.1No.2No.3
CDE (J/K·m3)1.64 × 1057.43 × 1041.04 × 105
CDE _____ (J/K·m3)1.14 × 105
Publisher’s Note: MDPI stays neutral with regard to jurisdictional claims in published maps and institutional affiliations.