Article

Weld Geometry, Mechanical Properties, Microstructure and Chemical Composition of AA6063 in Tungsten Inert Gas Welding with Intermittent Controlled Wire Feeding Method

by
Ario Sunar Baskoro
*,
Mohammad Azwar Amat
,
Serafina Purti D. Simatupang
,
Yala Abrara
and
Agus Widyianto
Department of Mechanical Engineering, Faculty of Engineering, Universitas Indonesia, Kampus UI, Depok 16424, Indonesia
*
Author to whom correspondence should be addressed.
Metals 2021, 11(2), 316; https://doi.org/10.3390/met11020316
Submission received: 25 December 2020 / Revised: 28 January 2021 / Accepted: 8 February 2021 / Published: 11 February 2021

Abstract

:
In this study, AA 6063 aluminum was joined using Tungsten Inert Gas (TIG) welding with a butt joint. The ER-5356 filler metal feeding method is used intermittently to find its effect on weld geometry, mechanical properties, microstructure, and chemical composition. The dimensions of the specimens used in this study were 120 mm × 50 mm, with a thickness of 3 mm. The ratio used is the configuration of the feed time and delay time. The length ratio of wire filler is varied from a ratio of 4 to 6. The top bead width and back bead width decreased by 17.66% and 40.33%, respectively. At a ratio of 6, it has the largest cross-sectional area of 295.37 ± 27.60 mm2. The results show that the general tensile strength was proportional to the ratio, but the difference was not significant, only around ±8 MPa. The microstructure formed in each weld has different characteristics; conversely, grains with a relatively coarse structure have decreased hardness values. The chemical composition test shows that the length ratio of filler metal feed directly correlates with magnesium’s average weight content, where the weight content of magnesium value tends to be homogeneous in all areas of weld metal (WM).

Graphical Abstract

1. Introduction

Aluminum is a material that is often used in various applications such as automotive, aircraft, construction, and piping systems [1,2,3]. Good corrosion resistance, weldability, thermal conductivity, and strength-to-weight ratio are the advantages of aluminum and its alloys [4,5,6,7]. Aluminum alloys can be classified according to the type of main alloying element (series 1xxx to 8xxx), aluminum alloys that cannot be heat-treated or those that can be heat-treated (see in Figure 1) [8]. One of the aluminum alloys that is often used is the 6xxx series, especially the 6063 series. The AA6063 series aluminum alloy is widely used as a construction frame because the alloy has sufficient strength without reducing electrical conductivity, so it is used for power cables [2]. Magnesium and silicon form the compound Mg2Si (magnesium silicide), which provides high strength to this alloy after heat treatment. The welding strength in the incorporation of Aluminum AA6063 can be imperfect, so special treatment is needed in the welding process of this material.
One of the welding processes used in industry is gas tungsten arc welding (GTAW), commonly referred to as tungsten inert gas (TIG). The TIG welding process is one of the most widely used welding processes in various manufacturing industries due to its good bead surface results [9]. TIG welding can be used to join aluminum alloys; although metal inert gas (MIG) welding can also be used, it is not recommended to join thin aluminum alloys [10]. This welding method is included in the category of arc welding, where an electric power supply is used to produce an arc between the electrodes and the workpiece to be joined [11]. In TIG welding, filler metal or no filler metal (autogenous) can be used. The use of added materials in TIG welding is also called wire arc additive manufacturing (WAAM). Another advantage of using TIG welding is that the filler metal feeder’s speed and the amount of current used can be adjusted so that the parent metal penetration can be regulated. With this arrangement, the TIG welding process can be used on thin steel plates or thick steel plates [2]. Therefore, this welding has been widely applied to various metals, including aluminum [12].
Several researchers have developed the wire feed method or the WAAM method for aluminum and its alloys. The main factor influencing obtaining a smooth weld surface’s appearance with a uniform coating when using wire feeders is the amount of heat input [13]. If the wire feed input is greater than the heat input, a defect will occur in the welded material. Therefore, if the heat input is constant, it is necessary to vary the wire feeder’s input, one of which is by using the intermittent controlled wire feeding method. Ario et al. [2] investigated the effect of a controlled intermittent wire feeding method on AA6063 series aluminum. The results show that the Mg content is higher in the middle area weld metal with a high-density eutectic phase for the microstructure. Simultaneously, the tensile strength decreases in areas that lack heat input due to being prone to oxidation. Ishteyaque Ahmad used AA-4047 filler wire to join the AA6061 series aluminum. The results showed that the microstructure consists of a eutectic silicon aluminum dendritic inter-network in an aluminum solid solution matrix because the AA-4047 infill wire contains a lot of silicon [14]. Further development of the intermittent controlled wire feeding method was carried out by varying the length of the feed time and delay time and the speed of the feed wire by Ario [12]. The AA1100 series aluminum was applied to the research, and the results showed that increasing the length ratio increased the porosity and increased the tensile strength.
Geng et al. [13] experimented by varying the welding current, welding speed, and wire feed speed of the 5A06 series aluminum alloy. The results show that the welding currents of 164 A and 132 A have a maximum and minimum surface wave. Subsequent studies by Geng et al. [15] reported that the wire feed angle and the wire feeder vertical adjustment tolerance affect the initial position shift. Bai et al. [16] reported that aluminum alloy 2219 using added materials had the same strength properties. In contrast, Geng et al. [17] explained that the material’s tensile strength in aluminum alloy 5A06 using added materials is influenced by isotropic in the vertical and horizontal directions. Several researchers revealed several problems that often occur when welding using added materials in aluminum alloys, including (1) porosity [18], (2) tensile residual stress [19], (3) crack and deformation [20], and (4) delamination [21].
Arun Narayanan et al. [22] reported their research results using aluminum series 5083, welding with a welding current of 200 A and a protective gas flow rate of 15 L·min−1 produced the strongest mechanical properties. AA6061 series aluminum can produce a finer microstructure in the weld metal (WM) than the base metal (BM). This also affects the mechanical properties (tensile test or microhardness test) [23]. Another study states that the aluminum AA6063 series can be improved in material quality to meet industry standards by several methods such as quality process (Qpc), six sigma quality index (SSQI) for the quality characteristics of smaller-the-better (STB) and nominal-the-best (NTB), and they develop a multi-characteristic quality analysis model (MCQAM) with five stages [24]. Wang et al. [25] reported that the solution treated and aged (STA) joints were effective for use on aluminum AA6061 and improved mechanical properties after welding.
This research is a continuation of the previous study by Ario [2,12], and the results show that the parameters of the intermittent wire feeder ratio of 4–6 resulted in good mechanical, microstructure and mixing properties between the base metal and wire feeder. The results of this study will show, from the weld geometry formed (top bead width and bottom bead width), the mechanical properties (tensile test and material hardness test), chemical composition between the base metal and wire feeder, and the microstructure. This research will further explore and analyze the effect of the variation of the intermittent wire feeder ratio parameters of 4–6 (interpretation of feed time and delay time) and wire feeder speed on the weld geometry, mechanical properties, microstructure and chemical composition. The material used is aluminum series AA6063 with a thickness of 3 mm. This article will focus on three variations of feed time and delay time parameters and three variations of wire feeder speed to produce the best weld joint.

2. Materials and Methods

Aluminum AA6063 with a thickness of 3 mm and ER-5356 (AlMg5Cr) [26] with a diameter of 1.2 mm were used as base metal and filler metal. The specimen was cut into 120 mm × 50 mm × 3 mm, and a butt joint configuration was prepared for the GTAW using Miller Dynasty 210 DX TIG Welding machine (Miller Electric Mfg. Co., Appleton, US and Canada). High-purity argon (99.9%) with 13 L·min−1 of flow rate was applied. An AWS class EWP pure tungsten electrode (green tip) with a diameter of 2.4 mm was used with a sharpening angle of 25°. The distance between the workpiece and the tungsten was 5 mm, with the angle of the tungsten to the workpiece and the angle of the wire feeder to the workpiece being 90° and 15°, respectively. Welding parameters were set on AC mode with welding speed 1.5 mm·s−1, welding current 115 A on all configurations and arc voltage 11 V. The ratio parameter of the intermittent wire feeder is listed in Table 1. Figure 2a shows the schematic illustration of cycle time, feed time and delay time, where the feed time and delay time are varied by the amount of 1 s (1 cycle time). Table 2 shows the chemical composition of AA6063 and filler wire ER-5356. The Optical Emission Spectrometer (OES) (Ametec materials division, Kleve, Germany) was used to test the chemical composition. There is preheating of the specimen for 10 s so that the temperature is sufficient to melt the base metal and wire feeder. In addition, a thermocouple type K was placed at a distance, as shown in Figure 2b, to determine the temperature history during the welding process.
Welding geometry testing was done by measuring the top bead width (TBW) and back bead width (BBW) due to the welding. The weld bead measurement started from 15 mm from the starting point of welding, and there were 6 measuring points with a distance between the points of 10 mm. The scheme of measuring the weld bead’s width and thermocouple is shown in Figure 2b. Dino-Lite AM 4115 Series (AnMo Electronics Co., Taipei, Taiwan) was used to measure the bead’s width. The reinforcement and root depth measurements were also carried out in the weld area, as shown in Figure 2c. A coordinate measuring machine CMM M443 (Mitutoyo Asia Pacific Pte. Ltd., Kallang Avenue, Singapore) was used to measure the depth of reinforcement and root, where measurements were made before and after welding at 6 points, as well as measuring the width of the bead. Furthermore, the cross-sectional area of the weld was calculated from the measurement data of bead width, reinforcement and root depth. The calculation of the cross-sectional area of the weld had 3 areas, as shown in Figure 2c. Area 1 (Areinforcement) was the cross-sectional area of the weld with a reinforcement depth in the form of concavity and convexity, which can be calculated by Equation (1):
Areinforcement = 0.75 × TBW × a
Area 2 (Atrapezoid) was the cross-sectional area of the weld in the shape of a trapezoid, which can be calculated by Equation (2) [2]:
Atrapezoid = ((TBW + BBW)/2) × sheet thickness
Area 3 (Aroot) was the cross-sectional area of the weld with root depth in the form of convexity, which can be calculated by Equation (3):
Aroot = 0.75 × BBW × b
where the variables TBW, BBW, a and b are top bead width, back bead width, reinforcement depth and root depth, respectively. The overall weld cross-sectional area (Aweld) can be calculated by Equation (4):
Aweld = Areinforcement + Atrapezoid + Aroot
Tensile testing was carried out using Tensilon RTF-2350 universal testing machine (A&D Company, Tokyo, Japan) with a maximum load of 50 kN. The specimens dimension followed the standard of ASTM E-8M. The crosshead displacement rate used was 5 mm/min, and the ultimate tensile strength (UTS) was plotted with the ratio parameter of intermittent wire feeders. Microhardness testing was carried out in two directions, the horizontal axis (from the base metal to the weld area) and the vertical axis (center in the WM from the bottom to the top) (see in Figure 3a). The microhardness was measured using a Mitutoyo 810 Vickers microhardness testing machine (Mitutoyo Asia Pacific Pte. Ltd., Kallang Avenue, Singapore) with a load of 100 g for 15 s hold time, and the distance between every two points was 500 μm. For the microstructure investigation, the specimens followed a standard metallography procedure. The samples were etched using a 0.5% HF aqueous solution. The microstructure investigation was carried out using Oxion Inverso OX.2153-PLM optical microscope (Euromex Microscopen, 6836 BD Arnhem, The Netherlands) and scanning electron microscope (SEM) FEI Inspect F50 (FEI Company, Japan) with an energy dispersive spectometer (EDS) attached to see changes in its chemical composition on the horizontal axis (4 areas) and the vertical axis (3 areas). The area observed for the microstructure can be seen in Figure 3b, while the welding results’ chemical composition can be seen in Figure 3c.

3. Results and Discussion
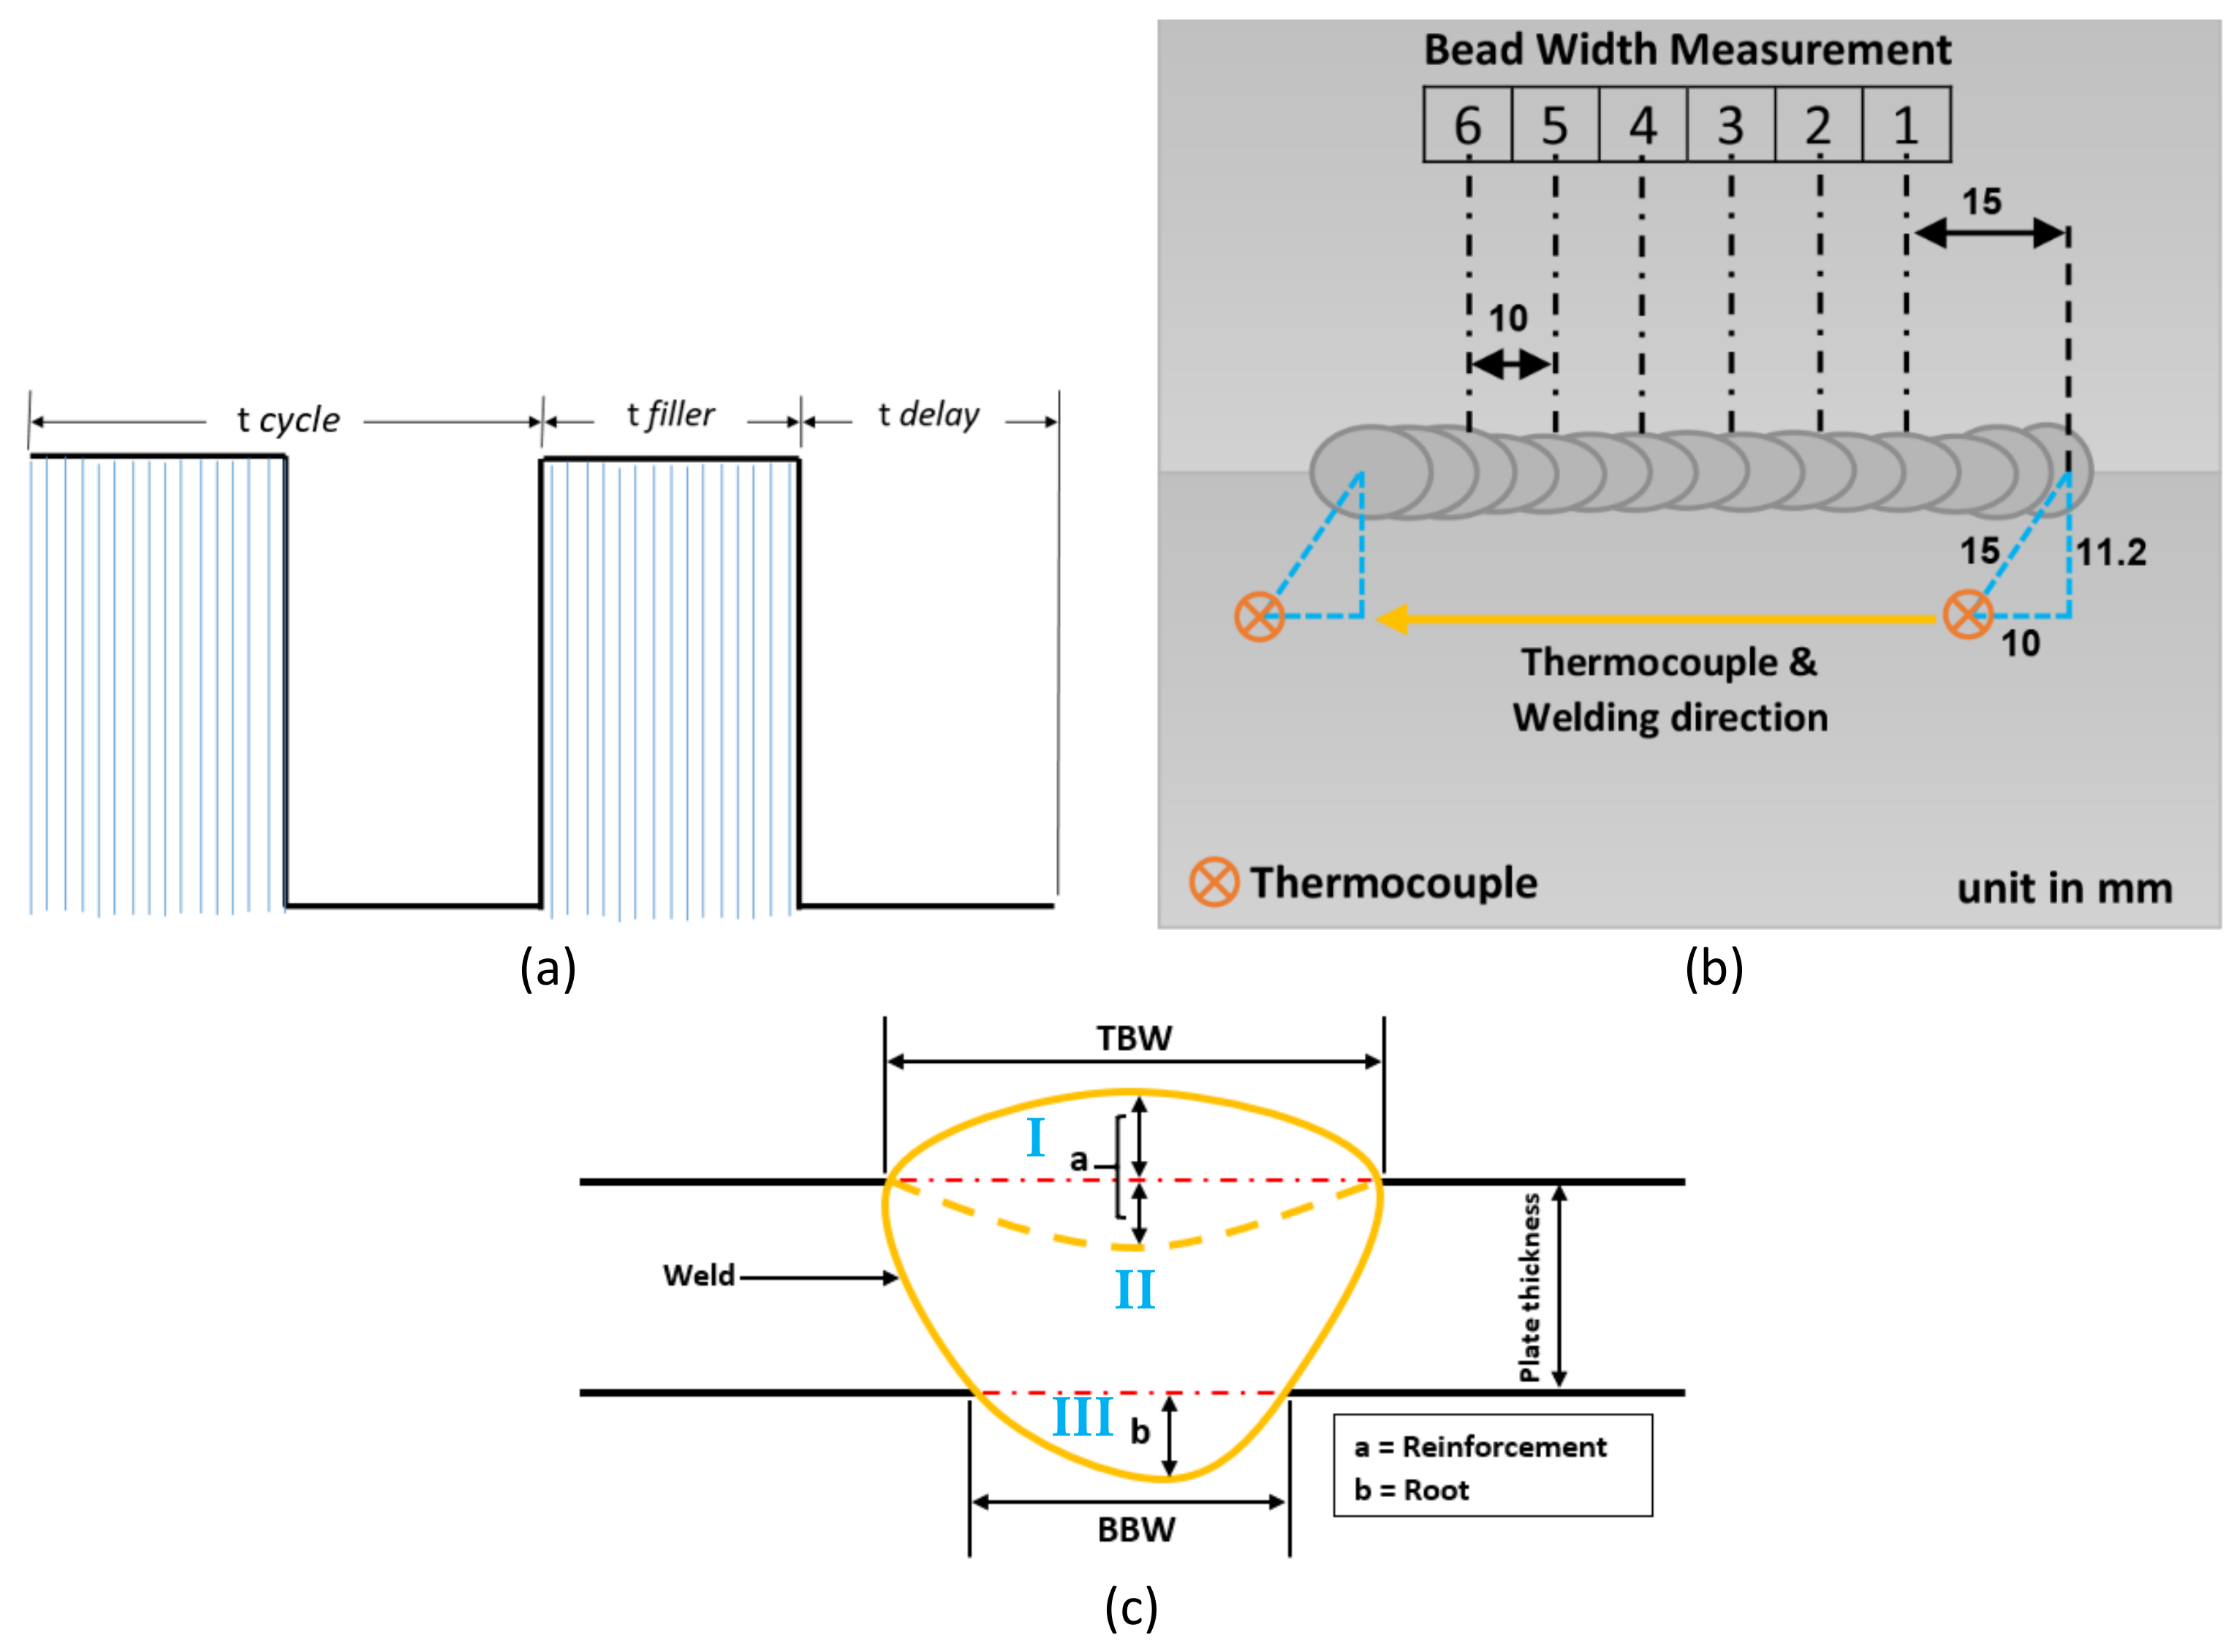
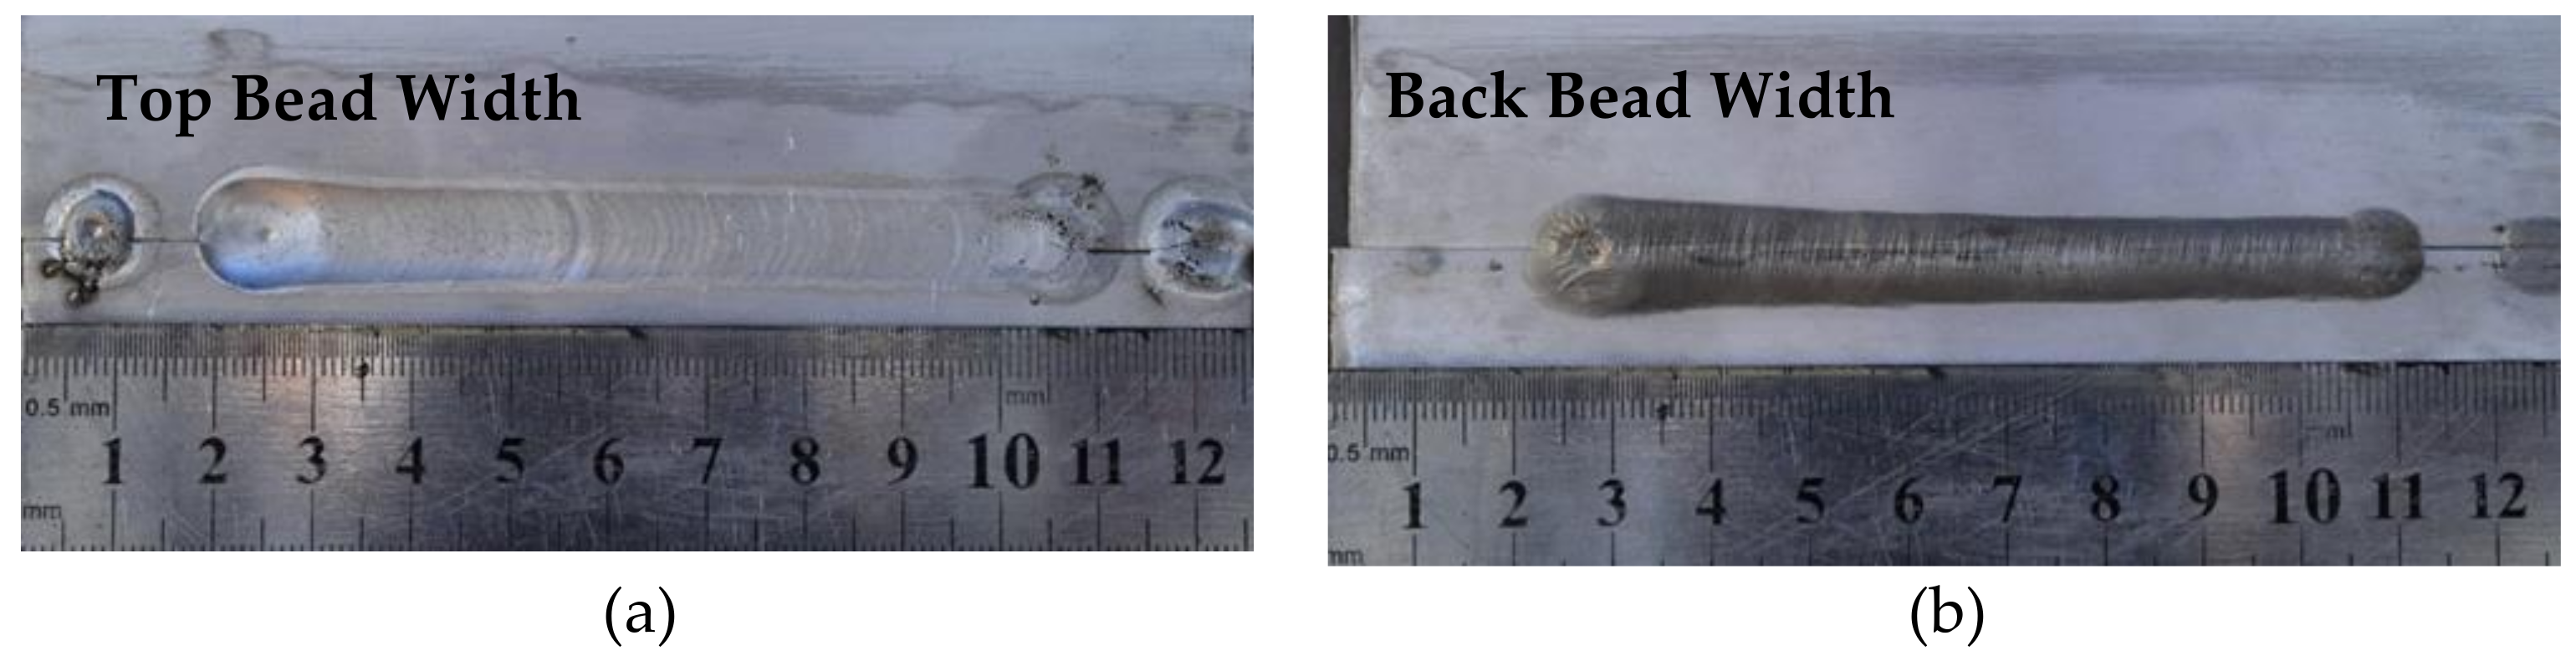
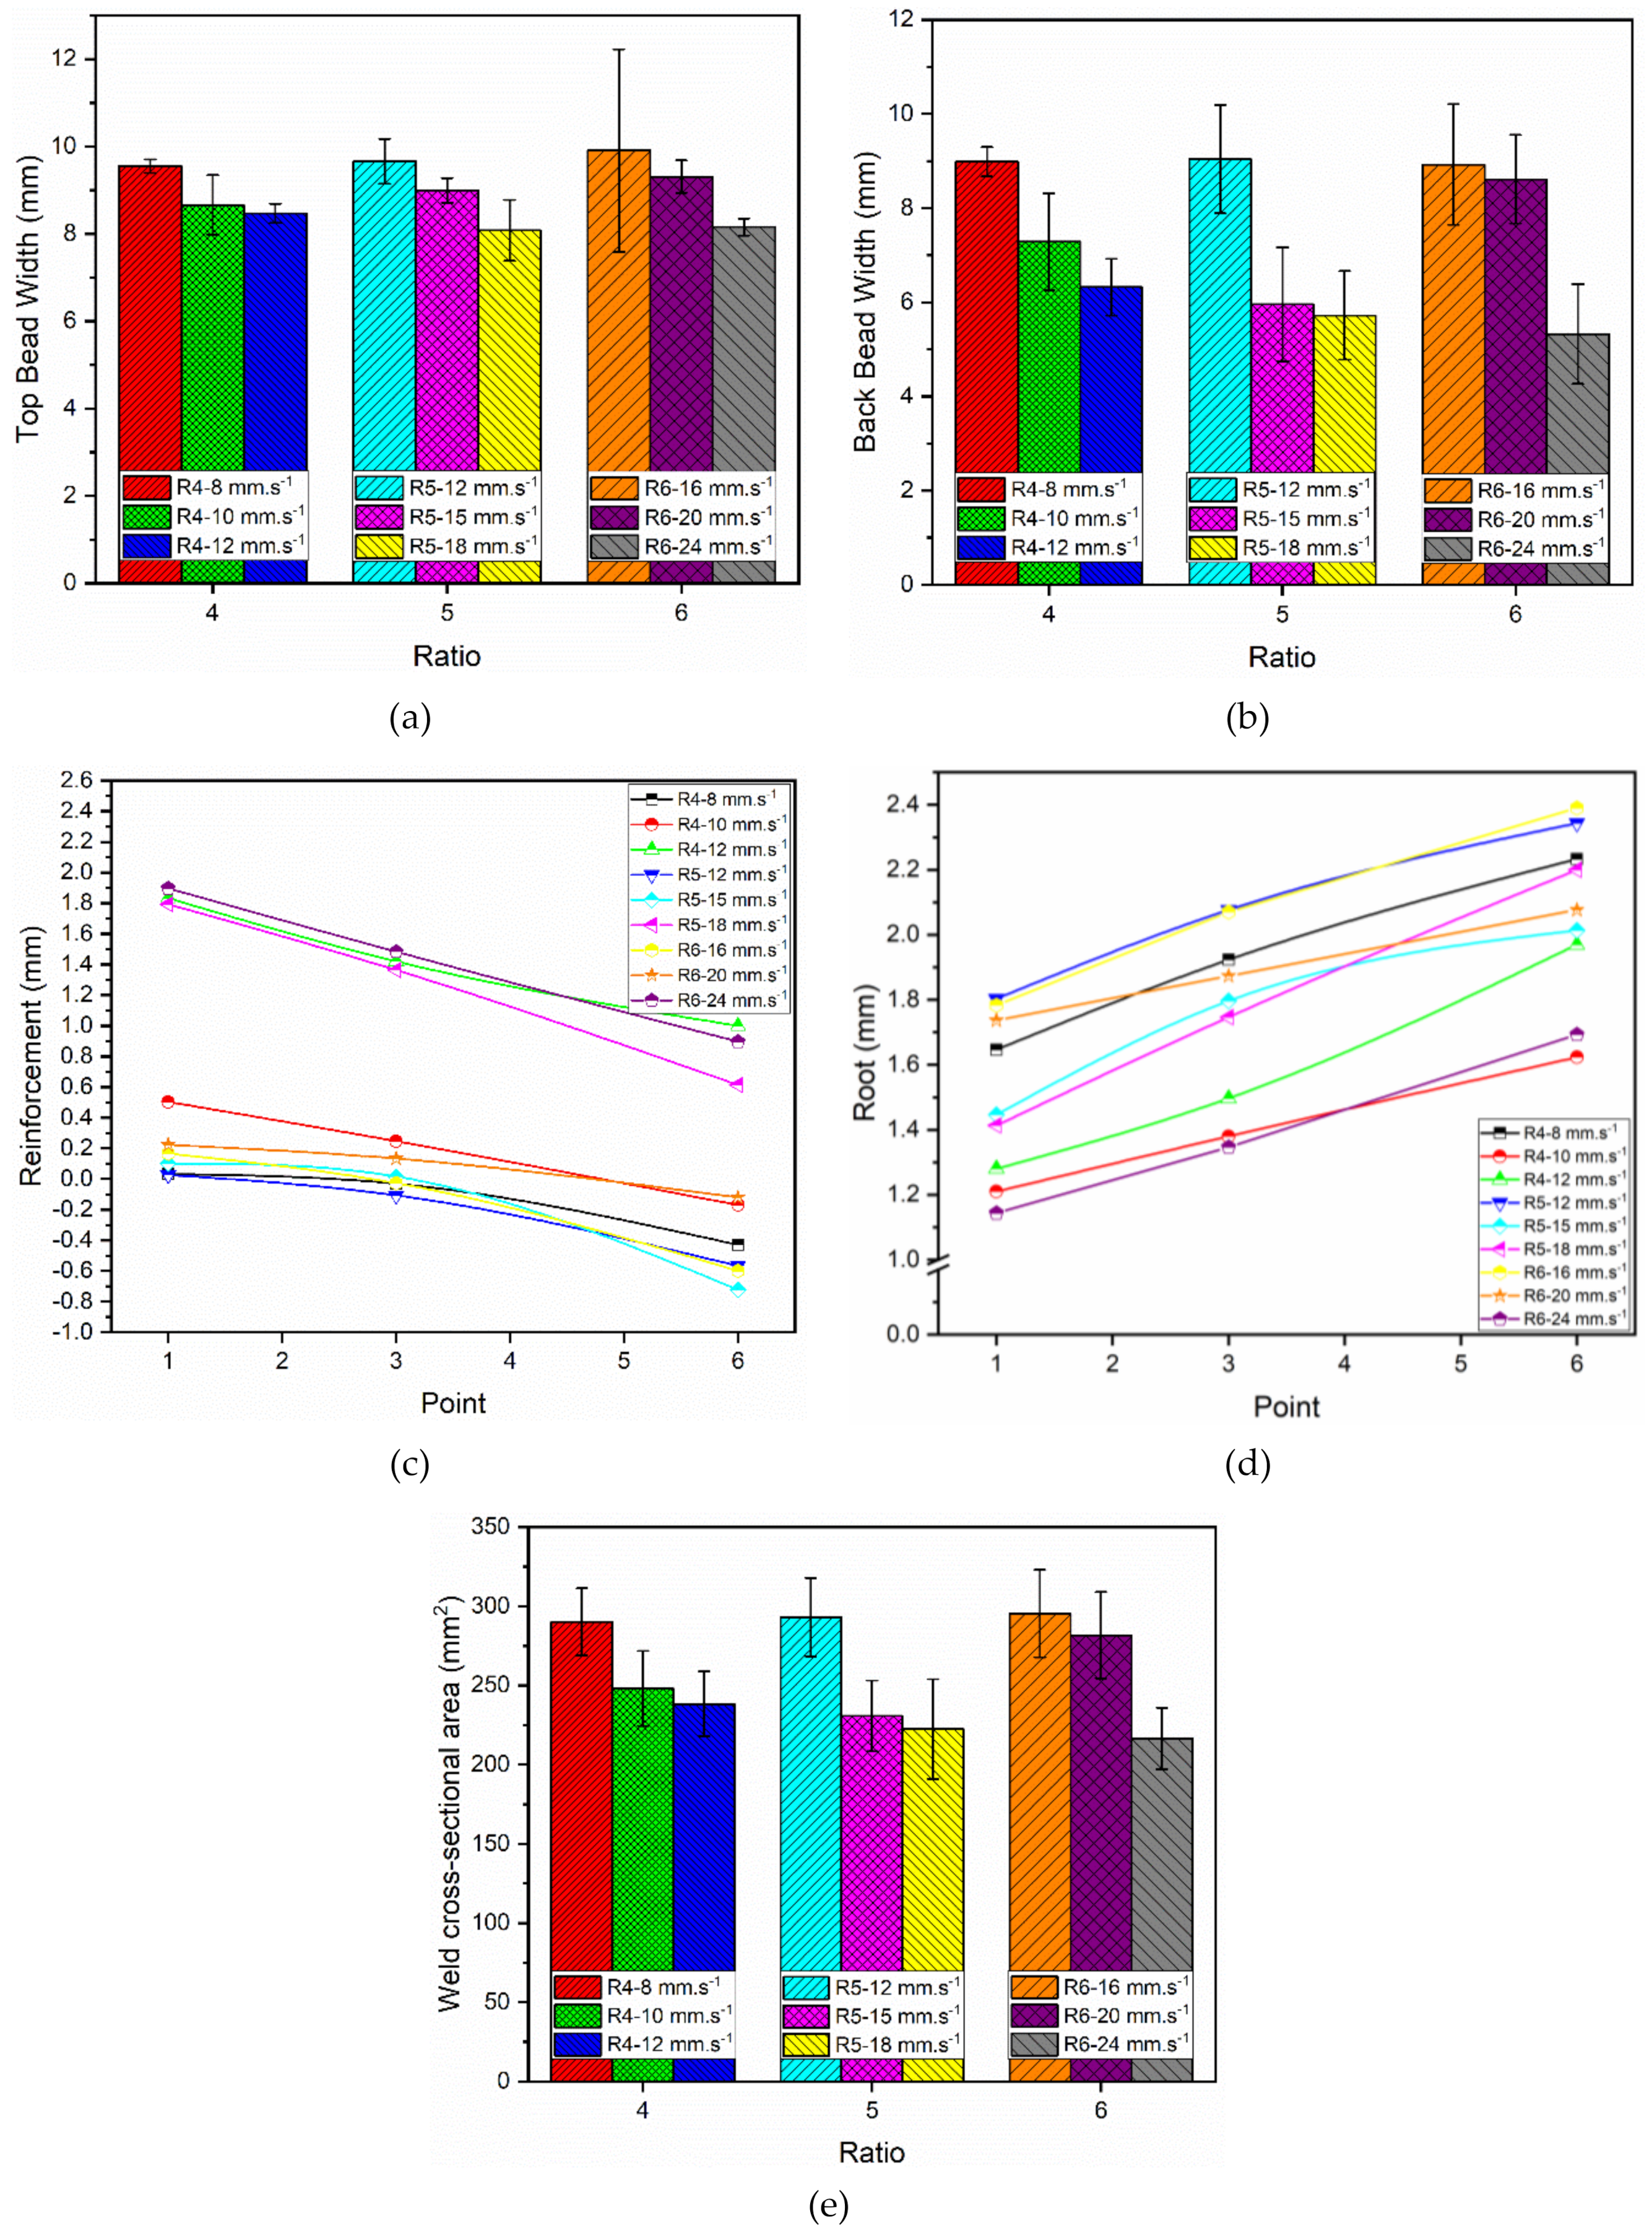
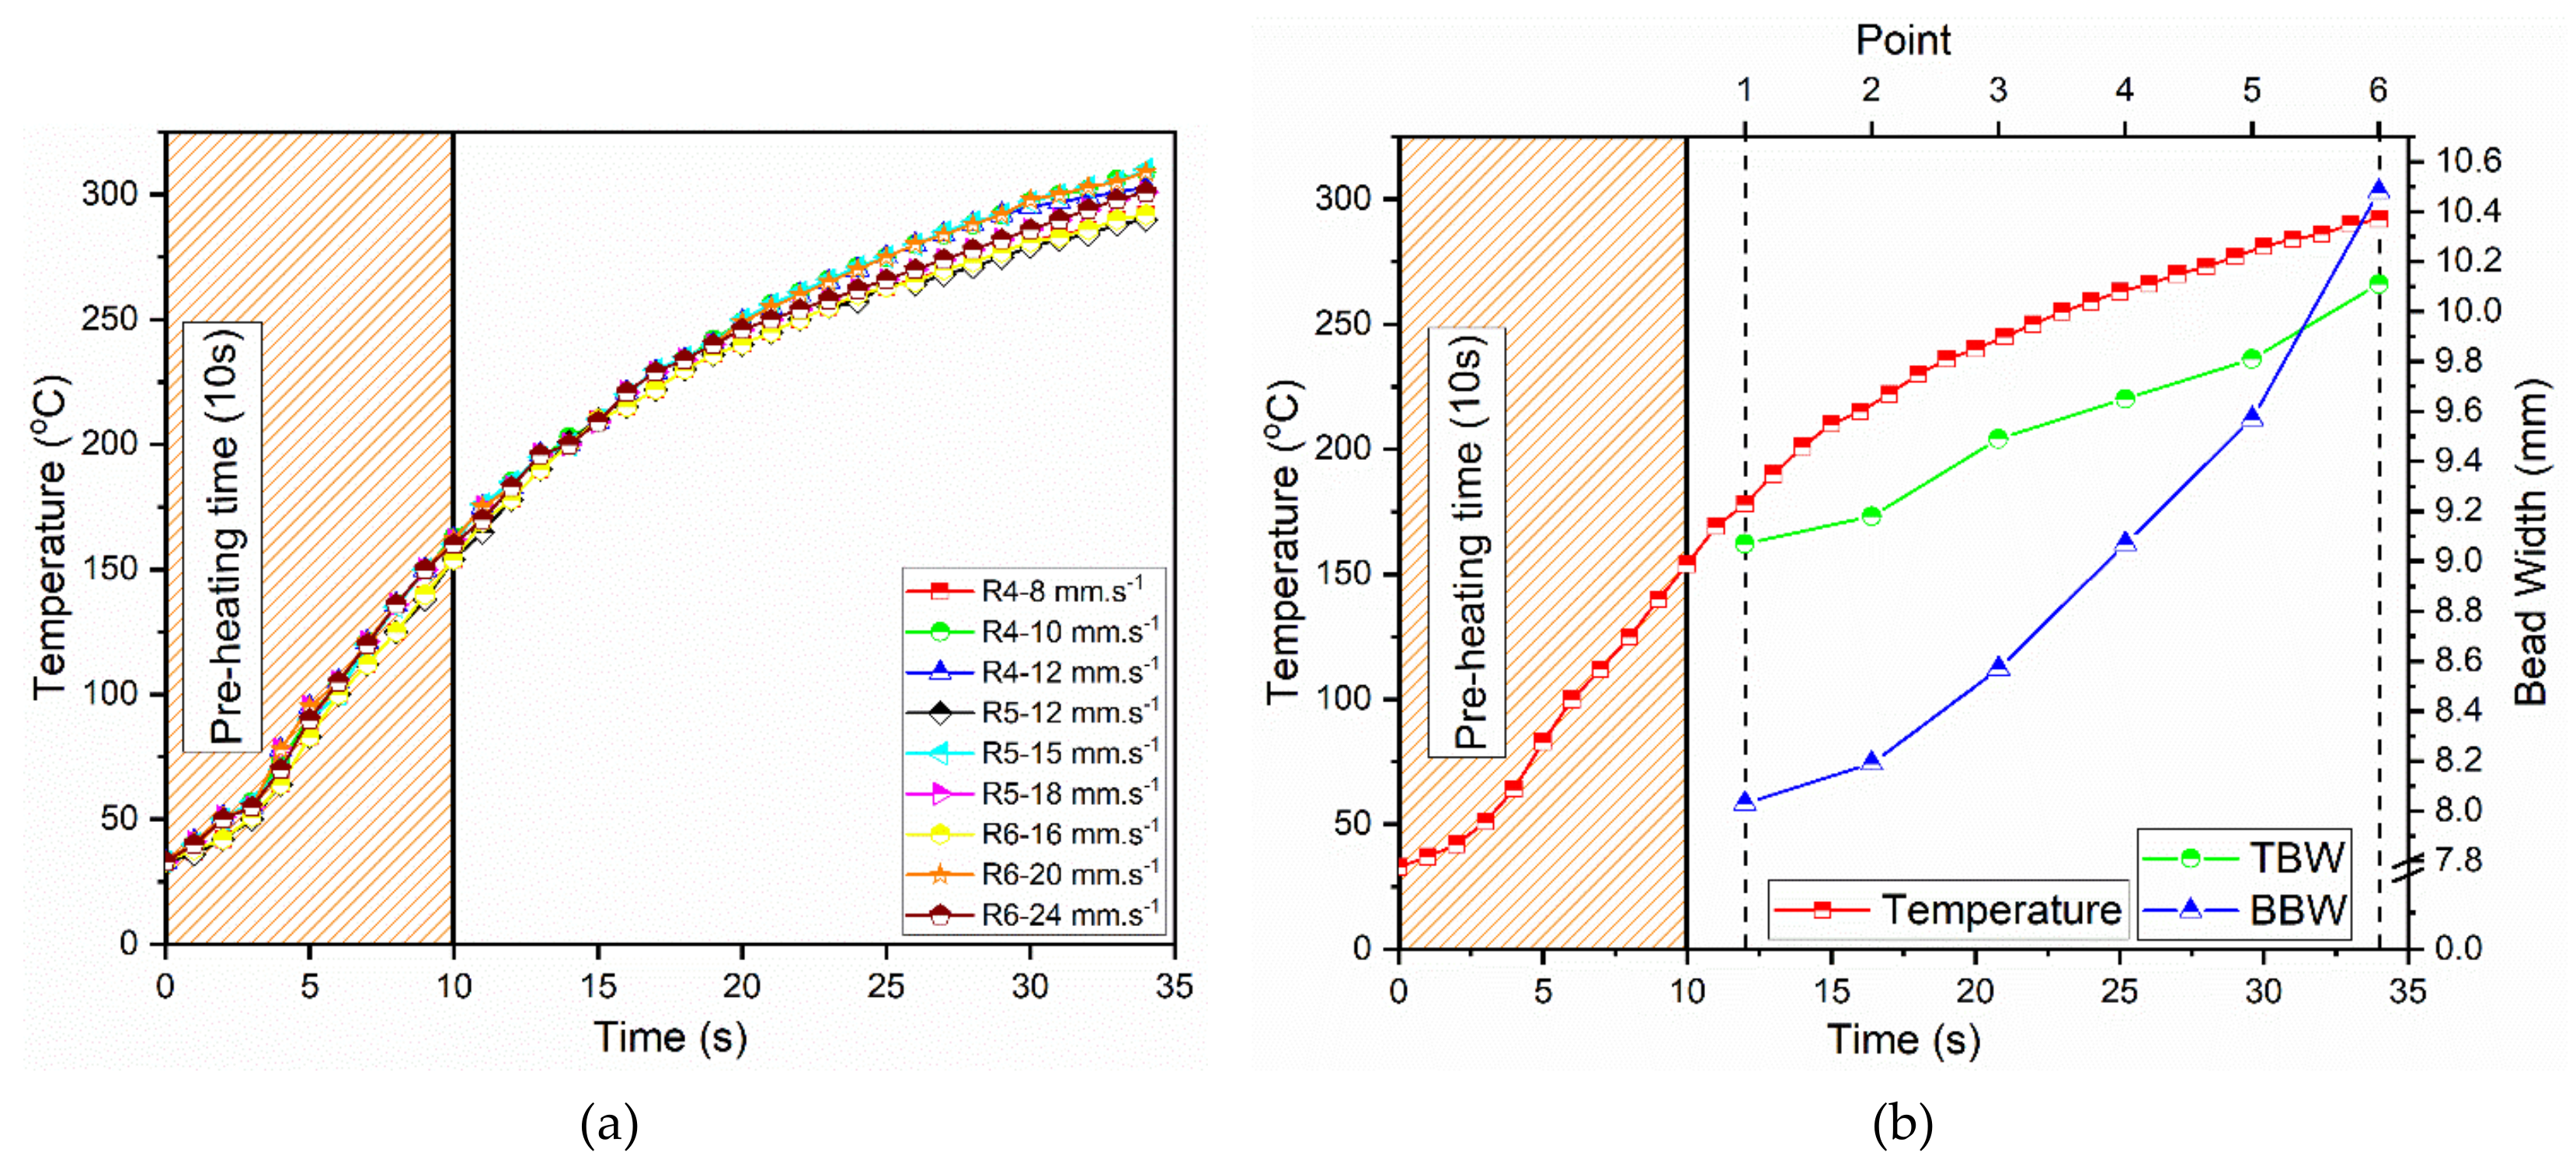
3.1. Weld Geometry

The weld geometry can be seen visually and measured. Measurement of weld geometry includes top bead width (TBW), back bead width (BBW), reinforcement depth (ReD) and root depth (RoD). Figure 4a,b show the intermittent wire feeder process’s weld surface profile in top bead width and back bead width on one of the parameters. Visually, it can be seen that the reinforcement was formed at the top of the weld is convex in shape at the start of the weld and then flat or concave at the end. From the beginning until the end of the welding process, the roots were formed with different depths.
Figure 5 shows the results of the weld geometry measurements, including the mean top bead width (Figure 5a), the mean back bead width (Figure 5b), the reinforcement depth (Figure 5c), the root depth (Figure 5d) and the weld cross-sectional area (Figure 5e). The speed of the wire feeder significantly affects the top bead width and back bead width produced. The faster it is made, the smaller the weld bead. This is because in the welding above, the given heat input is still occurring, but the amount of filler metal given is different. At the greatest speed of the feed wire, it reduces the aluminum alloy’s penetration, resulting in the width of the bead getting smaller [2,12]. Changing the variation in the feed time ratio and delay time can also affect the top and back bead width, but the effect is not significant.
In addition to measuring the width of the bead, the reinforcement and root depth were also measured. Reinforcement formed at the top of the weld tends to be different from the beginning until the end of the welding. Reinforcement can be convex (positive values) and concave (negative values). At the beginning of welding, the depth of reinforcement that is formed tends to be large (convex) and shrinks (flat or concave) at the end of welding. This is inversely proportional to the root depth at the back of the weld. At the beginning of the welding, the root depth is still small and gets bigger at the end of the welding. Increasing the speed of wire feeders can significantly affect the depth of reinforcement and root, while variations in wire feeder ratios have no significant effect. This result is because of the fixed heat input, where the filler composition is more dominant at the beginning of welding. Then, from the first point to the last point, the filler composition decreased due to heat accumulated, such that the heat input was more dominant [2].
The weld’s cross-sectional area was calculated using Equations (1)–(4) based on the weld metal’s geometric cross-section observation. Increasing the wire feeder’s speed can reduce the weld’s cross-sectional area, while the ratio variation does not significantly affect it. The deposit filler rate can be increased by increasing the wire feeder’s speed, but it must also be compensated for by the increased heat input [2]. In this study, due to the welding current and welding speed being constant, the heat input was also stable. If the wire feeder’s speed were to reduce the weld’s cross-sectional area, the reinforcement depth would be higher, and the root depth would be shallower.
Figure 6a shows the temperature history of the Heat Affected Zone (HAZ) region, where the preheating temperature for 10 s reaches 154–163 °C, while the final temperature of welding reaches 290–309 °C. The effect of ratio variation did not significantly affect the historical temperature of the HAZ region. Preheating was needed to approach the base material and wire feeder’s melting point so that it could be mixed homogeneously [12]. The temperature increase also affects TBW and BBW, as shown in Figure 6b was an example of the ratio 4 with a wire feeder speed of 8 mm.s1. The width of the weld bead from measuring point 1 to 6 increases with increasing temperature. This trend also applies to other ratio parameters.

3.2. Tensile Strength

In Figure 7, it can be seen that in general, with increasing ratio, the tensile strength also increases. The difference in UTS results occurs because the heat input is fixed, but the amount of filler metal is different so that at a large ratio, the penetration of the aluminum alloy is reduced, resulting in a lower temperature. Low temperatures result in increased tensile strength. The amount of filler in each ratio is quite different. Even for the top bead height at a ratio of 6, several fillers did not melt with the base metal. However, in the tensile strength, the UTS for each ratio differs by only ±8 MPa. Considering that the amount of filler in each ratio is quite different, the 5 MPa difference is not significant.
The difference in UTS results occurs because the heat input is fixed, but the amount of filler metal is different so that at a large ratio, the penetration of the aluminum alloy is reduced, resulting in a lower temperature [26]. Low temperature results in increased tensile strength, but the amount of filler in each ratio is quite different.
The fracture location of the tensile test is outside the weld area (see Figure 8). This proves that the joint’s strength is muscular; the mixture between the base metal and metal is more homogeneous. During welding, the base metal (BM) undergoes recrystallization. The recrystallization process on Aluminum AA6063 occurs when the Heat Affected Zone (HAZ) reaches 150 °C and continues to increase until the temperature reaches 300 °C. This process occurs where heating occurs, when the grain boundaries move away from the center and initiate the formation of new grains [27]. The fault area is in the range of 10–50 mm, as occurred in this study [28].

3.3. Microhardness

The test was carried out using the Vickers micro method by taking samples at 15 points—9 points on the horizontal axis and 6 points on the vertical axis—as illustrated in Figure 3a. Figure 9a,b show the microhardness value of the material at the vertical distribution at the center of WM and the horizontal distribution at BM, HAZ, Partially Melted Zone (PMZ) and WM, respectively. The microhardness value of the weld is influenced by the microstructure that is formed. In the PMZ area in all specimen ratios of 4, the resulting HVN value has the highest value than other points on the horizontal axis. This is due to the PMZ area, which has a finer grain structure. The same thing happened at ratio 5 and ratio 6. The ratio parameter of 5 with a speed of 15 mm.s1 produced the smallest microhardness value compared to other ratio parameters.
Analysis of the points on the vertical axis in the weld area along the WM area from top to bottom was carried out. Based on the weld hardness test results at a ratio of 4, the points on the vertical axis have HVN values that vary at each point but tend to be homogeneous. This is due to the microstructure in the WM area of the ratio 4 welds, which tends to be homogeneous, whereas in the filler metal feed ratios of 5 and 6, the highest value of HVN on the vertical axis was in the middle of WM. Then, the upper and lower areas have lower HVN values than the HVN values in the middle. This was due to the microstructure of welds in ratio 5 and ratio 6, which in the middle has a grain structure that tends to be smaller and finer than upper and lower areas. Larger and coarser grain sizes can result in reduced hardness in the weld material. The fine grain structure in the center of WM is formed due to the solidification of welds in the ratio of 5 and 6, starting from the WM center area, where the solidification rate in that area is faster than in other areas. This fast solidification rate causes the cooling rate to be fast, so the dendrite growth time is short. The resulting grain structure is more refined and relatively small in size [23].

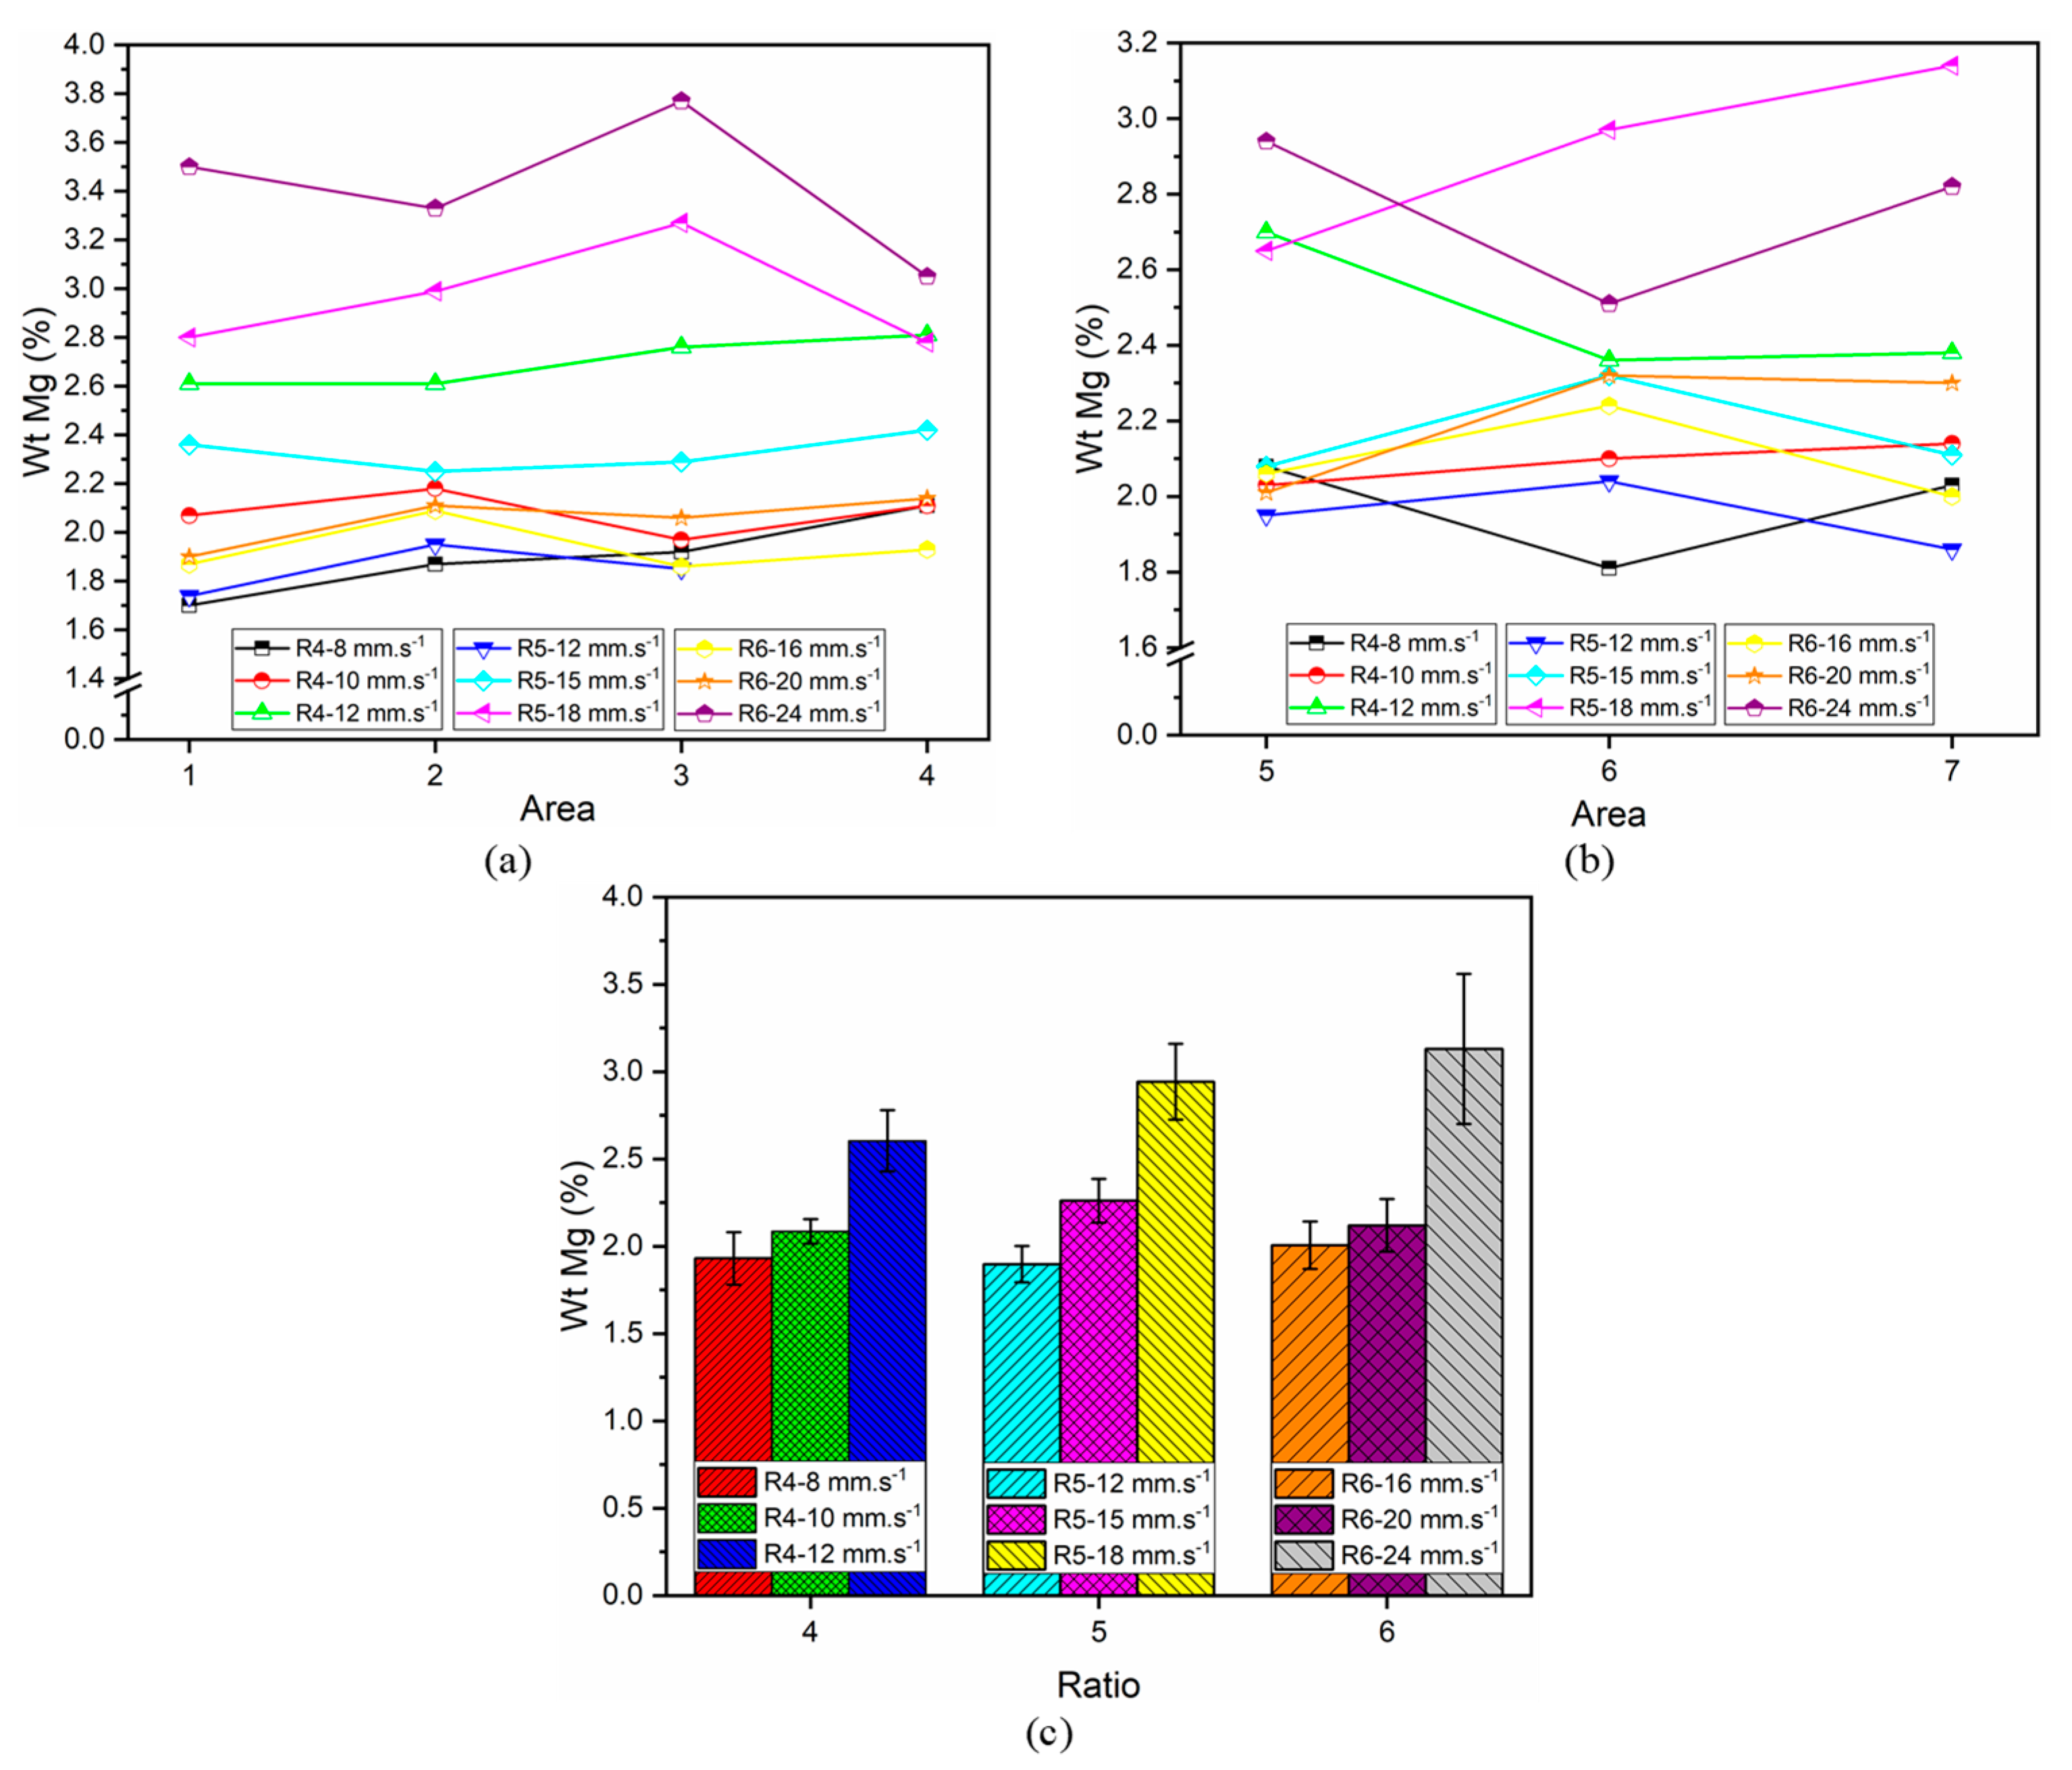
3.4. Microstructure and Chemical Composition

Microstructure testing was carried out in the Weld Metal (WM), Heat Affected Zone (HAZ) and Partially Melted Zone (PMZ) areas. Microstructure observations were carried out in four areas, upper WM (area 1), middle WM (area 2), lower WM (area 3) and WM and HAZ interfaces (area 4). Figure 10a,b show the microstructure of area 1 with a parameter code 4-a at low magnification and high magnification ratio. The microstructure in ratio 4 has a lot of porosity on the upper WM to the lower WM. Furthermore, the microstructure in area 2 can be seen in Figure 10c,d with a 5 at low and high magnification ratio. The microstructure at a ratio of 5 decreased porosity in each area of the WM.
Meanwhile, the microstructure at the ratio of 6 can be seen in Figure 10e,f in area 3 with low and high magnification. The results show that the porosity in WM at a ratio of 6 was the least compared to at the other ratios. Figure 10g,h show the microstructure interface between WM and HAZ at a ratio of 4. This figure also shows the boundary between the WM and HAZ regions, commonly called fusion lines. Furthermore, in this area, there is a PMZ area that tends to have a high microhardness value. This porosity occurs because of the difference in temperature between the variation in the wire feeder ratio and the wire feeder’s speed [12]. Based on the test on all specimens of each ratio, in the PMZ area, it is seen that a columnar structure is formed near the fusion line that leads to the middle area of the WM. In the PMZ area with the longer filler feeding time, 0.75 s, the porosity was relatively smaller. Apart from that, equiaxed grains were also visible, leading to the middle area of the WM. The grain size in the HAZ area near the fusion line that formed was relatively bigger as it pointed to the WM area. This is because the larger hot WM area from the area’s welding process affects the microstructure [23]. Based on research by Ario S. et al. [2], the area closer to the welding area receives higher heat so that partial melting occurs, causing cavitation shrinkage and forming fusion lines.
The welded specimens with filler metal feeding ratio 4 have a microstructure that tends to be homogeneous throughout the WM area. The heat input for each weld has the same value. However, due to the difference in length of the filler metal being fed, the feeder metal volume will also be different. In ratio 4, the volume of filler metal provided has the smallest value compared to the other two ratios. This causes the heat density to be received in the weld area with a ratio of 4 to be higher than the different two ratios. This high heat density can cause the heat throughout the WM to be evenly distributed. This even heat will cause solidification, which tends to be homogeneous throughout the WM. This resulted in the microstructure that was formed in the WM area with a ratio of 4, which tended to be in the form of equiaxed grains.
Visually, the welding results with a filler metal feed ratio of 5 have a weld bead that is almost flat with the two metals being joined. At a ratio of 5, the heat density received by the plate is lower than at a ratio of 4. This causes a smaller part between the two plates to melt, and the filler metal will melt in the middle. This causes the solidification rate to start from the middle or center WM and then spread towards the upper and lower WM. The lower solidification time in the WM area causes the cooling rate in the middle WM area to be faster so that the dendrite growth rate will decrease. As a result, a relatively small and fine-grain structure is formed in the WM middle area. Meanwhile, in the lower and upper areas, due to the longer solidification rate, there is sufficient time for the dendrites to grow, so the grain structure formed tends to be bigger and coarser [29].
The energy dispersive spectometer (EDS) test was carried out to determine the magnesium content after the welding process in 7 areas (4 areas on the horizontal axis and 3 areas on the vertical axis). The results of the test were then plotted according to Figure 11a–c. Based on the results above, it can be seen that increasing the speed of the wire feeder at one of the ratios will have a significant effect on the content of %Wt Mg. Meanwhile, varying the ratio of wire feeders had little impact on the content of %Wt Mg. On the horizontal axis of the increase in %Wt Mg content in area 1 until area 4, there was no upward or downward trend, but it can be seen that in area 3, there tends to be an increase in the %Wt Mg content at the highest. This also applies to testing the vertical axis. Figure 11c shows the average weight content of magnesium in seven areas for all parameters. From this figure, it is clear that magnesium’s weight content increases if the wire feeder speed is increased or the wire feeder ratio is varied. This shows that the mixture between the base material and the added metal is mixed homogeneously in the weld area in each area tested [25].

4. Conclusions

In general, weld geometry consists of the bead’s width, the reinforcement or root’s depth and the weld’s cross-sectional area. Wire feed speed has a greater effect on bead width than the length ratio of the wire feeder. The largest decrease in bead width was 17.66% and 40.33% for top bead width (TBW) and back bead width (BBW), respectively. Reinforcement formed at the beginning of welding has a convexity profile, then at the end of the welding will have a concavity profile on the top weld except for parameter codes 4-c, 5-c, and 6-c. Meanwhile, the bottom profile has a root that widens at the end of the weld. The largest and smallest weld cross-sectional areas in the ratio of 6 were 295.37 ± 27.60 mm2 and 216.53 ± 19.37 mm2, respectively. The wire feeder’s length ratio is directly proportional to the tensile strength, but the difference is not significant, only around ±8 MPa. For each ratio, the filler speed is directly proportional to the tensile strength, but the difference is very slight. The feeding length ratio of filler metal will affect the microstructure formed in the TIG welding process. The microstructure was observed in the four areas of weld metal (WM), heat affected zone (HAZ) and partially melted zone (PMZ). At a ratio of 4, the solidification rate tends to be homogeneous in all areas, so the grain structure formed tends to be equiaxed. At a ratio of 5, the solidification rate tends to start from the center of the WM, so the grain structure formed tends to be refined and small at the center of the WM and tends to be large and coarse in the upper and lower WM. At a ratio of 6, the solidification rate tends to start from the upper part of the WM, so the grains formed tend to be refined and small in the upper WM and tend to be large and coarse in the center and lower WM. Increasing the wire feed speed or varying the feed length ratio of the filler metal can increase magnesium’s weight content in the WM area. In addition, the weight content of magnesium in the entire WM area tends to be homogeneous.

Author Contributions

Conceptualization, M.A.A. and A.S.B.; methodology, M.A.A.; software, A.W.; validation, M.A.A. and A.S.B.; formal analysis, Y.A. and S.P.D.S.; investigation, M.A.A.; resources, A.S.B.; data curation, Y.A. and S.P.D.S.; writing—original draft preparation, A.W.; writing—review and editing, A.W. and A.S.B.; visualization, A.W.; supervision, A.S.B.; project administration, A.W.; funding acquisition, A.S.B. All authors have read and agreed to the published version of the manuscript.

Funding

This research was funded by the Ministry of Higher Education of Indonesia, grant number NKB-2837/UN2.RST/HKP.05.00/2020.

Institutional Review Board Statement

Not applicable.

Informed Consent Statement

Not applicable.

Data Availability Statement

Not applicaple.

Acknowledgments

The authors would like to express their sincere gratitude for the financial support from PDUPT Kemenristek/BRIN 2020 with contract number NKB-2837/UN2.RST/HKP.05.00/2020.

Conflicts of Interest

The authors declare no conflict of interest.

References

  1. Manti, R.; Dwivedi, D.K.; Agarwal, A. Microstructure and hardness of Al-Mg-Si weldments produced by pulse GTA welding. Int. J. Adv. Manuf. Technol. 2008, 36, 263–269. [Google Scholar] [CrossRef]
  2. Baskoro, A.S.; Amat, M.A.; Pratama, A.I.; Kiswanto, G.; Winarto, W. Effects of tungsten inert gas (TIG) welding parameters on macrostructure, microstructure, and mechanical properties of AA6063-T5 using the controlled intermittent wire feeding method. Int. J. Adv. Manuf. Technol. 2019, 105, 2237–2251. [Google Scholar] [CrossRef]
  3. Li, H.; Zou, J.; Yao, J.; Peng, H. The effect of TIG welding techniques on microstructure, properties and porosity of the welded joint of 2219 aluminum alloy. J. Alloys Compd. 2017, 727, 531–539. [Google Scholar] [CrossRef]
  4. Trdan, U.; Žagar, S.; Grum, J.; Ocan, J.L. Surface modification of laser-and shot-peened 6082 aluminium alloy: Laser peening effect to pitting corrosion. Int. J. Struct. Integr. 2011, 2, 9–21. [Google Scholar] [CrossRef]
  5. Sivashanmugam, M.; Kumar, T.; Sathishkumar, M. Investigation of microstructure and mechanical properties of GTAW and GMAW joints on AA7075 aluminum alloy. In Proceedings of the Frontiers in Automobile and Mechanical Engineering 2010, Chennai, India, 25–27 November 2010. [Google Scholar]
  6. Lakshminarayanan, A.K.; Balasubramanian, V.; Elangovan, K. Effect of welding processes on tensile properties of AA6061 aluminium alloy joints. Int. J. Adv. Manuf. Technol. 2009, 40, 286–296. [Google Scholar] [CrossRef]
  7. Dhakal, B.; Swaroop, S. Effect of laser shock peening on mechanical and microstructural aspects of 6061-T6 aluminum alloy. J. Mater. Process. Technol. 2020, 282, 116640. [Google Scholar] [CrossRef]
  8. Tušek, J.; Klobčar, D. Tungsten inert gas (TIG) welding of aluminum alloy EN AW-AlZn5. 5MgCu. Metalurgija 2016, 55, 737–740. [Google Scholar]
  9. Widyianto, A.; Baskoro, A.S.; Kiswanto, G. Mechanical Properties and Microstructure of Pulsatile Current Gas Tungsten Arc Welding (PC-GTAW) of AISI 304L Butt Joint Weld. Mater. Sci. Forum 2020, 1000, 339–347. [Google Scholar] [CrossRef]
  10. Manti, R.; Dwivedi, D.K.; Agarwal, A. Pulse TIG welding of two Al-Mg-Si alloys. J. Mater. Eng. Perform. 2008, 17, 667–673. [Google Scholar] [CrossRef]
  11. Eisazadeh, H.; Haines, D.J.; Torabizadeh, M. Effects of gravity on mechanical properties of GTA welded joints. J. Mater. Process. Technol. 2014, 214, 1136–1142. [Google Scholar] [CrossRef]
  12. Baskoro, S.; Amat, A.; Putra, D.; Widyianto, A.; Abrara, Y. Investigation of Temperature History, Porosity and Fracture Mode on AA1100 Using the Controlled Intermittent Wire Feeder Method. Evergreen 2020, 7, 86–91. [Google Scholar] [CrossRef]
  13. Geng, H.; Li, J.; Xiong, J.; Lin, X.; Huang, D.; Zhang, F. Formation and improvement of surface waviness for additive manufacturing 5A06 aluminium alloy component with GTAW system. Rapid Prototyp. J. 2018, 24, 342–350. [Google Scholar] [CrossRef]
  14. Ahmad, I.; Arya, S. To Study the Micro-Structural of Aluminum Alloy AA-6061 Welded Using TIG Welding Process at Different Welding Current. Int. Res. J. Eng. Technol. 2018, 5, 395–403. [Google Scholar]
  15. Geng, H.; Li, J.; Xiong, J.; Lin, X.; Zhang, F. Optimization of wire feed for GTAW based additive manufacturing. J. Mater. Process. Technol. 2017, 243, 40–47. [Google Scholar] [CrossRef]
  16. Bai, J.Y.; Yang, C.L.; Lin, S.B.; Dong, B.L.; Fan, C.L. Mechanical properties of 2219-Al components produced by additive manufacturing with TIG. Int. J. Adv. Manuf. Technol. 2016, 86, 479–485. [Google Scholar] [CrossRef]
  17. Geng, H.; Li, J.; Xiong, J.; Lin, X.; Zhang, F. Geometric limitation and tensile properties of wire and arc additive manufacturing 5A06 aluminum alloy parts. J. Mater. Eng. Perform. 2017, 26, 621–629. [Google Scholar] [CrossRef] [Green Version]
  18. Gu, J.; Cong, B.; Ding, J.; Williams, S.W.; Zhai, Y. Wire+ Arc Additive Manufacturing of Aluminium. In Proceedings of the 25th Annual International Solid Freeform Fabrication Symposium, Austin, TX, USA, 4–6 August 2014; Available online: http://utw10945.utweb.utexas.edu/sites/default/files/2014-038-Gu.pdf (accessed on 15 October 2020).
  19. Sun, R.; Li, L.; Zhu, Y.; Guo, W.; Peng, P.; Cong, B.; Sun, J.; Che, Z.; Li, B.; Guo, C. Microstructure, residual stress and tensile properties control of wire-arc additive manufactured 2319 aluminum alloy with laser shock peening. J. Alloys Compd. 2018, 747, 255–265. [Google Scholar] [CrossRef]
  20. Zhang, C.; Gao, M.; Zeng, X. Workpiece vibration augmented wire arc additive manufacturing of high strength aluminum alloy. J. Mater. Process. Technol. 2019, 271, 85–92. [Google Scholar] [CrossRef]
  21. Wu, B.; Pan, Z.; Ding, D.; Cuiuri, D.; Li, H.; Xu, J.; Norrish, J. A review of the wire arc additive manufacturing of metals: Properties, defects and quality improvement. J. Manuf. Process. 2018, 35, 127–139. [Google Scholar] [CrossRef]
  22. Narayanan, A.; Mathew, C.; Baby, V.Y.; Joseph, J. Influence of gas tungsten arc welding parameters in aluminium 5083 alloy. Int. J. Eng. Sci. Innov. Technol. 2013, 2, 269–277. [Google Scholar]
  23. Nie, J.; Li, S.; Zhong, H.; Hu, C.; Lin, X.; Chen, J.; Guan, R. Microstructure and Mechanical Properties of Laser Welded 6061-T6 Aluminum Alloy under High Strain Rates. Metals 2020, 10, 1145. [Google Scholar] [CrossRef]
  24. Hsu, C.-H. Process Performance Analysis and Improvement for the Manufacture of 6063 Aluminum Alloy. Metals 2020, 10, 605. [Google Scholar] [CrossRef]
  25. Elangovan, K.; Balasubramanian, V. Influences of post-weld heat treatment on tensile properties of friction stir-welded AA6061 aluminum alloy joints. Mater. Charact. 2008, 59, 1168–1177. [Google Scholar] [CrossRef]
  26. Guzmán, I.; Granda, E.; Acevedo, J.; Martínez, A.; Dávila, Y.; Velázquez, R. Comparative in Mechanical Behavior of 6061 Aluminum Alloy Welded by Pulsed GMAW with Different Filler Metals and Heat Treatments. Materials 2019, 12, 4157. [Google Scholar]
  27. Naumov, A.; Morozova, I.; Rylkov, E.; Obrosov, A.; Isupov, F.; Michailov, V.; Rudskoy, A. Metallurgical and Mechanical Characterization of High-Speed Friction Stir Welded AA 6082-T6 Aluminum Alloy. Materials 2019, 12, 4211. [Google Scholar] [CrossRef] [PubMed] [Green Version]
  28. Mathers, G. The Welding of Aluminium and Its Alloys; Woodhead Publishing: Cambridge, UK, 2002. [Google Scholar]
  29. Zhou, H.; Fu, F.; Dai, Z.; Qiao, Y.; Chen, J.; Liu, W. Effect of Laser Power on Microstructure and Micro-Galvanic Corrosion Behavior of a 6061-T6 Aluminum Alloy Welding Joints. Metals 2021, 11, 3. [Google Scholar]
Figure 1. The weldability of aluminum and its alloys [8].
Metals 11 00316 g001
Figure 2. Schematic illustration of (a) cycle time, feed time and delay time; (b) bead width measurement, thermocouple arrangement; and (c) cross-section weld metal area.
Metals 11 00316 g002
Figure 3. Schematic illustration of (a) microhardness test (b) location of microstructure and (c) location of energy dispersive spectometer (EDS) test.
Metals 11 00316 g003
Figure 4. The weld surface profile of continuous wire filling process (a) top bead width and (b) back bead width.
Metals 11 00316 g004
Figure 5. Weld geometry on a various ratio of wire feeder and wire feeder speed: (a) top bead width, (b) back bead width, (c) reinforcement depth, (d) root depth and (e) weld cross-sectional area.
Metals 11 00316 g005
Figure 6. (a) Temperature histories at Heat Affected Zone (HAZ) region, and (b) temperature history vs. top bead width (TBW) and back bead width (BBW) at R4-8 mm·s1.
Metals 11 00316 g006
Figure 7. Ultimate tensile strength (UTS) is plotted in different ratios.
Metals 11 00316 g007
Figure 8. Fracture location of specimens at (a) R4-8 mm·s−1, (b) R5-12 mm·s1 and (c) R6-16 mm·s1.
Metals 11 00316 g008
Figure 9. (a) Microhardness value of weld metal (WM) in vertical distribution across the center of WM from top bead to back bead and (b) microhardness value of horizontal distribution across the area of base metal (BM), HAZ, Partially Melted Zone (PMZ) and WM.
Metals 11 00316 g009
Figure 10. The microstructure of (a,b) area 1 with parameter code 4-a in low magnification and high magnification, (c,d) area 2 with parameter code 5-a in low magnification and high magnification, (e,f) area 3 with parameter code 6-a in low magnification and high magnification and (g,h) area 4 with parameter code 4-a in low magnification and high magnification.
Metals 11 00316 g010
Figure 11. Wt. (%) Mg on all variations of parameters: (a) the horizontal axis, (b) the vertical axis and (c) the average.
Metals 11 00316 g011
Table 1. Ratio parameter of the intermittent wire feeder.
RatioParameter CodeWire Feeder Speed
(mm·s−1)
Feeding Time
(s)
Delay Time
(s)
Cycle Time
(s)
Welding Speed
(mm·s−1)
Welding Current
(A)
44-a80.750.2511.5115
4-b100.750.25
4-c120.750.25
55-a120.50.5
5-b150.50.5
5-c180.50.5
66-a160.3750.625
6-b200.3750.625
6-c240.3750.625
Table 2. Chemical composition of AA6063 and filler ER-5356 (wt %).
AA6063FeSiMnCuMgCrZnTiOthersAl
0.3050.4660.0240.031.040.0070.0260.0120.13Bal.
ER-5356FeSiMnCuMgCrZnTiOthersAl
<0.4<0.250.05–0.2<0.14.5–5.00.05–0.2<0.10.06–0.20.05–0.15Bal.
Publisher’s Note: MDPI stays neutral with regard to jurisdictional claims in published maps and institutional affiliations.

